

Abstract
Objective
The aim of this study is to identify single-nucleotide polymorphisms (SNPs) influencing blood pressure (BP) response to the β-blocker atenolol.
Methods
Genome-wide association analysis of BP response to atenolol monotherapy was performed in 233 white participants with uncomplicated hypertension in the pharmacogenomic evaluation of antihypertensive responses study. Forty-two polymorphisms with P less than 10−5 for association with either diastolic or systolic response to atenolol monotherapy were validated in four independent groups of hypertensive individuals (total n = 2114).
Results
In whites, two polymorphisms near the gene PTPRD (rs12346562 and rs1104514) were associated with DBP response to atenolol (P = 3.2 × 10⁻⁶ and P = 5.9 × 10⁻⁶, respectively) with directionally opposite association for response to hydrochlorothiazide in another group of 228 whites (P = 0.0018 and P = 0.00012). A different polymorphism (rs10739150) near PTPRD was associated with response to atenolol in 150 black hypertensive individuals (P = 8.25 ×10⁻⁶). rs12346562 had a similar trend in association with response to bisoprolol (a different β-blocker) in 207 Finnish men in the genetics of drug responsiveness in essential hypertension study. In addition, an intronic single-nucleotide polymorphism (rs4742610) in the PTPRD gene was associated with resistant hypertension in whites and Hispanics in the international verapamil SR trandolapril study (meta-analysis P = 3.2 × 10⁻⁵).
Conclusion
PTPRD was identified as a novel locus potentially associated with BP response to atenolol and resistant hypertension in multiple ethnic groups.
Keywords: atenolol, blood pressure response, genome-wide association study, pharmacogenomic evaluation of antihypertensive responses, pharmacogenomics, PTPRD, resistant hypertension
INTRODUCTION
Hypertension is the leading risk factor for global disease burden according to the Global Burden of Disease Study of 2010 [1]. At present, more than one in three adults worldwide have hypertension, and the number is expected to increase to 1.56 billion by 2025 [2]. Hypertension substantially increases risk for stroke, coronary heart disease, renal failure, and heart failure, and is the most common chronic disease for which medications are prescribed [3]. Considerable interindividual variability has been documented in blood pressure (BP) response to all classes of antihypertensive drugs [4,5]. Current selection of the initial antihypertensive therapy for uncomplicated hypertension individuals is essentially by trial and error. The difficulty in determining the most appropriate antihypertensive drug for a specific patient likely contributes to the fact that only approximately 50% of the treated hypertensive patients in the United States have their BP controlled [3], with similar percentages globally. Pharmacogenomics, which utilizes genetic information to predict drug response, has the potential to provide an approach for individualizing antihypertensive drug selection, which could lead to better BP control and improve the outcomes of those with hypertension.
Despite the decreasing popularity of atenolol as a firstline antihypertensive drug in those with uncomplicated hypertension, β-blockers still account for more than 160 million prescriptions per year [6] and are still consistently reported to be among the top 10 prescribed drug classes [7]. Among all individuals in the United States over age 65, approximately 32% are prescribed a β-blocker [8]. β-blockers are also standard-of-care treatment for individuals with heart failure or postmyocardial infarction based on evidence that they reduce morbidity and mortality in these populations [9–11].
Our goal was to identify single-nucleotide polymorphisms (SNPs) and/or genes that are associated with BP response to atenolol. We hypothesized that SNPs/genes with a true association with drug response will have similar associations across different race/ethnicity groups and across different drugs in the same class. Similarly, related phenotypes such as resistant hypertension (RHTN) would also be expected to be influenced by genes that lead to good or poor antihypertensive response. It has been recognized that β-blockers and thiazide diuretics lower BP through opposite mechanisms: β-blockers inhibit the rennin–angiotensin system (RAS) whereas thiazide diuretics stimulate RAS. We reason that it is important to identify SNPs with directionally opposite effects on BP responses to β-blockers and thiazide diuretics in order to individualize antihypertensive therapy based on specific individual genotypes. In this analysis, we focused on identifying genes that are associated with BP response to atenolol, using data on atenolol monotherapy responses in whites as the discovery cohort. As there are limited numbers of datasets globally with β-blocker response and genome-wide association analysis data, we sought to validate our findings through testing BP response to atenolol in blacks, directionally opposite associations with BP response to hydrochlorothiazide (HCTZ), validation in other cohorts of whites treated with a different β-blocker, and RHTN in hypertensive patients with coronary artery disease (CAD).
MATERIALS/PARTICIPANTS AND METHODS
Pharmacogenomic Evaluation of Antihypertensive Responses study
The Pharmacogenomic Evaluation of Antihypertensive Responses (PEAR) study (clinicaltrials.gov identifier NCT00246519) was a randomized controlled clinical trial evaluating genetic determinants of BP responses to atenolol and HCTZ monotherapy and in combination [12]. This study was approved by the institutional review board at each clinical site. The details of the PEAR study are presented in the Supplemental materials, http://links.lww.com/HJH/A516. Briefly, PEAR recruited individuals with uncomplicated hypertension who were randomized to either monotherapy of atenolol 50 mg daily or HCTZ 12.5 mg daily for 3 weeks, followed by dose titration to 100 and 25 mg daily, and then the combination therapy. BP and metabolic responses to monotherapy and combination therapy were assessed after an average of 9 weeks of antihypertensive treatment. BP was measured using three different methods: home, office, and ambulatory [12]. For this analysis, a composite weighted average of the office, home, and ambulatory daytime and night-time BP responses was calculated based on the row sums of the inverse of the intermethod covariance matrices [13]. This weighted average BP had higher signal-to-noise ratio and therefore provides the best power to detect differences compared with any single measurement of BP phenotypes [13].
Genomic DNA from PEAR participants was genotyped using the Illumina Human Omni1MQuad BeadChip (Illumina, San Diego, California, USA). The detailed quality control procedures are described in the Supplemental materials (http://links.lww.com/HJH/A516). This analysis focused on the 461 participants who were genetically identified as whites and were treated either with atenolol (n = 233) or HCTZ (n = 228) monotherapy, and the 150 participants who were genetically confirmed as blacks who were treated with atenolol monotherapy.
Genetics of drug responsiveness study
The genetics of drug responsiveness in essential hypertension study (GENRES) was a randomized, double-blind, crossover, placebo-controlled trial in 313 moderately hypertensive Finnish men, aged between 35 and 60 years, measuring BP response to antihypertensive agents [14]. Each study participant received bisoprolol 5 mg, losartan 50 mg, HCTZ 25 mg, and amlodipine 5 mg daily, each as monotherapy for 4 weeks. Twenty-four-hour ambulatory BP phenotype was used for this analysis as it represented the best single BP phenotype for this study and was available in 208 patients treated with bisoprolol therapy. A total of 207 participants were successfully genotyped using the Illumina HumanOmniExpress-12 BeadChip (Illumina, San Diego, California, USA).
INternational VErapamil-SR Trandolapril Study Genetic Substudy
INternational VErapamil-SR Trandolapril Study Genetic Substudy (INVEST-GENES) collected DNA samples from 5979 INVEST study participants (clinicaltrials.gov identifier: NCT00133692) [15]. INVEST recruited hypertensive individuals with clinically stable CAD who were randomly assigned to an atenolol-based β-blocker strategy or verapamil-SR-based calcium channel blocker strategy. HCTZ and trandolapril were added as needed to achieve BP control or end-organ protection in a protocol-defined manner. As previously reported, RHTN in INVEST was defined as BP of at least 140/90 mmHg despite use of at least three antihypertensive agents, or treatment with four or more antihypertensive agents regardless of BP [16,17]. Owing to recent controversy over whether or not diuretics use should be included in the RHTN definition, we have done sensitivity analysis to include the diuretic use in the RHTN definition and found the same results [17]. Participants without RHTN were defined as controlled hypertensive participants (BP < 140/90 mmHg) and prescribed zero to three antihypertensive medications. Those who were uncontrolled (BP ≥ 140/90 mmHg), but on less than three antihypertensive medications, were excluded from the analysis. INVEST-GENES samples were genotyped on the Illumina OmniExpressExome chip. This analysis included 1529 samples that passed quality control including 657 whites, 537 Hispanics, and 155 blacks.
Statistical analysis
Continuous variables were presented as means and standard deviations and categorical variables were presented as numbers and percentages. In the 233 PEAR white participants assigned to atenolol monotherapy, associations of the 1 387 466 SNPs with BP response were evaluated using multiple linear regression that adjusted for baseline BP, age, sex, and the first two principal components for ancestry. The additive mode of inheritance was assumed, wherein the SNPs were coded as 0, 1, and 2 in the linear regression model. SNPs with P less than 5 × 10⁻⁸ were considered genome-wide significant and those with P less than 10−5 were considered suggestive.
To validate the suggestive SNPs associated with BP response to atenolol in PEAR white participants, we assessed the association of these SNPs and BP response in PEAR black participants treated with atenolol monotherapy (n = 150). We tested not only the exact SNPs but also the SNPs in the neighboring regions. Owing to the difference in linkage disequilibrium between white and black populations, we do not necessarily expect the exact SNPs to be significant, but rather the SNPs in the same genetic regions to show a signal if the region harbors a true signal. We considered SNPs with P less than 10−5 for either SBP or DBP response in black participants that are in the same region (up to 2 Mb on either side of the gene) of the white suggestive SNPs, to be significant.
The SNPs/genes that passed the first validation step were evaluated in the following three independent samples: first, an independent group of 228 PEAR white participants treated with HCTZ monotherapy. The SNPs associated with HCTZ response with P values less than 0.05/# of SNPs tested with β-coefficient of opposite direction of atenolol would be considered significant. Second, BP responses to bisoprolol monotherapy in 207 GENRES participants. SNPs with one-sided P value less than 0.05 with the same direction of association as in the PEAR atenolol data were considered significant. Third, association with RHTN in 1529 INVEST-GENES participants with hypertension and CAD. Multiple logistic regression analysis was performed to calculate adjusted odds ratio (OR) and 95% confidence interval (CI) in white (n = 657), Hispanic (n = 537), and black (n = 155) participants separately (details reported in the Supplemental materials, http://links.lww.com/HJH/A516).
RESULTS
The baseline characteristics of the 461 white PEAR participants (233 assigned to atenolol monotherapy and 228 patients assigned to HCTZ monotherapy) and 150 black PEAR participants assigned to atenolol monotherapy are presented in Table 1. Overall, the PEAR participants had a mean age of around 50 years, 43% were female, 41% were overweight, and 46% were obese. The mean baseline office BP was 151/99 mmHg, consistent with the inclusion criteria of the PEAR study being uncomplicated hypertensive individuals.
TABLE 1.
Baseline characteristics of the pharmacogenomic evaluation of antihypertensive responses study participants
| Characteristicsa | White | Black Atenolol (n = 150) |
|
|---|---|---|---|
| Atenolol (n = 233) |
HCTZ (n = 228) |
||
| Age (mean ± SD) | 49.5 ± 9.5 | 50.0 ± 9.5 | 47.2 ± 8.5 |
| Female sex (n, %) | 109 (46.8%) | 91 (40.0%) | 107 (71.3%) |
| BMI (kg/m2) | 30.3 ± 5.5 | 30.3 ± 4.9 | 31.6 ± 6.3 |
| Duration of hypertension (years) | 7.0 ± 7.2 | 6.0 ± 7.1 | 6.4 ± 6.8 |
| Taking at least one antihypertensive drug at entry | 180 (77.3%) | 164 (71.9%) | 105 (70.0%) |
| Smoker (ever) | 91 (39.1%) | 96 (42.1%) | 52 (34.1%) |
| Baseline office BP | |||
| Systolic (mmHg) | 151.1 ± 12.4 | 151.7 ± 12.4 | 151.3 ± 12.1 |
| Diastolic (mmHg) | 98.9 ± 5.7 | 98.0 ± 5.8 | 99.0 ± 5.7 |
BP, blood pressure; HCTZ, hydrochlorothiazide; SD, standard deviation.
Numeric characteristics were presented as mean±SD or median and interquartile range if not normally distributed; categorical variables were presented as number and percentages.
Blood pressure response to atenolol or hydrochlorothiazide in the pharmacogenomic evaluation of antihypertensive responses study
In the PEAR white participants, after an average of 9 weeks of atenolol monotherapy, the mean BP response was −12.7 ± 8.6/−10.5 ± 5.8 mmHg. In the PEAR black participants, the mean BP response to atenolol monotherapy was −5.2 ± 9.2/−5.1 ± 5.9 mmHg. In the white participants assigned to HCTZ monotherapy, the average BP response was −8.5 ± 7.0/−4.7 ± 4.8 mmHg after 9 weeks of treatment. The large variability of the BP response in these three groups of participants is demonstrated in Supplemental Figure S1, http://links.lww.com/HJH/A516.
Single nucleotide polymorphisms associated with blood pressure response to atenolol monotherapy in the pharmacogenomic evaluation of antihypertensive responses study white participants (n = 233)
The Manhattan plots for the association with DBP and SBP response to atenolol in white participants are shown in Supplemental Figure S2A and B, http://links.lww.com/HJH/A516. No SNPs achieved genome-wide significance for association with DBP response to atenolol monotherapy, but 21 SNPs in five regions had P values at the suggestive level of less than 10−5 (Supplemental Table S1 and Figure S3A, http://links.lww.com/HJH/A516). Similarly, no SNPs achieved a genome-wide significance for association with SBP response to atenolol monotherapy, but 36 SNPs in seven regions achieved the suggestive P values less than 10−5 (Supplemental Table S2 and Figure S3B, http://links.lww.com/HJH/A516). Fifteen SNPs were associated with both DBP and SBP response after atenolol monotherapy with P less than 10−5, including 12 SNPs in the region of FKTN/FSD1L on chromosome 9 and three SNPs near BLK on chromosome 8.
Validation in blood pressure response to atenolol in the pharmacogenomic evaluation of antihypertensive responses study black participants (n = 150)
The SNPs that met the suggestive level of association in whites with BP response to atenolol were evaluated in PEAR black participants. None of these significant SNPs in whites were associated with BP response to atenolol in black participants (all P values >0.05). However, we found that two of the regions (OTOL1 and PTPRD) showed significant associations (P < 10−5 for either SBP or DBP response) with different SNPs (Supplemental Figures S4 and S5, http://links.lww.com/HJH/A516) in the regions.
The first region of interest was on chromosome 3 near OTOL1. Different SNPs in the same region were associated with BP response to atenolol in black compared with white participants. In PEAR white participants, rs7640608 and rs4524290 in this region, both with minor allele frequency of 5%, were associated with DBP response to atenolol, with P = 1.2 × 10⁻⁶ and P = 6.13 × 10⁻⁶, respectively (Supplemental Table S1 and Figure S4A, http://links.lww.com/HJH/A516). The two SNPs are in relatively high linkage disequilibrium in whites (r2 = 0.74, D′ = 0.92). The BP response to atenolol monotherapy by rs7640608 genotype is shown in Fig. 1A. White participants with rs7640608 AA and GA genotypes had a SBP/DBP response of −13.3/−11.0 and −7.5/−6.4 mmHg, respectively. In PEAR black participants, a more common SNP (39% minor allele frequency) in the same region, rs12486357 (r2 = 0 and D′ < 0.1 with rs7640608 in both whites and blacks), was associated with BP response to atenolol (Supplemental Figure S4B, http://links.lww.com/HJH/A516). Black participants with rs12486357 CC, GC, and GG genotypes had a SBP/DPB response of −8.5/−7.0, −4.9/−5.2, and +3.0/+0.1 mmHg, respectively, when treated with atenolol monotherapy (Fig. 1B).
FIGURE 1.
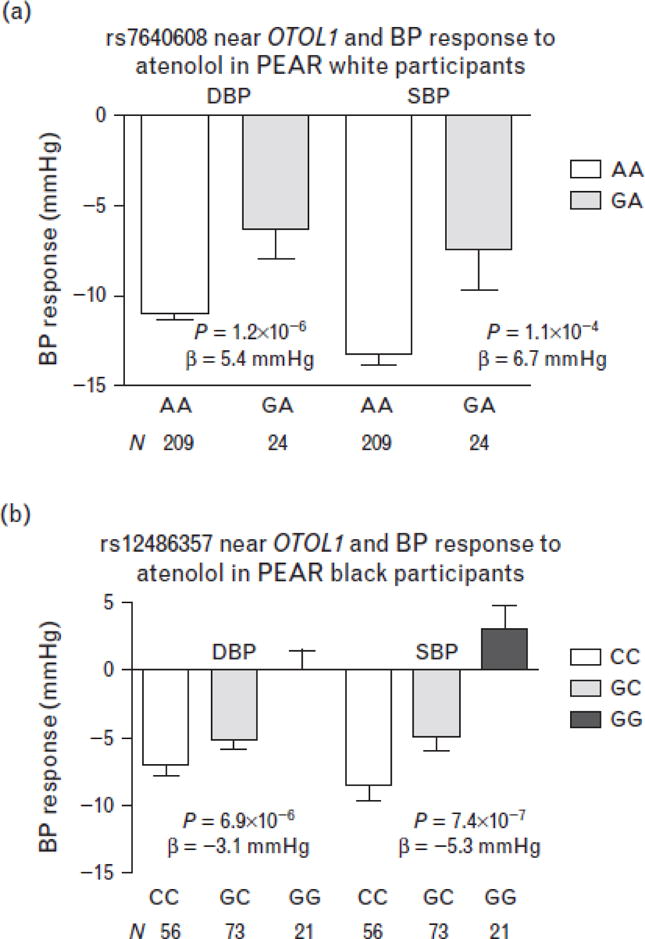
Blood pressure response by genotype for the single-nucleotide polymorphisms near the OTOL1 gene on chromosome 3 in the pharmacogenomic evaluation of antihypertensive responses participants. (a) rs7640608 in white participants. (b) rs12486357 in black participants. Error bars represent standard error of the means.
The second region of interest is the PTPRD region on chromosome 9p23, where SNPs rs12346562 (P = 3.2 ×10⁻⁶) and rs1104514 (P = 5.9 × 10⁻⁶) were associated with DBP response to atenolol in PEAR white participants (Table S1, Fig. 2A). The two SNPs are in high linkage disequilibrium in whites (r2 = 0.83, D′ = 0.92) with minor allele frequencies of approximately 27%. White participants with rs12346562 AA, AC, and CC genotypes had mean BP responses of −18.6/−15.0, −13.4/−11.2, and −11.3/−9.4 mmHg to atenolol, respectively (Fig. 3A). Although in PEAR black participants, a SNP downstream of the PTPRD gene, rs10739150 (Fig. 2B) with minor allele frequency of 40%, was associated with BP response to atenolol (P = 8.2 × 10⁻⁶ for SBP response and P = 1.7 × 10⁻⁴ for DBP response). Black participants with rs10739150 GG, TG, and TT genotypes had a BP response of −8.7/−7.2, −4.6/−4.8, and +1.4/−1.5 mmHg, respectively, after atenolol monotherapy (Fig. 3B).
FIGURE 2.
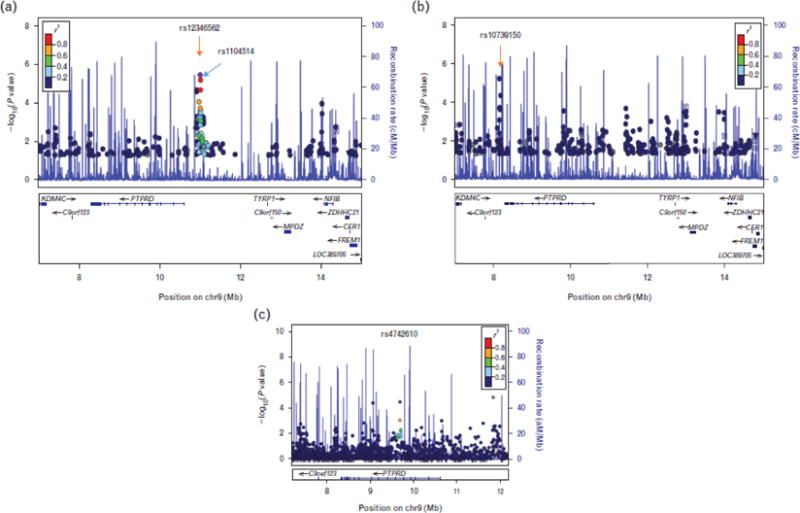
Regional plots for single-nucleotide polymorphism (SNPs) in the chromosome 9p23 region near PTPRD gene associated with DBP response to atenolol in pharmacogenomic evaluation of antihypertensive responses in white (a, top SNPs: rs12346562 and rs1104514) and black participants (b, top SNP: rs10739150) and SNPs associated with resistant hypertension in INVEST-GENES in the meta-analysis of whites, Hispanics, and blacks hypertensive patients with coronary artery disease (c, top SNP: rs4742610). INVEST-GENES, international verapamil SR trandolapril study genetic substudy.
FIGURE 3.
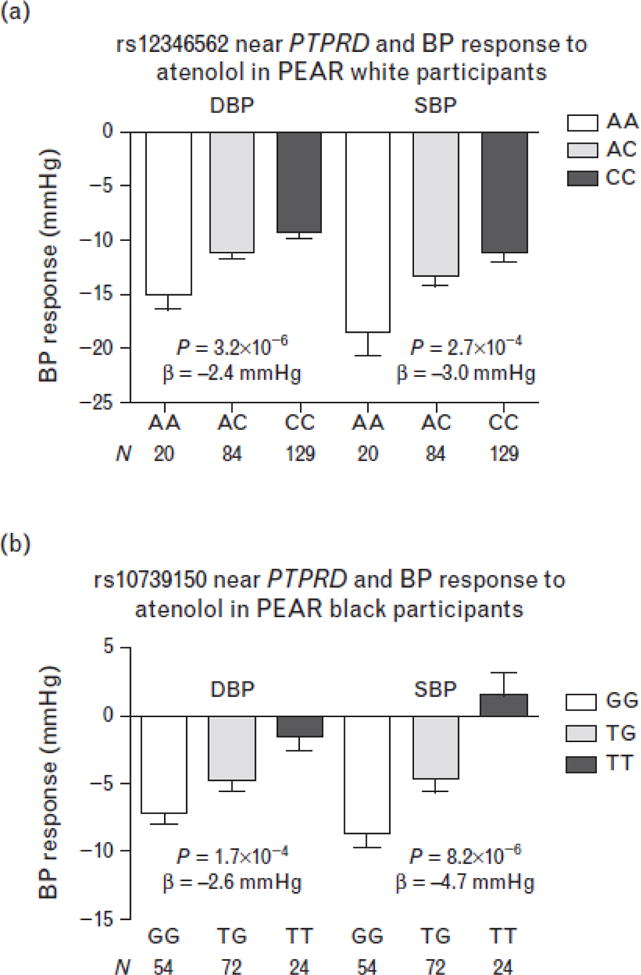
Blood pressure response by genotype for the single-nucleotide polymorphisms near the PTPRD gene on chromosome 9p23 in pharmacogenomic evaluation of antihypertensive responses participants. (a) rs12346562 in white participants. (b) rs10739150 in black participants. Error bars represent standard error of the means.
Validation in blood pressure response to hydrochlorothiazide in the pharmacogenomic evaluation of antihypertensive responses study white participants (n = 228)
We were particularly interested in the SNPs with directionally opposite association in response to HCTZ compared with atenolol because of the contrasting mechanism of action of β-blockers and diuretics. Therefore, we also evaluated the OTOL1 and PTPRD SNPs identified in PEAR whites for association with BP response to HCTZ monotherapy in an independent group of PEAR white participants.
The two SNPs on chromosome 9p23 near PTPRD, rs12346562 and rs1104514, met the criteria for validation (P < 0.05/4 = 0.0125) with βs in opposite directions in HCTZ compared with atenolol response. The A allele of SNP rs12346562 was associated with better DBP response to atenolol, but with less pronounced response to HCTZ. White participants with rs12346562 AA, AC, and CC genotypes had mean DBP responses of −15.0, −11.2, and −9.4 mmHg to atenolol (P = 3.2 × 10⁻⁶, β = −2.4 mmHg per A allele), but had mean responses to HCTZ of −3.8, −3.8, and −5.6 mmHg, respectively (P = 0.0018, β = 1.5 mmHg per A allele). The results were similar for rs1104514 because of the high linkage disequilibrium of these two SNPs in whites. To further validate this opposite direction of effect in response to HCTZ compared with atenolol, we also evaluated the response to atenolol + HCTZ combination therapy by genotype and found a significant but blunted difference in BP response between the genotype groups. Participants with rs12346562 AA, AC, and CC genotypes had mean DBP responses of −16.8, −13.0, and −12.4 mmHg, with P of 0.0054 and β of −1.5 mmHg per A allele. The two SNPs near the OTOL1 gene did not meet the validation criteria. The P values were 0.18 and 0.24 for rs4524290 and rs7640608, respectively, for associations with DBP response to HCTZ monotherapy.
Validation in blood pressure response to bisoprolol in the genetics of drug responsiveness study white participants (n = 207)
We then performed analysis in the GENRES study in order to validate the OTOL1 SNP (rs7640608) and PTPRD SNP (rs12346562) in another white population treated with a different β-blocker. Similar to PEAR patients, the mean age of GENRES patients was 50.5 ± 6.4, with baseline BP of 151 ± 13/99 ± 7 mmHg (Supplemental Table S3, http://links.lww.com/HJH/A516). We assessed the association of these two SNPs with the BP responses of the 207 Finnish male patients treated with bisoprolol. The OTOL1 SNP was not associated with BP response in GENRES (P = 0.65), but the PTPRD SNP showed a similar trend compared with the PEAR findings. The GENRES participants with rs12346562 AA, AC, and CC genotypes had ambulatory DBP responses of −9, −8.6, and −8 mmHg, respectively, with a one-sided P value of 0.095 and β of −0.54 mmHg.
Association with resistant hypertension in the international verapamil SR trandolapril study participants (n = 1529)
The baseline demographics of INVEST-GENES participants are shown in Supplemental Table S4, http://links.lww.com/HJH/A516. Compared with PEAR and GENRES participants with uncomplicated hypertension, the INVEST participants were older (mean age: 68) and had comorbid conditions such as diabetes (18%), history of myocardial infarction (26%), history of heart failure (4.5%), or history of stroke or transient ischemic attack (7.7%).
In evaluating the association of the SNPs in the OTOL1 and PTPRD regions and RHTN in INVEST participants regardless of the treatment strategies, we found the PTPRD region, but not OTOL1 region, to be significant. The strongest SNP in this region was an intronic SNP (rs4742610) in PTPRD, with adjusted OR for RHTN of 1.55 and 95% CI of 1.19–2.02 in white, 1.53 (1.13–2.08) in Hispanics, and 1.13 (0.61–2.07) in blacks, with a meta-analysis OR of 1.50 (1.24–1.81), P = 3.2 × 10⁻⁵ (Fig. 2C, Table 2). Genotypes for the two SNPs from the original BP association in whites were not available on the chip and so could not be evaluated. We also performed the analysis by treatment strategy and found the associations of top SNP (rs4742610) stronger in participants assigned to β-blocker strategy than those assigned to calcium channel blocker strategy in all three race/ethnicity groups. Particularly in whites, the OR and 95% CI was 1.89 (1.29–2.75), P =9.8 × 10⁻⁴ for those assigned to β-blocker treatment strategy, and 1.33 (0.90–1.97), P = 0.15 for those assigned to calcium channel blocker treatment strategy (interaction P = 0.19).
TABLE 2.
PTPRD single-nucleotide polymorphisms association with resistant hypertension in international verapamil SR trandolapril study genetic substudy participants
| PTPRD SNPs | BP | A1 | A2 | White (n = 653) | Hispanic (n = 536) | Black (n = 155) | Meta-analysis | |||||||||
|---|---|---|---|---|---|---|---|---|---|---|---|---|---|---|---|---|
| CHR | SNP | OR | 95% CI | P | OR | 95% CI | P | OR | 95% CI | P | OR | 95% CI | P | |||
| 9 | rs324498 | 9059545 | G | A | 1.67 | 1.21–2.30 | 0.0019 | 1.58 | 1.14–2.18 | 0.0058 | 1.24 | 0.70–2.19 | 0.46 | 1.56 | 1.26–1.93 | 3.8 × 10⁻⁵ |
| 9 | rs4742610 | 9687487 | A | G | 1.55 | 1.19–2.02 | 0.0011 | 1.53 | 1.13–2.08 | 0.0066 | 1.13 | 0.61–2.07 | 0.70 | 1.50 | 1.24–1.81 | 3.2 × 10⁻⁵ |
BP, base pair position, build 36; CHR, chromosome; CI, confidence interval; OR, odds ratio; SNP, single-nucleotide polymorphism. Analysis adjusted for age, sex, body mass index, and history of diabetes, heart failure, myocardial infarction, stroke, left ventricular hypertrophy, peripheral vascular disease, and treatment assignment, and the first three principal components for ancestry.
DISCUSSION
This analysis reports the results of the first genome-wide association analysis of BP response to atenolol. In white participants with uncomplicated hypertension, we identified one region on chromosome 9p23 near the PTPRD gene that was associated with BP response to atenolol monotherapy, and had a directionally opposite association with BP response to HCTZ monotherapy in an independent cohort in PEAR, which was validated in the combination therapy analysis. We also found a different SNP near the PTPRD gene to be associated with BP response to atenolol in black hypertensive individuals. One of the SNPs in this region showed the same trend of association with BP response to a different β-blocker, bisoprolol, in an independent study of Finnish men. The PTPRD gene was also associated with RHTN in multiple ethnic groups in a hypertensive population with CAD.
We identified one region near PTPRD with opposite association with BP response to atenolol and HCTZ monotherapy in white participants. Although these two specific SNPs (rs12346562 and rs1104514) were not associated with BP response to atenolol in black participants, we identified a different SNP near the PTPRD gene (rs10739150) to be significant for the blacks atenolol response. This is not surprising because of different linkage disequilibrium across different ancestral backgrounds. The presence of significant signals in two race groups in this chromosomal region containing the PTPRD region might be real, as a true association with drug response is expected to have evidence of association in the same region across different race groups.
In order to further validate our finding with another drug in the β-blocker class, we also investigated the association of one of the two PTPRD SNPs with association in whites in another hypertension trial, GENRES, which included Finnish men. It is important to recognize that although the patients recruited in GENRES were similar to those in PEAR in terms of having mild-to-moderate hypertension and of similar age and baseline BP, there were two significant differences between these two studies. The β-blocker used in GENRES was bisoprolol 5 mg/day, which is considered equivalent to atenolol 50 mg/day [18]. This is half the dose that was used in PEAR participants. In addition, GENRES included only Finnish men, whereas PEAR included both men and women. We have previously documented that BP response to atenolol was less pronounced in men compared with women by approximately 4–5 mmHg [19]. When analysis was performed in only male PEAR participants treated with 50 mg/day of atenolol, the P value was less significant than in the overall population at 0.011 with a β = −1.5 mmHg. Given the dose and sex differences between these two studies, the trend we have observed in GENRES suggests that this signal may be important.
Owing to the findings in PEAR BP response association in atenolol monotherapy and blunted response to atenolol + HCTZ combination therapy, we decided to evaluate the association of the PTPRD gene in INVEST-GENES, another hypertension BP trial wherein most of the participants were treated with combination therapy, including approximately 50% treated with atenolol-based treatment strategy, with HCTZ being the add-on drug. INVEST was designed as an outcome trial, thus the BP was not as carefully measured as the BP in the response trials such as PEAR and GENRES. RHTN is a more robust BP response phenotype for INVEST. In the INVEST-GENES analysis, two intronic SNPs in PTPRD (rs4742610 and rs324498) were associated with RHTN in hypertensive patients with CAD, regardless of treatment strategies, both in white and Hispanic participants. This association was found to be stronger in patients randomized to atenolol-based β-blocker strategy compared with those randomized to calcium channel blocker-based strategy. This provides evidence that the influence on RHTN may relate to the BP response to a β-blocker, which would support the findings in our other cohorts.
The two top SNPs in PEAR whites (rs12346562 and rs1104514) are located upstream of gene PTPRD on chromosome 9p23, the top SNP in blacks (rs10739150) is downstream of PTPRD and the RHTN SNPs (rs4742610 and rs324498) are in an intron of PTPRD. PTPRD encodes the protein tyrosine phosphatase receptor type D, a member of the highly conserved family of receptor protein tyrosine phosphatases. PTPRD has been shown to be a tumor suppressor gene in malignant glioma and other human cancers and was found to dephosphorylate signal transducers and activators of transcription 3 (STAT3) [20]. There is increasing evidence that STAT3 is involved in regulation of BP and the intrarenal RAS through the JAK-STAT pathway [21]. SNPs in PTPRD gene have also been associated with diabetes [22,23] and plasma homocysteine levels [24]. Our findings that the PTPRD SNPs had directionally opposite associations with BP response to HCTZ compared with BP response to atenolol supports the hypothesis that this gene is important in BP regulation, likely through regulation of the RAS. Further investigation may unravel a new pathway for BP response to β-blocker treatment.
The other region that was validated in the PEAR black participants, but not in white HCTZ, white bisoprolol, or the RHTN analysis, was the OTOL1 gene on chromosome 3q26 region. This gene was previously associated with BMI [25] and aging [26], but there have been no reports on BP-related associations.
In conclusion, we identified a novel locus associated with BP response to atenolol in both white and black individuals with uncomplicated hypertension and with RHTN in white and Hispanic hypertensive individuals with CAD. Further studies are warranted to identify the causal variants and functional basis of these associations.
Supplementary Material
Reviewer’s Summary Evaluation.
Reviewer 2
This original study by Gong and collaborators identifies a novel locus associated with blood pressure response to atenolol and resistant hypertension in multiple ethnic groups. The identification of new genes associated with drug response paves the way for eventual individualized treatment.
Acknowledgments
The authors would like to acknowledge and thank the valuable contributions of the PEAR, GENRES, and INVEST study participants, support staff, and PEAR study physicians: Frederic Rabari-Oskoui and Dan Rubin.
Abbreviations
- BP
blood pressure
- GENRES
genetics of drug responsiveness in essential hypertension study
- HCTZ
hydrochlorothiazide
- INVEST
International Verapamil SR Trandolapril study
- INVEST-GENES
International Verapamil SR Trandolapril Study Genetic Substudy
- PEAR
pharmacogenomic evaluation of antihypertensive responses
- RAS
renin–angiotensin system
- RHTN
resistant hypertension
- SNP
single-nucleotide polymorphism
Footnotes
Conflicts of interest
Y.G., R.M.C., A.L.B., A.B.C., J.G.G., E.B., S.T.T., and J.A.J. received funding from NIH. J.G.G. is a consultant for Boehringer-Ingelheim. E.B. received honoraria from the Foundation of Rome. Other authors declare no conflicts of interest.
References
- 1.Lim SS, Vos T, Flaxman AD, Danaei G, Shibuya K, Adair-Rohani H, et al. A comparative risk assessment of burden of disease and injury attributable to 67 risk factors and risk factor clusters in 21 regions, 1990–2010: a systematic analysis for the Global Burden of Disease Study 2010. Lancet. 2012;380:2224–2260. doi: 10.1016/S0140-6736(12)61766-8. [DOI] [PMC free article] [PubMed] [Google Scholar]
- 2.Kearney PM, Whelton M, Reynolds K, Muntner P, Whelton PK, He J. Global burden of hypertension: analysis of worldwide data. Lancet. 2005;365:217–223. doi: 10.1016/S0140-6736(05)17741-1. [DOI] [PubMed] [Google Scholar]
- 3.Go AS, Mozaffarian D, Roger VL, Benjamin EJ, Berry JD, Blaha MJ, et al. Heart disease and stroke statistics – 2014 update: a report from the American Heart Association. Circulation. 2014;129:e28–e292. doi: 10.1161/01.cir.0000441139.02102.80. [DOI] [PMC free article] [PubMed] [Google Scholar]
- 4.Bidiville J, Nussberger J, Waeber G, Porchet M, Waeber B, Brunner HR. Individual responses to converting enzyme inhibitors and calcium antagonists. Hypertension. 1988;11:166–173. doi: 10.1161/01.hyp.11.2.166. [DOI] [PubMed] [Google Scholar]
- 5.Freis ED, Materson BJ, Flamenbaum V. Comparison of propranolol or hydrochlorothiazide alone for treatment of hypertension. III. Evaluation of the reninangiotensin system. Am J Med. 1983;74:1029–1041. doi: 10.1016/0002-9343(83)90812-4. [DOI] [PubMed] [Google Scholar]
- 6.IMS Institute for Healthcare Informatics. The use of medicines in the United States review of 2011. 2012 http://www.imshealth.com/ims/Global/Content/Insights/IMS%20Institute%20for%20Healthcare%20Informatics/IHII_Medicines_in_U.S_Report_2011.pdf [Accessed 11 June 2014]
- 7.Bartholow M. Top 200 drugs of 2012. 2013 http://www.pharmacytimes.com/publications/issue/2013/July2013/Top-200-Drugs-of-2012. [Accessed 11 June 2014]
- 8.National Center for Health Statistics. Health, United States, 2013: with special feature on prescription drugs. 2014 http://www.cdc.gov/media/releases/2014/p0514-prescription-drugs.html. [Accessed 11 June 2014] [PubMed]
- 9.Yancy CW, Jessup M, Bozkurt B, Butler J, Casey DE, Jr, Drazner MH, et al. 2013 ACCF/AHA guideline for the management of heart failure: a report of the American College of Cardiology Foundation/American Heart Association Task Force on Practice Guidelines. J Am Coll Cardiol. 2013;62:e147–e239. doi: 10.1016/j.jacc.2013.05.019. [DOI] [PubMed] [Google Scholar]
- 10.O’Gara PT, Kushner FG, Ascheim DD, Casey DE, Jr, Chung MK, de Lemos JA, et al. 2013 ACCF/AHA guideline for the management of ST-elevation myocardial infarction: a report of the American College of Cardiology Foundation/American Heart Association Task Force on Practice Guidelines. Circulation. 2013;127:e362–e425. doi: 10.1161/CIR.0b013e3182742cf6. [DOI] [PubMed] [Google Scholar]
- 11.Effect of metoprolol CR/XL in chronic heart failure: metoprolol CR/XL randomised intervention trial in congestive heart failure (MERIT-HF) Lancet. 1999;353:2001–2007. [PubMed] [Google Scholar]
- 12.Johnson JA, Boerwinkle E, Zineh I, Chapman AB, Bailey K, Cooper-DeHoff RM, et al. Pharmacogenomics of antihypertensive drugs: rationale and design of the pharmacogenomic evaluation of antihypertensive responses (PEAR) study. Am Heart J. 2009;157:442–449. doi: 10.1016/j.ahj.2008.11.018. [DOI] [PMC free article] [PubMed] [Google Scholar]
- 13.Turner ST, Schwartz GL, Chapman AB, Beitelshees AL, Gums JG, Cooper-Dehoff RM, et al. Power to identify a genetic predictor of antihypertensive drug response using different methods to measure blood pressure response. J Transl Med. 2012;10:47. doi: 10.1186/1479-5876-10-47. [DOI] [PMC free article] [PubMed] [Google Scholar]
- 14.Hiltunen TP, Suonsyrjä T, Hannila-Handelberg T, Paavonen KJ, Miettinen HE, Strandberg T, et al. Predictors of antihypertensive drug responses: initial data from a placebo-controlled, randomized, cross-over study with four antihypertensive drugs (The GENRES Study) Am J Hypertens. 2007;20:311–318. doi: 10.1016/j.amjhyper.2006.09.006. [DOI] [PubMed] [Google Scholar]
- 15.Pepine CJ, Handberg EM, Cooper-DeHoff RM, Marks RG, Kowey P, Messerli FH, et al. A calcium antagonist vs a noncalcium antagonist hypertension treatment strategy for patients with coronary artery disease. The International Verapamil-Trandolapril Study (INVEST): a randomized controlled trial. J Am Med Assoc. 2003;290:2805–2816. doi: 10.1001/jama.290.21.2805. [DOI] [PubMed] [Google Scholar]
- 16.Calhoun DA, Jones D, Textor S, Goff DC, Murphy TP, Toto RD, et al. Resistant hypertension: diagnosis, evaluation, and treatment. A scientific statement from the American Heart Association Professional Education Committee of the Council for High Blood Pressure Research. Hypertension. 2008;51:1403–1419. doi: 10.1161/HYPERTENSIONAHA.108.189141. [DOI] [PubMed] [Google Scholar]
- 17.Smith SM, Gong Y, Handberg E, Messerli FH, Bakris GL, Ahmed A, et al. Predictors and outcomes of resistant hypertension among patients with coronary artery disease and hypertension. J Hypertens. 2014;32:635–643. doi: 10.1097/HJH.0000000000000051. [DOI] [PMC free article] [PubMed] [Google Scholar]
- 18.Park S, Rhee MY, Lee SY, Park SW, Jeon D, Kim BW, et al. A prospective, randomized, open-label, active-controlled, clinical trial to assess central haemodynamic effects of bisoprolol and atenolol in hypertensive patients. J Hypertens. 2013;31:813–819. doi: 10.1097/HJH.0b013e32835e8f5b. [DOI] [PubMed] [Google Scholar]
- 19.Turner ST, Schwartz GL, Chapman AB, Beitelshees AL, Gums JG, Cooper-DeHoff RM, et al. Plasma renin activity predicts blood pressure responses to beta-blocker and thiazide diuretic as monotherapy and add-on therapy for hypertension. Am J Hypertens. 2010;23:1014–1022. doi: 10.1038/ajh.2010.98. [DOI] [PMC free article] [PubMed] [Google Scholar]
- 20.Veeriah S, Brennan C, Meng S, Singh B, Fagin JA, Solit DB, et al. The tyrosine phosphatase PTPRD is a tumor suppressor that is frequently inactivated and mutated in glioblastoma and other human cancers. Proc Natl Acad Sci USA. 2009;106:9435–9440. doi: 10.1073/pnas.0900571106. [DOI] [PMC free article] [PubMed] [Google Scholar]
- 21.Satou R, Gonzalez-Villalobos RA. JAK-STAT and the renin-angiotensin system: the role of the JAK-STAT pathway in blood pressure and intrarenal renin-angiotensin system regulation. JAKSTAT. 2012;1:250–256. doi: 10.4161/jkst.22729. [DOI] [PMC free article] [PubMed] [Google Scholar]
- 22.Tsai FJ, Yang CF, Chen CC, Chuang LM, Lu CH, Chang CT, et al. A genome-wide association study identifies susceptibility variants for type 2 diabetes in Han Chinese. PLoS Genet. 2010;6:e1000847. doi: 10.1371/journal.pgen.1000847. [DOI] [PMC free article] [PubMed] [Google Scholar]
- 23.Below JE, Gamazon ER, Morrison JV, Konkashbaev A, Pluzhnikov A, McKeigue PM, et al. Genome-wide association and meta-analysis in populations from Starr County, Texas, and Mexico City identify type 2 diabetes susceptibility loci and enrichment for expression quantitative trait loci in top signals. Diabetologia. 2011;54:2047–2055. doi: 10.1007/s00125-011-2188-3. [DOI] [PMC free article] [PubMed] [Google Scholar]
- 24.Mälarstig A, Buil A, Souto JC, Clarke R, Blanco-Vaca F, Fontcuberta J, et al. Identification of ZNF366 and PTPRD as novel determinants of plasma homocysteine in a family-based genome-wide association study. Blood. 2009;114:1417–1422. doi: 10.1182/blood-2009-04-215269. [DOI] [PMC free article] [PubMed] [Google Scholar]
- 25.Croteau-Chonka DC, Marvelle AF, Lange EM, Lee NR, Adair LS, Lange LA, et al. Genome-wide association study of anthropometric traits and evidence of interactions with age and study year in Filipino women. Obesity (Silver Spring) 2011;19:1019–1027. doi: 10.1038/oby.2010.256. [DOI] [PMC free article] [PubMed] [Google Scholar]
- 26.Walter S, Atzmon G, Demerath EW, Garcia ME, Kaplan RC, Kumari M, et al. A genome-wide association study of aging. Neurobiol Aging. 2011;32:2109.e15–2109.e28. doi: 10.1016/j.neurobiolaging.2011.05.026. [DOI] [PMC free article] [PubMed] [Google Scholar]
Associated Data
This section collects any data citations, data availability statements, or supplementary materials included in this article.