Abstract
Lithiation of 1,4-bis(trifluoromethyl)benzene with lithium diisopropylamide (LDA) in tetrahydrofuran at −78 °C occurs under conditions in which the rates of aggregate exchanges are comparable to the rates of metalation. Under such nonequilibrium conditions, a substantial number of barriers compete to be rate limiting, making the reaction sensitive to trace impurities (LiCl), reactant concentrations, and isotopic substitution. Rate studies using the perdeuterated arene reveal odd effects of LiCl, including catalyzed rate acceleration at lower temperature and catalyzed rate inhibition at higher temperatures. The catalytic effects are accompanied by corresponding changes in the rate law. A kinetic model that captures the critical features of the LiCl catalysis focusing on the influence of LiCl-catalyzed reaggregation of the fleeting monomer that can reside above, at, or below the equilibrium population without catalyst.
TOC Graphic

Introduction
Decades of studying lithium diisopropylamide (LDA)-mediated metalations have revealed that the large, rapidly equilibrating ensemble of transiently accessible aggregation and solvation states quite rationally leads to an equally diverse array of mechanisms.1 The dominant pathways depend on substrate, solvent, temperature, and reagent concentrations. The rates are dictated by the barrier height of the proton transfer for each substrate–solvent combination.
We only recently began studying metalations carried out using LDA/tetrahydrofuran (THF)/−78 °C—one of the most commonly chosen reagent, solvent, and temperature combinations in all of organic synthesis.2,3 Although a fear of poor temperature control proved misplaced, a far more challenging problem lurked beneath the surface. We discovered that under these conditions, the activation barriers for the large number of aggregate and solvent exchanges are remarkably similar and comparable to those for lithiation of the substrates, leading to a chaotic mechanistic scenario.4 Reaction coordinates are often dictated by the barriers of aggregate exchanges rather than the barriers in the metalation step. The resulting paradoxical behaviors include dependencies of rate on the choice of substrate but not necessarily on substrate concentration. Simple deuteration to measure a kinetic isotope effect can cause profound changes in the mechanism and accompanying rate law.2d,e Autocatalysis and catalysis by trace impurities—parts per million of LiCl—are rampant owing to accelerated deaggregation steps. The source of the LDA (commercial versus n-BuLi-derived) can be the single most important variable, imparting up to 100-fold differences in rates.
We continued these studies by examining the ortholithiation of 1,4-bis(trifluoromethyl)benzene (1, eq 1)5 in which rate-limiting dimer- and tetramer-based aggregation events dominate. This metalation is an outlier in the series in that autocatalysis by aryllithium 2 is not important. The most striking observation is that traces of LiCl can accelerate or inhibit the metalation. The seemingly paradoxical notion of catalyzed inhibition is a consequence of nonequilibrium kinetics.6 Although this paper ostensibly describes the study of an ortholithiation,7 it is primarily about using ortholithiation as a tool to investigate the underlying dynamics of LDA aggregate and solvent exchanges under nonequilibrium conditions.8 The nonspecialists will find a synopsis at the outset of the discussion section.
 |
(1) |
Results
The results are presented sequentially in three categories: structural studies that are foundational for understanding the metalation, rate studies of uncatalyzed metalations, and rate studies of catalyzed metalations. The markedly different metalations of arene 1 and its perdeuterated analog demanded complete rate studies for each; these studies are discussed within their own subsections. To facilitate the presentation, we introduce the following shorthand: A = an LDA subunit, S = THF, ArH = arene 1, ArD = 1-d4, and ArLi = aryllithium 2 or its perdeuterated analog 2-d3. Large numbers of graphical outputs have been relegated to supporting information.
Solution structures
Studies of [6Li,15N]LDA using 6Li and 15N NMR spectroscopies have revealed exclusively disolvated dimer 3 in THF and THF/hydrocarbon mixtures.2b,9 The resulting aryllithium 2 is characterized as trisolvated monomer 2a as follows.
 |
The 19F NMR spectrum of aryllithium 2 displays a pair of singlets (1:1).10,11 The 13C NMR spectrum of 2 shows a multiplet for the lithiated carbon resulting from a composite of one-bond 6Li–13C coupling12 and three-bond 19F–13C coupling. Removing the requisite 1H decoupling using perdeuterated 1-d4 frees up the second probe channel for 19F decoupling, revealing a 1:1:1 triplet (JLi–C = 13.2 Hz) consistent with monomeric 2. Generating 2 with excess [6Li,15N]LDA reveals no additional species and no 6Li–15N splitting in the resonance corresponding to 2, confirming the absence of detectable mixed aggregates that are often observed in LDA–ArLi mixtures.2a
Solvation numbers of 2 were determined using two methods:
- Metalation with added i-Pr2NH and monitoring with 19F NMR spectroscopy (eq 2) revealed a THF-concentration-dependent equilibrium population of 1 and 2, with the equilibrium shifting to the right at elevated THF concentrations. Least squares fit to eq 3 afforded a solvation number (n + 1) of 3.1 ± 0.3.

(2) (3)
Rate studies: general protocol
Lithiations of ArH and ArD using analytically pure LDA9 were followed by monitoring the loss of arene using in situ IR spectroscopy (1323 cm−1)15 or 19F NMR spectroscopy (−65.7 ppm). Metalations under most conditions, whether ostensibly pseudo-first-order (low substrate concentration) or not, fail to display first-order decays (Figure 1) owing to partially or completely rate-limiting deaggregations. Accordingly, initial rates were extracted from the first derivative (slope) of a polynomial fit to data within 5% conversion.2c,16 Reaction orders were obtained by independently varying the concentrations of ArH, LDA, and THF and monitoring the initial rates. ArH and ArD metalations are mechanistically different owing to the retention of zero-point energy differences in rate-limiting transition states involving deaggregations and even metalations. We have expounded on this difference2e and return to it briefly in the discussion. ArH and ArD demanded independently determined rate laws.
Figure 1.
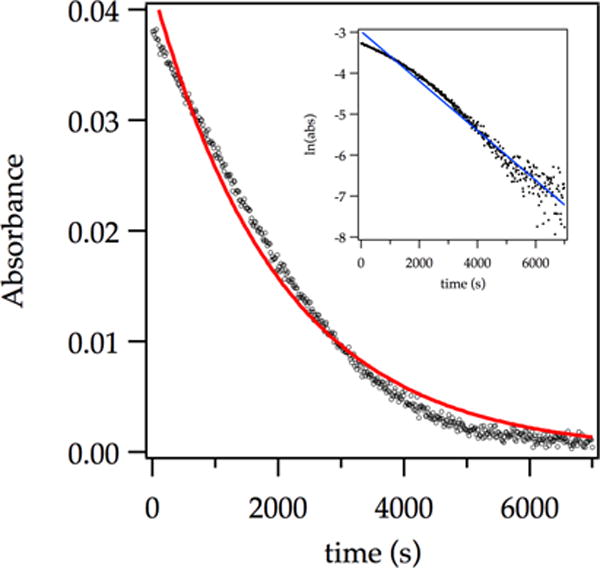
Representative plot showing poor exponential fit (red curve) to the decay of ArH (0.0050 M) with LDA (0.10 M) in THF (12.2 M) at −78 °C monitored with IR spectroscopy (1323 cm−1). The natural log plot (inset) shows the deviation from a linear first-order decay.
Autocatalysis
We always begin detailed rate studies by addressing the role of autocatalysis,17 which has been prevalent in previous studies of LDA-mediated metalations under nonequilibrium conditions.2 Using a standard protocol in which a second aliquot of substrate is added and monitored at the completion of a decay, we found that the first and second aliquots of ArH (or ArD) afforded indistinguishable rates under a variety of conditions. Thus, autocatalysis is not important.
Uncatalyzed ortholithiation: ArD
We introduce the detailed rate studies somewhat unconventionally with investigations of the deuterated substrate (ArD) because the results, although limited in scope, are simple compared with those of ArH. The results are interpreted in the context of the mechanism and rate law described by eqs 5–7.18
| (5) |
| (6) |
| (7) |
Plotting initial rates versus ArD concentration revealed saturation kinetics (Figure 2) consistent with a shift from rate-limiting metalation at low ArD concentration (eq 5; k−1 ≫ k2[ArD]) to rate-limiting deaggregation at high ArD concentration (k−1 ≪ k2[ArD]).
Figure 2.
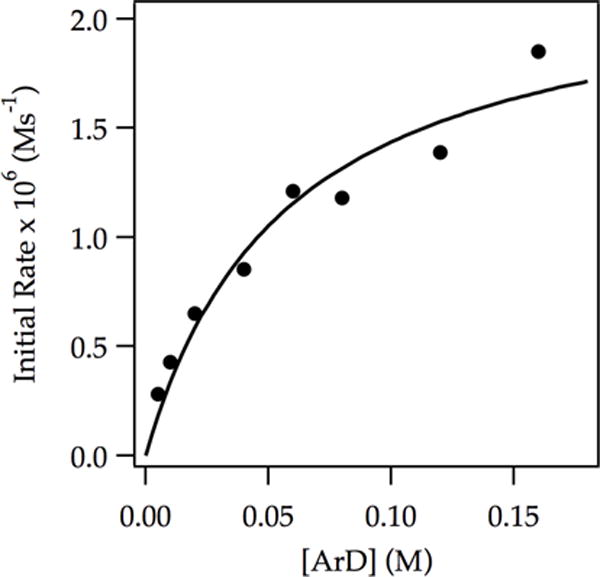
Plot of initial rate vs ArD concentration for the ortholithiation of ArD with LDA (0.10 M) in THF (12.2 M) at −78 °C measured with IR spectroscopy (1323 cm−1). The curve depicts an unweighted least-squares fit to a first-order saturation function: y = (a[ArD])/(1 + b[ArD]). [a = (3.9 ± 0.8) × 10−5, b = (17 ± 5)].
Monitoring the initial rates versus the LDA and THF concentrations19 in the limit of low ArD concentration revealed first-order dependencies in each (Figures 3 and 4). Because the trapping of a fleeting A2S3 intermediate is slow at these relatively low ArD concentrations (k−1 ≫ k2[ArD]), the generalized rate law in eq 5 reduces to the simpler form in eq 6. Computational studies showed that the conventional open-dimer-based 4 is more stable than the surprisingly viable 10-membered analog 5 (eq 8).20
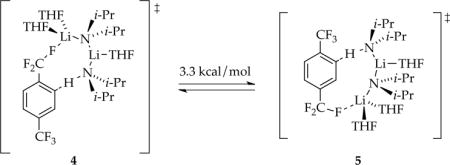 |
(8) |
Figure 3.
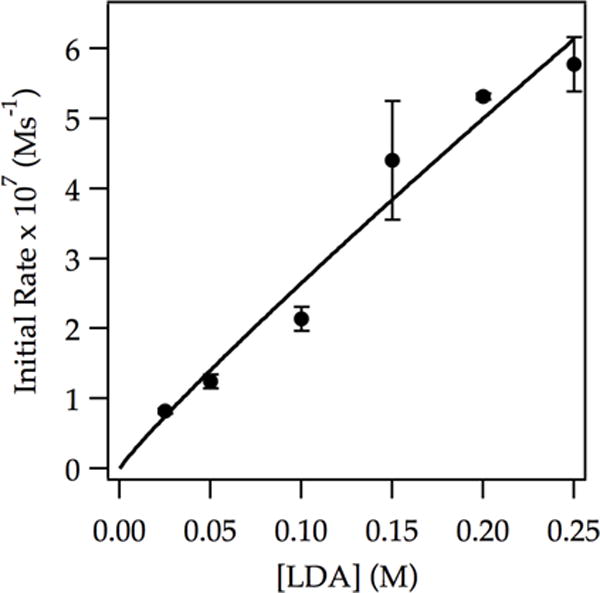
Plot of initial rate vs LDA concentration in THF (12.2 M) for the ortholithiation of ArD (0.0050 M) at −78 °C measured with IR spectroscopy (1323 cm−1). The curve depicts an unweighted least-squares fit to y = a[LDA]n. [a = (2.2 ± 0.5) × 10−6, n = 0.9 ± 0.1].
Figure 4.
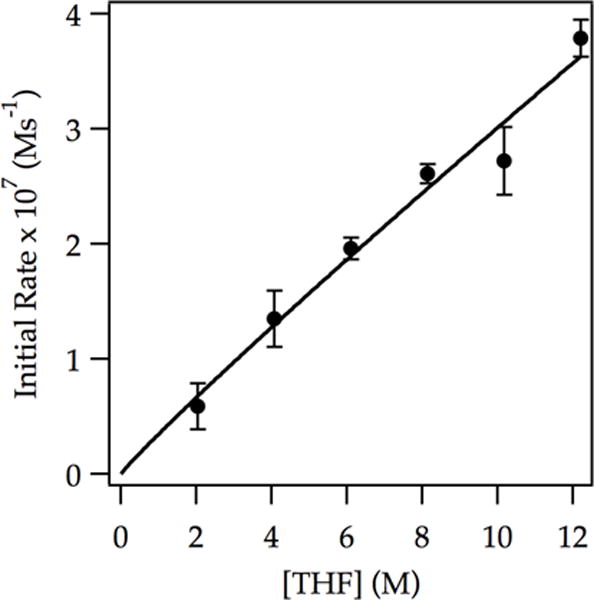
Plot of initial rate vs THF concentration in hexanes for the ortholithiation of ArD (0.0050 M) by LDA (0.10 M) at −78 °C measured with IR spectroscopy (1323 cm−1). The curve depicts an unweighted least-squares fit to y = a[THF]n. [a = (3.5 ± 0.8) × 10−8, n = (0.94 ± 0.09)].
The zeroth-order dependence on ArD at high ArD concentration stems from the efficient trapping of a fleeting intermediate (k−1 ≪ k2[ArD]), precluding its return to starting A2S2 dimer 3.2 Although the domination of a transition structure of stoichiometry [A2S3]‡ on the saturation plateau seems rational, it is presumptuous; previous studies of LDA-mediated metalations under nonequilibrium conditions have revealed that deuteration can markedly change the reaction mechanism and affiliated rate law.2c,e Normally we would determine the rate law at high ArD concentration to confirm the stoichiometry of the rate-limiting aggregation event and complete the story, but the high concentrations of ArD required to effect efficient trapping presented technical challenges.21 Nevertheless, this example provided a brief introduction to nonequilibrium kinetics and the more complex ArH metalations.
Uncatalyzed ortholithiation: ArH
Metalations of ArH (0.0050 M), ostensibly under pseudo-first-order conditions, deviate from clean exponential decays akin to that shown in Figure 1. Metalations at high LDA and low THF concentrations afford a noisy zeroth-order dependence on arene concentration (Figure 5). By contrast, metalation at low LDA and high THF concentrations display an ArH dependence manifesting clear saturation behavior (Figure 6) consistent with rate-limiting ortholithiation at low ArH concentration and rate-limiting deaggregation at high ArH concentration. The isotope effect measured from two independent metalations of ArH and ArD is large at low arene concentrations (kH/kD = 14) while approaching unity at high arene concentrations (consistent with a rate-limiting deaggregation.) The competitive isotope measured by competing ArH and ArD approximates 20 at all arene concentrations.
Figure 5.
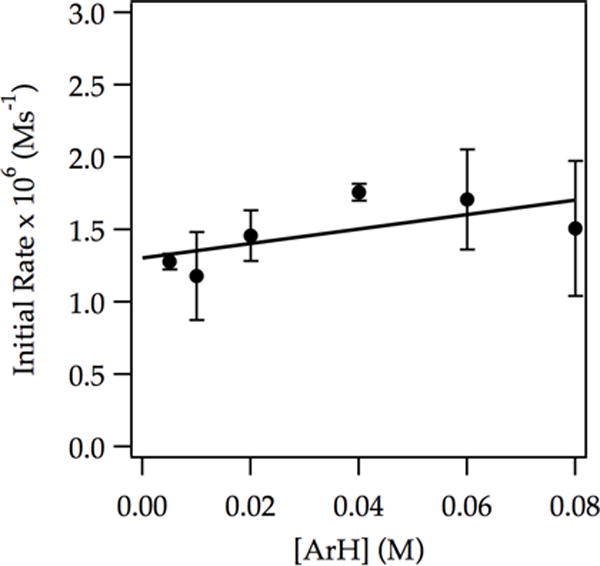
Plot of initial rate vs initial ArH concentration for the ortholithiation of ArH with LDA (0.20 M) in THF (3.05 M) at −78 °C measured with IR spectroscopy (1323 cm−1). The curve depicts an unweighted least-squares fit to y = a[ArH] + b. [a = (5 ± 3) × 10−6, b = (1.3 ± 0.1) × 10−6].
Figure 6.
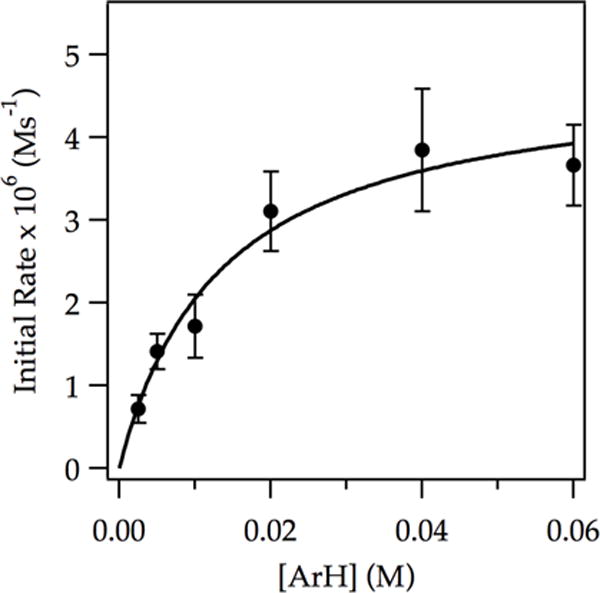
Plot of initial rate vs initial ArH concentration for the ortholithiation of ArH with LDA (0.050 M) in THF (12.2 M) at −78 °C measured with IR spectroscopy (1323 cm−1). The curve depicts an unweighted least-squares fit to a first-order saturation function: y = (a[ArH])/(1 + b[ArH]). [a = (3.6 ± 0.7) × 10−4, b = (74 ± 20)].
The saturation showed that we were probing the cusp of a shifting rate-limiting step. Detailed rate studies revealed that dimer- and tetramer-based pathways compete for dominance.
We now consider both low ArH concentrations (the left sides of Figures 5 and 6) as well as high ArH concentrations (the plateau in Figure 6) and explore the roles of THF and LDA.
(1) Low ArH concentrations
In neat THF, a first-order LDA dependence (Figure 7, curve A) implicates a dimer-based mechanism. At low THF concentration (3.05 M), a markedly elevated LDA dependence is consistent with a tetramer-based mechanism (Figure 7, curve B). Similarly, at high LDA concentration (0.20 M) the THF order is reduced to unity (Figure 8, curve A), whereas at low LDA concentration (0.050 M), the THF order approaches 2 (Figure 8, curve B).
Figure 7.
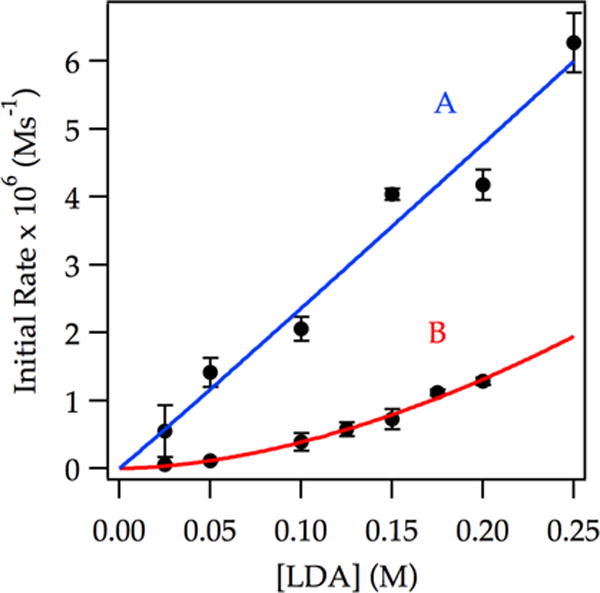
Plot of initial rate vs LDA concentration in 12.2 M THF (curve A) and 3.05 M THF (curve B) for the ortholithiation of ArH (0.0050 M) at −78 °C measured with IR spectroscopy (1323 cm−1). The curves depict unweighted least-squares fits to y = a[LDA]n. Curve A: [a = (2.5 ± 0.6) × 10−5, n = (1.0 ± 0.1)]. Curve B: [a = (2.3 ± 0.5) × 10−5, n = (1.8 ± 0.1)].
Figure 8.
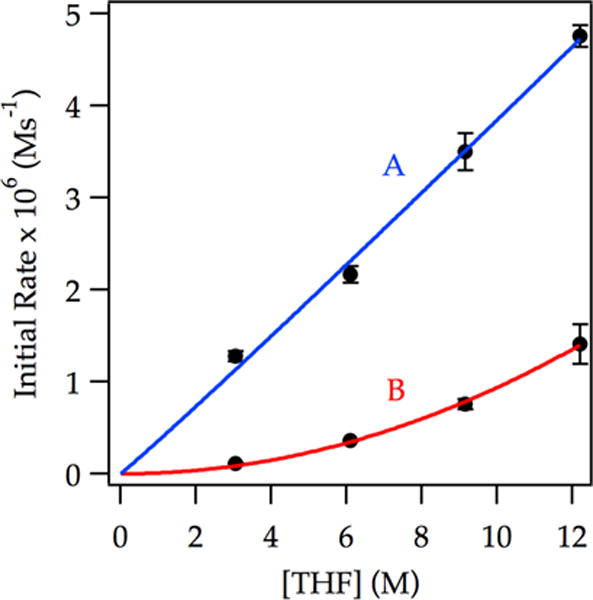
Plot of initial rate vs THF concentration in hexanes for the ortholithiation of ArH (0.0050 M) by 0.20 M LDA (curve A) and 0.050 M LDA (curve B) at −78 °C measured with IR spectroscopy (1323 cm−1). The curves depict unweighted least-squares fits to y = a[THF]n. Curve A: [a = (3.6 ± 0.6) × 10−7, n = (1.03 ± 0.07)]. Curve B: [a = (9 ± 2) × 10−9, n = (2.0 ± 0.1)].
(2) High ArH concentration
Conditions under which the ArH concentration is sufficiently high to establish the zeroth-order plateau in Figure 6 afford a first-order THF dependence. The LDA dependence also appears to follow a first-order dependence up to 0.20 M, above which inexplicable noise appears (see supporting information) for an indeterminate reason.
The rate data afforded the idealized rate law22 described by eq 9 and are consistent with the combination of dimer- and tetramer-based mechanisms depicted collectively in eqs 9–17. At low LDA concentration, the dimer-based mechanism in eqs 10 and 11 dominates, reducing the rate law in eq 9 to the simpler form in eq 12, which retains the mathematical form corresponding to the saturation kinetics shown in Figure 6. The rate law further reduces to eqs 13 and 14 at low and high ArH concentrations, respectively. The tetramer-based pathway (eqs 15 and 16) shows a zeroth-order ArH dependence (eq 17) owing to the high efficiency of subsequent steps including the proton transfer.
| (9) |
Dimer-based mechanism
| (10) |
| (11) |
| (12) |
| (13) |
| (14) |
Tetramer-based mechanism
| (15) |
 |
(16) |
| (17) |
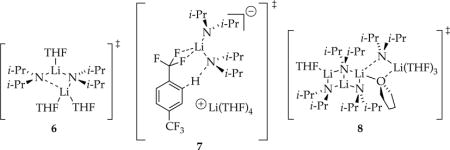
Trisolvated dimer-based rate-limiting steps can be attributed to one of several computationally viable transition structures; open dimer 6 is emblematic.20 The tetrasolvated dimers have occasionally been implicated1,2,23 and attributed to triple ions.24 Although triple ion computations are of no quantitative value because of their ionic bonds,25 the cationic and anionic fragments of transition structure 7 are both computationally viable. The [A4S5]‡ aggregation event is the most computationally intractable. We have successfully computed tetramer-based aggregation events (including some based on LDA ladder structures2e), but a pentasolvate is elusive. We offer transition structure 8 with a ladder motif,26 a high per-lithium coordination number,27 and a bridging THF4,28 simply to provoke thought. Such tetramers have been implicated in LDA subunit exchanges2e and their possible intermediacy en route to monomers have been noted.2d,e
 |
LiCl-catalysis: ArH
Traces of LiCl elicit marked rate accelerations accompanied by an upwardly curving decay (Figure 9). This dramatic effect has been traced to monomer-based lithiations in previous studies without exception.2 Indeed, first-order decays were observed at >1.0 mol% LiCl. Plotting initial rates versus LiCl concentration shows first-order saturation behavior (Figure 10) consistent with shifting the rate-limiting step from LDA deaggregation to ArH-dependent lithiation. Monitoring initial rates at the saturation limit in Figure 10 (1.0 mol % LiCl) revealed a first-order dependence on ArH, half-order dependence on LDA, and second-order THF dependence.29 The idealized rate law (eq 18) is consistent with a trisolvated-monomer-based proton transfer described by eqs 19 and 20. Both [AS2(ArH)]‡ and [AS3(ArH)]‡ stoichiometries have been noted in ortholithiations.2
| (18) |
| (19) |
| (20) |
Figure 9.
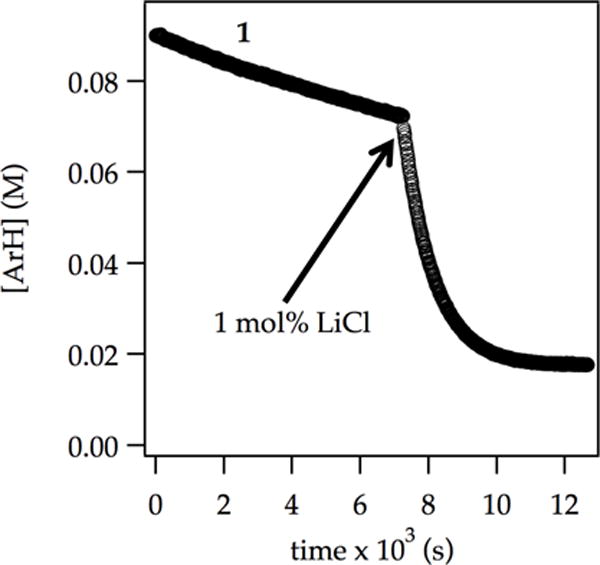
Ortholithiation of ArH (0.090 M) with LDA (0.10 M) in 12.2 M THF at −78 °C monitored using IR spectroscopy (1323 cm−1) with injection of 1.0 mol % LiCl.
Figure 10.
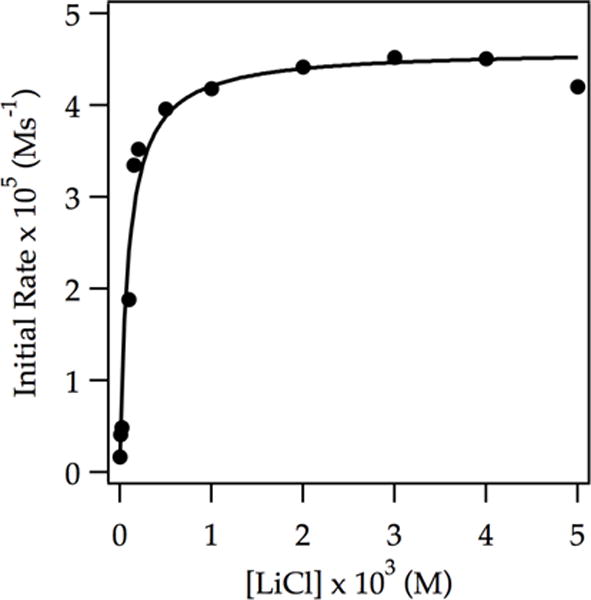
Plot of initial rate vs LiCl concentration for the ortholithiation of ArH (0.050 M) by 0.10 M LDA in 12.2 M THF at −78 °C measured with IR spectroscopy. The curve depicts an unweighted least-squares fit to y = (a[LiCl])/(1 + b[LiCl]) + c. [a = (4.5 ± 0.8) × 10−1, b = (1.0 ± 0.20) × 104, c = (1.70) × 10−6].
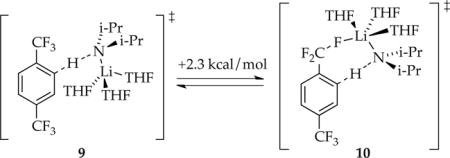
Computational studies of trisolvated monomer-based metalation afforded 9 and 10 as the two most plausible transition structures (eq 21). Although Li–F contacts are crystallographically30 well-precedented and can dominate computational studies of ortholithiation of fluorobenzenes,31 the trisolvation state and Li–F interaction are not synergistic in this case.
 |
(21) |
LiCl catalysis: ArD
As noted for ArH and other substrates explored to date, traces of LiCl have never failed to accelerate metalations, and the acceleration has invariably been traced to LiCl-catalyzed deaggregation to monomer. LiCl has no effect on the metalation rate of ArD in neat THF at −78 °C, however (Figure 11). Of note, the point to the far left in Figure 11 was recorded without added LiCl. Given that the uncatalyzed metalation of ArD occurs via dimer-based metalation as described by eqs 6 and 7, we wondered whether the monomer played any role whatsoever. The answer proved to be definitive and baffling. Rate studies revealed a first order in ArD, half order in LDA, and second order in THF, consistent with the ArD analog of the rate law in eq 18 and the generic monomer-based mechanism described by eqs 19 and 20. Despite no detectable change in rate, LiCl catalysis diverts a dimer-dominated metalation of ArD to a monomer-dominated metalation.
Figure 11.
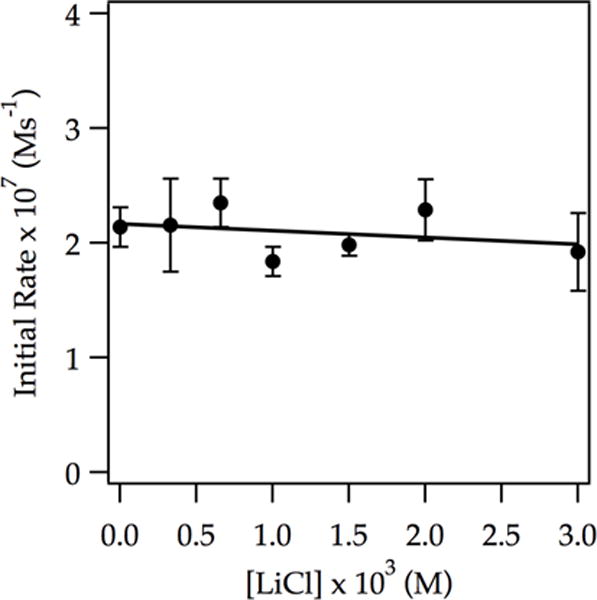
Plot of initial rate vs LiCl concentration for the ortholithiation of ArD (0.0050 M) by 0.10 M LDA in 12.2 M THF at −78 °C measured with IR spectroscopy. The curve depicts an unweighted least-squares fit to y = a[LiCl] + b. [a = (6 ± 8) × 10−9, b = (2.2 ± 0.1) × 10−7].
The plotline takes an odd turn. For reasons that are not germane, we examined the catalysis at −42 °C and found that traces of LiCl inhibit the metalation of ArD (Figure 12). This inhibition is unlike enzyme inhibition: it is catalytic in inhibitor.6 Rate studies in the absence of catalyst showed what appears to be partial saturation in ArD, an intermediate 0.77 order in LDA, and a 1.5 order in THF, implicating contributions from both dimer- and monomer-based mechanisms. At full inhibition (3.0% LiCl), clean first-order dependence on ArD, half-order dependence on LDA, and second-order dependence on THF are consistent with the monomer-based metalation described by eqs 18–20. This finding proved to be important (vide infra).
Figure 12.
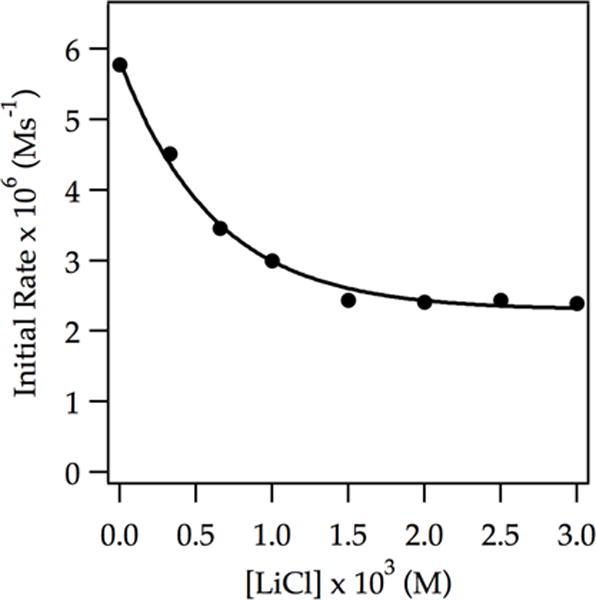
Plot of initial rate vs LiCl concentration for the ortholithiation of ArD (0.0050 M) by 0.30 M LDA in 12.2 M THF at −42 °C measured with 19F NMR spectroscopy. The curve has no particular physical meaning.
Given the LiCl-catalyzed inhibition at −42 °C and no change in rate with added LiCl at −78 °C, we wondered whether we would observe acceleration at lower temperatures. Technical challenges made a full rate study difficult, but several spot checks showed that our supposition was correct: metalations at −90 °C showed modest (twofold) acceleration by LiCl (Figure 13).
Figure 13.
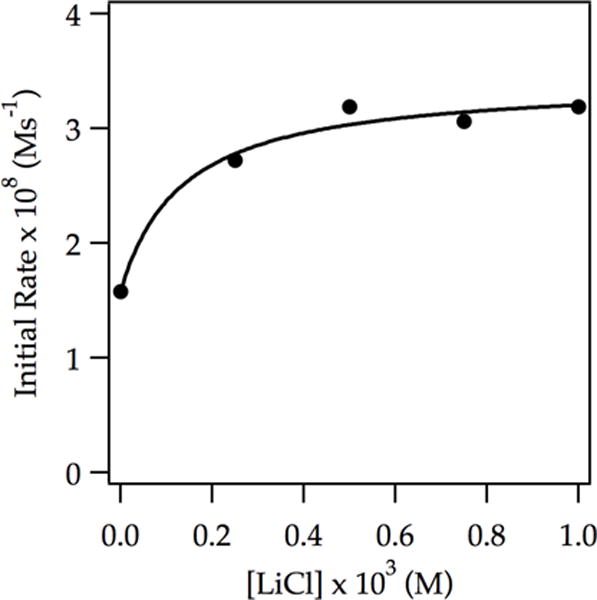
Plot of initial rate vs LiCl concentration for the ortholithiation of ArD (0.0050 M) by 0.10 M LDA in 12.2 M THF at −90 °C measured with IR spectroscopy. The curve depicts an unweighted least-squares fit to y = (a[LiCl])/(1 + b[LiCl]) + c. [a = (1.4 ± 0.5) × 10−7, b = 7 ± 3, c = 1.58 × 10⁻⁸].
Discussion
The deaggregation of LDA dimer 3 proceeds through a variety of forms with variable solvation numbers and placements, as illustrated simplistically in Scheme 1. The barriers to aggregate and solvent exchange reside within a very narrow energetic range,4 resulting in a washboard-like reaction coordinate that wreaks mechanistic havoc when the barriers to the reactions with substrates also fall within this range. Metalations of arene 1 (denoted as ArH) by LDA in THF at −78 °C —conditions under which aggregate exchanges occur with half-lives of minutes2e—produce anomalies similar to those found in several preceding case studies of metalations under such nonequilibrium conditions. Linear decays signifying zeroth-order substrate dependencies and rate-limiting aggregation events are prevalent. (In some instances the rate-limiting step—the maximum along the reaction coordinate—may be a solvation event, but we will not belabor this point and simply call it generically “aggregation” to distinguish it from a “metalation”.) Saturation kinetics often result from rate-limiting metalations at low substrate concentrations that give way to rate-limiting aggregation events at high substrate concentrations. Perdeuterating the substrate to measure isotope effects often causes marked mechanistic changes, routinely forcing us to determine full rate laws for each. (We elaborate on this oddity shortly.)
Scheme 1.
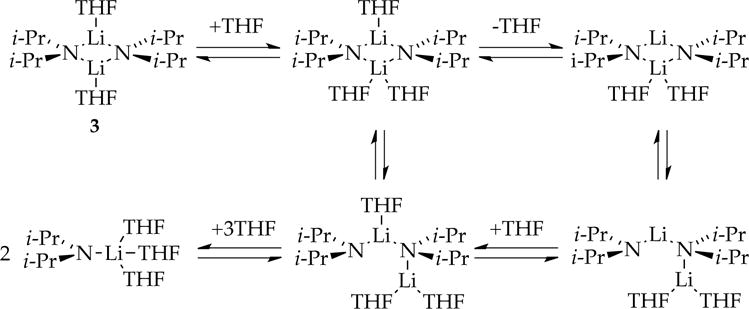
Following a brief summary of the results (Scheme 2), we focus on insights and new questions emanating from the metalation in eq 1, followed by more explicit discussions of the particularly odd role of LiCl catalysis.
Scheme 2.
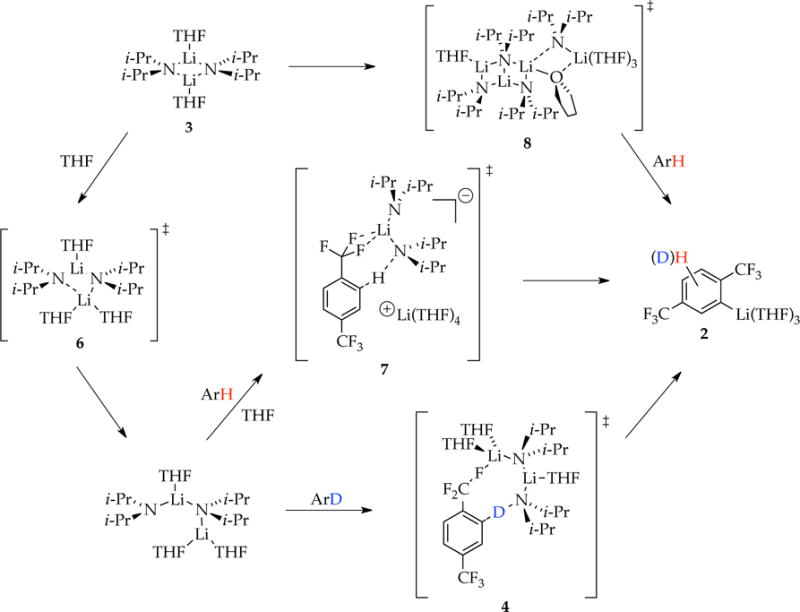
Summary
Using NMR spectroscopic and computational methods, we showed that metalation of ArH with LDA in THF affords trisolvated aryllithium monomer 2 (denoted as ArLi). Rate studies showed that the uncatalyzed metalation of the perdeuterated substrate (ArD) is relatively simple, affording a rate law consistent with a trisolvated dimer-based rate-limiting metalation. Transition structure 4 is emblematic but is not the only computationally viable candidate.4 By contrast, metalation of ArH differing only in the substitution of protium for deuterium reveals two competing pathways corresponding to rate-limiting tetramer-based transition structure [A4S5]‡ and dimer-based transition structures [A2S3]‡ (open dimer 6) and [A2S4(ArH)]‡. The dimer-based mechanism shifts from a rate-limiting aggregation event at high ArH to rate-limiting metalation—[A2S4(ArH)]‡ —at low ArH. Confronted by evidence of highly solvated dimers,1,2,23 we have routinely invoked triple ions similar to 7. Although triple ions are difficult to examine computationally because of electron correlation problems associated with ionic bonds,25 they are amply documented in the structural lithium amide and organolithium literature.24 Similarly, tetramer-based transition structure 8 also defies density functional theory computational methods in our hands as congested aggregates often do; previous studies could only place three solvents on a ladder without fracturing the ladder. Ladder 8 derives support from structurally well-characterized lithium amide ladders23 and well-documented bridging THF ligands.3,28 LDA tetramers have been documented during rate studies of LDA-mediated metalations under nonequilibrium conditions2c,d,e and implicated as being central to subunit exchanges within dimeric LDA.2e Monomer-based chemistry just outside our detection limits at −78 °C (and not shown in Scheme 2) comes into view at elevated temperatures and through LiCl catalysis (vide infra).
Reaction coordinate diagram
Readers who have not followed the papers in the series may find the notion that ArH and ArD proceed via different mechanisms is counterintuitive, maybe even disconcerting. Scheme 3 illustrates how isotopically sensitive changes in mechanism can occur. To clarify an important point, we refer to Scheme 3 as a reaction coordinate diagram rather than a free energy diagram because it connotes relative barrier heights but lacks the implicit balancing and fixed concentrations. As is always true but often overlooked, the positions of peaks and troughs depend consequentially on concentrations and isotopic substitution. The depiction in Scheme 3 represents a single snapshot of a highly fluctional reaction coordinate. Higher LDA and THF concentrations stabilize intermediates and transition states of higher aggregates and higher solvates, respectively. Of special note, the zero-point energies are retained in the barriers corresponding to aggregation events that precede metalation. The transition states may also retain inherent isotopic sensitivities. A simple (two-body) analysis assumes that the isotopic sensitivities are lost in the transition state as the key stretch becomes the reaction coordinate.32 Ortholithiations, however, display very large isotope effects in the range of 20–60,2,33 forcing us to consider contributions from tunnelling.34 Tunnelling inverts the isotopic sensitivity relative to the zero-point energy in the ground states. When we consider the roles of close barrier heights, zero-point energies, and tunneling together, we begin to see how changes in concentration and isotopic substitution can cause considerable reordering of the barrier heights if they reside within a narrow energetic window.
Scheme 3.
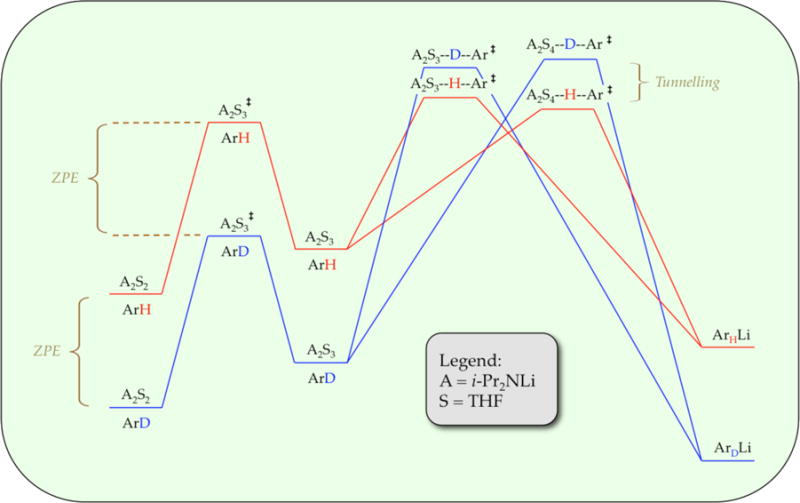
Rate limitation: barriers in parallel versus in series
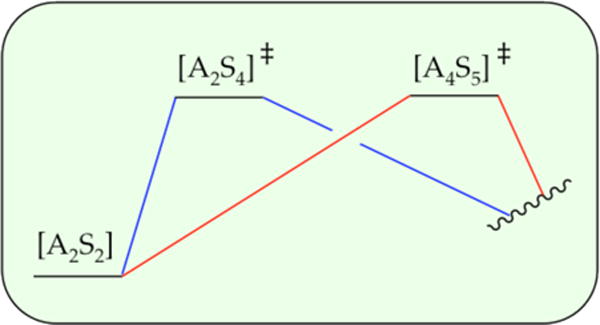
The rate law for metalation of ArH was suggested to reflect the operation of A2S4- and A4S5-based transition structures in parallel as depicted simplistically in Scheme 4. Low LDA and high THF concentrations favor the highly solvated dimer-based pathway, whereas high LDA and low THF concentrations favor the more aggregated but lower-per-lithium-solvated tetramer-based pathway. How do we know that the two barriers are not aligned sequentially as depicted in Scheme 5? In short, serially aligned barriers have the opposite concentration dependencies on the rate-limiting step and affiliated rate law. In the parallel sequence (Scheme 4), dimer stabilization would shift the rate-limiting step toward the dimer and make the rate law dimer-like mathematically (first order in LDA and second order in THF). By contrast, stabilizing the dimer-based transition state in the serial sequence (Scheme 5) shifts the rate-limiting step to the tetramer, making the rate law tetramer-like (second order in LDA and first order in THF). Similarly, stabilizing the tetramer-based transition state in the serial sequence (Scheme 5) shifts the rate-limiting step to the dimer, making the rate law dimer-like. However, modest ambiguity stems from the possibility of other serially aligned transition structures such as those shown in Scheme 6. Although Schemes 5 and 6 are distinguishable from the parallel pathways in Scheme 4 in theory, such a distinction might be difficult in the impure world of experimental kinetics. We present this ambiguity more as a point of interest than as a pressing problem. Additional data—a new view with a different substrate—could abruptly resurrect this debate, however.
Scheme 4.
Scheme 5.
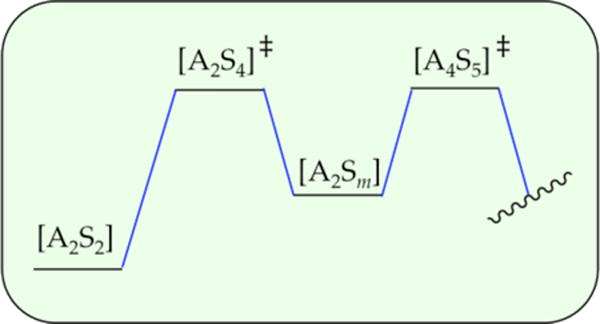
Scheme 6.
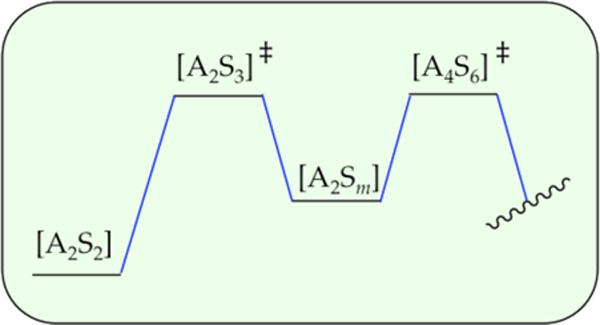
Autocatalysis
The metalation of ArH offers a rare example of an LDA-mediated metalation under nonequilibrium conditions that does not display autocatalysis.2 In previous studies, pronounced autocatalysis by aryllithiums was initially believed to arise from catalyzed dimer-to-monomer conversion,2d although a recent study of 1,4-difluorobenzene traced weak autocatalysis to a catalyzed LDA dimer-to-dimer conversion.2e We wondered whether autocatalysis was absent in the metalation of ArH because the metalation is marginally susceptible to such catalysis or because aryllithium 2 is a poor catalyst. The answer turns out to be both. We found that the metalation of the 1,4-difluorobenzene studied previously2e is only marginally catalyzed by aryllithium 2 and the metalation of arene 1 is only marginally catalyzed by ortholithiated 1,4-difluorobenzene. These observations serve as a segue to the discussion of some odd catalytic effects of LiCl.
LiCl catalysis
Ortholithiation of ArH in the presence of traces (<2 mol %) of LiCl showed a marked acceleration. Rate studies revealed the LiCl-catalyzed LDA dimer-to-monomer conversion noted for all LDA-mediated metalations in THF at −78 °C studied to date.2 The solvent order and computations supported transition structure 9 (eq 21). A minor oddity occurred, however. If LiCl is catalyzing the same deaggregation, the order in LiCl should be the same in all cases, but it is not. A first-order dependence on LiCl concentration (Figure 10 and eqs 17–19) was observed rather than the more frequently observed second-order LiCl dependence. We could easily imagine variation from investigator to investigator—these kinetics are technically quite difficult. However, one of the second-order LiCl dependencies2c,d,e and the first-order LiCl dependence noted herein were measured by the same researcher (JL). We cannot explain this minor incongruence. Regardless, far more interesting oddities showed up in studies of LiCl-catalyzed ArD metalations.
Metalation of ArD with LDA in THF at −78 °C in the presence of varying quantities of LiCl showed no change in rate whatsoever (Figure 11). When the rate law was determined with added LiCl, however, the mechanism had shifted from an [A2S3]‡-based rate-limiting step in the absence of LiCl to [AS3(ArD)]‡-based rate limiting step with added LiCl. The rate law changed with no discernible change in the rate.
The plot thickened when we changed the temperature of the metalation. Uncatalyzed metalations at −42 °C showed mixed orders consistent with a composite of [A2S3(ArD)]‡ and [AS3(ArD)]‡, suggesting that a monomer-based metalation had been lurking just below the surface. The fact that changes in temperature brought it into view is not surprising, and why raising the temperature did so is not really of interest to us. However, rate studies at −42 °C with added LiCl revealed LiCl-catalyzed inhibition (Figure 11) and an accompanying shift in the rate law toward [AS3(ArD)]‡. On a hunch that the LiCl-independent rates at −78 °C might result from a cancellation or coincidence of factors, we investigated the effect of LiCl at −90 °C and found that, indeed, LiCl accelerates the metalation (Figure 13).
The acceleration by LiCl at the lowest temperatures and deceleration at the highest temperatures is unique and unexpected but not altogether irrational. The principle of detailed balance and the accumulated wisdom of enzyme kineticists suggest that the inhibition of systems at equilibrium requires the stoichiometric binding of the active species. Analogy with photochemical desensitizers and other complex systems,6 however, shows that nonequilibrium systems can be susceptible to catalyzed inhibition.
The simplified model in Scheme 7 in conjunction with numerical integration captures much of what is needed to explain LiCl-catalyzed inhibition. The differential equations and underlying calculations are not particularly germane to the discussion and are relegated to the supporting information.
Scheme 7.
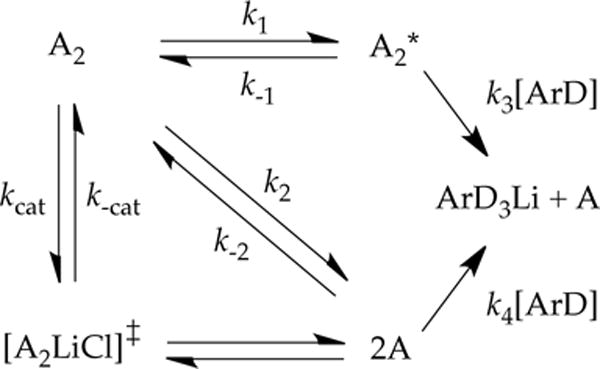
The rate studies told us that the dimer-based mechanism (A2→A2*→product) proceeds with rate limitation shared by the dimer-based deaggregation and dimer-based metalation (k−1 ~ k3[ArD]).35 Dimer-based metalation affords ArLi and releases an equivalent of monomer A. At equilibrium, the population of A is defined by k2/k−2, but under nonequilibrium conditions the exchange is slow. If monomer A is trapped efficiently relative to a much slower reaggregation to dimer (k4[ArD] ≫ k−2[A]), each rate-limiting dimer-based metalation affords 2 equiv of ArLi product. Now imagine that we introduce catalytic LiCl to hasten the A2–2A exchange and bring it to equilibrium. Both kcat and k−cat implicitly include LiCl, but the LiCl concentrations cancel in kcat/k−cat, which is necessarily equivalent to k2/k−2 (We’ve included [A2LiCl]‡ transition structure to underscore the nature of this catalysis and symmetrize the scheme but it is not mathematically germane.)
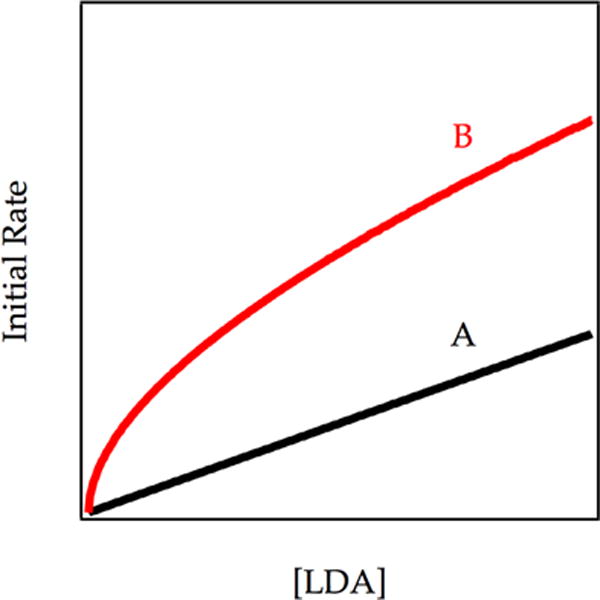
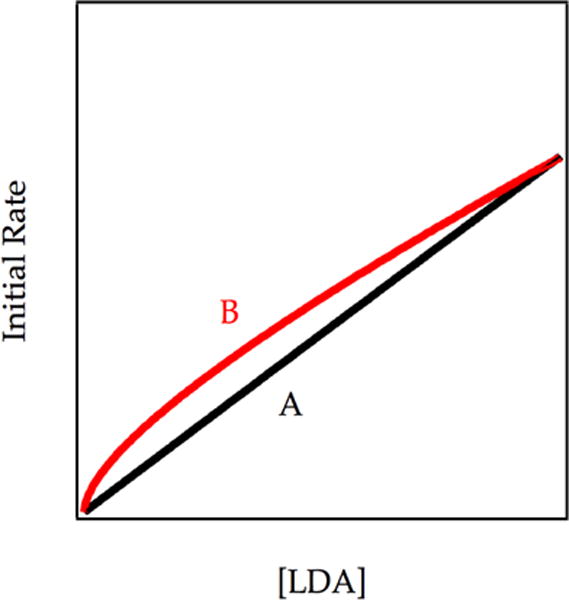
We discuss below three limiting scenarios describing the influence of catalysis on the steady state concentration of monomer A and, consequently, the rate of metalation (Figure 14). The three behaviors in Figure 14 qualitatively correspond to metalations at −42 °C (Scenario 1), −78 °C (Scenario 2), and −90 °C (Scenario 3). The initial rates are normalized to the same initial rate of the LiCl-free metalation although experimentally they were obviously quite different. Simulations in Figure 14 as well as in Figures 15–17 were generated from the model in Scheme 7 via numerical integration. The numerical debris—numbering and units on axes—has been omitted for clarity but is retained in a more detailed analysis in the supporting information.
Figure 14.
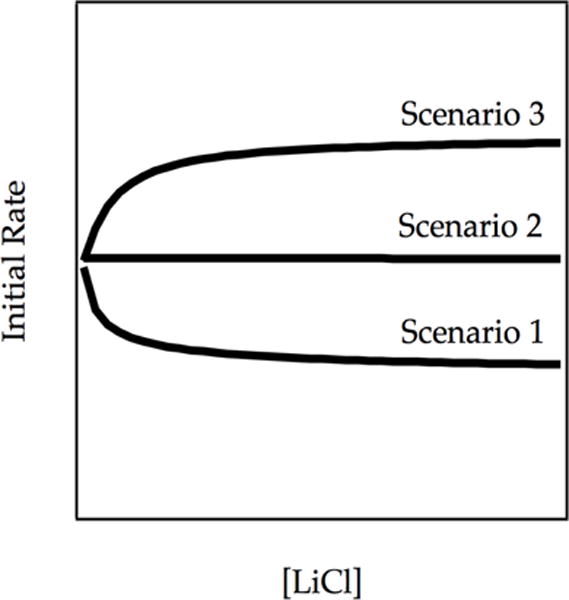
Plot of initial rate vs [LiCl] showing catalyzed inhibition (Scenario 1), no change in rate (Scenario 2), and catalyzed acceleration (Scenario 3). The curves result from numerical integrations (simulations) of the model in Scheme 7.
Figure 15.

Plot of initial rate vs [LDA] concentration reflecting changing LDA dependencies with catalysis within scenario 1 (inhibition): curve A (black) corresponds to dimer-based metalation without any added LiCl; curve B (blue) corresponds to partial inhibition retaining both dimer and monomer reactivity at saturation. curve C (green) corresponds to full inhibition retaining only dimer-based reactivity at saturation. The curves result from numerical integrations (simulations) of the model in Scheme 7.
Figure 17.
Plot of initial rate vs [LDA] for Scenario 3 (Figure 14). Curve A (black) reflects the LDA order of the uncatalyzed (dimer-dominated) metalation; Curve B reflects the fully LiCl-catalyzed metalation (high LiCl portion of Scenario 2 in Figure 14). The curves result from numerical integrations (simulations) of the model in Scheme 7.
Scenario 1
The steady-state concentration of A delivered exclusively by the dimer-based pathway (A2→A2*→A+ArLi) is higher than the equilibrium population of A. Simulations derived from Scheme 7 reveal catalytic inhibition akin to that seen at −42 °C (Figure 12). Introducing the catalyst and establishing equilibrium causes a net decrease in the steady-state concentration of A available for conversion to product and an affiliated decrease in the measured reaction rate (Figure 14, Scenario 1). To the extent that the decrease in the concentration of A is pronounced, the inhibition approaches a factor of two in the limit: each dimer-based deaggregation event produces one rather than two molecules of ArLi.
Simulations of the LDA dependence show that catalyzed inhibition will cause changes in the law (Figure 15). Curve A shows a first-order LDA dependence of an uninhibited metalation owing to exclusively the dimer-based pathway. Curve C shows the case in which the catalysis causes a marked depletion of the monomer concentration and retains the linearity associated with dimer reactivity but a factor of two loss in rate. Curve B shows the most interesting case in which reduction of monomer concentration is less pronounced. The A2–2A preequilibrium contributes appreciably to monomer-based metalation (Scheme 7). A fractional LDA order—less than one and greater than one half—reflects the funneling of the metalation through the dimer-based pathway and via the dimer–monomer pre-equilibrium. Thus, when catalysis establishes the dimer–monomer equilibration and reduces the concentration of monomer, the model predicts a rate decrease and intermediate LDA order.
Scenario 2
The steady-state concentration of A delivered exclusively by the dimer-based-metalation is identical to the population of A at equilibrium as depicted experimentally in Figure 11 and simulated in Figure 14 (Scenario 2). Because restoring the A2–2A equilibrium results in no change in the concentration of A (confirmed by simulation), the metalation rate is unchanged. The rate law will, however, show an intermediate fractional order because the rate of reaction reflects balanced contributions from dimer-based and fully equilibrated monomer-based metalations. Anticipated LDA dependencies in Figure 16 show nominally different rates with measurably different LDA orders.
Figure 16.
Plot of initial rate vs [LDA] for the two circumstances depicted in Figure 14 (Scenario 2). Curve A (black) reflects the LDA order of the uncatalyzed metalation (corresponding to the y intercept in Figure 14). Curve B reflects the fully LiCl catalyzed metalation (high LiCl portion of Scenario 2 in Figure 14). The curves result from numerical integrations (simulations) of the model in Scheme 7.
Scenario 3
The steady-state concentration of A delivered by the dimer-based metalation is below the equilibrium population of A. Establishing the A2–2A equilibrium through catalysis increases the steady state concentration of A with a consequent increase in the observable rate (Figure 14, Scenario 3). The LDA dependence (Figure 17, curve B) shows acceleration and curvature consistent with a monomer-dominated metalation.
It is satisfying that the simple model in Scheme 7 replicates the experimentally observed LiCl-catalyzed acceleration and inhibition. Catalyzed inhibition was a notion that we would have declared impossible before completing these rate studies, and it is uniquely characteristic of nonequilibrium conditions.6 The model also qualitatively reflects observed changes in the rate laws affiliated with the catalysis. Despite the qualitative successes, however, quantitative inconsistencies remain. Although changes in the rates and the rate laws are nicely reflected by simulations using the model in Scheme 7, there are discrepancies in the experimentally determined LDA orders with the predicted values from the simulations. Nonetheless, given the simplifications in the model, we find this study to be an excellent proof of principle, and the implications of the model, even in isolation, are provocative.
Conclusion
This paper is likely to be the last in a series describing metalations using LDA under nonequilibrium conditions, all contributing to a single chapter in narrative about LDA structure-reactivity relationships. Understanding how different substrates could be subjected to different rate-limiting deaggregations of widely varying stoichiometries took considerable effort. Variations in the catalytic effects of LiX salts stem from the catalysis of various steps along a complex cascade of fleeting intermediates that are not in fully established equilibria. Each substrate and even isotopologues of a single substrate provide different views of the cascade. The present study underscored some familiar paths and principles yet also ventured into uncharted territory. The LiCl-catalyzed inhibition of the metalation and the mathematical model showing its plausibility through numerical simulation constitute the cornerstone of this work. Residual quantitative discrepancies trouble us, but oddities rearing their ugly heads throughout these studies have often resolved in subsequent case studies. With that said, we may have reached the logical completion of the study of LDA metalations under nonequilibrium conditions, which has been an eye-opening exposure to the role of rate limitation in complex reaction mechanisms. Given the prevalence of LDA-mediated metalations in THF at −78 °C, the irony that these same conditions generate such complexity is difficult to overlook. The final chapter is likely to be a review that focuses on what this series of rate studies has taught us about rate limitation.
Experimental Section
Reagents and solvents
THF, Et2O, and hexane were distilled from blue or purple solutions containing sodium benzophenone ketyl. The hexane contained 1% tetraglyme to dissolve the ketyl. Et3N–HCl was recrystallized from THF/2-propanol.36 Literature procedures9 were modified to prepare LDA as a LiCl- and ligand-free solid.2b Solutions of LDA were titrated using a literature method.37
IR spectroscopic analyses
IR spectra were recorded using an in situ IR spectrometer fitted with a 30-bounce, silicon-tipped probe. The spectra were acquired in 16 scans at a gain of 1 and a resolution of 4 cm−1. A representative reaction was carried out as follows: The IR probe was inserted through a nylon adapter and O-ring seal into an oven-dried, cylindrical flask fitted with a magnetic stir bar and a T-joint. The T-joint was capped with a septum for injections and a nitrogen line. After evacuation under full vacuum, heating, and flushing with nitrogen, the flask was charged with LDA (108 mg, 1.01 mmol) in THF and cooled in a dry ice–acetone bath prepared with fresh acetone. LiCl was added via a THF stock solution prepared from Et3N•HCl and LDA. After recording a background spectrum, we added ArH (0.76 mmol) with stirring. For the most rapid reactions, IR spectra were recorded every 3 s with monitoring of the absorbance at 1323 cm−1 over the course of the reaction.
NMR spectroscopic analyses
All NMR samples were prepared using stock solutions and sealed under partial vacuum. Standard 6Li, 13C, 15N, and 19F NMR spectra were recorded on a 500 MHz spectrometer at 73.57, 125.79, 50.66, and 470.35 MHz, respectively. The 6Li, 13C, and 15N resonances are referenced to 0.30 M [6Li]LiCl/MeOH at −90 °C (0.0 ppm), the CH2O resonance of THF at −90 °C (67.57 ppm), and neat Me2NEt at −90 °C (25.7 ppm).
2,3,5,6-Tetradeutero-1,4-bis(trifluoromethyl)benzene (1-d4)
A 10.6 M solution of n-BuLi in hexane (4.70 mL, 50.0 mmol) was added via syringe pump to a solution of 1,4-bis(trifluoromethyl)benzene (7.0 mL, 45.2 mmol) in 150 mL of dry THF at −78 °C under argon over 20 min. The solution was stirred for an additional 25 min. MeOD (2.03 mL, 50.0 mmol) was added via syringe pump over 20 min. The mixture was allowed to stir for 1 hr. The process of sequential addition of 1.1 equiv n-BuLi and 1.1 equiv MeOD was repeated five additional times. A final aliquot of MeOD (10 mL, 5.0 equiv) was added to quench the reaction fully. After the mixture was allowed to warm to room temperature, the pH was adjusted to 1.0 with 4.0 M aqueous HCl to dissolve all lithium salts. The organic and aqueous layers were separated, and the organic layer was extracted with additional cold 0.20 M HCl to remove excess THF. The extraction was stopped when the total organic volume was approximately 10–15 mL. The organic layer was dried over Na2SO4 and distilled. The product was collected as a colorless liquid (2.26 g, 10.4 mmol) in 23% yield via distillation at 116 °C. 13C NMR δ 134.20 (q, 2JC–F = 33.2 Hz), 125.75 (tq, 1JC–D = 25.5 Hz, 3JC–F = 3.3 Hz), 123.80 (q, 1JC–F = 272.1 Hz); LRMS: 218.2 m/z shows 98% 1-d4.
Numeric integrations
The time-dependent concentration plots obtained using IR spectroscopy were fit to mechanistic models expressed by a set of differential equations. The curve-fitting operation minimizes chi-square in searching for the coefficient values (rate constants). The Levenberg–Marquardt algorithm38 was used for the chi-square minimization and is a form of nonlinear, least-squares fitting. The fitting procedure implements numeric integration based on the backward differentiation formula39 to solve the differential equations, yielding functions describing concentration versus time.
Supplementary Material
Acknowledgments
We thank the National Institutes of Health (GM039764) and the National Science Foundation (CHE 0650880) for support.
Footnotes
Supporting Information: Spectra, additional Job plots, and authors for reference 13. This material is available free of charge via the Internet at http://pubs.acs.org.
Notes
The authors declare no competing financial interests.
References and Footnotes
- 1.Collum DB, McNeil AJ, Ramírez A. Angew Chem, Int Ed. 2007;46:3002. doi: 10.1002/anie.200603038. [DOI] [PubMed] [Google Scholar]
- 2.(a) J, Hoepker AC, Collum DB. J Am Chem Soc. 2008;130:18008. doi: 10.1021/ja807331k. [DOI] [PMC free article] [PubMed] [Google Scholar]; (b) Ma Y, Hoepker AC, Gupta L, Faggin MF, Collum DB. J Am Chem Soc. 2010;132:15610. doi: 10.1021/ja105855v. [DOI] [PMC free article] [PubMed] [Google Scholar]; (c) Hoepker AC, Gupta L, Ma Y, Faggin MF, Collum DB. J Am Chem Soc. 2011;133:7135. doi: 10.1021/ja200906z. [DOI] [PMC free article] [PubMed] [Google Scholar]; (d) Gupta L, Hoepker AC, Ma Y, Viciu MS, Faggin MF, Collum DB. J Org Chem. 2013;78:4214. doi: 10.1021/jo302408r. [DOI] [PMC free article] [PubMed] [Google Scholar]; (e) Liang J, Hoepker AC, Bruneau AM, Ma Y, Gupta L, Collum DB. J Org Chem. 2014;53:11885. doi: 10.1021/jo501392r. [DOI] [PMC free article] [PubMed] [Google Scholar]
- 3.Gupta L, Hoepker AC, Singh KJ, Collum DB. J Org Chem. 2009;74:2231. doi: 10.1021/jo802713y. [DOI] [PMC free article] [PubMed] [Google Scholar]
- 4.Hoepker AC, Collum DB. J Org Chem. 2011;76:7985. doi: 10.1021/jo2015642. [DOI] [PMC free article] [PubMed] [Google Scholar]
- 5.For an example of the butyllithium-based ortholithiation of arene 1, see:; Coffer PK, Dillon KB, Howard JAK, Yufit Dmitry S, Zorina NV. J Chem Soc Dalton Trans. 2012;41:4460. doi: 10.1039/c2dt12369j. [DOI] [PubMed] [Google Scholar]
- 6.For an example of an inhibition owing to a catalyzed hydrogen atom dimerization see:; Casias CR, McKinnon JT. Combust Sci Technol. 1996:116–117. 289. [Google Scholar]; For a review of related catalyzed radical couplings and affiliated inhibitions, see; Linteris GT, Rumminger MD, Babushok VI. Catalytic inhibition of laminar flames by transition metal compounds. Prog Energy Combust Sci. 2008;34:288. [Google Scholar]
- 7.(a) Quéguiner G, Marsais F. Snieckus, Epsztajn. J Adv Heterocycl Chem. 1991;52:187. [Google Scholar]; (b) Mongin F, Quéguiner G. Tetrahedron. 2001;57:5897. [Google Scholar]; (c) Mongin F, Quéguiner G. Tetrahedron. 2001;57:4059. [Google Scholar]; (d) Merino P. Prog Heterocycl Chem. 1999;11:21. [Google Scholar]; (e) Clayden J. In: The Chemistry of Organolithium Compounds. Rappoport Z, Marek I, editors. Vol. 1. Wiley; New York: 2004. p. 495. [Google Scholar]; (f) Caubere P. Reviews of Heteroatom Chemistry. Vol. 4. MYU; Tokyo: 1991. pp. 78–139. [Google Scholar]; (g) Caubere P. Chem Rev. 1993;93:2317. [Google Scholar]; (h) Marsais F, Quéguiner G. Tetrahedron. 1983;39:2009. [Google Scholar]; (i) Collins I. Perkin. 2000;1:2845. [Google Scholar]; (j) Schlosser M, Mongin F. Chem Soc Rev. 2007;36:1161. doi: 10.1039/b706241a. [DOI] [PubMed] [Google Scholar]; (k) Hartung CG, Snieckus V. In: Modern Arene Chemistry. Astruc D, editor. Wiley-VCH; Weinheim: 2002. Chapter 10. [Google Scholar]; (l) Snieckus V. Chem Rev. 1990;90:879. [Google Scholar]; (m) Taylor CM, Watson AJ. Curr Org Chem. 2004;8:623. [Google Scholar]; (n) Bakker WII, Wong PL, Snieckus V. Lithium Diisopropylamide. In: Paquette LA, editor. e-EROS. John Wiley; New York: 2001. [Google Scholar]
- 8.For examples of reactions that are fast relative to the rates of aggregate–aggregate exchanges see:; (a) McGarrity JF, Ogle CA. J Am Chem Soc. 1985;107:1810. [Google Scholar]; (b) Jones AC, Sanders AW, Bevan MJ, Reich HJ. J Am Chem Soc. 2007;129:3492. doi: 10.1021/ja0689334. [DOI] [PubMed] [Google Scholar]; (c) Thompson A, Corley EG, Huntington MF, Grabowski EJJ, Remenar JF, Collum DB. J Am Chem Soc. 1998;120:2028. [Google Scholar]; (d) Jones AC, Sanders AW, Sikorski WH, Jansen KL, Reich HJ. J Am Chem Soc. 2008;130:6060. doi: 10.1021/ja8003528. [DOI] [PubMed] [Google Scholar]; (e) Kolonko KJ, Wherritt DJ, Reich HJ. J Am Chem Soc. 2011;133:16774. doi: 10.1021/ja207218f. [DOI] [PubMed] [Google Scholar]; (f) Reich H. J Chem Rev. 2013;113:7130. doi: 10.1021/cr400187u. [DOI] [PubMed] [Google Scholar]
- 9.Kim Y-J, Bernstein MP, Galiano-Roth AS, Romesberg FE, Fuller DJ, Harrison AT, Collum DB, Williard PG. J Org Chem. 1991;56:4435. For a improved preparation of LiCl-free LDA, see ref 2b. [Google Scholar]
- 10.(a) Gakh YG, Gakh AA, Gronenborn AM. Magn Reson Chem. 2000;38:551. [Google Scholar]; (b) McGill CA, Nordon A, Littlejohn D. J Process Analyt Chem. 2001;6:36. [Google Scholar]; (c) Espinet P, Albeniz AC, Casares JA, Martinez-Ilarduya JM. Coor Chem Rev. 2008;252:2180. [Google Scholar]
- 11.For leading references to 19F NMR spectroscopy in organolithium chemistry, see ref 2c.
- 12.6Li is spin one. For a review of 6Li NMR spectroscopy, see:; Günther H. J Braz Chem. 1999;10:241. [Google Scholar]
- 13.Frisch MJ, et al. GaussianVersion 3.09. Gaussian, Inc; Wallingford, CT: 2009. revision A.1. [Google Scholar]
- 14.The computations use the Gaussian standard state of 1.0 atm. If the THF concentration is corrected to neat THF (approximately 12 M), each solvation step benefits from approximately 2.0 kcal/mol of additional stabilization at −78 °C (195 K); Pratt LM, Merry S, Nguyen SC, Quan P, Thanh BT. Tetrahedron. 2006;62:10821. [Google Scholar]
- 15.For a review of in situ IR spectroscopic studies, see:; Rein AJ, Donahue SM, Pavlosky MA. Curr Opin Drug Discovery Dev. 2000;3:734. [PubMed] [Google Scholar]
- 16.Casado J, Lopez-Quintela MA, Lorenzo-Barral FM. J Chem Educ. 1986;63:450. [Google Scholar]
- 17.(a) Besson C, Finney EE, Finke RG. J Am Chem Soc. 2005;127:8179. doi: 10.1021/ja0504439. [DOI] [PubMed] [Google Scholar]; (b) Besson C, Finney EE, Finke RG. Chem Mater. 2005;17:4925. doi: 10.1021/ja0504439. [DOI] [PubMed] [Google Scholar]; (c) Huang KT, Keszler A, Patel N, Patel RP, Gladwin MT, Kim-Shapiro DB, Hogg N. J Biol Chem. 2005;280:31126. doi: 10.1074/jbc.M501496200. [DOI] [PubMed] [Google Scholar]; (d) Huang Z, Shiva S, Kim-Shapiro DB, Patel RP, Ringwood LA, Irby CE, Huang KT, Ho C, Hogg N, Schechter AN, Gladwin MT. J Clin Invest. 2005;115:2099. doi: 10.1172/JCI24650. [DOI] [PMC free article] [PubMed] [Google Scholar]; (e) Tanj S, Ohno A, Sato I, Soai K. Org Lett. 2001;3:287. doi: 10.1021/ol006921w. [DOI] [PubMed] [Google Scholar]; (f) Barrios-Landeros F, Carrow BP, Hartwig JF. J Am Chem Soc. 2008;130:5842. doi: 10.1021/ja711159y. [DOI] [PMC free article] [PubMed] [Google Scholar]
- 18.The rate law provides the stoichiometry of the transition structure relative to that of the reactants:; Edwards JO, Greene EF, Ross J. J Chem Educ. 1968;45:381. [Google Scholar]
- 19.The concentration of LDA, although expressed in units of molarity, refers to the concentration of the monomer unit (normality). The concentration of THF is expressed as total concentration of free (uncoordinated) ligand.
- 20.For leading references to spectroscopic, crystallographic, and kinetic evidence of open dimers, see:; Ramirez A, Sun X, Collum DB. J Am Chem Soc. 2006;128:10326. doi: 10.1021/ja062147h. [DOI] [PubMed] [Google Scholar]
- 21.Given the high melting point of substrate 1, injection of large quantities of ArD causes the substrate to freeze at the needle tip.
- 22.We define the idealized rate law as that obtained by rounding the observed reaction orders to the nearest rational order.
- 23.Ma Y, Collum DB. J Am Chem Soc. 2007;129:14818. doi: 10.1021/ja074554e. [DOI] [PMC free article] [PubMed] [Google Scholar]
- 24.For an attempted comprehensive bibliography of anionic triple ions of lithium salts (X-Li-X–), see:; (a) Ma Y, Ramirez A, Singh KJ, Keresztes I, Collum DB. J Am Chem Soc. 2006;128:15399. doi: 10.1021/ja060964b. [DOI] [PubMed] [Google Scholar]; For more recent examples see:; (b) Kolonko KJ, Guzei IA, Reich HJ. J Org Chem. 2010;75:6163. doi: 10.1021/jo100970r. [DOI] [PubMed] [Google Scholar]; (c) Kolonko KJ, Biddle MM, Guzei IA, Reich HJ. J Am Chem Soc. 2009;131:11525. doi: 10.1021/ja903479p. [DOI] [PubMed] [Google Scholar]; (d) Das D. J Solution Chem. 2008;37:947. [Google Scholar]
- 25.Cohen AJ, Mori-Sánchez P, Yang W. Science. 2008;321:792. doi: 10.1126/science.1158722. [DOI] [PubMed] [Google Scholar]
- 26.For crystallographically characterized examples of lithium amide ladder structures showing open-dimer-like subunits, see; Armstrong DR, Barr D, Clegg W, Hodgson SM, Mulvey RE, Reed D, Snaith R, Wright DS. J Am Chem Soc. 1989;111:4719. [Google Scholar]
- 27.For examples of high coordinate lithium, see reference 20.
- 28.Representative examples of structurally characterized bridging THF ligands:; (a) Pratt LM, Merry A, Nguyen SC, Quanb P, Thanh BT. Tetrahedron. 2006;62:10821. [Google Scholar]; (b) Clegg W, Liddle ST, Mulvey RE, Robertson A. Chem Commun. 1999;511 [Google Scholar]; (c) Boche G, Boie C, Bosold F, Harms K, Marsch M. Angew Chem, Int Ed. 1994;33:115. [Google Scholar]; (d) Daniele S, Drost C, Ghrhus B, Hawkins SM, Hitchcock PB, Lappert MF, Merle PG, Bott SG. J Chem Soc Dalton Trans. 2001:3179. [Google Scholar]; (e) Chivers T, Fedorchuk C, Parvez M. Inorg Chem. 2004;43:2643. doi: 10.1021/ic0352755. [DOI] [PubMed] [Google Scholar]; (f) Briand GG, Chivers T, Parvez M. J Chem Soc, Dalton Trans. 2002:3785. [Google Scholar]
- 29.Medium effects can be detected by replacing a hydrocarbon cosolvent with a more polar but still weakly coordinating ethereal solvent such as diethyl ether or 2,2-dimethyltetrahydrofuran. Only the monomer-based pathway showed any evidence of such a cosolvent dependence.
- 30.Selected examples of fully-characterized through-space Li–F interactions:; (a) Armstrong DR, Khandelwal AH, Kerr LC, Peasey S, Raithby PR, Shields GP, Snaith R, Wright DS. Chem Commun. 1998;1011 [Google Scholar]; (b) Plenio H, Diodone R. J Am Chem Soc. 1996;118:356. [Google Scholar]; (c) Henderson KW, Dorigo AE, Liu Q-Y, Williard PG. J Am Chem Soc. 1997;119:11855. [Google Scholar]; (d) Kessar SV, Singh P, Singh KN, Bharatam PV, Sharma AK, Lata S, Kaur A. Angew Chem, Int Ed. 2008;47:4703. doi: 10.1002/anie.200705967. [DOI] [PubMed] [Google Scholar]; (e) Lee W-Y, Liang L-C. Inorg Chem. 2008;47:3298. doi: 10.1021/ic702293d. [DOI] [PubMed] [Google Scholar]; (f) Stalke D, Klingebiel U, Sheldrick GM. Chem Ber. 1988;121:1457. [Google Scholar]; (g) Sini G, Tessier A, Pytkowicz J, Brigaud T. Chem Eur J. 2008;14:3363. doi: 10.1002/chem.200701604. and references cited therein. [DOI] [PubMed] [Google Scholar]
- 31.Chadwick ST, Rennels RA, Rutherford JL, Collum DB. J Am Chem Soc. 2000;122:8640. [Google Scholar]
- 32.Carpenter BK. Determination of Organic Reaction Mechanisms. Wiley; New York: 1984. [Google Scholar]
- 33.(a) Anderson DR, Faibish NC, Beak P. J Am Chem Soc. 1999;121:7553. [Google Scholar]; (b) Singh KJ, Collum DB. J Am Chem Soc. 2006;128:13753. doi: 10.1021/ja064655x. [DOI] [PubMed] [Google Scholar]; (c) Meyers AI, Mihelich ED. J Org Chem. 1975;40:3158. [Google Scholar]; (d) Ramirez A, Sun X, Collum DB. J Am Chem Soc. 2006;128:10326. doi: 10.1021/ja062147h. [DOI] [PubMed] [Google Scholar]; (e) Sun X, Collum DB. J Am Chem Soc. 2000;122:2452. [Google Scholar]; (f) Whisler MC, MacNeil S, Snieckus V, Beak P. Angew Chem, Int Ed. 2004;43:2206. doi: 10.1002/anie.200300590. [DOI] [PubMed] [Google Scholar]; (g) See reference 31
- 34.Bell RP. The Tunnel Effect in Chemistry. Chapman & Hall; New York: 1980. [Google Scholar]
- 35.(a) Stegelmann C, Andreasen A, Campbell CT. J Am Chem Soc. 2009;131:8077. doi: 10.1021/ja9000097. [DOI] [PubMed] [Google Scholar]; (b) Maniscalco SJ, Tally JF, Fisher HF. Arch Biochem Biophys. 2004;425:165. doi: 10.1016/j.abb.2004.02.041. [DOI] [PubMed] [Google Scholar]
- 36.Snaith and co-workers underscored the merits of R3NHX salts as precursors to anhydrous LiX salts:; Barr D, Snaith R, Wright DS, Mulvey RE, Wade K. J Am Chem Soc. 1987;109:7891. [Google Scholar]; Also, see:; Hall PL, Gilchrist JH, Harrison AT, Fuller DJ, Collum DB. J Am Chem Soc. 1991;113:9575. [Google Scholar]
- 37.Kofron WG, Baclawski LM. J Org Chem. 1976;41:1879. [Google Scholar]
- 38.For an explanation of Levenberg-Marquardt nonlinear least-squares optimization, see:; Press WH, Flannery BP, Teukolsky SA, Vetterling VT. Numerical Recipes in C. Cambridge University Press; London: 1988. Chapter 14.4. [Google Scholar]
- 39.Brown PN, Byrne GD, Hindmarsh AC. J Sci Stat Comput. 1989;10:1038. [Google Scholar]
Associated Data
This section collects any data citations, data availability statements, or supplementary materials included in this article.


