

Abstract
The EGF receptor (EGFR) and its ligands are essential regulators of epithelial biology, which are often amplified in cancer cells. We have previously shown that shRNA-mediated silencing of one of these ligands, amphiregulin (AREG), results in keratinocyte growth arrest that cannot be rescued by soluble extracellular EGFR ligands. To further explore the functional importance of specific AREG domains, we stably transduced keratinocytes expressing tetracycline-inducible AREG-targeted shRNA with lentiviruses expressing silencing-proof, membrane-tethered AREG cytoplasmic and extracellular domains (AREG-CTD and AREG-ECD), as well as full-length AREG precursor (proAREG). Here we show that growth arrest of AREG-silenced keratinocytes occurs in G2/M and is significantly restored by proAREG and AREG-CTD, but not by AREG-ECD. Moreover, the AREG-CTD was sufficient to normalize cell cycle distribution profiles and expression of mitosis-related genes. Our findings uncover an important role of the AREG-CTD in regulating cell division, which may be relevant to tumor resistance to EGFR-directed therapies.
Keywords: epidermal growth factor receptor, amphiregulin, keratinocytes, cell cycle, proliferation
Introduction
Amphiregulin (AREG) is one of seven members of a family of growth factors that bind to and activate the epidermal growth factor receptor (EGFR) (Sanderson et al., 2006). AREG was originally isolated as a secreted glycoprotein from the conditioned medium of phorbol-12-myristate-13-acetate-treated MCF7 human breast carcinoma cells (Shoyab et al., 1988). Independently, it was also purified from human keratinocyte-conditioned medium as a heparin-binding, autocrine factor (Cook et al., 1991) and as schwannoma-derived growth factor in mice (Kimura et al., 1990). AREG derives its name from the fact that it can either stimulate or inhibit growth of various normal and cancer cell lines cell lines (Johnson et al., 1991; Shoyab et al., 1988). Since its discovery, the majority of publications about AREG have emphasized its growth promoting and oncogenic activities (Busser et al., 2011). AREG is overexpressed in a wide spectrum of epithelial cancers including breast (LeJeune et al., 1993; Qi et al., 1994), colon (Ciardiello et al., 1991), lung (Hurbin et al., 2002), ovary (Johnson et al., 1991), prostate (Bostwick et al., 2004), as well as squamous cell carcinomas of the head and neck (Dasgupta et al., 2006; Tinhofer et al., 2011) and the skin (Rittie et al., 2007). Increased AREG expression levels correlate with poor response rates to the EGFR inhibitors gefitinib and cetuximab in non-small cell lung cancer (Busser et al., 2010a; Busser et al., 2010b; Ishikawa et al., 2005) and in head and neck squamous cell carcinomas (Tinhofer et al., 2011). Furthermore, AREG expression in T-cells has been linked to CD8+ T-cell mediated tumor promotion (Kwong et al., 2010). Besides cutaneous squamous cell carcinoma, AREG has been implicated in the pathogenesis of psoriasis (Cook et al., 2004; Cook et al., 1997), keratoacanthoma (Billings et al., 2003), and retinoid irritation (Rittie et al., 2006). AREG is strongly induced in human skin organ culture (Stoll et al., 1997; Stoll et al., 2010a), and it plays an important role in the context of human keratinocyte proliferation and differentiation in vitro (Robertson et al., 2012; Stoll et al., 2010a; Stoll et al., 2010b) and after xenotransplantation in vivo (Klingenberg et al., 2010).
The AREG gene in humans is located on chromosome 4q13.3 in a cluster with three other EGFR ligand genes: epigen, epiregulin and betacellulin; it encodes a 252 amino acid (aa) transmembrane precursor protein (proAREG) (Plowman et al., 1990). Metalloproteinase-mediated cleavage of proAREG near the N-terminus and near the outer leaflet of the cell membrane results in forms of soluble, or shed AREG (sAREG) of 78 and 84 aa as well as a C-terminal domain of 68 to 74 aa consisting of the juxtamembrane stalk (14–20 aa), transmembrane (23 aa) and cytoplasmic (31 aa) domains (Brown et al., 1998; Plowman et al., 1990; Sanderson et al., 2006) (Figure S1). Binding of proteolytically-processed sAREG to EGFR has traditionally been thought to mediate its function by triggering the activation of key signaling pathways including ERK (Kansra et al., 2004; Stoll et al., 2010b) and AKT (Gschwind et al., 2003). However, we found that growth arrest induced by AREG silencing could not be reversed by provision of recombinant soluble EGFR ligands or by expressing the non-membrane-tethered AREG extracellular domain (ECD) (Stoll et al., 2010b). These surprising findings suggested the hypothesis that the AREG C-terminal domain (CTD) might play a role in the regulation of keratinocyte proliferation. To explore this hypothesis in more detail, we stably transduced inducible AREG knockdown cells (Stoll et al., 2010b) with “silencing-proof” lentiviral expression constructs encoding transmembrane-tethered forms of the AREG-CTD and AREG-ECD, and compared them to cells transduced with full-length proAREG. Because we have recently reported that keratinocyte inhibition after AREG silencing is mediated by mitotic arrest (Stoll et al., 2015), we have also explored the effects of the different AREG domains on cell cycle parameters and the expression of mitosis-related genes in this system. The results suggest an important signaling role of the AREG CTD in driving keratinocyte mitosis.
Results
We transduced previously-established conditional AREG knockdown keratinocytes (N/TERT-TR-shAREG, (Stoll et al., 2010b); “parental cells”) with lentiviral expression constructs encoding either full-length proAREG or membrane-tethered forms of AREG-ECD or AREG-CTD (Figure S1). None of these three constructs are susceptible to shRNA-mediated silencing because the tetracycline (Tet)-inducible shRNA targets a sequence in the AREG 3′ untranslated region that is not present in these constructs.
After selection with puromycin, we assessed the expression of these constructs in the newly established cell lines by QRT-PCR, using TaqMan gene expression assays that target nucleotide sequences in the AREG-ECD (“ECD assay”) or the AREG-CTD (“CTD assay”). As shown in Figure 1, Tet treatment of parental cells reduced endogenous AREG transcripts by more than 95% (from 27% to 0.9% of the housekeeping gene RPLP0 by the CTD assay, and from 35% to 1.4% of RPLP0 by the ECD assay). Tet treatment also decreased AREG mRNA levels in all three of these “AREG rescue” cell lines (AREG-CTD, AREG-ECD, and proAREG) relative to their corresponding no-Tet controls. Importantly, expression levels of all constructs in the Tet-treated AREG rescue cell lines were comparable to endogenous AREG levels in untreated control cells, demonstrating that they produced physiological levels of the various AREG constructs in the presence of Tet (20–38% versus 27–35% of RPLP0). Figures 1A and 1B also demonstrate the selective detection of the AREG-CTD and AREG-ECD by the corresponding TaqMan assays, whereas the proAREG construct is detected by both assays.
Figure 1. AREG mRNA and protein expression in AREG subdomain-expressing cell lines.
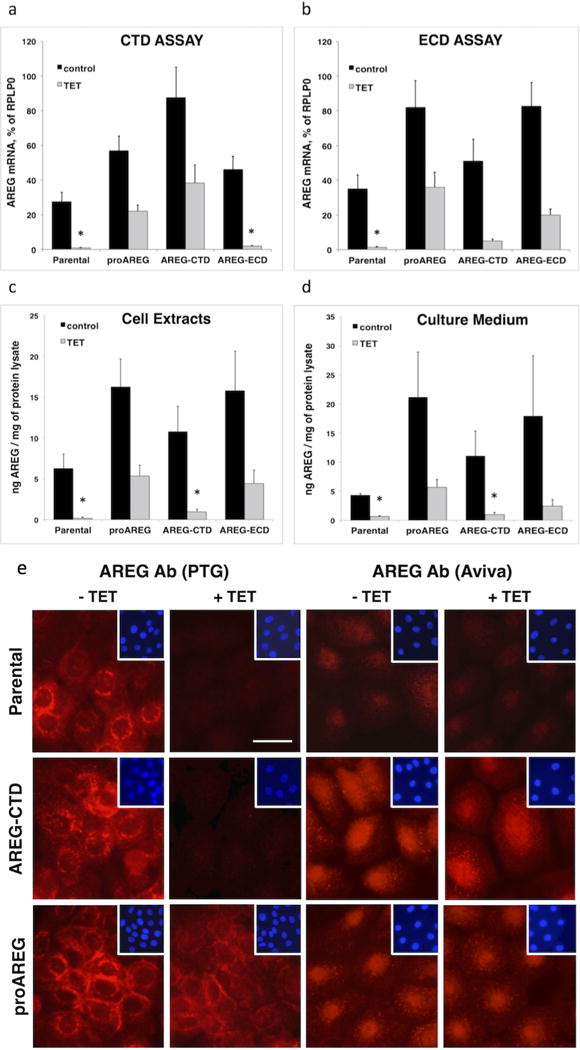
Keratinocytes were grown to 40% confluence and incubated for 48h under autocrine conditions with or without Tet. (A and B) AREG mRNA expression in total RNA was analyzed by QRT-PCR using two different TaqMan gene expression assays that detect sequences specific to the CTD (A) or the ECD (B) (see Figure S1). Data are expressed as percentage of RPLP0 transcript levels. Asterisks denote a significant (P <0.05) reduction in gene expression relative to untreated parental controls, as assessed by two-sample t-test. Bars indicate mean +/− SEM, n = 4. AREG protein levels were analyzed by ELISA in cell extracts (C) or in conditioned medium (D). Data are expressed as pg AREG / mg of total protein lysate (n=3 with two to three biological replicates per experiment). (E) Immunofluorescence staining of AREG in the parental, AREG-CTD, and proAREG expressing cell lines after incubation with or without Tet for 48h (scale bar = 25 μm).
Using an enzyme-linked immunosorbent assay (ELISA) in which the capture antibody is directed against a recombinant form of sAREG, we tested the expression of cell-associated AREG protein in the various AREG rescue cell lines. As described previously (Stoll et al., 2010b), we found that cell-associated AREG protein expression in the parental cell line was reduced by more than 97% after 48h of Tet treatment (Figure 1C). AREG protein levels were also significantly reduced in the AREG-CTD rescue line, which does not express the AREG ECD detected by the ELISA. In contrast, cell-associated AREG protein levels in the other two Tet-treated AREG rescue lines were similar to parental cells not treated with Tet (Figure 1C). Tet treatment also reduced sAREG levels in keratinocyte culture supernatants by 84.8% and 77% in the parental and AREG-CTD cell lines, respectively, and by 43% in the AREG-ECD cell line (Figure 1D). Next, we also examined AREG protein levels by immunostaining using an immunoaffinity-purified rabbit polyclonal antibody (pAb) from Proteintech Group (PTG) raised against proAREG (the “PTG Ab”). While this pAb efficiently detects rhAREG (ECD from Ser101-Lys198 from R&D Systems), it is unable to detect the 29 kDa GST fusion protein containing AREG aa Gln222-Ala252, indicating that the PTG Ab only recognizes ECD epitopes (Figure S2). As can be seen in Figure 1E, PTG Ab staining was predominantly localized in the perinuclear area and on the cell membrane as described (Higashiyama et al., 2008; Robertson et al., 2012; Stoll et al., 2015) and was markedly reduced in response to Tet in parental cells. In contrast, in the proAREG rescue cells treated with Tet, PTG Ab immunoreactivity was preserved at levels similar to parental cells without Tet. We also decorated these lines with an affinity-purified pAb from Aviva raised against a GST fusion protein containing the AREG CTD (aa 222–252, the “Aviva Ab”). The Aviva Ab yielded relatively faint staining in parental cells, possibly due to the relatively low expression levels of AREG mRNA and protein in parental cells compared to the proAREG and AREG-CTD constructs (Figures 1A–D). However, and in contrast to the lack of nuclear staining detected by the PTG Ab, the Aviva Ab clearly yielded nuclear staining in the proAREG and AREG-CTD rescue cell lines (Figure 1E). Punctate cytoplasmic staining was also detected by the Aviva Ab in these two lines, albeit in a different pattern than the perinuclear staining detected by the PTG Ab. Also, in contrast to the near-total loss of staining by the PTG Ab after Tet treatment of parental and AREG-CTD cells, the nuclear and punctate cytoplasmic pattern of immunoreactivity detected by the Aviva Ab persisted in the presence of Tet in the proAREG and AREG-CTD rescue lines (Figure 1E).
Next, we tested these cell lines in autocrine growth assays (Stoll et al., 2015) in the presence or absence of Tet, with and without recombinant human (rh) AREG (100 ng/ml). A typical result is depicted in Figure 2A and three to four independent experiments are quantified in Figure 2B. As expected, the Tet-inducible EGFP shRNA construct had no effect on cell counts, thereby ruling out a direct effect of Tet treatment on the outcome (Figure 2B). In agreement with our previous report (Stoll et al., 2010b), Tet-induced AREG knockdown in the parental cell line markedly reduced keratinocyte cell counts, to 8% of no-Tet controls. In contrast, the proAREG rescue construct substantially restored cell counts in the presence of Tet, to 55.8% of no-Tet controls. Notably, the AREG-CTD was nearly as effective as proAREG in restoring keratinocyte cell counts, to 47.7% of no-Tet controls, whereas AREG-ECD was much less effective, restoring growth to only 17.7% of no-Tet controls. Further analysis of cell counts (Table S1) showed a highly significant interaction of the effects of the various constructs (none, AREG-CTD, AREG-ECD, proAREG and EGFP-shRNA) and treatment (with Tet and/or rhAREG, P = 6.2 × 10⁻¹³). For tests of the simple main effect of construct with fixed treatment level of Tet, AREG-CTD and proAREG differed significantly from the parental construct (corrected P = 0.013 and 0.0089, respectively), whereas AREG-ECD did not (P = 0.40). Moreover, AREG-ECD differed significantly from proAREG (p = 0.0098), whereas AREG-CTD did not (P = 1.00). Very similar results were observed for the fixed treatment level of Tet+rhAREG. In contrast, there was no effect of construct under the fixed treatment levels of control or rhAREG, confirming the lack of effect of exogenous rhAREG under any of the conditions studied. In agreement with these observations, expression of proAREG and AREG-CTD in AREG-silenced parental cells reduced the appearance of large, bi- and multinucleated cells that appear to be arrested prior to cytokinesis, whereas the AREG-ECD construct was much less effective in this regard (Figure 2C).
Figure 2. The AREG cytoplasmic domain restores keratinocyte proliferation in AREG knockdown cells.
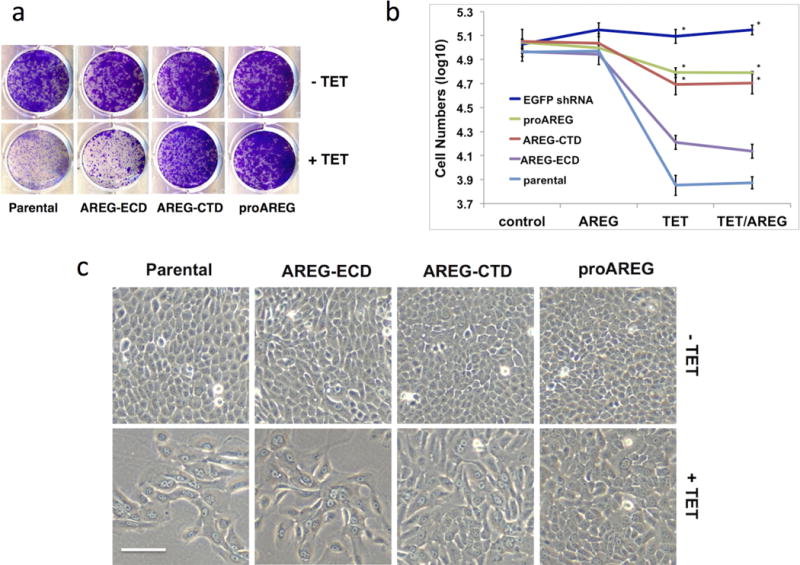
Six-day growth assays were performed with the various AREG cell lines +/− Tet in the presence or absence of 100 ng/ml rhAREG. (A) Crystal violet staining of six-day growth assays with the 4 keratinocyte cell lines. (B) Quantification of cell number as measured by flow cytometry. Data are expressed as log10 of total cell numbers for the 4 different treatments indicated underneath the x-axes, n=4 (except EGFP shRNA cell line, n=3), with three biological replicates per experiment. Data are expressed as mean +/− SEM. Asterisks indicate a significant rescue (P <0.05) for the simple main effect of construct versus the parental cell line. (C) Cell morphology of the various AREG cell lines at the end of six-day growth assays. Two growth conditions/treatments are shown (AREG, upper panels and Tet/AREG, lower panels; scale bar = 100 μm).
To ask whether the AREG-CTD regulates autocrine ERK activation, we grew the parental and AREG-CTD lines under autocrine conditions followed by western blotting (Figure 3). In this assay, keratinocytes are deprived of growth factors for 48 hours, medium is changed, and cells are incubated for an additional two hours in basal medium. In this setting, basal levels of ERK phosphorylation reflect autocrine activation of ERK by sAREG over the two-hour period prior to harvest (Kansra et al., 2004; Stoll et al., 2010a). In agreement with the ELISA and immunofluorescence data shown in Figure 1, Tet treatment strongly reduced endogenous AREG levels in both cell lines. Basal levels of ERK phosphorylation were somewhat higher in the AREG-CTD cells than in parental cells in the absence of Tet, possibly reflective of higher levels of sAREG in AREG-CTD vs. parental cells (Figure 1D). However, pretreatment with Tet during the 48 hour starvation period clearly reduced the ability of both lines to manifest autocrine ERK phosphorylation over the subsequent two-hour autocrine activation period (Figure 3). Addition of rhAREG induced ERK phosphorylation in the presence or absence of Tet, whereas the EGFR tyrosine kinase inhibitor PD158780 and the MEK inhibitor U0126 each abrogated autocrine ERK phosphorylation in both lines. The lack of persistent ERK activation in the presence of Tet in the AREG-CTD rescue line indicates that the AREG-CTD does not directly stimulate autocrine ERK phosphorylation.
Figure 3. Constitutive expression of AREG-CTD does not activate ERK signaling in AREG silenced cells.

Parental and AREG-CTD rescue cells were cultured in basal KSFM medium with or without Tet with or without the ErbB tyrosine kinase inhibitor PD158780 (1 μM) or the MEK inhibitor U0126 (10 μM), with and without 100 ng/ml rhAREG. After cell lysis, protein expression was analyzed by western blotting with antibodies against AREG, phospho-ERK and total ERK.
Flow cytometry experiments revealed that Tet treatment of the parental cells led to a large increase in DNA content per cell accompanied by the appearance of many binucleated cells, as noted previously (Stoll et al., 2015) (Figure 4A). As determined by quantitating the mean 4′,6-diamidino-2-phenylindole (DAPI) staining intensities in Tet-treated vs. untreated cells, Tet treatment of the parental cell line led to a 1.8-fold increase in the intensity of the major DAPI-staining peak (Figure 4B) as well as a substantial increase in cell size, as assessed by forward scattering (Figure S3). These alterations were much less pronounced in the AREG-CTD and proAREG lines, with intermediate outcomes in the AREG-ECD line, leading to a rank order of parental > AREG-ECD > AREG-CTD > proAREG for Tet-induced increases in DAPI staining, and for Tet-induced decreases in cell counts (Figure 2B). To assess the effect of Tet treatment on cell cycle distributions in these lines, we used automated cell cycle analysis to estimate the percentage of cells in G1, S, and G2/M in the presence or absence of Tet (Figure 4B). In the presence of Tet, the AREG-CTD and proAREG constructs had a significantly higher proportion of cells in both G1 (P = 0.0035 and 0.002, respectively) and G2/M (P = 0.0045 and 0.0031, respectively), and a significantly lower proportion of cells in S (P = 0.003 and 0.002, respectively), than did the AREG-ECD construct (Figure 4C). Based on the large increase in DAPI staining intensity in Tet-treated parental cells (Figs. 4A and 4B), we re-assigned the G1 peak identified by the automated cell cycle analysis program in parental cells to be the G2/M peak. Based on this assignment, approximately 85% of the cells in Tet-treated parental cells were in G2/M, with the remainder having higher DNA content, as we reported previously (Stoll et al., 2015). Very similar effects of Tet were seen in the presence or absence of rhAREG (data not shown). Tet-induced expression of EGFP shRNA had no effect on the cell cycle distribution, ruling out non-specific effects of Tet on cell cycle distribution (data not shown).
Figure 4. Normalization of cell cycle distribution profiles by proAREG and AREG-CTD.

Keratinocyte cell lines were subjected to six-day growth assays with or without Tet. In all the experiments shown, exogenous rhAREG was present at 100 ng/ml; similar effects were observed in the absence of rhAREG (data not shown). (A) Cell cycle distribution of the DAPI-stained parental keratinocyte cell line at the end of the six-day growth assay. Representative microscope images (on the right) demonstrate differences in cell morphology with the appearance of binucleated cells (arrows) after AREG silencing (scale bar = 100 μm). (B) Mean fluorescence intensities of the major DAPI peaks in the various cell lines with and without Tet (mean +/− SEM, n=4 with 2–3 replicates per experiment). (C) Quantitation of cell cycle distributions. Data are expressed as the percentage of cells in G1, S, and G2/M; mean +/− SEM, n=4.
Because these and other data (Stoll et al., 2015) indicate that AREG silencing results in mitosis block, we compared the effect of the AREG-ECD and AREG-CTD constructs on expression of mitosis-related genes to those generated by the full-length proAREG construct. In parental cells, FOXM1, MYBL2, PLK1, AURKB and CENPA transcripts were markedly down-regulated in response to Tet-induced AREG silencing (Figure 5). Consistent with the aforementioned cell growth (Figure 2) and flow cytometry results (Figure 4), expression of these genes was significantly restored in AREG-CTD and proAREG cells but not in AREG-ECD cells (Figure 5).
Figure 5. proAREG and AREG-CTD efficiently restore cell cycle related gene expression after AREG silencing.

Keratinocytes were grown to 40% confluence and incubated for 48h under autocrine conditions in the presence or absence of Tet. Gene expression was analyzed by QRT-PCR using TaqMan gene expression assays. Data are normalized to RPLP0 and expressed for each gene and cell line as percent of no-Tet controls. Asterisks denote that the Tet-induced reduction in mRNA expression for the parental and AREG-ECD constructs is significantly greater than observed for both the proAREG and AREG-CTD constructs (nominal P<0.05). In contrast, there were no significant reductions in expression for the parental vs. the AREG-ECD construct, nor for proAREG vs. the AREG-CTD construct. Data are mean +/− SEM, n=3–4.
Discussion
AREG is the predominant autocrine growth factor in human keratinocytes (Robertson et al., 2012; Stoll et al., 2010a; Stoll et al., 2010b). Binding of proteolytically-processed sAREG to EGFR has traditionally been thought to be the mechanism that mediates AREG’s growth factor functions (Brown et al., 1998; Sahin et al., 2004). Indeed, we found that autocrine keratinocyte proliferation and ERK phosphorylation were selectively blocked by antibodies targeting sAREG (Stoll et al., 2010a). However, we also found that the strong inhibition of keratinocyte proliferation resulting from shRNA-mediated AREG silencing could not be reversed by soluble EGFR ligands, including AREG itself (Stoll et al., 2010b). While these findings suggested that the AREG-CTD participates in the regulation of keratinocyte proliferation, they did not directly demonstrate an effect of the CTD (Stoll et al., 2010b). In addition, our previous study made use of an expression construct encoding sAREG without a transmembrane tether, whose function might be compromised in comparison to a membrane-bound AREG precursor due to aberrant cellular trafficking and/or secretion (Singh and Coffey, 2013). Therefore, to further investigate the functions of the various AREG domains, in the present study we stably transduced inducible AREG knockdown cells (Stoll et al., 2010b) with lentiviral constructs encoding membrane-tethered forms of the AREG-CTD and AREG-ECD, and compared them to cells transduced with full-length proAREG (Figure S1). The main goal of this study was to determine which domains of the AREG precursor mediate the effects of AREG on keratinocyte physiology.
We found that these constructs were efficiently expressed at levels very similar to the parental cells (Figure 1), demonstrating physiological levels of expression. Moreover, using the PTG Ab,, we found that the membrane and perinuclear distribution of the expressed proAREG construct was very similar to that of the endogenous protein in parental cells (Figure 1E), indicative of normal subcellular trafficking and localization of the ectopically-expressed AREG. This staining pattern is in agreement with earlier studies in keratinocytes and HeLa cells, which were performed using different anti-AREG antibodies (Higashiyama et al., 2008; Robertson et al., 2012).
Of note, the PTG Ab does not detect the AREG-CTD by Western blotting (Figure S2) and fails to stain the nucleus by immunofluorescence (Figure 1E). However, using the Aviva Ab directed against the C-terminal 31 aa of AREG (the “Aviva Ab”), we found that the AREG-CTD largely localizes to the nuclear compartment (Figure 1E). Because nuclear staining persisted after Tet treatment in the proAREG and AREG-CTD rescue lines, our results suggest that nuclear staining detected by the Aviva Ab is likely to be proteolytically processed AREG-CTD rather than full-length AREG (which otherwise would have been detected in the nucleus by the PTG Ab).
Here we demonstrate that expression of the AREG-CTD restores proliferation to a level very similar to that produced by the proAREG construct, whereas the AREG-ECD construct is significantly less effective in this regard (Figure 2A and B). The enhanced growth-restoring effects of AREG-CTD vs. AREG-ECD were not due to increased shedding of AREG protein from the endogenous AREG gene, as the effects of Tet on levels of sAREG were similar in parental, AREG-CTD, and AREG-ECD lines (15.2%, 9%, and 13.3% of no-Tet control, respectively) (Figure 1D). Concomitant with these effects on proliferation, we found that Tet treatment of parental cells resulted in a major shift in cell cycle parameters, with a 1.8-fold increase in mean DAPI staining in the major flow cytometry peak (Fig 4B). This shift is likely due to several factors related to the FoxM1-dependent, G2/M cell cycle block that we have shown to result from AREG silencing (Stoll et al., 2015). These include (i) increased numbers of binucleated cells that have completed mitosis but not cell division (Figure 2C and 4A), (ii) increased amounts of DNA per nucleus from cells that have not completed mitosis, and (iii) increased background staining resulting from of increased cell size (Figure S3). The latter factor is very unlikely to explain our results, as the background staining of DAPI to RNA and proteins is very low (Kapuscinski, 1995) and the amount of mitochondrial DNA per cell (which could contribute to DAPI staining) is very limited in proportion to the amount of nuclear DNA (~0.13% of total cellular DNA, assuming 500 mitochondria per cell) (Satoh and Kuroiwa, 1991). We found that compared to the AREG-CTD and proAREG lines, the AREG-ECD line had a higher percentage of cells in S-phase, with a lower percentage of cells in G2/M, in Tet-treated cells (Figure 4C). This observation suggests that the membrane-tethered ECD is permissive for entry of cells into S-phase, perhaps via MP-mediated cleavage of sAREG, but that it is not efficient in promoting G2/M transition. Correspondingly, expression of AREG-CTD in AREG-silenced cells normalized mitotic gene expression to a far greater extent than the AREG-ECD or exogenous rhAREG, and to a similar extent compared to proAREG (Figures 5). Overall, our data indicate that the AREG-CTD plays an important role G2/M progression in keratinocytes, which cannot be provided by exogenous AREG or EGFR ligands, nor by the membrane-tethered AREG-ECD. Given our recent findings that AREG controls cell division via FoxM1, which is predominantly localized to the nucleus in these keratinocytes (Stoll et al., 2015), we hypothesize that the nuclear localization of the AREG-CTD may allow it to interact with FoxM1 to regulate G2/M progression, whether directly or indirectly. This hypothesis is being tested in ongoing studies.
We have shown that basal levels of ERK phosphorylation in keratinocytes are due to autocrine EGFR stimulation by sAREG, and that ERK phosphorylation in response to exogenous EGFR ligands is normal when endogenous AREG is silenced (Kansra et al., 2004; Stoll et al., 2010b). Here we show that autocrine ERK phosphorylation is inhibited by AREG silencing in both the parental and AREG-CTD rescue lines, demonstrating that the AREG-CTD is incapable of maintaining ERK phosphorylation when endogenous AREG is silenced (Figure 3). This Figure also confirms that EGFR-dependent ERK activation by exogenous AREG remains intact after AREG silencing. Based on these and our prior results (Stoll et al., 2010b), we postulate that sAREG acts as an EGFR ligand capable of promoting the G1/S transition via MEK/ERK activation (Stoll et al., 2010b), leading to increased cyclin D1 (Han and He, 2009). This would support an activation of cyclin-dependent kinases 4 and 6, maintaining expression of S-phase genes (Anders et al., 2012). In contrast, the AREG-CTD acts as an intracellular signal that participates in regulation of the G2/M transition and cytokinesis via yet-unknown mechanisms, possibly involving its nuclear translocation and interaction with FoxM1. These results suggest that ligand-driven EGFR activation is sufficient to trigger S-phase entry, but is insufficient to drive mitosis.
Several studies have reported important functions of the intracellular domains of other EGF-like growth factors for the regulation of cell proliferation. Thus, Dempsey and colleagues have shown that cleavage of the betacellulin precursor by ADAM10 and presenilin-dependent γ-secretase generates an intracellular-domain fragment that inhibits pancreatic beta-cell growth in an EGFR-independent fashion (Stoeck et al., 2010). In another example, the CTD of HB-EGF was found to regulate cell cycle progression and apoptosis by blocking the function of promyelocytic leukemia zinc finger protein (PLZF), an inhibitor of cyclin A (Nanba et al., 2003), and by degradation of BCL6 in gastric cancer cells (Hirata et al., 2009), respectively. Collectively, these results argue for more detailed functional examination of the biological effects of the CTDs of multiple EGFR ligands.
The EGFR has emerged as an important focus of targeted cancer therapy in head and neck squamous cell carcinoma, colorectal and breast cancer (Cunningham et al., 2004; Normanno et al., 2006; Quesnelle et al., 2012). Several specific reagents targeting EGFR are currently in use for cancer therapy, including the monoclonal antibody cetuximab as well as the small molecules inhibitors gefitinib and erlotinib (Merlano and Occelli, 2007; Raben et al., 2004). However, responses to these inhibitors are not durable, which is probably due to the activation of intrinsic resistance mechanisms in tumors that compensate for inactivation of membrane-bound receptors (Normanno et al., 2006). It is plausible that the AREG-CTD may contribute to these resistance mechanisms. Finally, In the absence of AREG, keratinocytes not only cease to proliferate, but also differentiate (Stoll et al., 2010b; Stoll et al., 2015), and it has consistently been shown that a mitosis block suffices to trigger keratinocyte terminal differentiation (Freije et al., 2012). Thus, therapies directed at AREG’s role in the regulation of G2/M progression might also play a therapeutic role in cancers of stratified epithelia by promoting terminal differentiation.
Materials and Methods
Reagents
Recombinant human AREG and mouse monoclonal AREG antibodies were purchased from R&D Systems (Minneapolis, MN). Rabbit polyclonal AREG antibodies were obtained from Proteintech (Chicago, IL) and Aviva (San Diego, CA). ERK antibodies were purchased from Cell Signaling (Danvers, MA). All antibiotics and lipofectamine 2000 were from Invitrogen (Carlsbad, CA). All other chemicals were purchased from Sigma (St. Louis, MO).
Cell lines and culture conditions
All cell lines in this study were derived from telomerase-immortalized N/TERT-2G keratinocytes (Dickson et al., 2000) by stable transfection with lentiviral expression constructs. The two cell lines N/TERT-TR-shAREG (termed “parental cell line”) and N/TERT-TR-shEGFP, with tetracycline-inducible expression of small hairpin RNA (shRNA) against AREG and EGFP, respectively, have been previously described (Stoll et al., 2010b). Cells were grown in Keratinocyte Serum-Free Medium (KSFM, Invitrogen) with 0.4 mM CaCl2 in the presence of blasticidin and zeocin (Stoll et al., 2010b).
Generation of lentiviral expression constructs
Complementary DNAs encoding either full-length proAREG or membrane-tethered forms of the AREG cytoplasmic (AREG-CTD) and extracellular domains (AREG-ECD) were cloned into the lentiviral expression vector pLVX-aAcGFP-N1 (Clontech, Mountain View, CA) and used for lentivirus production in 293FT cells as previously described (Stoll et al., 2010b). Stably transduced N/TERT keratinocyte cell lines with constitutive expression of proAREG, AREG-CTD, or AREG-ECD were generated by infecting the inducible AREG knockdown cell line N/TERT-TR-shAREG (the “parental” cell line) followed by antibiotic selection with 10 μg/ml puromycin as described (Stoll et al., 2010b).
RNA isolation and QRT-PCR
Total RNA was isolated from keratinocytes, reversed transcribed and mRNA levels were quantified using TaqMan gene expression assays (Applied Biosystems, Foster City, CA) as described previously (Stoll et al., 2015). Additional details about the TaqMan assays are described in Supplementary Information.
Enzyme-linked immunosorbent assay (ELISA)
Shed AREG in keratinocyte-conditioned medium or cell-associated AREG in radio immunoprecipitation assay buffer (RIPA) lysates were measured by sandwich ELISA (R&D Systems) using anti-AREG antibodies (Kansra et al., 2005; Stoll et al., 2010b).
Western Blotting
Cells were grown in KSFM to 20% confluence, followed by incubation in basal KSFM with or without 1 μg/ml Tet for 48 hours. After a medium change, cells were incubated for 2h in basal KSFM with or without Tet with or without 1 μM PD158780 or 10 μM U0126 followed by an additional incubation for 10 min with or without 100 ng/ml AREG and equal amounts of total lysate were analyzed by western blotting as previously described (Stoll et al., 2015).
Immunofluorescence
Keratinocytes were plated on sterile coverslips at 5,000 cells / cm2 and incubated until approximately 20% confluent. The cells were then incubated with or without Tet for 48h. Immunostaining was done as described (Stoll et al., 2015) with anti-AREG antibodies from Proteintech and Aviva.
Cell growth assays
Keratinocytes were plated in six well plates at 1,000 cells/cm2 in complete KSFM (Invitrogen) as described previously (Stoll et al., 2015). At the end of the growth assay, cells were stained with crystal violet or trypsinized for analysis by flow cytometry.
Flow cytometry
Keratinocytes were dislodged, concentrated, fixed and stained and 1 μg/ml of DAPI (Stoll et al., 2015). Equal numbers of Sphero AccuCount Fluorescent Particles (7.7 μm, Spherotech, Lake Forest, IL) were added to each tube of suspended cells, and keratinocytes were analyzed for cell number and cell cycle distribution using an LSR2 flow cytometer (BD Bioscience, Franklin Lakes, NJ) and FCS Express Software (De Novo Software, Glendale, CA).
Statistical analysis
Statistical analyses were performed as previously described (Stoll et al., 2015).
Supplementary Material
Acknowledgments
We thank Dr. James Rheinwald (Harvard Medical School, Boston, MA) for providing the N/TERT-2G immortalized keratinocyte cell line. This work was supported by the National Institute for Arthritis, Musculoskeletal and Skin Disease (NIAMS), National Institutes of Health (NIH awards K01 AR050462 and R03 AR049420 to SWS and R01 AR 052889 to JTE), Instituto de Salud Carlos III (Spain, ISCIII-FIS/FEDER, PI11/02070 to AG), and by the Babcock Memorial Trust. JTE is supported by the Ann Arbor Veterans Affairs Hospital.
Abbreviations
Abbreviations in this paper
- aa
amino acid
- Ab
antibody
- AREG
amphiregulin
- CTD
C-Terminal domain
- ECD
Extra-cellular domain
- EGF
epidermal growth factor
- HB-EGF
heparin-binding EGF-like growth factor
- EGFR
EGF receptor
- ELISA
enzyme-linked immunosorbent assay
- HNSCC
head and neck squamous cell carcinoma
- rh
recombinant human
- QRT-PCR
quantitative real time polymerase chain reaction
- sAREG
soluble / shed AREG
- Tet
tetracycline
- TGF-α
transforming growth factor-α
Footnotes
Additional methodological details are presented in the Supplementary Information.
Conflict of Interest
The authors state no conflict of interest.
References
- Anders L, Ke N, Hydbring P, et al. A systematic screen for CDK4/6 substrates links FOXM1 phosphorylation to senescence suppression in cancer cells. Cancer cell. 2012;20:620–34. doi: 10.1016/j.ccr.2011.10.001. [DOI] [PMC free article] [PubMed] [Google Scholar]
- Billings SD, Southall MD, Li T, et al. Amphiregulin overexpression results in rapidly growing keratinocytic tumors: an in vivo xenograft model of keratoacanthoma. Am J Pathol. 2003;163:2451–8. doi: 10.1016/S0002-9440(10)63600-0. [DOI] [PMC free article] [PubMed] [Google Scholar]
- Bostwick DG, Qian J, Maihle NJ. Amphiregulin expression in prostatic intraepithelial neoplasia and adenocarcinoma: a study of 93 cases. The Prostate. 2004;58:164–8. doi: 10.1002/pros.10322. [DOI] [PubMed] [Google Scholar]
- Brown CL, Meise KS, Plowman GD, et al. Cell surface ectodomain cleavage of human amphiregulin precursor is sensitive to a metalloprotease inhibitor. Release of a predominant N-glycosylated 43-kDa soluble form. J Biol Chem. 1998;273:17258–68. doi: 10.1074/jbc.273.27.17258. [DOI] [PubMed] [Google Scholar]
- Busser B, Sancey L, Brambilla E, et al. The multiple roles of amphiregulin in human cancer. Biochim Biophys Acta. 2011;1816:119–31. doi: 10.1016/j.bbcan.2011.05.003. [DOI] [PubMed] [Google Scholar]
- Busser B, Sancey L, Josserand V, et al. Amphiregulin promotes BAX inhibition and resistance to gefitinib in non-small-cell lung cancers. Mol Ther. 2010a;18:528–35. doi: 10.1038/mt.2009.226. [DOI] [PMC free article] [PubMed] [Google Scholar]
- Busser B, Sancey L, Josserand V, et al. Amphiregulin promotes resistance to gefitinib in nonsmall cell lung cancer cells by regulating Ku70 acetylation. Mol Ther. 2010b;18:536–43. doi: 10.1038/mt.2009.227. [DOI] [PMC free article] [PubMed] [Google Scholar]
- Ciardiello F, Dono R, Kim N, et al. Expression of cripto, a novel gene of the epidermal growth factor gene family, leads to in vitro transformation of a normal mouse mammary epithelial cell line. Cancer research. 1991;51:1051–4. [PubMed] [Google Scholar]
- Cook PW, Brown JR, Cornell KA, et al. Suprabasal expression of human amphiregulin in the epidermis of transgenic mice induces a severe, early-onset, psoriasis-like skin pathology: expression of amphiregulin in the basal epidermis is also associated with synovitis. Exp Dermatol. 2004;13:347–56. doi: 10.1111/j.0906-6705.2004.00183.x. [DOI] [PubMed] [Google Scholar]
- Cook PW, Mattox PA, Keeble WW, et al. A heparin sulfate-regulated human keratinocyte autocrine factor is similar or identical to amphiregulin. Molecular and cellular biology. 1991;11:2547–57. doi: 10.1128/mcb.11.5.2547. [DOI] [PMC free article] [PubMed] [Google Scholar]
- Cook PW, Piepkorn M, Clegg CH, et al. Transgenic expression of the human amphiregulin gene induces a psoriasis-like phenotype. The Journal of clinical investigation. 1997;100:2286–94. doi: 10.1172/JCI119766. [DOI] [PMC free article] [PubMed] [Google Scholar]
- Cunningham D, Humblet Y, Siena S, et al. Cetuximab monotherapy and cetuximab plus irinotecan in irinotecan-refractory metastatic colorectal cancer. The New England journal of medicine. 2004;351:337–45. doi: 10.1056/NEJMoa033025. [DOI] [PubMed] [Google Scholar]
- Dasgupta S, Tripathi PK, Qin H, et al. Identification of molecular targets for immunotherapy of patients with head and neck squamous cell carcinoma. Oral Oncol. 2006;42:306–16. doi: 10.1016/j.oraloncology.2005.08.007. [DOI] [PubMed] [Google Scholar]
- Dickson MA, Hahn WC, Ino Y, et al. Human keratinocytes that express hTERT and also bypass a p16(INK4a)-enforced mechanism that limits life span become immortal yet retain normal growth and differentiation characteristics. Molecular and cellular biology. 2000;20:1436–47. doi: 10.1128/mcb.20.4.1436-1447.2000. [DOI] [PMC free article] [PubMed] [Google Scholar]
- Freije A, Ceballos L, Coisy M, et al. Cyclin E drives human keratinocyte growth into differentiation. Oncogene. 2012 doi: 10.1038/onc.2012.22. [DOI] [PubMed] [Google Scholar]
- Gschwind A, Hart S, Fischer OM, et al. TACE cleavage of proamphiregulin regulates GPCR-induced proliferation and motility of cancer cells. Embo J. 2003;22:2411–21. doi: 10.1093/emboj/cdg231. [DOI] [PMC free article] [PubMed] [Google Scholar]
- Han W, He YY. Requirement for metalloproteinase-dependent ERK and AKT activation in UVB-induced G1-S cell cycle progression of human keratinocytes. Photochem Photobiol. 2009;85:997–1003. doi: 10.1111/j.1751-1097.2008.00531.x. [DOI] [PMC free article] [PubMed] [Google Scholar]
- Higashiyama S, Iwabuki H, Morimoto C, et al. Membrane-anchored growth factors, the epidermal growth factor family: beyond receptor ligands. Cancer Sci. 2008;99:214–20. doi: 10.1111/j.1349-7006.2007.00676.x. [DOI] [PMC free article] [PubMed] [Google Scholar]
- Hirata Y, Ogasawara N, Sasaki M, et al. BCL6 degradation caused by the interaction with the C-terminus of pro-HB-EGF induces cyclin D2 expression in gastric cancers. Br J Cancer. 2009;100:1320–9. doi: 10.1038/sj.bjc.6605010. [DOI] [PMC free article] [PubMed] [Google Scholar]
- Hurbin A, Dubrez L, Coll JL, et al. Inhibition of apoptosis by amphiregulin via an insulin-like growth factor-1 receptor-dependent pathway in non-small cell lung cancer cell lines. J Biol Chem. 2002;277:49127–33. doi: 10.1074/jbc.M207584200. [DOI] [PubMed] [Google Scholar]
- Ishikawa N, Daigo Y, Takano A, et al. Increases of amphiregulin and transforming growth factor-alpha in serum as predictors of poor response to gefitinib among patients with advanced non-small cell lung cancers. Cancer research. 2005;65:9176–84. doi: 10.1158/0008-5472.CAN-05-1556. [DOI] [PubMed] [Google Scholar]
- Johnson GR, Saeki T, Auersperg N, et al. Response to and expression of amphiregulin by ovarian carcinoma and normal ovarian surface epithelial cells: nuclear localization of endogenous amphiregulin. Biochemical and biophysical research communications. 1991;180:481–8. doi: 10.1016/s0006-291x(05)81090-3. [DOI] [PubMed] [Google Scholar]
- Kansra S, Stoll SW, Johnson JL, et al. Autocrine extracellular signal-regulated kinase (ERK) activation in normal human keratinocytes: metalloproteinase-mediated release of amphiregulin triggers signaling from ErbB1 to ERK. Mol Biol Cell. 2004;15:4299–309. doi: 10.1091/mbc.E04-03-0233. [DOI] [PMC free article] [PubMed] [Google Scholar]
- Kansra S, Stoll SW, Johnson JL, et al. Src family kinase inhibitors block amphiregulin-mediated autocrine ErbB signaling in normal human keratinocytes. Mol Pharmacol. 2005;67:1145–57. doi: 10.1124/mol.104.004689. [DOI] [PubMed] [Google Scholar]
- Kapuscinski J. DAPI: a DNA-specific fluorescent probe. Biotechnic & histochemistry : official publication of the Biological Stain Commission. 1995;70:220–33. doi: 10.3109/10520299509108199. [DOI] [PubMed] [Google Scholar]
- Kimura H, Fischer WH, Schubert D. Structure, expression and function of a schwannoma-derived growth factor. Nature. 1990;348:257–60. doi: 10.1038/348257a0. [DOI] [PubMed] [Google Scholar]
- Klingenberg JM, McFarland KL, Friedman AJ, et al. Engineered human skin substitutes undergo large-scale genomic reprogramming and normal skin-like maturation after transplantation to athymic mice. The Journal of investigative dermatology. 2010;130:587–601. doi: 10.1038/jid.2009.295. [DOI] [PubMed] [Google Scholar]
- Kwong BY, Roberts SJ, Silberzahn T, et al. Molecular analysis of tumor-promoting CD8+ T cells in two-stage cutaneous chemical carcinogenesis. The Journal of investigative dermatology. 2010;130:1726–36. doi: 10.1038/jid.2009.362. [DOI] [PMC free article] [PubMed] [Google Scholar]
- LeJeune S, Leek R, Horak E, et al. Amphiregulin, epidermal growth factor receptor, and estrogen receptor expression in human primary breast cancer. Cancer research. 1993;53:3597–602. [PubMed] [Google Scholar]
- Merlano M, Occelli M. Review of cetuximab in the treatment of squamous cell carcinoma of the head and neck. Ther Clin Risk Manag. 2007;3:871–6. [PMC free article] [PubMed] [Google Scholar]
- Nanba D, Mammoto A, Hashimoto K, et al. Proteolytic release of the carboxy-terminal fragment of proHB-EGF causes nuclear export of PLZF. The Journal of cell biology. 2003;163:489–502. doi: 10.1083/jcb.200303017. [DOI] [PMC free article] [PubMed] [Google Scholar]
- Normanno N, De Luca A, Maiello MR, et al. The MEK/MAPK pathway is involved in the resistance of breast cancer cells to the EGFR tyrosine kinase inhibitor gefitinib. Journal of cellular physiology. 2006;207:420–7. doi: 10.1002/jcp.20588. [DOI] [PubMed] [Google Scholar]
- Plowman GD, Green JM, McDonald VL, et al. The amphiregulin gene encodes a novel epidermal growth factor-related protein with tumor-inhibitory activity. Molecular and cellular biology. 1990;10:1969–81. doi: 10.1128/mcb.10.5.1969. [DOI] [PMC free article] [PubMed] [Google Scholar]
- Qi CF, Liscia DS, Normanno N, et al. Expression of transforming growth factor alpha, amphiregulin and cripto-1 in human breast carcinomas. Br J Cancer. 1994;69:903–10. doi: 10.1038/bjc.1994.174. [DOI] [PMC free article] [PubMed] [Google Scholar]
- Quesnelle KM, Wheeler SE, Ratay MK, et al. Preclinical modeling of EGFR inhibitor resistance in head and neck cancer. Cancer biology & therapy. 2012;13:935–45. doi: 10.4161/cbt.20846. [DOI] [PMC free article] [PubMed] [Google Scholar]
- Raben D, Bianco C, Milas L, et al. Targeted therapies and radiation for the treatment of head and neck cancer: are we making progress? Semin Radiat Oncol. 2004;14:139–52. doi: 10.1053/j.semradonc.2003.12.009. [DOI] [PubMed] [Google Scholar]
- Rittie L, Kansra S, Stoll SW, et al. Differential ErbB1 signaling in squamous cell versus basal cell carcinoma of the skin. Am J Pathol. 2007;170:2089–99. doi: 10.2353/ajpath.2007.060537. [DOI] [PMC free article] [PubMed] [Google Scholar]
- Rittie L, Varani J, Kang S, et al. Retinoid-induced epidermal hyperplasia is mediated by epidermal growth factor receptor activation via specific induction of its ligands heparin-binding EGF and amphiregulin in human skin in vivo. The Journal of investigative dermatology. 2006;126:732–9. doi: 10.1038/sj.jid.5700202. [DOI] [PubMed] [Google Scholar]
- Robertson ED, Weir L, Romanowska M, et al. ARNT controls the expression of epidermal differentiation genes through HDAC- and EGFR-dependent pathways. J Cell Sci. 2012;125:3320–32. doi: 10.1242/jcs.095125. [DOI] [PubMed] [Google Scholar]
- Sahin U, Weskamp G, Kelly K, et al. Distinct roles for ADAM10 and ADAM17 in ectodomain shedding of six EGFR ligands. The Journal of cell biology. 2004;164:769–79. doi: 10.1083/jcb.200307137. [DOI] [PMC free article] [PubMed] [Google Scholar]
- Sanderson MP, Dempsey PJ, Dunbar AJ. Control of ErbB signaling through metalloprotease mediated ectodomain shedding of EGF-like factors. Growth Factors. 2006;24:121–36. doi: 10.1080/08977190600634373. [DOI] [PubMed] [Google Scholar]
- Satoh M, Kuroiwa T. Organization of multiple nucleoids and DNA molecules in mitochondria of a human cell. Experimental cell research. 1991;196:137–40. doi: 10.1016/0014-4827(91)90467-9. [DOI] [PubMed] [Google Scholar]
- Shoyab M, McDonald VL, Bradley JG, et al. Amphiregulin: a bifunctional growth-modulating glycoprotein produced by the phorbol 12-myristate 13-acetate-treated human breast adenocarcinoma cell line MCF-7. Proceedings of the National Academy of Sciences of the United States of America. 1988;85:6528–32. doi: 10.1073/pnas.85.17.6528. [DOI] [PMC free article] [PubMed] [Google Scholar]
- Singh B, Coffey RJ. Trafficking of Epidermal Growth Factor Receptor Ligands in Polarized Epithelial Cells. Annu Rev Physiol. 2013 doi: 10.1146/annurev-physiol-021113-170406. [DOI] [PMC free article] [PubMed] [Google Scholar]
- Stoeck A, Shang L, Dempsey PJ. Sequential and gamma-secretase-dependent processing of the betacellulin precursor generates a palmitoylated intracellular-domain fragment that inhibits cell growth. J Cell Sci. 2010;123:2319–31. doi: 10.1242/jcs.060830. [DOI] [PMC free article] [PubMed] [Google Scholar]
- Stoll S, Garner W, Elder J. Heparin-binding ligands mediate autocrine epidermal growth factor receptor activation In skin organ culture. The Journal of clinical investigation. 1997;100:1271–81. doi: 10.1172/JCI119641. [DOI] [PMC free article] [PubMed] [Google Scholar]
- Stoll SW, Johnson JL, Bhasin A, et al. Metalloproteinase-mediated, context-dependent function of amphiregulin and HB-EGF in human keratinocytes and skin. The Journal of investigative dermatology. 2010a;130:295–304. doi: 10.1038/jid.2009.211. [DOI] [PMC free article] [PubMed] [Google Scholar]
- Stoll SW, Johnson JL, Li Y, et al. Amphiregulin carboxy-terminal domain is required for autocrine keratinocyte growth. The Journal of investigative dermatology. 2010b;130:2031–40. doi: 10.1038/jid.2010.98. [DOI] [PMC free article] [PubMed] [Google Scholar]
- Stoll SW, Stuart PE, Swindell WR, et al. The EGF receptor ligand amphiregulin controls cell division via FoxM1. Oncogene. 2015 doi: 10.1038/onc.2015.269. [DOI] [PMC free article] [PubMed] [Google Scholar]
- Tinhofer I, Klinghammer K, Weichert W, et al. Expression of amphiregulin and EGFRvIII affect outcome of patients with squamous cell carcinoma of the head and neck receiving cetuximab-docetaxel treatment. Clinical cancer research : an official journal of the American Association for Cancer Research. 2011;17:5197–204. doi: 10.1158/1078-0432.CCR-10-3338. [DOI] [PubMed] [Google Scholar]
Associated Data
This section collects any data citations, data availability statements, or supplementary materials included in this article.