

Abstract
Objective
The objective of this study was to describe the auditory evoked response to silent gaps for a group of older adults using stimulus conditions identical to those used in psychophysical studies of gap detection.
Design
The P1-N1-P2 response to the onsets of stimuli (markers) defining a silent gap for within-channel (spectrally identical markers) and across-channel (spectrally different markers) conditions was examined using four perceptually-equated gap durations.
Study Sample
A group of 24 older adults (mean age = 63 years) with normal hearing or minimal hearing loss participated.
Results
Older adults exhibited neural activation patterns that were qualitatively different and more frontally oriented than those observed in a previous study (Lister et al., 2007) of younger listeners. Older adults showed longer P2 latencies and larger P1 amplitudes than younger adults, suggesting relatively slower neural travel time and altered auditory inhibition/arousal by irrelevant stimuli.
Conclusion
Older adults appeared to recruit later-occurring T-complex-like generators for gap processing, compared to earlier-occurring T-complex-like generators by the younger group. Early and continued processing of channel cues with later processing of gap cues may represent the inefficiency of the aging auditory system and may contribute to poor speech understanding in noisy, real-world listening environments.
Keywords: Temporal resolution, temporal processing, aging, gap detection, P1, N1, P2, principal component analysis
Older adults with and without hearing loss often complain of difficulty understanding speech that is temporally distorted by background noise, reverberation, and/or rapid speech rate. Older adults also consistently present with deficits of temporal resolution (i.e. the ability to follow rapid changes in intensity and frequency over time) as measured using tasks of gap detection and discrimination (e.g. Lister et al, 2002), duration discrimination (e.g. Fitzgibbons & Gordon-Salant, 1995), temporal masking (e.g. Gehr & Sommers, 1999), temporal order perception (e.g. Fitzgibbons et al, 2006), and perception of time compressed speech (e.g. Gordon-Salant & Fitzgibbons, 1993). These deficits appear to be influenced more by listener age than by hearing status, although some effects of hearing loss have been observed (e.g. Glasberg et al, 1987). Not only do poor temporal resolution and poor speech-in-noise perception co-occur in the aging population, temporal resolution is thought to contribute to understanding speech in noise (e.g. Gordon-Salant & Fitzgibbons, 1993).
A psychophysical measure of temporal resolution commonly used in auditory research is silent gap detection. For this task, at least one standard stimulus comprised of one continuous or two contiguous sounds (markers) and a target stimulus comprised of two markers separated by a silent gap are presented. The shortest gap that a listener can detect (relative to the standard) is called a gap detection threshold (GDT).
Psychophysical GDTs are influenced by a number of acoustic as well as listener factors. Acoustic factors include marker bandwidth (e.g. Eddins et al, 1992), marker duration (e.g. Schneider & Hamstra, 1999), monotic, diotic, or dichotic presentation modes (e.g. Lister & Roberts, 2005; Oxenham, 2000), and the spectral similarity of the stimuli before and after the gap (e.g. Lister et al, 2002; Oxenham, 2000). Behavioral studies have shown that, when the stimuli that mark the silent gap are noise bands of similar frequency, known as within-channel gap detection, the task is relatively easy for listeners of all ages and GDTs are small (e.g. Phillips et al, 1997; Lister et al, 2002). When the noise bands that mark the gap have different spectra, known as across-channel gap detection, the task is more difficult, and GDTs are larger (e.g. Phillips et al, 1997; Lister et al, 2002).
Listener factors that can affect psychophysical GDTs include age and hearing loss. Differences in GDTs between younger and older listeners with or without hearing loss are often small for within-channel gap detection (and not always statistically significant) but are dramatically larger for across-channel gap detection (e.g. Lister et al, 2002). Because the phonemes that precede and follow temporal cues in speech are never identical, across-channel gap detection is thought to be more representative of the temporal cues important for speech perception than within-channel gap detection (e.g. Phillips et al, 1997), therefore, this condition has received great interest in recent years, particularly in the context of age-related changes in speech understanding.
It is thought that within-channel gap detection is easier than across-channel gap detection because the former requires monitoring activity in a single neural channel while the latter requires comparison of the relative timing between the offset of neural activity in one channel and the onset in an entirely different channel. Across-channel gap detection is not well understood; however, Plomp (1964) suggested that the detection of a within-channel gap depends on the strength of the response to the onset of the second marker as well as the suppression of activity following the offset of the first marker. Results of animal studies suggest age-related changes in both processes (e.g. Barsz et al, 2002; Walton et al, 1998).
Barsz et al (2002) suggested that the primary cue for gap detection was the second marker onset and reported an age-related decline in the second marker onset response among older mice. Walton et al (1998) were the first to show that the overall number of neurons capable of responding to second marker onsets is 50% lower among older mice than younger mice. In addition, the neurons of older mice appear to recover much more slowly following the offset of the first marker than do those of younger mice (Walton et al, 1998). In general, the neural gap thresholds measured from rodents correspond very well with gap thresholds measured behaviorally in the same animals, match those of human adults, and show a human-like deterioration with age that is independent of hearing loss (e.g. Walton et al, 1997, 2008). Contributing to these effects are a number of age-related changes in the brain, including diminished number of neurons, dendrites, and synapses as well as demyelination (e.g. Creasey & Rapoport, 1985). These changes are particularly marked in the prefrontal areas, areas thought to be important for the inhibition of activity related to irrelevant stimuli (e.g. West, 1996).
Although behavioral methods are popular for the measurement of temporal resolution among older adults, they are influenced by many factors that are known to change with age (e.g. memory, cognition, motivation, task, response criteria), making it difficult to draw conclusions about the underlying physiological deficit(s). This point is important because there is tremendous variability among individual older humans and animals in terms of behavioral performance, suggesting that the underlying physiological deficit varies across individuals (e.g. Walton et al, 1998). Therefore, a temporal resolution measure that does not rely on behavioral responses is needed and may be quite useful for assessment of the aging population.
In our previous study, we used auditory evoked potentials (AEPs), specifically the P1-N1-P2 response, as well as a psychophysical method to establish normal responses to standard and target gaps using stimuli representative to those typically used in behavioral measures (Lister et al, 2007). The P1-N1-P2 response is a physiological response that can signal the neural detection of gaps in noise at the level of the auditory cortex (e.g. Ostroff et al, 1998). These peaks occur approximately 50 ms (P1), 100 ms (N1), and 200 ms (P2) after stimulus onset and are thought to represent synchronous neural firing in the thalamic-cortical segment of the central auditory system in response to the onset of acoustic change (for review see Key et al, 2005). The P1-N1-P2 response has been used reliably to document auditory neural responses to both speech and non-speech stimuli in listeners of all ages (e.g. Walhovd & Fjell, 2002; Tremblay et al, 2003).
Results of aging studies indicate that both the latency and amplitude of P1, N1, and P2 change with age in a pattern that is somewhat specific to the level and spectrum of the stimulus as well as the presentation paradigm (for review see Ceponiene et al, 2008). For stimuli and presentation most like those used in the current study, P1-N1-P2 latencies generally increase with age (particularly N1 and P2), suggesting slower neural processing of acoustic features by older listeners. Also, the amplitude of P1 generally increases with age, suggesting reduced subcortical and cortical inhibition for older listeners (Tremblay, et al, 2004).
In general, the P1-N1-P2 response corresponds well to the behavioral detection of frequency, intensity, and temporal changes in a stimulus (for review see Hyde, 1997). Despite the sensitivity of the P1-N1-P2 response, there has been little investigation of the individual P1-N1-P2 responses to the onsets of first and second markers using stimuli typical to psychophysical gap detection tasks (e.g. relatively long markers, across-channel conditions, standard and target stimuli), particularly among older listeners.
Our previous study (Lister et al, 2007) established the P1-N1-P2 response of young adults with normal hearing for stimuli identical to those used in the present study. Generally, larger amplitudes and shorter latencies were found for the conditions in which the acoustic cues are most salient (e.g. across-channel markers, first markers, large gap durations). A subsequent principal component analysis (PCA) showed activity elicited by threshold gap durations in the regions of 167 and 183 ms for temporal-parietal and right-frontal spatial locations. Gap duration appeared to be most clearly indicated by P1 and T-complex amplitude.
The purpose of the present study was to establish the P1-N1-P2 response to the onsets of first (before the gap) and second (after the gap) markers for within-channel and across-channel conditions using a variety of gap durations in a population known to have poor and highly variable temporal resolution, older adults. We hypothesized that: (1) for within-channel markers, older adults would show clear responses only to silent gap conditions that were behaviorally detectable; (2) for across-channel markers, older adults would show clear responses to all silent gap conditions due to the frequency change across the gap; and (3) additional patterns of activation, not necessarily predicted by previous research but uncovered by an exploratory data analysis approach (PCA) would reveal additional AEP effects on which to focus future research of age-related changes in temporal resolution.
Materials and Methods
Participants
Twenty-four older adults (mean age = 63; SD = 6.4) with normal hearing or minimal hearing loss at the test frequencies (1000 and 2000 kHz) participated in the study. Pure-tone air conduction thresholds for the test ear for each listener are shown in Figure 1. The test ear was the ear with the better pure tone thresholds in the frequency region of the experimental stimuli (1000 and 2000 Hz). If pure-tone thresholds at these frequencies were identical for each ear, the right ear was selected as the test ear. Using these criteria, approximately half (n = 11) of the participants were tested in the right ear. It is apparent from Figure 1 that, although most participants had good hearing (no greater than a mild degree of hearing loss) in the test ear across the frequency range, a few had moderate-to-severe high-frequency hearing loss. All participants were native English speakers and had no history of middle-ear infections, oto-toxic medication use, excessive noise exposure, or neurological disorders. All participants passed the mini-mental state examination (Folstein et al, 1975) with a score of 28 (out of 30) or better. Descriptive data for all participants are shown in Table 1.
Figure 1.

Pure tone thresholds for each participant for the ear tested. Test ear was the ear with the better pure-tone threshold (11 right). Dark black line indicates mean.
Table 1.
Descriptive data for individual older participants with means for older and younger participants. Standard errors in parentheses for mean data. NBN refers to narrow-band noise.
| Participant | Age | Gender | Test ear |
Detection threshold (dB SPL)
|
Gap detection threshold (ms)
|
||
|---|---|---|---|---|---|---|---|
| 1000 Hz NBN | 2000 Hz NBN | Within-channel | Across-channel | ||||
| OP01 | 57 | Female | Left | 13 | 9 | 11 | 33 |
| OP02 | 72 | Male | Right | −2 | 14 | 6 | 21 |
| OP03 | 71 | Male | Right | −2 | 15 | 4 | 147 |
| OP04 | 58 | Male | Right | 2 | 7 | 4 | 36 |
| OP05 | 67 | Female | Right | 30 | 32 | 12 | 57 |
| OP06 | 62 | Female | Left | 13 | 19 | 16 | 49 |
| OP07 | 68 | Female | Left | 4 | 20 | 29 | 51 |
| OP08 | 74 | Male | Right | 5 | 10 | 75 | 88 |
| OP09 | 69 | Male | Left | 5 | 4 | 13 | 101 |
| OP10 | 61 | Male | Left | 0 | 5 | 20 | 48 |
| OP11 | 55 | Male | Left | −8 | −8 | 7 | 83 |
| OP12 | 60 | Female | Right | −1 | 10 | 3 | 21 |
| OP13 | 56 | Female | Left | 5 | 13 | 7 | 83 |
| OP14 | 67 | Male | Left | −1 | 16 | 4 | 26 |
| OP15 | 70 | Female | Right | 11 | 13 | 33 | 57 |
| OP16 | 56 | Male | Left | −1 | 1 | 12 | 30 |
| OP17 | 65 | Female | Right | 7 | 17 | 5 | 21 |
| OP18 | 68 | Male | Left | 3 | 5 | 9 | 63 |
| OP19 | 61 | Female | Left | 2 | 0 | 10 | 47 |
| OP20 | 56 | Female | Right | −1 | 7 | 20 | 43 |
| OP21 | 72 | Female | Left | 7 | 22 | 22 | 47 |
| OP22 | 55 | Female | Right | 8 | 21 | 15 | 46 |
| OP23 | 58 | Female | Left | −2 | −3 | 9 | 63 |
| OP24 | 55 | Male | Right | −1 | 15 | 8 | 85 |
| OP mean (SE) | 63 (1.3) | 13 F 11 M | 11 R 13 L | 4.0 (1.5) | 11 (1.8) | 14.8 (3.1) | 56.0 (6.1) |
| YP mean (SE) | 25.8 (1.5) | 9 F 3 M | 12 R | 0.8 (2.2) | 2.6 (1.6) | 9.8 (0.8) | 29.2 (4.3) |
They are bold b/c they are means and the other numbers are individual scores.
Stimuli
One-quarter-octave narrow-band noise (NBN) markers, geometrically centered on 2000 or 1000 Hz, were generated using Tucker Davis Technologies (TDT) System 3 hardware (20 kHz sampling rate) and locally produced software. The NBN markers were shaped with a cos2 window to create a 1-ms rise-fall time around the gap (offset of first marker, onset of second marker) and a more gradual 10-ms rise-fall time on the onset of the first marker and the offset of the second marker. These stimuli and rise-fall times are similar to those used in behavioral gap detection tasks (e.g. Lister et al, 2002; Phillips et al, 1997). Sound pressure levels were calibrated by playing out NBN markers and recording the level using a Bruel & Kjaer Type I sound level meter (Model 2250, linear setting, fast mode) with a half-inch condenser microphone (Model 4192), connected to a Bruel & Kjaer artificial ear (Model 4153) with a flat plate adapter for the circumaural earphones.
Psychophysical gap detection
Gap detection thresholds were obtained monaurally from the test ear using stimuli and methods identical to those used previously in our lab (e.g. Lister et al, 2002) and similar to those used by others (e.g. Phillips et al, 1997). There were two stages in obtaining behavioral GDTs. In the first stage, behavioral detection thresholds were obtained for both NBN markers in the test ear using a two-interval, two-alternative, forced-choice adaptive paradigm with a two-down, one-up stepping rule converging upon the 70.7% point of the psychometric function (Levitt, 1971). The adaptive paradigm continued for eight reversals; for the first two reversals, the step size was 4 dB, and the step size was reduced to 2 dB for the final six reversals. The values obtained for the final six reversals were averaged to determine threshold and each threshold was measured a minimum of two times. This was done to ensure audibility of the stimuli in subsequent experiments as Fitzgibbons and Gordon-Salant (1987) have suggested that sensation levels of 25–30 dB are necessary for optimum gap detection. Detection thresholds are presented in Table 1.
In the second stage, GDTs were measured for two test conditions: (1) Within-channel in which the first and second markers were centered on 2000 Hz, and (2) Across-channel in which the first marker was centered on 2000 Hz and the second marker was centered on 1000 Hz. The order of conditions was counterbalanced. The paired NBN markers were passed through attenuators (TDT PA4) to set the overall level and a low-pass filter with an 8000-Hz cutoff (TDT FT6). The signals were presented to the test ear via Sennheiser HD 265 linear headphones at 70 dB SPL.
Gap detection thresholds were obtained by using a two-interval, two-alternative forced choice (2I/2AFC) paradigm using a two-down, one-up rule converging upon the 70.7% point of the psychometric function (Levitt, 1971). In the standard interval, the markers were separated by a 1-ms gap to ensure that similar gating transients were present in both intervals and preclude the use of short-term spectral cues for interval selection (Phillips et al, 1997). In the target interval, gap duration varied adaptively and the step size was a factor of 1.2. In all cases, the gap duration was defined as the time period of zero amplitude, exclusive of the 1-ms rise/fall time. Presentation order of the standard and target intervals was randomized across trials. Marker duration was varied randomly within a range of 250 to 350 ms to reduce the likelihood that marker duration cues could be used to select the target interval (Lister & Tarver, 2004).
The listener’s task was to indicate which one of two stimulus intervals contained the marker pair separated by a silent gap. The adaptive procedure continued until ten reversals occurred; gap detection thresholds were calculated as the average gap size of the final eight reversals minus the standard 1-ms gap. The interval between marker pairs within a trial was fixed at 500 ms, and an inter-trial interval of 500 ms occurred following the listener’s response. Three runs of each channel condition were completed. Average GDTs for each listener and channel condition are shown in Table 1.
P1-N1-P2 peak measurements
Using stimuli identical to those used in the behavioral task, AEPs were measured for eight conditions. Marker duration was fixed at 300 ms. Stimuli were presented monaurally via Etymotic ER-2 linear insert earphones at a level of 70 dB SPL to the test ear. The listener was seated comfortably in a sound-attenuated booth and watched a closed caption video. The listener was asked to ignore the sounds and focus on the video.
As for the behavioral task, the AEP task included within-channel and across-channel conditions. Four settings of gap duration were used: (1) gap = individual listener’s behavioral GDT; (2) gap = 2.4 × GDT (considered supra-threshold); (3) gap = GDT/2.4 (considered sub-threshold); and (4) gap = 1 ms (identical to the standard interval in the psychophysical task). These four conditions were termed de-capitalize Gap, Supra-threshold Gap, Sub-threshold Gap, Standard Gap, respectively. Four hundred tokens were presented for each of the eight conditions. The inter-stimulus interval was 900 ms. Data were collected for within-channel in a single 40-minute session. Listeners returned on a separate day for across-channel. Gap duration order was randomized within each channel condition.
Continuous electroencephalogram (EEG) activity was recorded from 32 Sintered Ag/AgCl electrodes. A nose electrode served as reference and a high forehead electrode served as ground. Four electrodes, one on the outer canthus of each eye, and one on both the supra and infra orbital ridges of the left eye were used to monitor eye blink activity. A PC-based Neuroscan™ system (SCAN version 4.3.1) with SynAmps2 (amplifiers) was used to record EEG activity from all electrodes at a sampling rate of 1000 Hz. Evoked responses were band-pass filtered online from 0.1 to 100 Hz (12 dB/octave roll off). Offline analysis of the continuous EEG began with manual artifact rejection. EEG epochs of 600 ms (−100 to 500 ms) were obtained, baseline corrected (−100 to 0 ms) and averaged separately for each marker, stimulus condition, and listener. Epochs containing artifacts greater than ± 100 μV were rejected from averaging. Averaged waveforms were digitally band-pass filtered between 1 and 30 Hz with a 48 dB/octave roll-off.
Visual inspection of the entire scalp topography was used to ensure that the response fit the expected pattern (i.e. larger amplitudes frontally/centrally reversing in polarity over mastoids). As expected, P1, N1, and P2 were most easily identified at Fz. Therefore, the waveforms measured from this electrode were used to determine the peak latencies and amplitudes of these responses. Specifically, P1 was defined as the largest positivity occurring between 25 and 90 ms after marker onset. The N1 was defined as the largest negativity occurring between 70 and 140 ms. The P2 was defined as the largest positivity occurring between 140 and 255 ms. As shown in Figure 2, there were two time windows of interest, one following the onset of the first marker and one following the onset of the second marker. Peak amplitude and latency measurements of P1, N1, and P2 were measured at Fz, separately for each participant for each marker in each condition. Electrode Fz was chosen because it consistently showed the clearest response for all listeners and is a commonly used electrode for the identification of P1-N1-P2. From the perspective of clinical audiology, a single electrode response would translate most efficiently to clinical practice; therefore, we wished to determine if useful information regarding temporal resolution could be obtained from this electrode alone.
Figure 2.

Representative auditory evoked responses (AEPs) following each marker onset recorded from electrode Fz for a single participant. The stimulus condition was within-channel, supra-threshold gap. Narrow-band noise (NBN) marker time waveforms are shown below AEPs. Gray area represents duration of gap, which varied across listeners and conditions.
Next, in order to test whether these responses were modulated by the experimental conditions, the peak amplitude and latency measurements for each response were submitted to a repeated-measures ANOVA, with ear of stimulation (right, left) as a between-subjects factor and with channel condition (within-channel, across-channel), marker (first, second), and gap duration (standard, sub-threshold, GDT, supra-threshold) as within-subjects factors.
Temporal-spatial principal component analysis
Traditional measurement techniques typically focus on highly specific portions of the signal. For example, the peak latency and amplitude measurements reported above took aim at the most extreme locations (i.e. specific electrode and time points) at which P1, N1, and P2 effects are generally known to occur. Crucially, this approach may miss effects present at other measurement points in a high-density data set such as ours. Since the properties of AEPs elicited during gap detection are largely unknown in the aging population, we extended our analysis by exploring beyond the extreme measurement points typically associated with P1, N1, and P2 effects.
For this purpose, we used principal component analysis (PCA), a dimension-reduction technique useful for identifying major patterns of variance present in a data set. In AEP research, PCA can be used to identify clusters of time points (in temporal domain), and clusters of channels (in spatial domain), at which AEP amplitude differences are present between conditions, between groups, or both. The PCA method is based on identifying patterns of variance-covariance in the voltage activity recorded across several consecutive time points (in temporal domain), or at topographically coherent clusters of scalp electrodes (in spatial domain) (see Dien & Frishkoff, 2005 for further details on this approach). Here, we submitted the averaged AEPs, elicited by the second marker, to a covariance-based, two-step, temporal-spatial PCA (see Lister et al, 2007, for a similar application of this approach).
For step one of this analysis, the averaged AEP data were combined into a single data matrix comprised of 501 columns (one column for each of the sampling points in the window extending from 0 to 500 ms after second marker onset) and 5760 rows (the averaged AEP voltages for 11 right-ear- and 13 left-ear-stimulated participants, at each of 30 electrodes, in each of the eight conditions). This matrix was used as input to a temporal PCA. The aim of this initial, temporal PCA was to identify distinct windows of time in the AEP averages (hereafter, temporal factors) during which similar voltage variance was registered. In step two, a spatial PCA was performed on the factor scores of the meaningful temporal factors. That is, the scores for each temporal factor (representing the voltage variance within a specific time window) were reconfigured into a matrix with 30 columns (one column per electrode) and 192 rows (scores for the temporal factor, for each of the 11 right-ear- and 13 left-ear-stimulated participants, in each of the eight different conditions). This matrix was then submitted to a spatial PCA, in order to identify topographically coherent regions of voltage activity (hereafter, spatial factors) within the time window represented by each temporal factor. Specific procedures used to conduct this analysis can be found in Lister et al (2007).
In order to test for experimental effects, factor scores associated with specific pairs of temporal and spatial factors (i.e. scores summarizing the AEP variance within a specific time window, at a specific region on the scalp) were submitted to a repeated-measures ANOVA, with ear of stimulation (right, left) as a between-subjects factor and with channel (within-channel, across-channel) and gap duration (standard, sub-threshold, GDT, supra-threshold) as within-subjects factors. When the sphericity assumption was violated, the degrees of freedom were corrected (Greenhouse & Geiser, 1959). This correction is reflected in the reported p-values. All statistically significant main effects of gap duration and two-way interactions were followed-up by Bonferroni-protected pair-wise comparisons of the scores for the different factor levels.
Results
Behavioral tasks: Narrow-band noise detection, psychophysical gap detection
Detection thresholds for the NBN markers are shown in Table 1. An ANOVA with one within-subjects factor (NBN center frequency) indicated that thresholds were significantly higher for the 2000 Hz NBN than for the 1000 Hz NBN [F(1,23) = 25.47, p <0.001]. Pearson product moment correlations calculated between older participant age and NBN thresholds indicated that age was not significantly related to threshold for the 1000 Hz NBN [r(22) = 0.22, p = 0.30] or 2000 Hz NBN [r(22) = 0.38, p = 0.07]. The detection thresholds were measured to ensure that the fixed presentation level of 70 dB SPL exceeded the 25–30 dB sensation level suggested as necessary for optimum gap detection by Fitzgibbons and Gordon-Salant (1987). The highest detection threshold measured for any participant was 32 dB SPL for OP05 for the 2000 Hz marker. Sensation level was 38 dB for this participant, and, therefore, the sensation level requirement was met for all participants.
Within-channel and across-channel GDTs are also shown in Table 1. Consistent with the literature, higher GDTs were observed for across-channel than within-channel. Within-channel GDTs ranged from 3 to 75 ms and across-channel GDTs ranged from 21 to 147 ms. An ANOVA with one within-subjects factor (channel condition) indicated that GDTs were significantly poorer for the across-channel condition than for the within-channel condition [F(1,23) = 42.41, p <0.001]. Pearson correlations calculated between GDTs and age, and between GDTs and NBN thresholds, indicated a significant relationship only between within-channel GDTs and age [r(22) = 0.42, p = 0.04]. None of the other possible correlations were significant.
P1-N1-P2 peak analyses
As we found for the young adults (Lister et al, 2007), the response to the first marker did not differ across stimulus conditions. Figure 3 shows mean responses to the first marker for the older adults from the present study and the young adults from Lister et al (2007). In general, the older adults show longer peak latencies than the younger adults for the first marker, a pattern that changes with latency such that larger group differences are apparent for P2 than for P1. The older adults also show a larger P1 amplitude with smaller N1 and P2 amplitudes for the first marker relative to the younger adults.
Figure 3.
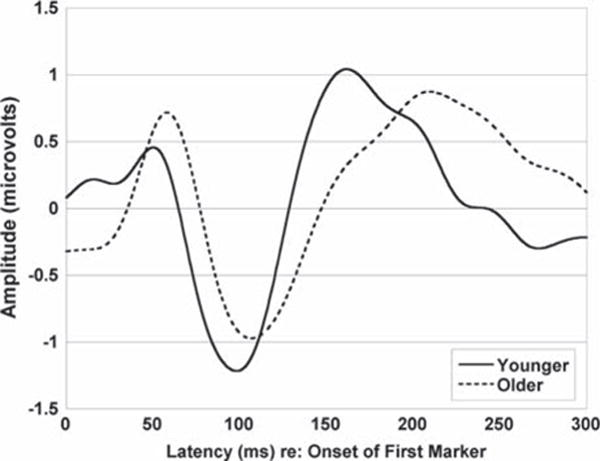
Group mean responses to the first marker recorded from electrode Fz (younger n = 12, older n = 24).
For the second marker, the mean older adult responses measured at Fz for within-channel (gray solid lines) and across-channel (gray dotted lines) are shown in the four panels of Figure 4. Each panel represents a different gap duration condition as indicated on the figure. The mean young adult responses from Lister et al (2007) are shown as reference with black solid (within-channel) and dotted (across-channel) lines. As shown in Figure 4, P1, N1, and P2 are apparent and show similar morphology for each across-channel condition. For within-channel conditions, however, the waveform morphology is relatively poor for the standard, sub-threshold, and GDT gap conditions. Generally, peaks for the older listeners appear fairly broad, with larger P1 and N1 amplitudes and longer P2 latencies than we saw for the younger listeners for the second marker for most conditions. Individual older adult responses for the first and second markers are shown in Figure 5 for the within-channel GDT gap duration condition. Figure 5 shows that the pattern of responses is similar across older participants.
Figure 4.

Group mean responses to the second marker recorded from electrode Fz (younger n = 12, older n = 24). Solid lines represent within-channel. Dotted lines represent across-channel. Black lines represent younger listeners (Lister et al, 2007). Gray lines represent older listeners. Panel A shows standard gap. Panel B shows sub-threshold gap. Panel C shows GDT gap. Panel D shows supra-threshold gap.
Figure 5.

Individual waveforms for the older listeners (n = 24) for the first and second marker for the within-channel GDT gap condition recorded from Fz. Left panel represents first marker responses. Right panel represents second marker responses. The dark black line represents the average response for the young control group (Lister et al, 2007) for the same conditions.
Mean peak amplitudes and latencies (averaged across the 24 participants) are summarized in Table 2. For each peak, amplitudes and latencies were analysed in separate analyses of variance (ANOVAs), results of which are summarized in Table 3. None of the possible three- and four-way interactions were significant and are, therefore, not shown. For all peaks, latencies were measured relative to marker onset. The assumption of sphericity was not violated for any of the analyses.
Table 2.
Mean peak latencies (ms) and amplitudes (microvolts), averaged across the 24 participants, for each stimulus condition as measured at electrode Fz.
| Marker | Channel | Gap duration |
P1
|
N1
|
P2
|
|||
|---|---|---|---|---|---|---|---|---|
| Latency | Amplitude | Latitude | Amplitude | Latency | Amplitude | |||
| First | Within | Standard | 58 | 0.9 | 109 | −1.2 | 197 | 1.1 |
| Sub-threshold | 59 | 1.0 | 115 | −1.2 | 193 | 1.2 | ||
| GDT | 58 | 1.0 | 113 | −1.4 | 188 | 1.1 | ||
| Supra-threshold | 60 | 0.9 | 109 | −1.4 | 196 | 0.9 | ||
| Across | Standard | 60 | 1.0 | 111 | −1.3 | 201 | 1.2 | |
| Sub-threshold | 56 | 1.2 | 113 | −1.2 | 194 | 1.2 | ||
| GDT | 59 | 1.0 | 107 | −1.2 | 189 | 1.1 | ||
| Supra-threshold | 55 | 1.1 | 116 | −1.5 | 201 | 1.4 | ||
| Second | Within | Standard | 65 | −0.1 | 111 | −0.7 | 188 | 0.2 |
| Sub-threshold | 65 | 0.2 | 113 | −0.6 | 189 | 0.4 | ||
| GDT | 55 | 0.3 | 107 | −0.9 | 186 | 0.3 | ||
| Supra-threshold | 50 | 0.4 | 115 | −0.8 | 193 | 0.5 | ||
| Across | Standard | 59 | 0.7 | 114 | −1.5 | 194 | 0.7 | |
| Sub-threshold | 58 | 0.8 | 112 | −1.4 | 190 | 0.7 | ||
| GDT | 55 | 1.0 | 118 | −1.4 | 197 | 0.9 | ||
| Supra-threshold | 54 | 1.4 | 117 | −1.6 | 198 | 1.0 | ||
Table 3.
Summary of significant effects for older participants.
| Effect | P1
|
N1
|
P2
|
|||
|---|---|---|---|---|---|---|
| Latency | Amplitude | Latency | Amplitude | Latency | Amplitude | |
| Ear | F = 0.073 | F = 0.557 | F = 1.760 | F = 0.058 | F = 0.942 | F = 1.616 |
| p = 0.790 | p = 0.463 | p = 0.198 | p = 0.812 | p = 0.342 | p = 0.217 | |
| Marker | F = 9.665 | F = 15.580 | F = 0.040 | F = 2.610 | F = 15.32 | F = 10.44 |
| p = 0.005* | p < 0.001* | p = 0.843 | p = 0.120 | p < 0.001* | p = 0.004* | |
| Gap | F = 0.851 | F = 6.806 | F = 1.813 | F = 0.353 | F = 1.188 | F = 0.900 |
| p = 0.471 | p < 0.001* | p = 0.153 | p = 0.787 | p = 0.321 | p = 0.446 | |
| Channel | F = 3.251 | F = 43.572 | F = 7.656 | F = 10.00 | F = 0.002 | F = 19.43 |
| p = 0.085 | p < 0.001* | p = 0.011* | p = 0.005* | p = 0.967 | p < 0.001* | |
| Ear × Marker | F = 0.562 | F = 0.730 | F = 0.004 | F = 0.231 | F = 0.030 | F = 0.058 |
| p = 0.461 | p = 0.402 | p = 0.949 | p = 0.635 | p = 0.865 | p = 0.812 | |
| Ear × Gap | F = 1.356 | F = 0.236 | F = 1.310 | F = 0.475 | F = 0.797 | F = 0.527 |
| p = 0.264 | p = 0.871 | p = 0.279 | p = 0.701 | p = 0.500 | p = 0.666 | |
| Marker × Gap | F = 0.597 | F = 6.989 | F = 2.109 | F = 0.577 | F = 3.957 | F = 2.924 |
| p = 0.619 | p < 0.001* | p = 0.107 | p = 0.632 | p = 0.012* | p = 0.040* | |
| Ear × Channel | F = 0.001 | F = 1.122 | F = 0.326 | F = 0.499 | F = 0.008 | F = 0.752 |
| p = 0.971 | p = 0.301 | p = 0.574 | p = 0.487 | p = 0.928 | p = 0.395 | |
| Marker × Channel | F = 2.041 | F = 13.704 | F = 3.663 | F = 41.33 | F = 0.421 | F = 11.55 |
| p = 0.167 | p = 0.001* | p = 0.687 | p < 0.001* | p = 0.523 | p = 0.003* | |
| Gap × Channel | F = 0.150 | F = 3.107 | F = 0.942 | F = 1.461 | F = 0.144 | F = 2.523 |
| p = 0.929 | p = 0.032* | p = 0.425 | p = 0.233 | p = 0.933 | p = 0.065 | |
p <0.05.
Latency
The P1 latency was significantly shorter for the second marker than for the first marker but did not differ by ear of stimulation, across gap duration, or between channel conditions. None of the potential interactions were significant.
The N1 latency was significantly shorter for the within-channel condition than the across-channel condition but did not differ significantly by ear of stimulation, between markers, or across gap durations. None of the potential interactions were significant.
The P2 latency was significantly shorter for the first marker than for the second marker but did not differ significantly by ear of stimulation, across gap duration, or between channel conditions. The interaction between marker and gap duration was significant. A Tukey honest significant difference (HSD) post-hoc analysis of the significant interaction revealed that the marker effect was significant for supra-threshold gap (p = 0.003) and GDT (p = 0.001) but not for sub-threshold gap (p = 0.135) or standard gap (p = 1.0). The gap duration effect was not significant for either marker.
Amplitude
The P1 amplitude was significantly larger for the first marker than for the second marker, differed significantly across gap duration, and was significantly larger for the across-channel condition than the within-channel condition. The P1 amplitude did not differ significantly by ear of stimulation. The interactions between marker and gap duration, between marker and channel condition, and between gap duration and channel condition were significant.
A Tukey HSD post-hoc analysis of the significant effect of gap duration indicated that P1 amplitude was significantly smaller for standard gap than for supra-threshold gap (p = 0.0003), but none of the other comparisons differed significantly (p >0.05). Tukey HSD post-hoc analyses of the three significant interactions revealed that the aforementioned gap duration effect occurred only for the second marker, and P1 amplitude did not differ significantly across gap duration for the first marker (p >0.05). The effect of channel condition was significant for all gap duration conditions except standard gap (p = 0.024 for GDT, p = 0.0001 for supra-threshold gap, p = 0.002 for sub-threshold gap, p = 0.081 for standard gap). For the across-channel condition, P1 amplitude was significantly larger for supra-threshold gap than for all other gap duration conditions (p = 0.028 for GDT, p = 0.030 for sub-threshold gap, p = 0.0001 for standard gap). The effect of gap duration was not significant for the within-channel condition (p >0.05). The channel condition effect was significant for the second marker (p = 0.0002) but not for the first marker (p = 0.302), and the marker effect was significant for the within-channel condition (p = 0.0002) but not the across-channel condition (p = 0.498).
The N1 amplitude was significantly larger for the across-channel condition than the within-channel condition but did not differ significantly by ear of stimulation, between markers, or across gap durations. The interaction between marker and channel condition was significant, but none of the other potential interactions were significant (p >0.05). A Tukey HSD post-hoc analysis of the significant interaction revealed that the channel effect was significant for the second marker (p = 0.0002) but not for the first marker (p = 0.406), and that the marker effect was significant for the within-channel condition (p = 0.0002) but not the across-channel condition (p = 0.316).
The P2 amplitude was significantly larger for the first marker than for the second marker and was significantly larger for the across-channel condition than the within-channel condition but did not differ significantly by ear of stimulation or across gap duration. The interactions between marker and gap duration condition and between marker and channel condition were significant. None of the other potential interactions were significant. Tukey HSD post-hoc analyses of the significant interactions revealed that the marker effect occurred only for sub-threshold gap (p = 0.013) and standard gap (p = 0.0002) and not for GDT (p = 0.900) or supra-threshold gap (p = 0.604). The gap effect was not significant for either marker. Also, the channel effect occurred for the second marker (p = 0.0002) but not the first marker (p = 0.832). The marker effect occurred for the within-channel condition (p = 0.0002) but not the across-channel condition (p = 0.715).
In summary, P1 occurred earlier for second markers relative to first markers, N1 occurred earlier for within-channel relative to across-channel, and P2 was significantly early for first markers when relatively large gaps followed the marker. For all three peaks, larger amplitudes were found for first markers than second markers. For second markers, P1-N1-P2 amplitudes were larger for across-channel than within-channel. For across-channel, P1 amplitude was larger for relatively large gaps than for smaller gaps.
Principal component analysis
Step one, of the two-step PCA, parsed the data set into discrete time windows of AEP activation (i.e. temporal factors). A total of 22 temporal factors were Promax-rotated and accounted for 82.2% of the variance. For step two, the AEP variance summarized by each temporal factor was parsed topographically, in order to determine whether coherent AEP activations appearing at distinct regions on the scalp (i.e. spatial factors) could be identified within the time window represented by each temporal factor. Although a spatial PCA was conducted for each of the 22 temporal factors, it was determined that just nine temporal factors (with peak latencies greater than 30 ms and less than 300 ms), when submitted to the spatial PCA, were associated with statistically significant experimental effects. Figures 6 and 7 show the time course of each temporal factor, separated by significant channel effects (Figure 6), and significant gap effects (Figure 7). The peak latency will be used to label each temporal factor hereafter (e.g. temporal factor 1, which had a peak latency of 32 milliseconds, will be called T32).
Figure 6.
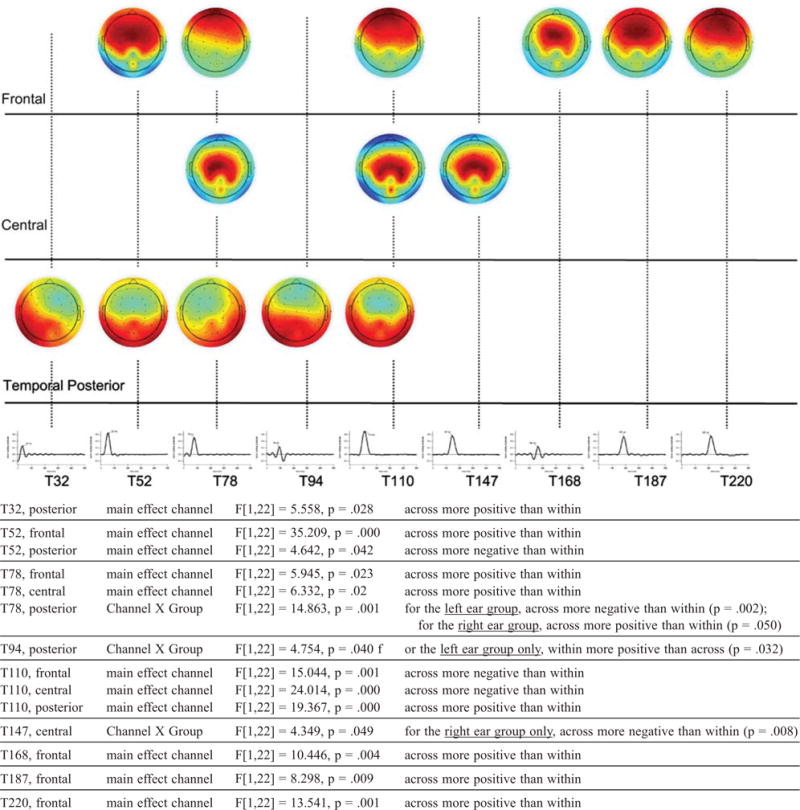
Summary of channel (within, across) and channel by group (right ear, left ear) effects identified via a temporal-spatial principal component analysis (PCA). Temporal factors, shown with peak latencies (in ms, middle), indicate time windows during which channel effects were detected. Scalp maps (top) indicate topographic regions at which channel effects were detected within each time window. The maps are organized loosely by region. Spatial factor loadings range in amplitude from +1 (extreme red) to −1 (extreme blue). Darker areas on each map denote high spatial factor loadings (electrodes with higher loadings have a more prominent role in defining the topographic region of interest associated with each spatial factor).
Figure 7.
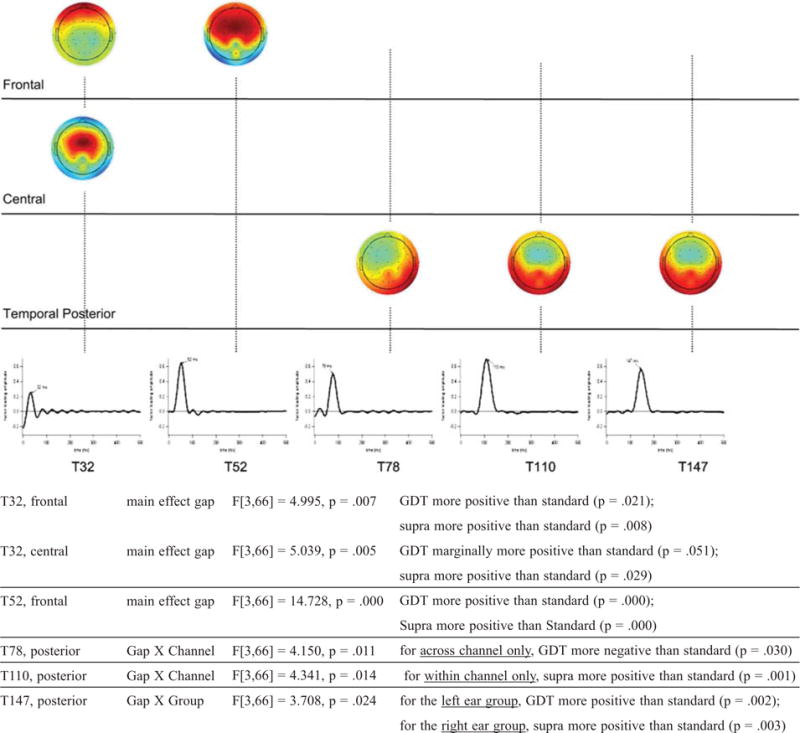
Summary of main effects of gap duration as well as interactions between gap duration and channel condition or gap duration and ear of stimulation identified via temporal-spatial principal component analysis. Temporal factors, shown with peak latencies (in ms, middle), indicate time windows during which gap effects were detected. Scalp maps (top) indicate topographic regions at which gap effects were detected within each time window. The maps are organized loosely by region. Spatial factor loadings range in amplitude from +1 (extreme red) to −1 (extreme blue). Darker areas on each map denote high spatial factor loadings (electrodes with higher loadings have a more prominent role in defining the topographic region of interest associated with each spatial factor).
Channel effects and channel-by-ear interactions
Figure 6 shows nine temporal factors during which channel effects were detected. Each temporal factor is described by a set of loadings. Each time point has a loading, but only those time points with particularly large loadings are important in defining the time-course of each temporal factor. Consecutive, large loadings define a time-window during which voltage readings were redundant; revealing a temporally-local yet coherent pattern of activity. Using a fast sampling rate, such as the 1000 Hz rate used in this study, results in a data set with highly redundant, consecutive voltage readings. Temporal PCA reduces the dimensionality of the data set (i.e. from 501 samples to a much smaller set of temporal factors) or virtual time windows of interest. The highest loading associated with each temporal factor indicates the time at which that voltage pattern peaked in amplitude. Filtering the averaged AEP data through each set of temporal factor loadings isolated the AEP variance within a specific time window for each person, at each of the 64 electrodes, for each of the eight conditions.
The AEP variance associated with each temporal factor was then submitted to a spatial PCA, in order to assess whether voltage readings were redundant at specific groups of electrodes within the time window specified by each temporal factor (using a high-density electrode cap, such as the 64-channel montage used in this study, is what results in a data set with highly redundant voltage readings at neighboring electrodes). Spatial PCA further reduces the dimensionality of the data set, i.e. from 64 electrodes to a smaller set of spatial factors, or virtual scalp regions. The scalp maps in Figure 6, depicting channel loadings, indicate clusters of electrodes at which voltage readings were redundant within each of the nine time windows identified in the temporal PCA step.
Filtering the data by a temporal factor and then by a spatial factor (i.e. by a temporal-spatial factor combination) reveals an isolated pattern of AEP activity within a specific time window (defined by the set of temporal factor loadings) at a specific scalp region (defined by the set of spatial factor loadings). This activity is summarized by factor scores, computed separately for each person, in each condition, during the time window defined by each spatial factor, at the scalp region defined by each temporal factor. In Figure 6 we depict several pairs of temporal-spatial factors at which channel-driven differences were found in the amplitude of the AEP activity. The direction and magnitude of the channel difference is shown in the mean temporal-spatial factor scores shown below each map. Below Figure 6 we report statistically significant channel effects, outlined here from early to late.
First, in the temporal factor (virtual time window) peaking in amplitude at ~32 ms in the left posterior-temporal region, the across-channel scores (summarizing the voltage at ~32 ms at the left posterior-temporal region) had a larger positive-going amplitude than the within-channel scores. This effect seems consistent with an early P1 component. Alternatively, it may reflect an early Pa component of the middle latency response (MLR). The amplitude of both P1 and Pa is typically attenuated with repeated presentations of the same stimulus; an effect believed to be brought about by auditory inhibition (e.g. Key et al, 2005; Cohen, 1982). We note, however, that P1, as well as the Pa of the MLR, are typically more robust at frontal-central electrode sites. Thus, another interpretation is that this posterior-temporal activity was related to extremely early and somewhat posterior T-complex activity. The T-complex is a series of peaks typically occurring in the latency region of 70 to 160 ms that are recorded at temporal electrodes and are associated with activation of the secondary auditory cortex (e.g. Tonnquist-Uhlen et al, 2003; Wolpaw & Penry, 1975). Whatever the specific interpretation, this result suggests that the auditory system was aroused quite early in older listeners when an across-channel change occurred from the first to the second marker.
Next, for the time window peaking in amplitude at ~52 ms, two spatial factors (i.e. two different scalp regions) were associated with AEP activity that differentiated across- versus within-channel processing. At the frontal region, across- was more positive-going than within-channel, consistent with a standard P1 activation or, alternatively, with the Pa component of the MLR, suggesting that auditory inhibition for within-channel was also active during a time window more typically associated with this type of processing. At the posterior region, across- was more negative-going than within-channel, which may represent an early and more posterior Na component of the T-complex.
Moving later in time, for the time window peaking in amplitude at ~78 ms, across-channel elicited frontal and central activity with a larger positive-going amplitude than within-channel (see T78 factor scores in Figure 6). This finding may be interpreted as reflecting P1 activation that was later than usual, and topographically more diffuse than usual. In other words, in older listeners, auditory arousal for across-channel seemed to extend beyond its usual time-course and, possibly, involved recruiting additional neural resources. At this same latency, ear of stimulation drove opposite processing effects at the right posterior scalp region. Left ear-specific processing of channel information, indexed by activity more negative-going in amplitude for across- versus within-channel, continued from ~78 to ~94 ms.
At ~110 ms, across-channel elicited frontal and central negative-going activity versus within-channel; effects consistent with N1 activation, an index of coding the physical change in successive auditory stimuli (right ear-specific central N1 activation continued through 147 ms). Also at ~110 ms, Across-channel elicited posterior positive-going activity versus within-channel, an effect which may be related to the Ta component of the T-complex, a positive peak that occurs ~80–100 ms after stimulus onset, albeit typically more anterior in location than seen here; this difference may be related to the age of the listeners or the specific stimulus parameters.
Finally, across-channel elicited frontal positive-going activity versus within-channel that spanned from ~168 ms to ~220 ms, becoming slightly more topographically diffuse the later this processing continued. We interpret this as a sustained P2-type effect with a slightly-widening topography that may reflect recruitment of additional neural generators over time.
Gap duration effects
Figure 7 shows five time windows during which gap effects (i.e. amplitude differences between gap duration conditions) were detected. Scalp maps indicate the regions at which gap effects were detected within each time window. Filtering the data by each temporal-spatial combination reveals the gap-specific AEP activity within a specific time window at a specific scalp region, summarized by the mean factor scores shown below each map. Below Figure 7 we report statistically significant gap effects, outlined here from early to late.
First, at ~32 ms, GDT and supra-threshold gaps elicited frontal and central positive-going activity relative to standard gap. These effects are consistent with early P1 activation, or as noted above, early activation of the Pa component of the MLR. Enhancement of this component suggests that auditory inhibition was reduced for relatively large gaps at a latency earlier than typically associated with P1 activation; although a similar pattern of frontal P1 activation was also observed at ~52 ms.
Starting at ~78 ms and continuing through ~110 ms, channel and gap interacted variously as follows. At ~78 ms, GDT elicited right posterior negative-going activity relative to standard gap for across-channel only. This effect is consistent with a more posterior than usual Na component of the T-complex and may represent a unique response to threshold gaps in the across-channel condition. Later, at ~110 ms, supra-threshold gap elicited bilateral posterior positive-going activity relative to standard gap, here for within-channel only. This effect is consistent with a posterior Ta component of the T-complex.
Finally, at ~147 ms, ear group and gap interacted, with left ear-stimulation eliciting posterior positive-going activity for GDT versus standard gap; while right ear-stimulation elicited posterior positive-going activity for supra-threshold versus standard gap. These effects are consistent with P2 component activation or, perhaps, reflect very late and posterior Ta (T-complex) activation that is hemisphere-specific. The interpretations given for all effects outlined in this section are tentative and require further investigation.
Discussion
This study was designed to describe the neural representation of the elements of a typical psychophysical gap detection task in a group of older adults, a population known to have poor temporal resolution. Behavioral GDTs were established prior to neural measures and, as expected, were significantly larger for across-channel markers than for within-channel markers. Gap detection thresholds were consistent with those measured previously (e.g. Lister & Roberts, 2005) for similar listeners and similar within-channel (~7 ms) and across-channel (~60 ms) conditions and were larger than those measured for younger adults (see Table 1) in our previous study (Lister et al, 2007) using the same stimuli.
For peak latencies and amplitudes identified at electrode Fz, significant effects of marker, channel, and gap duration were seen. As expected, P1, N1, and P2 were consistently identified for first markers but varied widely in amplitude and latency for second markers (Figure 4). In general, for the second marker, across-channel conditions were associated with significantly longer N1 latencies and larger P1, N1, and P2 amplitudes than within-channel conditions. Also for the second marker, the largest gap duration (supra-threshold) was associated with a significantly larger P1 amplitude than the other gap durations but only for across-channel conditions.
Comparison of responses to each marker revealed several noteworthy and significant effects. First marker responses did not differ by stimulus condition. Second markers were associated with shorter P1 latencies (all gap durations) but longer P2 latencies (larger gap durations only) than first markers. Second markers were also associated with smaller P1, N1, and P2 amplitudes than first markers for the within-channel condition but not for the across-channel condition, and, for P2, only for the smaller gap durations (sub-threshold and standard). The effects of gap duration and channel on P1 amplitude and the effect of channel on N1 and P2 amplitude mentioned above occurred only for the second marker.
As for our previous study (Lister et al, 2007), a temporal-spatial PCA revealed an array of significant channel and gap effects. The older listeners showed significantly larger responses to across-channel conditions at most latencies and spatial locations: 32 ms (temporal-posterior), 52 ms (frontal, temporal-posterior), 78 ms (frontal, central), 110 ms (frontal, central, temporal-posterior), 168 ms (frontal), 187 ms (frontal), and 220 ms (frontal). Significantly larger responses to longer gap durations were seen at three unique time window and spatial location combinations for the older listeners: 32 ms (frontal, central) and 52 ms (frontal). Although main effects of stimulus ear were not seen, several significant interactions were found that included stimulus ear as well as channel and gap duration. These effects may be attributed to MLR, P1, N1, P2 and T-complex activity and represent stimulus-related differences in auditory inhibition/arousal and detection. As discussed next, the PCA approach as well as traditional AEP measures revealed notably different effects for older versus younger listeners.
Age group differences: Comparison to Lister et al (2007)
Group mean waveforms are shown in Figure 4 for each condition as measured from Fz. Generally, the older adults showed a pattern of larger peak amplitudes for P1 and longer peak latencies for P2, with broader peaks for older listeners as compared to younger listeners. Relative to the young adults, a greater number of significant effects were found for the older listeners for peak amplitudes and latencies measured at Fz. That is, in older listeners, more, and sometimes different, neural generators that are involved in auditory processing may be recruited versus those seen in younger listeners; and at different latencies. Four-way ANOVAs were used to assess group effects. Because no ear effects were apparent for the older group data and only right ear stimulation was used for the young adults, ear was not considered in these single-electrode, age-group analyses. Instead, one between-subjects factor (age group) and three within-subjects factors (marker, channel, gap) were included. For the first marker, older listeners showed significantly longer P2 latencies relative to the young adults (p = 0.00016), but none of the other peak latencies or amplitudes differed by group. For the second marker, older listeners showed longer P2 latencies (p < 0.0001) and larger P1 amplitudes (p = 0.0501) compared to the young adults. Particularly interesting was the pattern of P1 amplitude differences across gap duration conditions for the across-channel condition. For the young adults, P1 was relatively small for all gaps except the GDT gap. In contrast, the P1 of the older listeners was larger overall and appeared to increase in amplitude as gap duration increased, such that the largest P1 was found for the supra-threshold gap. Enhanced P1 reflects arousal by task-relevant stimuli whereas P1 attenuation reflects cortical inhibition of irrelevant stimulus processing. If so, it would seem that this aspect of auditory processing of temporal information is functioning much more efficiently for younger listeners than older listeners. PCA-driven P1 results, discussed below, support this interpretation.
The present PCA results, parsing older-listener AEP responses to gap and channel information, show some similarities but mostly differences in comparison with the PCA results reported for younger listeners in Lister et al (2007). At a gross time-course level, older listeners coded certain types of gap information at earlier intervals than younger listeners, while younger listeners coded certain types of gap information later in time versus older listeners. Channel effects, too, were coded at earlier intervals by older versus younger listeners. However, older rather than younger listeners continued coding channel information at later time intervals.
At a gross topographic level, both younger and older listeners exhibited frontal-, central-, and posterior-maximum AEP effects. However, a notable difference was observed in the number of frontal-maximum effects observed between groups, with older listeners exhibiting more frontal activity than younger listeners, particularly when coding channel information.
As noted in the section above, both the young and older groups exhibited a general pattern of P1-N1-P2 modulation at the onset of the second marker relative to stimulus parameters. Significant differences in the time-course, scalp topography, and/or condition-sensitivity of these and other AEP components for our older versus younger groups—detected via PCA and outlined next—suggest that specific aspects of central auditory processing of gap and channel cues may change with aging. Note that for concision, we omit discussion of ear-of-stimulation effects observed in the older group, limiting our focus to comparing effects that generalized to the entire group of older listeners versus younger listeners.
The P1 appeared earlier (at ~30 ms) for older listeners for processing of both gap and channel information (versus at ~50 ms for younger listeners for processing of channel information) and continued to be observed later (at ~78 ms) for older listeners for processing of channel information. These effects suggest that, in older listeners, auditory arousal was triggered early by both gap and channel cues, and somewhat later by channel cues in younger listeners. These effects also suggest that auditory arousal triggered by channel cues spanned a longer time-course in older listeners.
In addition to P1 effects, both younger and older listeners exhibited early posterior-temporal activity (possibly related to the T-complex). In younger listeners, an early posterior-temporal component was enhanced by supra-threshold versus standard gap processing (at ~50 ms). In older listeners, this same component was enhanced by across- versus within-channel processing. These effects point to the early recruitment of an additional neural resource(s) (i.e. beyond P1 generators) in both groups; albeit for processing different types of cues (gap cues in younger listeners, channel cues in older listeners).
The P1 activation (auditory arousal or lack of auditory inhibition) and early posterior-temporal activations were followed by N1 activations. Two N1 components are known to code physical changes in auditory stimuli (i.e. changes in pitch, duration, intensity). One is an early (~75 ms peak latency) temporal-maximum N1 activation, which may also be considered a component of the T-complex (e.g. Wolpaw & Penry, 1975). At ~80 ms, both channel and gap (specifically, supra-threshold) cues were coded by a posterior-temporal N1 activation in younger listeners. While, as noted above, early (and possibly more posterior than usual T-complex) activity was modulated only by gap processing in younger listeners, this later posterior-temporal activity was modulated by both gap and channel information in younger listeners. At this same latency, gap (specifically, GDT) cues were coded by an enhanced N1 activation in older listeners, but only for across-channel; the topographic distribution of this effect was limited to the right posterior-temporal region. While, as noted above, early posterior-temporal activity was modulated by channel information in older listeners, later posterior-temporal activity was modulated to a limited extent by gap processing in older listeners. Based on these observations, early posterior-temporal modulation is not as robust a cue of gap processing in older listeners as it is in younger listeners (as noted above, P1 activation does appear to be a robust, early index of gap processing in older listeners). If one assumes that the younger auditory system represents efficient processing of auditory stimuli, then the early (in some cases extremely early) and continued processing of channel cues with later processing of gap cues observed for older listeners represents the inefficiency of the aging auditory system and may help to explain the poor temporal processing, particularly for across-channel stimuli, observed in this population.
The other N1 component sensitive to physical changes in auditory stimuli is a later (~100 ms peak latency) vertex-maximum N1 activation (e.g. Naatanen & Picton, 1987). At ~100 ms, across- versus within-channel cues presented at a standard gap duration were coded by a frontal-central (near-vertex) N1 activation in younger listeners. Slightly later, at ~110 ms, across- versus within-channel cues presented at all gap durations were coded by a vertex N1 activation in both younger and older listeners. Thus, the later, vertex N1 coded channel information in both groups, albeit a bit earlier in younger listeners when no detectable gap was present.
At about the same latency as the later vertex N1 component (at ~110 ms), older listeners exhibited posterior-temporal positive-going activity modulated by both channel and gap cues; an effect possibly related to a more posterior than usual Ta component of the T-complex. As with the possible T-complex effects noted previously in this section, this later Ta component was modulated by gap cues only to a very limited extent in the older listeners (i.e. Ta amplitude was modulated by supra- versus standard, but only in the within-channel condition), supporting the idea that T-complex modulation is not a robust index of gap processing in older listeners. In general, these effects seem to indicate the older listeners are relying on a combination of channel plus gap cues to process gaps at the posterior-temporal (perhaps T-complex) level, while younger listeners do not at this latency.
Before leaving the N1 component, it should be noted that an even later (~130 ms peak latency) temporal N1 activation has been related to differing states of auditory attention (e.g. Naatanen & Picton, 1987). In the younger listeners, a later (~150 ms) temporal-maximum N1 enhancement for across- versus within-channel processing was observed; an effect only seen for supra-threshold gaps. The combination of a frequency change separated by a particularly long gap likely had a robust effect on the attentional state of younger listeners; an effect not seen for the older listeners.
Several P2 activations were seen following N1 activations. Like N1 amplitude, P2 amplitude can be modulated by the coding of physical changes in auditory stimuli such as pitch and intensity (e.g. Key et al, 2005). On the early side of the P2 activation range (at ~150 ms), P2 was enhanced for across- versus within-channel following longer gap durations (GDT, supra-threshold) for the younger group. Later, at ~170 ms, P2 was enhanced by across- versus within-channel processing at all gap durations in the older group; while at this latency GDT versus standard gap enhanced P2 activation in younger listeners. Even later, at ~185 ms, generalized P2 enhancement (at all gap durations) for across- versus within-channel was observed for both older and younger listeners; an effect seen through ~220 ms for older listeners. These effects primarily reveal that P2 coded both channel and gap effects in young listeners while P2 coded only channel effects in older listeners.
Instead, gap information was coded later, in our older listeners, by a posterior-temporal positivity seemingly related to T-complex activation (at ~150 ms). It is noteworthy that this later, posterior, Ta-type component of the T-complex coded gap information in the older listeners, as another Ta-type component (at ~110 ms) was also shown to respond to gap information in older listeners. In contrast, as noted previously, early T-complex-related effects did not respond robustly to gap processing in this group. The diagnostic and clinical significance of recruiting later-occurring T-complex-like generators for gap processing with aging, instead of earlier-occurring T-complex-like generators as seen in the younger group, is as yet unclear but warrants further study and may provide critical information regarding temporal deficits in older listeners.
Previous aging studies of the P1-N1-P2 response have shown variable results that may be attributed to differences in stimuli, level, and paradigm (for review see Ceponiene et al, 2008). Most studies in this area have focused on single-electrode (Fz) responses, and none used narrow band noise stimuli separated by a silent gap in within- and across-channel conditions; however, some did use complex (i.e. not pure tone) stimuli in a non-oddball paradigm with an approximately one second inter-stimulus interval and passive listeners like the present study (e.g. Tremblay et al. 2004). Tremblay et al (2004) used speech syllables separated by a silent gap to show that N1 latency was longer for older listeners for long gap durations and P2 latency was longer for older listeners for all gap durations. They did not find any age-related amplitude differences for the speech stimuli. In a separate experiment using a pure-tone stimulus, Tremblay et al (2004) found larger P1 amplitudes but no latency differences for older listeners. Our P2 latency results agree with those of Tremblay et al (2004) for speech, but our P1 amplitude results agree with their findings for pure tones. It should be noted, though, that we did not find an effect of P1 amplitude for the first marker and Tremblay et al measured the P1-N1-P2 response synchronized with the onset of the entire speech syllable (/ba/ or /pa/) and not the beginning of the /a/ which would be equivalent to the second marker in our study. This is supportive of the conclusion that age-related changes in P1-N1-P2 vary by stimulus complexity. Age-related differences in P1 amplitude have been interpreted as indicating reduced auditory inhibition (or enhanced auditory arousal) for irrelevant stimuli, and age-related differences in P2 latency may be reflective of slowed neural travel time.
Compared to the young listeners, the responses of the older listeners, whether measured at Fz only or compared across the entire array of 32 electrodes, represent a greater number and duration of responses following the onset of a second marker in a gap detection paradigm. Consistent with previous literature, older adults show a difference in auditory inhibition/arousal and a generally greater level of activity across multiple scalp locations. This may contribute to poor speech understanding in noisy, real-world listening environments that are filled with important temporal cues which must be gated appropriately.
Because age-related changes in the P1-N1-P2 response appear to be stimulus-specific (e.g. Ceponiene et al, 2008), it is important to measure the response for the particular population and stimulus of interest. Also, because older adults often have some degree of high frequency hearing loss, it is important to consider the effects of high frequency hearing sensitivity on the processing of stimuli across the frequency range, even stimuli that fall into regions of normal hearing. In addition to older adults with and without hearing loss, populations with poor temporal resolution include but are not limited adults with hearing loss (e.g. Lister & Roberts, 2005), adults and children with dyslexia (e.g. Van Ingelghem et al, 2001), and adults and children with auditory neuropathy (e.g., Zeng et al, 1999). Fortunately, auditory temporal resolution has been shown to be amenable to training (e.g. Merzenich et al, 1996); training-related improvements in temporal resolution have been associated with increases in the amplitude of the N1 and P2 response (e.g. Tremblay et al, 2001); and training-related improvements in vowel perception among older adults have been associated with a reduced N1 amplitude at inferior and posterior temporal-occipital sites (e.g. Alain & Snyder, 2008), providing support for, and potential clinical application of, the results reported.
Conclusion
This study was designed to provide a description of the cortical response to silent gaps in a population known to have poor and highly variable temporal resolution, older adults, using within-channel and across-channel stimulus conditions identical to those used in psychophysical studies of gap detection. Using narrow-band noise stimuli separated by a silent gap, we found that the amplitude of P1, N1, and P2 is larger and the latency of N1 is longer for across-channel conditions compared to within-channel conditions for older adults. Also for this group, P1 amplitude was largest for the largest gap duration (supra-threshold) in the across-channel condition; second markers were associated with shorter P1 latencies but longer P2 latencies than first markers. Relative to younger adults (Lister et al, 2007), older adults showed longer P2 latencies and larger P1 amplitudes, suggesting relatively slower neural travel time and altered auditory inhibition/arousal by irrelevant stimuli. The temporal-spatial principal component analysis revealed that the responses of the older adults were greater in number, covered a longer latency window, and represented a distinctly different spatial pattern than those of the young adults.
While channel and marker effects were apparent across the latency and topographic windows, neurophysiological markers of gap duration were more elusive in the older adult group. The P1 was a clear marker of gap detection threshold among the younger adults, but, for older adults, P1 was larger overall and appeared to increase in amplitude as gap duration increased. Older adults appeared to recruit later-occurring T-complex-like generators for gap processing, instead of earlier-occurring T-complex-like generators as seen in the younger group. The early and continued processing of channel cues with later processing of gap cues observed for older listeners may represent the inefficiency of the aging auditory system. Specifically, our older listeners may have been distracted by and/or failed to suppress across-channel cues which, it can be argued, were more salient than gap cues in this task. This may help to explain the poor temporal processing, particularly for across-channel stimuli, observed in this population.
In summary, altered auditory inhibition/arousal, slowed neural travel time, and generally greater level of activity across multiple scalp locations demonstrated by the older adults in response to auditory temporal cues has important implications for speech understanding in noise. These data provide non-invasive, non-behavioral indicators of the neural coding of an important temporal cue in the thalamic-cortical region of the central auditory system in a population with poor temporal resolution.
Acknowledgments
The authors would like to thank Lauren B. Stack for her assistance in data collection. Portions of the data described here were presented at the meeting of the Association for Research in Otolaryngology in 2006 in Baltimore, USA; the 28th International Congress of Audiology in 2006 in Innsbruck, Austria; the Aging and Speech Communication conference in 2009 in Bloomington, USA; and the conference of the American Speech Language Hearing Association in 2009 in New Orleans, USA.
This work was supported by a grant (R03AG024589) from the National Institute on Aging.
Abbreviations
- AEP
Auditory evoked potential
- EEG
Electroencephalographic
- GDT
Gap detection threshold
- NBN
Narrow band noise
- PCA
Principal component analysis
- TDT
Tucker Davis Technologies
Footnotes
Declaration of interest: The authors report no declarations of interest.
References
- Alain C, Schneider J. Age-related differences in auditory evoked responses during rapid perceptual learning. Clinical Neurophysiology. 2008;119:356–366. doi: 10.1016/j.clinph.2007.10.024. [DOI] [PubMed] [Google Scholar]
- Barsz K, Ison J, Snell K, Walton J. Behavioral and neural measures of auditory temporal acuity in aging humans and mice. Neurobiology of Aging. 2002;23:565–578. doi: 10.1016/s0197-4580(02)00008-8. [DOI] [PubMed] [Google Scholar]
- Ceponiene R, Westerfield M, Torki M, Townsend J. Modality-specificity of sensory aging in vision and audition: Evidence from event-related potentials. Brain Research. 2008;1215:53–68. doi: 10.1016/j.brainres.2008.02.010. [DOI] [PubMed] [Google Scholar]
- Cohen M. Coronal topography of the middle latency auditory evoked potentials (MLAEPs) in man. Electroencephalogr Clin Neurophysiol. 1982;53:231–236. doi: 10.1016/0013-4694(82)90028-1. [DOI] [PubMed] [Google Scholar]
- Creasey H, Rapoport S. The aging human brain. Annals of Neurology. 1985;17:2–10. doi: 10.1002/ana.410170103. [DOI] [PubMed] [Google Scholar]
- Dien J, Frishkoff GA. Principal components analysis of event-related potential datasets. In: Handy T, editor. Event-related potentials: A methods handbook. Cambridge: MIT Press; 2005. [Google Scholar]
- Eddins D, Hall J, Grose J. The detection of temporal gaps as a function of frequency region and absolute noise bandwidth. J Acoustic Soc Am. 1992;91:1069–1077. doi: 10.1121/1.402633. [DOI] [PubMed] [Google Scholar]
- Fitzgibbons P, Gordon-Salant S. Minimum stimulus levels for temporal gap resolution in listeners with sensorineural hearing loss. J Acoustic Soc Am. 1987;81:1542–1545. doi: 10.1121/1.394506. [DOI] [PubMed] [Google Scholar]
- Fitzgibbons P, Gordon-Salant S. Age effects on duration discrimination with simple and complex stimuli. J Acoustic Soc Am. 1995;98:3140–3145. doi: 10.1121/1.413803. [DOI] [PubMed] [Google Scholar]
- Fitzgibbons P, Gordon-Salant S, Friedman S. Effects of age and sequence presentation rate on temporal order recognition. J Acoustic Soc Am. 2006;120:991–999. doi: 10.1121/1.2214463. [DOI] [PubMed] [Google Scholar]
- Folstein M, Folstein SE, McHugh PR. ‘Mini-mental state’: A practical method for grading the cognitive state of patients for the clinician. J Psychiatr Res. 1975;12(3):189–198. doi: 10.1016/0022-3956(75)90026-6. [DOI] [PubMed] [Google Scholar]
- Gehr S, Sommers M. Age differences in backward masking. J Acoustic Soc Am. 1999;106:2793–2799. doi: 10.1121/1.428104. [DOI] [PubMed] [Google Scholar]
- Glasberg B, Moore B, Bacon S. Gap detection and masking in hearing-impaired and normal-hearing subjects. J Acoustic Soc Am. 1987;81:1546–1556. doi: 10.1121/1.394507. [DOI] [PubMed] [Google Scholar]
- Gordon-Salant S, Fitzgibbons P. Temporal factors and speech recognition performance in young and elderly listeners. J Sp Lang Hear Res. 1993;36:1276–1285. doi: 10.1044/jshr.3606.1276. [DOI] [PubMed] [Google Scholar]
- Greenhouse SW, Geisser S. On methods in the analysis of profile data. Psychometrika. 1959;24:95–112. [Google Scholar]
- Hyde M. The N1 response and its applications. Audiology and Neuro-Otology. 1997;2:281–307. doi: 10.1159/000259253. [DOI] [PubMed] [Google Scholar]
- Key A, Dove G, Maguire M. Linking brainwaves to the brain: An ERP primer. Dev Neuropsychol. 2005;27:183–215. doi: 10.1207/s15326942dn2702_1. [DOI] [PubMed] [Google Scholar]
- Levitt H. Transformed up-down methods in psychoacoustics. J Acoustic Soc Am. 1971;49:467–477. [PubMed] [Google Scholar]
- Lister J, Besing J, Koehnke J. Effects of age and frequency disparity on gap duration discrimination. J Acoustic Soc Am. 2002;111:2793–2800. doi: 10.1121/1.1476685. [DOI] [PubMed] [Google Scholar]
- Lister J, Maxfield N, Pitt G. Cortical evoked response to gaps in noise: Within-channel and across-channel conditions. Ear Hear. 2007;28:862–878. doi: 10.1097/AUD.0b013e3181576cba. [DOI] [PMC free article] [PubMed] [Google Scholar]
- Lister J, Roberts R. Effects of age and hearing loss on gap detection and the precedence effect: Narrow-band stimuli. J Sp Lang Hear Res. 2005;48:482–493. doi: 10.1044/1092-4388(2005/033). [DOI] [PubMed] [Google Scholar]
- Lister J, Tarver K. Effect of age on silent gap discrimination in synthetic speech stimuli. J Sp Lang Hear Res. 2004;47:257–269. doi: 10.1044/1092-4388(2004/021). [DOI] [PubMed] [Google Scholar]
- Merzenich M, Jenkins W, Johnston P, Schreiner C, Miller S, et al. Temporal processing deficits of language-learning impaired children ameliorated by training. Science. 1996;271:77–81. doi: 10.1126/science.271.5245.77. [DOI] [PubMed] [Google Scholar]
- Naatanen R, Picton T. The N1 wave of the human electric and magnetic response to sound: A review and analysis of the component structure. Psychophysiology. 1987;24:375–425. doi: 10.1111/j.1469-8986.1987.tb00311.x. [DOI] [PubMed] [Google Scholar]
- Ostroff J, Martin B, Boothroyd A. Cortical evoked responses to acoustic change within a syllable. Ear Hear. 1998;19:290–297. doi: 10.1097/00003446-199808000-00004. [DOI] [PubMed] [Google Scholar]
- Oxenham A. Influence of spatial and temporal coding on auditory gap detection. J Acoustic Soc Am. 2000;107:2215–2223. doi: 10.1121/1.428502. [DOI] [PubMed] [Google Scholar]
- Phillips D, Taylor T, Hall S, Carr M, Mossop J. Detection of silent intervals between noises activating different perceptual channels: Some properties of central auditory gap detection. J Acoustic Soc Am. 1997;101:3694–3705. doi: 10.1121/1.419376. [DOI] [PubMed] [Google Scholar]
- Plomp R. Rate of decay of auditory sensation. J Acoustic Soc Am. 1964;36:277–282. [Google Scholar]
- Schneider B, Hamstra S. Gap detection thresholds as a function of tonal duration for younger and older listeners. J Acoustic Soc Am. 1999;106:371–380. doi: 10.1121/1.427062. [DOI] [PubMed] [Google Scholar]
- Tonnquist-Uhlen I, Ponton C, Eggermont J, Kwong B, Don M. Maturation of human central auditory system activity: The T-complex. Clin Neurophysiol. 2003;114:685–701. doi: 10.1016/s1388-2457(03)00005-1. [DOI] [PubMed] [Google Scholar]
- Tremblay K, Billings C, Rohila N. Speech evoked cortical potentials: Effects of age and stimulus presentation rate. J Am Acad Audiol. 2004;15:226–237. doi: 10.3766/jaaa.15.3.5. [DOI] [PubMed] [Google Scholar]
- Tremblay K, Friesen L, Martin B, Wright R. Test-retest reliability of cortical evoked potentials using naturally produced speech sounds. Ear Hear. 2003;24:225–232. doi: 10.1097/01.AUD.0000069229.84883.03. [DOI] [PubMed] [Google Scholar]
- Tremblay K, Kraus N, McGee T, Ponton C, Otis B. Central auditory plasticity: Changes in the N1-P2 complex after speech-sound training. Ear Hear. 2001;22(2):79–90. doi: 10.1097/00003446-200104000-00001. [DOI] [PubMed] [Google Scholar]
- Van Ingelghem M, van Wieringen A, Wouters J, Vandenbussche E, Onghena P, et al. Psychophysical evidence for a general temporal processing deficit in children with dyslexia. NeuroReport. 2001;12:3603–3607. doi: 10.1097/00001756-200111160-00046. [DOI] [PubMed] [Google Scholar]
- Walhovd K, Fjell A. One-year test-retest reliability of auditory ERPs in young and old adults. Int J Psychophysiol. 2002;46:29–40. doi: 10.1016/s0167-8760(02)00039-9. [DOI] [PubMed] [Google Scholar]
- Walton J, Barsz K, Wilson W. Sensorineural hearing loss and neural correlates of temporal acuity in the inferior colliculus of the C57bl/6 mouse. Journal of the Association for Research in Otolaryngology. 2008;9:90–101. doi: 10.1007/s10162-007-0101-z. [DOI] [PMC free article] [PubMed] [Google Scholar]
- Walton J, Frisina R, Ison J, O’ Neill W. Neural correlates of behavioral gap detection in the inferior colliculus of the young CBA mouse. J Comp Physiol. 1997;181:161–176. doi: 10.1007/s003590050103. [DOI] [PubMed] [Google Scholar]
- Walton J, Frisina R, O’ Neill W. Age-related alteration in processing of temporal sound features in the auditory midbrain of the CBA mouse. The Journal of Neuroscience. 1998;18:2764–2776. doi: 10.1523/JNEUROSCI.18-07-02764.1998. [DOI] [PMC free article] [PubMed] [Google Scholar]
- West R. An application of prefrontal cortex function theory to cognitive aging. Psychological Bulletin. 1996;120(2):272–292. doi: 10.1037/0033-2909.120.2.272. [DOI] [PubMed] [Google Scholar]
- Wolpaw J, Penry J. A temporal component of the auditory evoked response. Electroencephalography and Clinical Neurophysiology. 1975;39:609–620. doi: 10.1016/0013-4694(75)90073-5. [DOI] [PubMed] [Google Scholar]
- Zeng F, Oba S, Garde S, Sininger Y, Starr A. Temporal and speech processing deficits in auditory neuropathy. NeuroReport. 1999;10:3429–3435. doi: 10.1097/00001756-199911080-00031. [DOI] [PubMed] [Google Scholar]