Abstract
Resistance to insulin action is a key cause of diabetic complications, yet much remains unknown about the molecular mechanisms that contribute to the defect. Glucose-induced insulin resistance in peripheral tissues such as the retina is mediated in part by the hexosamine biosynthetic pathway (HBP). Glucosamine (GAM), a leading dietary supplement marketed to relieve the discomfort of osteoarthritis, is metabolized by the HBP, and in doing so bypasses the rate-limiting enzyme of the pathway. Thus, exogenous GAM consumption potentially exacerbates the resistance to insulin action observed with diabetes-induced hyperglycemia. In the present study, we evaluated the effect of GAM on insulin action in retinal Müller cells in culture. Addition of GAM to Müller cell culture repressed insulin-induced activation of the Akt/mTORC1 signaling pathway. However, the effect was not recapitulated by chemical inhibition to promote protein O-GlcNAcylation, nor was blockade of O-GlcNAcylation sufficient to prevent the effects of GAM. Instead, GAM induced ER stress and subsequent expression of the protein Regulated in DNA Damage and Development (REDD1), which was necessary for GAM to repress insulin-stimulated phosphorylation of Akt on Thr308. Overall, the findings support a model whereby GAM promotes ER stress in retinal Müller cells, resulting in elevated REDD1 expression and thus resistance to insulin action.
Keywords: Glucosamine, Insulin, Hexosamine Biosynthetic Pathway, Regulated in DNA Damage and Development 1, O-GlcNAcylation, ER Stress
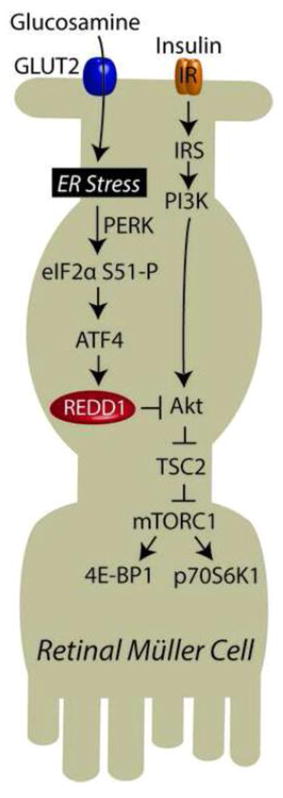
Graphical abstract
1. Introduction
Diabetic retinopathy (DR) is the leading cause of blindness in working age adults in the USA. The pathogenesis of DR is caused by a combination of vascular and neuronal complications due to increased hyperglycemia and attenuated activation of signaling pathways associated with the action of insulin. Unlike some cell types that are able to reduce the rate of glucose uptake when exposed to hyperglycemia, certain cell types in the retina lack the molecular machinery to do so. Thus, diabetes increases the intracellular glucose concentration of retinal tissues (1). Most of this glucose is metabolized through glycolysis, via its conversion to glucose-6-phosphate and then fructose 6-phosphate (F6P). However, 2–5% of F6P is diverted into the hexosamine biosynthetic pathway (HBP), via conversion to glucosamine-6-phosphate (GlcN6P) by the HBP’s rate limiting enzyme glutamine-fructose-6-phosphate amidotransferase (GFAT). GlcN6P is then irreversibly converted to the end-product of the HBP, UDP-N-acetylglucosamine (UDP-GlcNAc), which serves as the substrate for the post-translational modification of proteins by the covalent O-linked addition of N-acetylglucosamine (O-GlcNAc). Insulin resistance has been previously linked to elevated O-GlcNAc modification of key signaling proteins such as IRS1 (2) and Akt (3). Furthermore, increased glucose flux through the HBP at least in part mediates insulin desensitization in response to hyperglycemic conditions, as the effect can be eliminated by inhibition of GFAT [3,4].
In response to hyperglycemia, flux thought the HBP is moderated by allosteric feedback from UDP-GlcNAc to inhibit GFAT. However, metabolism of the amino monosaccharide glucosamine (GAM) bypasses GFAT as it is directly phosphorylated to generate GlcN6P. GAM is consumed by ~20% of the U.S. population over the age of 18 as a dietary supplement (4). GAM supplementation is marketed to relieve the symptoms of osteoarthritis by supporting joint structure and function. Notably, systemic inflammation resultant from diabetes-induced hyperglycemia has been linked to the symptoms of osteoarthritis (5). However, while some studies suggest that GAM supplementation has limited effects on glucose metabolism (6–8), others demonstrate exacerbation of insulin resistance in humans consuming doses used to treat osteoarthritis (9). GAM is transported into cells by facilitated transport, and notably GLUT2 functions as a high affinity (~20-fold lower Km for GAM than glucose) GAM transporter (10). Thus, even at relatively low plasma concentrations, GAM uptake by GLUT2-expressing cells has the potential to dramatically elevate UDP-GlcNAc production and attenuate the activation of insulin responsive signaling pathways such as Akt/mTORC1.
In the retina, GLUT2 is exclusively localized to the apical surface of Müller cells (11). Retinal Müller cells are the principal glial cells of the retina and play a critical role in the modulation and maintenance of retinal neurons and vasculature, as they directly interact with those cells types. Furthermore, they are responsible for the synthesis and secretion of a number of hormones, such as the pro-angiogenic cytokine vascular endothelial growth factor (VEGF), that play an essential and causative role in retinal vascular complications (12). Our laboratory recently demonstrated that inhibition of the mTORC1 signaling pathway contributes to Müller cell derived synthesis of VEGF in response to diabetes (13). A key regulator of this effect is the translational repressor 4E-BP1. The interaction of 4E-BP1 with the mRNA cap-binding protein eIF4E is reversibly regulated by mTORC1-dependent phosphorylation of 4E-BP1 (14). Upon phosphorylation by mTORC1, 4E-BP1 is released from eIF4E, allowing eIF4E to bind to eIF4G to form the eIF4F-cap binding complex. Sequestration of eIF4E by 4E-BP1 is elevated in the retina of diabetic mice, and ablation of 4E-BP1 is sufficient to prevent diabetes-induced VEGF expression (15). Thus, by altering the signaling pathways that regulate 4E-BP1, GAM potentially recapitulates some of the metabolic dysfunction associated with diabetes.
In the present study, we evaluated the hypothesis that GAM alters the responsiveness of the mTORC1 signaling pathway to insulin in retinal Müller cells. We report that the addition of GAM to cell culture medium was sufficient to promote eIF4E sequestration by 4E-BP1 and repress insulin-induced activation of mTORC1 in retinal Müller cells. Activation of the serine/threonine kinase Akt is required for insulin-induced activation of mTORC1 to promote 4E-BP1 phosphorylation (14). Notably, GAM attenuated insulin-stimulated phosphorylation of Akt on Thr308, but not on Ser473. A similar effect on Akt phosphorylation has been reported in response to induction of the protein Regulated in DNA Damage and Development (REDD1), which promotes protein phosphatase 2A (PP2A)-dependent dephosphorylation on Thr308, but not Ser473 (16). Indeed, REDD1 expression was elevated in Müller cells exposed to GAM and the protein was necessary for GAM to repress insulin-stimulated phosphorylation of Akt on Thr308. Overall, the findings support a model whereby GAM promotes ER stress in retinal Müller cells, resulting in elevated expression of REDD1 and thus resistance to insulin action.
2. Material and Methods
2.1 Materials
Preparation of the 4E-BP1 and eIF4E antibodies has been previously described (17,18). REDD1 and ATF4 antibodies were purchased from Proteintech. Goat anti-mouse and goat anti-rabbit IgG horseradish peroxidase-conjugated antibodies were purchased from Bethyl Laboratories. Anti-GAPDH antibody was purchased from Santa Cruz and anti-actin antibody was purchased from Sigma. All other antibodies, including anti-O-GlcNAc (CTD110.6), were obtained from Cell Signaling.
2.2 Cell culture
TR-MUL retinal Müller cells were provided by K. Hosoya (Toyama Medical and Pharmaceutical University), and REDD1+/+and REDD1−/− MEFs were provided by L. Ellison (Massachusetts General Hospital Cancer Center). Cells were maintained in DMEM containing 5 mM glucose and supplemented with 10% FBS (Atlas Biologicals) and 1% penicillin/streptomycin (Invitrogen). Cells were maintained at either 33°C (TR-MUL) or 37°C (MEFs) and 5% CO2 atmosphere. Where indicated, cells were exposed to culture medium supplemented with either an additional 25 mM glucose, 3mM GAM (Sigma), 50 nM Thiamet G, and/or 10 nM ST045849 (TimTec) or vehicle controls for 16 h. To assess insulin action, cells were deprived of serum for 3 h and then stimulated with 0–100 nM insulin (Novolin) for 30 min.
2.3 Protein analysis and immunoprecipitations
Whole cell lysates were collected in 1x SDS sample buffer, boiled for 5 min, and analyzed by Western blotting. Alternatively, cells were collected in lysis buffer [20 mM HEPES (pH 7.4), 2 mM EGTA, 50 mM NaF, 100 mM KCl, 0.2 mM EDTA disodium salt, 50 mM β-glycerophosphate, 1mM sodium vanadate, 1 mM benzamidine and 10 μg/mL protease inhibitor cocktail (Sigma)], incubated at 4°C for 20 min, and supernatant fractions were collected following centrifugation at 1,000 x g for 10 min. Immunoprecipitation of eIF4E from supernatant fractions was performed as previously described (19) and immunoprecipitates were analyzed by Western blotting.
2.4 RNA isolation and PCR analysis
RNA was extracted from cells with TRIzol reagent (Invitrogen) according to the manufacturer’s instructions. RNA (1 μg) was reverse transcribed using a High Capacity cDNA Reverse Transcription Kit (Applied Biosystems) and subjected to quantitative real-time PCR using QuantiTect SYBR Green (Qiagen) to assess REDD1 and actin mRNA levels as previously described (20). XBP1 processing was assessed as previously described (21) using the primers 5′-ACA CGC TTG GGG ATG AAT GC-3′ and 5′-CCA TGG GAA GAT GTT CTG GG-3′.
2.5 Statistical analysis
The data are expressed as mean + SE. Analysis of variance was used to identify differences between group means. When identified, student’s t test was used post hoc to compare differences among groups. p < 0.05 was considered statistically significant.
3 Results
3.1 Glucosamine impairs activation of mTORC1 by insulin in retinal TR-MUL cells in culture
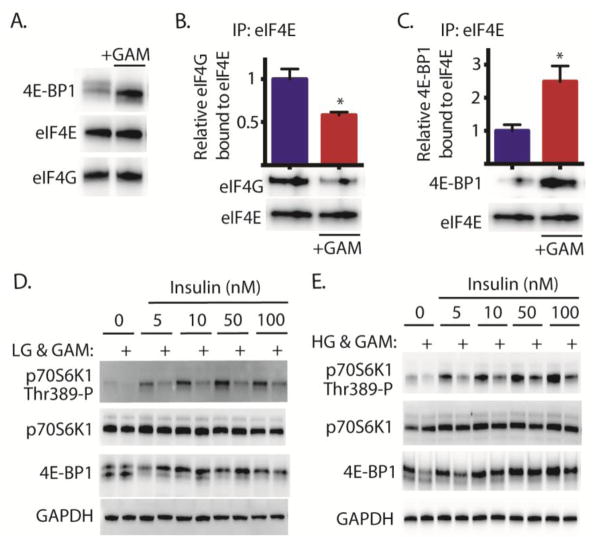
When retinal TR-MUL cells were exposed to GAM, 4E-BP1 phosphorylation was diminished as evidenced by increased electrophoretic mobility (Fig 1A). To evaluate the functional consequence of diminished phosphorylation, sequestration of eIF4E by 4E-BP1 was evaluated in TR-MUL cells by immunoprecipitation of eIF4E from cell lysates. GAM reduced co-immunoprecipitation of eIF4G with eIF4E (Fig 1B) and enhanced co-immunoprecipitation of 4E-BP1 with eIF4E (Fig 1C). The best-characterized mechanism for controlling the interaction of eIF4G and 4E-BP1 with eIF4E involves mTORC1 dependent phosphorylation of 4E-BP1. To assess the effect of GAM on insulin-stimulated mTORC1 activation, GAM was administered to TR-MUL cells cultured in medium containing either low (Fig 1D) or high (Fig 1E) glucose concentrations. Cells were then serum deprived and stimulated with insulin. GAM attenuated insulin-induced phosphorylation of the mTORC1 substrates p70S6K1 and 4E-BP1 (Fig 1D). We previously demonstrated a similar attenuation of mTORC1 substrate phosphorylation in TR-MUL cells in response to hyperglycemic conditions (13). Notably, the repressive effect of GAM was independent of the glucose concentration in the cell culture medium (Fig 1E).
Figure 1. Glucosamine attenuates insulin action in retinal TR-MUL cells in culture.
Retinal TR-MUL Müller cells in culture were maintained in DMEM containing 5 mM glucose and supplemented with 10% FBS. Cells were exposed to medium supplemented 3 mM glucosamine in the presence of low (5 mM, A–D) or high (30 mM, E) glucose concentrations for 16 h as indicated. Binding of eIF4G (B) and 4E-BP1 (C) to eIF4E was assessed in cell lysates by co-immunoprecipitation. D–E, Cells were deprived of serum for 3 h prior to the addition of insulin as indicated. The phosphorylation of p70S6K1 on Thr389, as well as presence of eIF4G, 4E-BP1, eIF4E, p70S6K1, and GAPDH was assessed by Western blot analysis. Representative blots from 2 replicated experiments are shown. Values are means + S.E. (n = 4 ). Statistical significance is denoted *, p < 0.05 versus the absence of GAM.
3.2 Glucosamine represses site-specific phosphorylation of Akt on Thr308
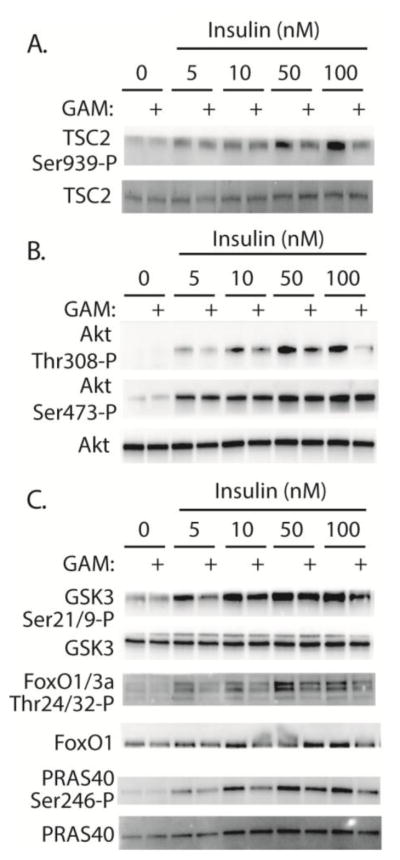
To further investigate the mechanism whereby GAM attenuates insulin action, we also evaluated phosphorylation of TSC2. TSC2 acts in a complex with TSC1 as a GTPase activating protein for Rheb. Direct binding of Rheb-GTP results in activation of mTORC1 (22). Consistent with the effect of GAM on mTORC1, insulin-stimulated phosphorylation of TSC2 on Ser939 was impaired in the presence of GAM (Fig 2A). Since Akt mediates phosphorylation of TSC2 (23), we investigated site-specific phosphorylation of Akt. GAM specifically repressed insulin-induced phosphorylation of Akt on Thr308, but not on Ser473 (Fig 2B). To determine if site-specific dephosphorylation on Thr308 was sufficient to repress Akt activity, we evaluated the phosphorylation of other Akt substrates including GSK3, FoxO, PRAS40. Indeed, insulin-induced phosphorylation of GSK3 on Ser21/9, FoxO1/3a on Thr24/32, and PRAS40 on Ser246 were all attenuated following GAM addition to medium (Fig 2C). Overall these findings demonstrate that insulin-stimulated Akt activity was impaired in TR-MUL cells exposed to GAM.
Figure 2. Glucosamine attenuates insulin-stimulated Akt activity in retinal TR-MUL cells in culture.
A–C, Retinal TR-MUL Müller cells in culture were maintained in DMEM containing 5 mM glucose and supplemented with 10% FBS. Cells were exposed to medium supplemented with 3 mM glucosamine (GAM) for 16 h as indicated. Cells were then deprived of serum for 3 h prior to the addition of insulin as indicated. The phosphorylation of Akt on Thr308 and Ser473, GSK3 on Ser21/9, FoxO1/3a on Thr24/32, PRAS40 on Ser246, TSC2 on Ser939, as well as total Akt, GSK3, FoxO1/3a, PRAS40, and TSC2 was assessed by Western blot analysis. Representative blots from 2 replicated experiments are shown.
3.3 The effect of glucosamine on insulin action is independent of O-GlcNAcylation
One potential mechanism whereby HBP flux represses insulin action is through O-GlcNAcylation of key signaling proteins. To investigate the role of O-GlcNAcylation in impairment of insulin action in TR-MUL cells in culture, we used Thiamet G (TMG) to inhibit the activity of O-GlcNAcase. TMG elevated global levels of protein O-GlcNAc modification, however phosphorylation of p70S6K1 was not altered by TMG treatment in the presence of complete cell culture medium (Fig 3A). To determine if elevated O-GlcNAcylation levels were sufficient to repress insulin action, cells were exposed to TMG and then deprived of serum. Notably, O-GlcNAcylation elevated levels were maintained during serum deprivation (Fig 3B). Nevertheless, insulin-induced phosphorylation of p70S6K1 and 4E-BP1 was not attenuated by TMG (Fig 3C). To determine if O-GlcNAc addition is necessary for the repressive effects of GAM on Akt/mTORC1 activation, cells were treated with the O-GlcNAc transferase inhibitor ST045849. ST045849 was not sufficient to block the repressive effect of GAM on p70S6K1 and 4E-BP1 phosphorylation (Fig 3D). Notably, under the conditions used here, we were unable to detect a GAM-induced elevation in global O-GlcNAcylation levels in TR-MUL cells in culture (Fig 3E). Overall, the findings suggest that GAM acts independent of O-GlcNAcylation to attenuate Akt/mTORC1 signaling under the conditions employed in these experiments.
Figure 3. The effect of GAM on insulin action in retinal TR-MUL cells in culture is independent of changes in global O-GlcNAcylation.
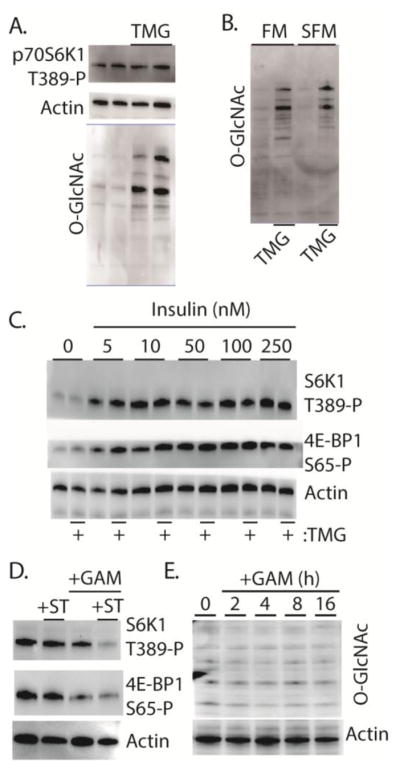
Retinal TR-MUL Müller cells in culture were maintained in DMEM containing 5 mM glucose and supplemented with 10% FBS. Cells were exposed to the O-GlcNAcase inhibitor Thiamet G (TMG) for 16 h as indicated. Cells were maintained in either complete medium (A–B, FM) or deprived of serum for 16 h (B, SFM). C, Cells were deprived of serum for 3 h prior to the addition of insulin as indicated. D, Cells were exposed to medium supplemented with either 10 nM of the O-GlcNAc Transferase inhibitor ST045849 (+ST) and/or 3 mM glucosamine (+GAM) for 16 h. E, Cells were exposed to 3 mM GAM as indicated. O-GlcNAcylation of total cellular proteins was assessed by Western blotting with anti-O-GlcNAc (CTD110.6). The phosphorylation of p70S6K1 on Thr389, 4E-BP1 on Ser-65, as well as expression of actin were also assessed by Western blot analysis. Representative blots from 2 replicated experiments are shown.
3.4 Glucosamine induces REDD1 to attenuate phosphorylation of Akt on Thr308
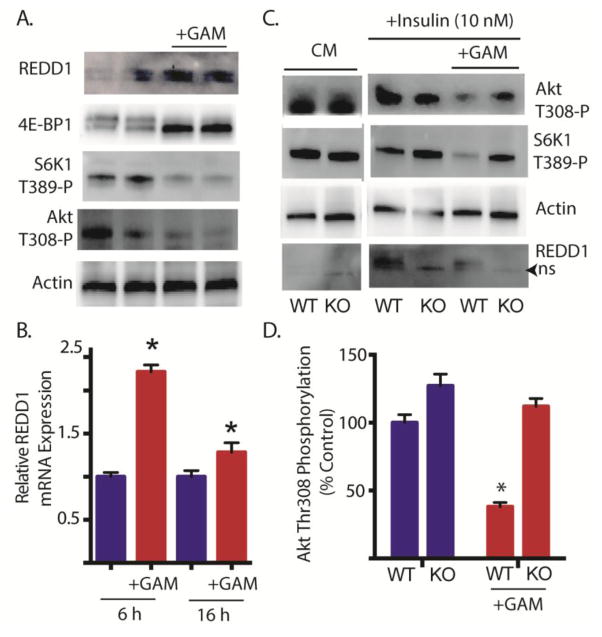
We recently demonstrated that REDD1 acts to repress mTORC1 signaling by promoting the association of protein phosphatase 2A with Akt, leading to the site-specific dephosphorylation of Akt on Thr308 (16). Following exposure to GAM, REDD1 protein (Fig 4A) and mRNA (Fig 4B) expression levels were elevated concomitant with attenuated phosphorylation of 4E-BP1, p70S6K1 on Thr389 and Akt on Thr308 (Fig 4A). To evaluate the role of REDD1 in GAM-induced attenuation of insulin action, REDD1+/+ and REDD1−/− cells were exposed to GAM, followed by serum deprivation and insulin treatment. Whereas GAM attenuated insulin-stimulated phosphorylation of Akt on Thr308 in REDD1+/+ cells, GAM failed to diminish insulin-stimulated phosphorylation of this site in REDD1−/− cells (Fig 4C–D). Moreover, a similar effect was observed with p70S6K1 on Thr389 (Fig 4C). Thus, GAM-induced attenuation of insulin action was absent in cells deficient of REDD1.
Figure 4. Glucosamine induced REDD1 attenuates insulin stimulated phosphorylation of Akt on Thr308.
A, Retinal TR-MUL Müller cells in culture were maintained in DMEM containing 5 mM glucose and supplemented with 10% FBS and exposed to 3 mM glucosamine (+GAM) for 16 h as indicated. B. Cells were treated with GAM as described in A for either 6 or 16 h. REDD1 mRNA was assessed relative to actin by qRT-PCR. C–D, Wild-type REDD1+/+ (WT) or REDD1−/− knockout (KO) mouse embryonic fibroblasts were maintained in complete cell culture medium (CM) containing 5 mM glucose. Cells were exposed to medium containing 3 mM GAM for 16 h, serum deprived for 3 h and stimulated with 10 nM insulin for 30 min as indicated. The phosphorylation of Akt on Thr308, p70S6K1 on Thr389, as well as expression of REDD1 and actin were assessed by Western blot analysis. Representative blots from 2 replicated experiments are shown. ns, non-specific. D, Quantification of insulin stimulated phosphorylation of Akt on Thr308 from C. Values are means + S.E. (n = 10 in B and 4 in D). Statistical significance is denoted *, p < 0.05 versus the absence of GAM.
3.5 Glucosamine induces ER stress in retinal TR-MUL cells in culture
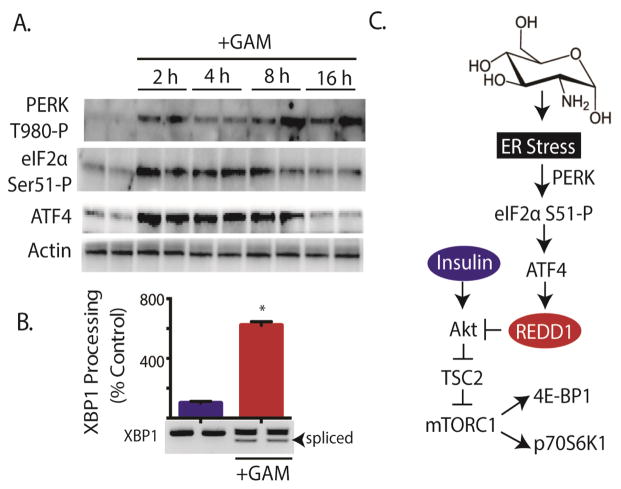
Our laboratory previously reported that REDD1 mRNA expression is enhanced in response to ER stress (20). Moreover, others have previously reported the induction of ER stress in response to GAM (24,25). Therefore, biomarkers of ER-stress were examined to assess whether or not GAM-induced ER stress might be involved in the induction of REDD1 expression in TR-MUL cells. Autophosphorylation of the cytoplasmic kinase domain of the eIF2α kinase PERK on Thr980 (Fig 5A) and XBP1 processing to remove a 26-base intron (Fig 5B) were both enhanced following exposure to GAM. Moreover, phosphorylation of eIF2α on Ser51 was also transiently enhanced in response to GAM (Fig 5A). Under conditions that promote phosphorylation of eIF2α, expression of activating transcription factor 4 (ATF4) is enhanced (26). Enhanced expression of ATF4 is necessary for elevated REDD1 mRNA expression in response to ER stress (20). As expected, ATF4 expression was elevated in TR-MUL cells in response to GAM addition (Fig 5A). Overall, these findings support a model wherein GAM promotes ER stress in TR-MUL cells resulting in elevated REDD1 expression and thus attenuation of insulin action (Fig 5C).
Figure 5. Glucosamine induces ER stress in retinal TR-MUL cells in culture.
A, Retinal TR-MUL Müller cell cultures were maintained in DMEM containing 5 mM glucose supplemented with 10% FBS and exposed to 3 mM glucosamine (+GAM) as indicated. The phosphorylation of PERK on Thr980, and eIF2α on Ser51, as well as expression of ATF4 and actin were assessed by Western blot analysis. Representative blots from 2 replicated experiments are shown. B. PCR analysis of XBP1 splicing was performed on TR-MUL cells 6 h after GAM addition. Values are means + S.E. (n = 6). Statistical significance is denoted *, p < 0.05 versus the absence of GAM. C. Working model for the mechanism whereby GAM attenuates insulin action in retinal TR-MUL cells.
4 Discussion
The findings of the present study demonstrate that exogenous GAM repressed insulin action in retinal Müller cells in culture through the induction of REDD1. This finding supports the conclusion that GAM exacerbates the metabolic dysfunction associated with diabetes. The pathogenesis of diabetic retinopathy is caused by a combination of hyperglycemia and reduced insulin-mediated signaling, which results in neurovascular complications in the retina. Müller cell dysfunction was initially suggested by b-wave electroretinogram abnormalities in diabetic patients with little to no vascular lesions (27). Since that time, diabetes-induced activation of Müller cells has been demonstrated in both rodent (28) and human retinas (29). Retinal Müller cell derived growth factors, including VEGF, play an essential and causative role in the development of diabetic complications. Thus, GAM-induced attenuation of the signaling pathway through which insulin regulates Müller cell gene expression is of particular interest with regards to the development of complications associated with diabetic retinopathy.
A previous study concluded that GAM inhibited proliferation in cancer cells via mTOR independent dephosphorylation of p70S6K1 (30). However, in that study (30), site-specific phosphorylation of 4E-BP1 on Thr37/Ser46 was elevated in isoforms with greater electrophoretic mobility (i.e. less globally phosphorylated). Phosphorylation of 4E-BP1 on Thr37/46 serves as a priming event for subsequent mTORC1-dependent phosphorylation on Ser65 and Thr70, and Thr37/46 phosphorylation alone is not sufficient for release of eIF4E (31,32). Thus, GAM-induced eIF4E sequestration by 4E-BP1 is likely independent of Thr37/46 phosphorylation. The results presented herein demonstrate that the inhibitory effect of GAM on insulin action in Müller cells manifest upstream of mTORC1 in a manner that leads to attenuated phosphorylation of both Akt and mTORC1 substrates. Nevertheless, the effects of GAM potentially manifest differently in various cell types based on the presence of certain isoforms of glucose transporters and glycolytic enzymes.
Glucosamine is transported into cells by facilitated glucose transporters, and notably GLUT2 is a high affinity transporter (10) that in the retina is found exclusively in Müller cells (11). Another important consideration with regards to the impact of GAM on the retina is that retinal tissue homogenates exhibit glucokinase activity (33). Unlike hexokinase, glucokinase is not negatively regulated by the production of G6P. Moreover, glucokinase has Km for GAM of ~8 mM, whereas that of hexokinase is an order of magnitude lower (34). Since plasma GAM concentrations in individuals supplementing with GAM are in the low mM range, hexokinase is likely to be saturated, whereas glucokinase is not. Thus, the presence of glucokinase and GLUT2 transporters likely heighten the susceptibility of Müller cells in the retina to the negative effects of GAM, particularly as compared to most other tissues (e.g., muscle).
Excess hexosamine biosynthesis plays a role in the potentiation of insulin resistance [4]. One mechanism for this effect is elevated protein O-GlcNAcylation, which reduced insulin-induced phosphorylation on Thr308 of Akt (3), however a similar deficit was not observed on Ser473 of Akt in response to IGF-1 (35). While we have not exclusively ruled out a role for the site-specific O-GlcNAcylation of Akt or another insulin responsive protein following GAM treatment, the findings do not support such a mechanism of regulation; as the effect of GAM could not be recapitulated with chemical inhibition to promote protein O-GlcNAcylation, nor was OGT inhibition to block O-GlcNAcylation sufficient to prevent the effects of GAM. Unlike a previous report where we observed a GAM-induced elevation in global O-GlcNAcylation in hepatocytes (19), here we were unable to recapitulate the effect in retinal Müller cells in culture. Instead, the findings reported herein support previous reports linking GAM to the induction of ER stress (24,25). In addition to its role as a substrate for O-linked glycation, UDP-GlcNAc also serves as a substrate for post-translational N-linked glycation, and thus facilitates proper folding of nascent proteins in the ER. Moreover, GAM has also been found to promote expression of ATF4 (36). ATF4 is a master regulatory factor that promotes transcription of a number of genes that facilitate adaptation to ER stress, including REDD1 (20). The findings reported herein also extend the previous report that GAM negatively regulates Akt phosphorylation through the induction of endoplasmic reticulum (ER) stress (36).
In the present study we observed elevated REDD1 expression in retinal Müller cells following exposure to GAM, and demonstrated site-specific attenuation of Akt on Thr308 that was REDD1 dependent. Whereas some reports demonstrate the effects of GAM upstream of Akt activation (36), others support deficiencies in Akt activity as the target of inhibitory action. In 3T3-L1 adipocytes, GAM impairs insulin-stimulated GLUT4 translocation and glucose uptake by repressing Akt and p70S6K activity in the absence of altered IR, IRS-1/2, or PI3K activity (37). Notably, GAM-induced attenuation of Akt phosphorylation in the present study was specific to Thr308, rather than Ser473. Previous reports also support limited (38) or no effect (39) of GAM on phosphorylation of Akt on Ser473. However, it is important to note that the mechanism of GAM action is potentially different in various cell lines.
5 Conclusions
Overall, the findings support a model wherein GAM acts to attenuate insulin action by REDD1-mediated repression of Akt activity (Fig 5C). Since retinal Müller cells express both glucokinase and GLUT2 transporters they are likely to have heightened susceptibility to the elevated plasma GAM levels that are associated with dietary supplementation. Müller cells are responsible for the synthesis and secretion of a number of hormones, such as VEGF, that are essential and causative role in retinal vascular complications (12). Moreover, REDD1 is a key regulator of diabetes-induced VEGF expression in the retina (13). Thus, the results reported herein support a role for REDD1 in GAM-induced attenuation of insulin signaling and suggest that further studies are warranted to determine if dietary supplementation with GAM is sufficient to alter gene expression patterns of Müller cells in a manner that contributes to visual dysfunction.
Highlights.
Glucosamine addition to Müller cells in culture repressed insulin action.
Glucosamine attenuated insulin-stimulated Akt phosphorylation on T308 but not S473.
Expression of the Akt/mTORC1 repressor REDD1 was elevated by glucosamine.
Glucosamine failed to attenuate Akt phosphorylation in REDD1 deficient cells.
Glucosamine addition to Müller cells in culture promoted ER stress.
Acknowledgments
This research was supported by The American Diabetes Association Pathway to Stop Diabetes Grant 1-14-INI-04 and NIH grant EY023612 (to MDD). The authors gratefully acknowledge Drs. Leonard Jefferson, Scot Kimball and Alistair Barber for critically evaluating this manuscript. The authors thank Dr. Gerald Hart and the NHLBI P01HL107153 Core C4 of Johns Hopkins University for providing Thiamet G. The authors also thank Dr. K. Hosoya for kindly providing TR-MUL cells and Dr. Leif Ellisen for providing REDD1+/+and REDD1−/− MEF. Finally, the authors thank Chen Yang and Gina Deiter for technical assistance in performance of the studies described herein.
Abbreviations
- F6P
fructose 6-phosphate
- HBP
Hexosamine Biosynthetic Pathway
- GlcN6P
glucosamine-6-phosphate
- GFAT
glutamine-fructose-6-phosphate amidotransferase
- UDP-GlcNAc
UDP-N-acetylglucosamine
- O-GlcNAc
O-GlcNAcylation
- GAM
Glucosamine
- VEGF
vascular endothelial growth factor
- eIF
eukaryotic initiation factor
- 4E-BP1
eIF4E Binding Protein 1
- REDD1
Regulated in DNA Damage and Development 1
- PP2A
protein phosphatase 2A
- p70S6K1
p70 ribosomal protein kinase 1
- mTORC1
mammalian target of rapamycin in complex 1
- HG
High Glucose
- LG
Low Glucose
- TMG
Thiamet G
- ATF4
Activating Transcription Factor 4
Footnotes
Author Contributions
JAM, WPM, and MDD all materially participated in the research and article preparation.
Disclosure
The authors of the paper have nothing to disclose. All authors have approved the final article.
Publisher's Disclaimer: This is a PDF file of an unedited manuscript that has been accepted for publication. As a service to our customers we are providing this early version of the manuscript. The manuscript will undergo copyediting, typesetting, and review of the resulting proof before it is published in its final citable form. Please note that during the production process errors may be discovered which could affect the content, and all legal disclaimers that apply to the journal pertain.
References
- 1.Heath H, Kang SS, Philippou D. Glucose, glucose-6-phosphate, lactate and pyruvate content of the retina, blood and liver of streptozotocin-diabetic rats fed sucrose- or starch-rich diets. Diabetologia. 1975;11:57–62. doi: 10.1007/BF00422819. [DOI] [PubMed] [Google Scholar]
- 2.Ball LE, Berkaw MN, Buse MG. Identification of the major site of O-linked beta-N-acetylglucosamine modification in the C terminus of insulin receptor substrate-1. Mol Cell Proteomics. 2006;5:313–323. doi: 10.1074/mcp.M500314-MCP200. [DOI] [PMC free article] [PubMed] [Google Scholar]
- 3.Vosseller K, Wells L, Lane MD, Hart GW. Elevated nucleocytoplasmic glycosylation by O-GlcNAc results in insulin resistance associated with defects in Akt activation in 3T3-L1 adipocytes. Proc Natl Acad Sci U S A. 2002;99:5313–5318. doi: 10.1073/pnas.072072399. [DOI] [PMC free article] [PubMed] [Google Scholar]
- 4.Barnes PM, Bloom B, Nahin RL. Complementary and alternative medicine use among adults and children: United States, 2007. National health statistics reports. 2008:1–23. [PubMed] [Google Scholar]
- 5.Berenbaum F. Diabetes-induced osteoarthritis: from a new paradigm to a new phenotype. Annals of the rheumatic diseases. 2011;70:1354–1356. doi: 10.1136/ard.2010.146399. [DOI] [PubMed] [Google Scholar]
- 6.Monauni T, Zenti MG, Cretti A, Daniels MC, Targher G, Caruso B, Caputo M, McClain D, Del Prato S, Giaccari A, Muggeo M, Bonora E, Bonadonna RC. Effects of glucosamine infusion on insulin secretion and insulin action in humans. Diabetes. 2000;49:926–935. doi: 10.2337/diabetes.49.6.926. [DOI] [PubMed] [Google Scholar]
- 7.Pouwels MJ, Jacobs JR, Span PN, Lutterman JA, Smits P, Tack CJ. Short-term glucosamine infusion does not affect insulin sensitivity in humans. J Clin Endocrinol Metab. 2001;86:2099–2103. doi: 10.1210/jcem.86.5.7470. [DOI] [PubMed] [Google Scholar]
- 8.Tannis AJ, Barban J, Conquer JA. Effect of glucosamine supplementation on fasting and non-fasting plasma glucose and serum insulin concentrations in healthy individuals. Osteoarthritis and cartilage / OARS, Osteoarthritis Research Society. 2004;12:506–511. doi: 10.1016/j.joca.2004.03.001. [DOI] [PubMed] [Google Scholar]
- 9.Pham T, Cornea A, Blick KE, Jenkins A, Scofield RH. Oral glucosamine in doses used to treat osteoarthritis worsens insulin resistance. The American journal of the medical sciences. 2007;333:333–339. doi: 10.1097/MAJ.0b013e318065bdbe. [DOI] [PubMed] [Google Scholar]
- 10.Uldry M, Ibberson M, Hosokawa M, Thorens B. GLUT2 is a high affinity glucosamine transporter. FEBS Lett. 2002;524:199–203. doi: 10.1016/s0014-5793(02)03058-2. [DOI] [PubMed] [Google Scholar]
- 11.Watanabe T, Mio Y, Hoshino FB, Nagamatsu S, Hirosawa K, Nakahara K. GLUT2 expression in the rat retina: localization at the apical ends of Muller cells. Brain Res. 1994;655:128–134. doi: 10.1016/0006-8993(94)91606-3. [DOI] [PubMed] [Google Scholar]
- 12.Wang J, Xu X, Elliott MH, Zhu M, Le YZ. Muller cell-derived VEGF is essential for diabetes-induced retinal inflammation and vascular leakage. Diabetes. 2010;59:2297–2305. doi: 10.2337/db09-1420. [DOI] [PMC free article] [PubMed] [Google Scholar]
- 13.Dennis MD, Kimball SR, Fort PE, Jefferson LS. Regulated in Development and DNA Damage 1 Is Necessary for Hyperglycemia-induced Vascular Endothelial Growth Factor Expression in the Retina of Diabetic Rodents. J Biol Chem. 2015;290:3865–3874. doi: 10.1074/jbc.M114.623058. [DOI] [PMC free article] [PubMed] [Google Scholar]
- 14.Gingras AC, Kennedy SG, O’Leary MA, Sonenberg N, Hay N. 4E-BP1, a repressor of mRNA translation, is phosphorylated and inactivated by the Akt(PKB) signaling pathway. Genes Dev. 1998;12:502–513. doi: 10.1101/gad.12.4.502. [DOI] [PMC free article] [PubMed] [Google Scholar]
- 15.Schrufer TL, Antonetti DA, Sonenberg N, Kimball SR, Gardner TW, Jefferson LS. Ablation of 4E-BP1/2 prevents hyperglycemia-mediated induction of VEGF expression in the rodent retina and in Muller cells in culture. Diabetes. 2010;59:2107–2116. doi: 10.2337/db10-0148. [DOI] [PMC free article] [PubMed] [Google Scholar]
- 16.Dennis MD, Coleman CS, Berg A, Jefferson LS, Kimball SR. REDD1 enhances protein phosphatase 2A-mediated dephosphorylation of Akt to repress mTORC1 signaling. Sci Signal. 2014;7:ra68. doi: 10.1126/scisignal.2005103. [DOI] [PMC free article] [PubMed] [Google Scholar]
- 17.Kimball SR, Horetsky RL, Jefferson LS. Implication of eIF2B rather than eIF4E in the regulation of global protein synthesis by amino acids in L6 myoblasts. J Biol Chem. 1998;273:30945–30953. doi: 10.1074/jbc.273.47.30945. [DOI] [PubMed] [Google Scholar]
- 18.Kimball SR, Jurasinski CV, Lawrence JC, Jr, Jefferson LS. Insulin stimulates protein synthesis in skeletal muscle by enhancing the association of eIF-4E and eIF-4G. Am J Physiol. 1997;272:C754–759. doi: 10.1152/ajpcell.1997.272.2.C754. [DOI] [PubMed] [Google Scholar]
- 19.Dennis MD, Shenberger JS, Stanley BA, Kimball SR, Jefferson LS. Hyperglycemia Mediates a Shift From Cap-Dependent to Cap-Independent Translation Via a 4E-BP1-Dependent Mechanism. Diabetes. 2013;62:2204–2214. doi: 10.2337/db12-1453. [DOI] [PMC free article] [PubMed] [Google Scholar]
- 20.Whitney ML, Jefferson LS, Kimball SR. ATF4 is necessary and sufficient for ER stress-induced upregulation of REDD1 expression. Biochem Biophys Res Commun. 2009;379:451–455. doi: 10.1016/j.bbrc.2008.12.079. [DOI] [PMC free article] [PubMed] [Google Scholar]
- 21.Iwakoshi NN, Lee AH, Vallabhajosyula P, Otipoby KL, Rajewsky K, Glimcher LH. Plasma cell differentiation and the unfolded protein response intersect at the transcription factor XBP-1. Nat Immunol. 2003;4:321–329. doi: 10.1038/ni907. [DOI] [PubMed] [Google Scholar]
- 22.Long X, Lin Y, Ortiz-Vega S, Yonezawa K, Avruch J. Rheb binds and regulates the mTOR kinase. Curr Biol. 2005;15:702–713. doi: 10.1016/j.cub.2005.02.053. [DOI] [PubMed] [Google Scholar]
- 23.Manning BD, Tee AR, Logsdon MN, Blenis J, Cantley LC. Identification of the tuberous sclerosis complex-2 tumor suppressor gene product tuberin as a target of the phosphoinositide 3-kinase/akt pathway. Mol Cell. 2002;10:151–162. doi: 10.1016/s1097-2765(02)00568-3. [DOI] [PubMed] [Google Scholar]
- 24.Werstuck GH, Khan MI, Femia G, Kim AJ, Tedesco V, Trigatti B, Shi Y. Glucosamine-induced endoplasmic reticulum dysfunction is associated with accelerated atherosclerosis in a hyperglycemic mouse model. Diabetes. 2006;55:93–101. [PubMed] [Google Scholar]
- 25.Qiu W, Su Q, Rutledge AC, Zhang J, Adeli K. Glucosamine-induced endoplasmic reticulum stress attenuates apolipoprotein B100 synthesis via PERK signaling. Journal of lipid research. 2009;50:1814–1823. doi: 10.1194/jlr.M800343-JLR200. [DOI] [PMC free article] [PubMed] [Google Scholar]
- 26.Dey S, Baird TD, Zhou D, Palam LR, Spandau DF, Wek RC. Both transcriptional regulation and translational control of ATF4 are central to the integrated stress response. J Biol Chem. 2010;285:33165–33174. doi: 10.1074/jbc.M110.167213. [DOI] [PMC free article] [PubMed] [Google Scholar]
- 27.Di Leo MA, Caputo S, Falsini B, Porciatti V, Greco AV, Ghirlanda G. Presence and further development of retinal dysfunction after 3-year follow up in IDDM patients without angiographically documented vasculopathy. Diabetologia. 1994;37:911–916. doi: 10.1007/BF00400947. [DOI] [PubMed] [Google Scholar]
- 28.Barber AJ, Antonetti DA, Gardner TW. Altered expression of retinal occludin and glial fibrillary acidic protein in experimental diabetes. The Penn State Retina Research Group. Invest Ophthalmol Vis Sci. 2000;41:3561–3568. [PubMed] [Google Scholar]
- 29.Mizutani M, Gerhardinger C, Lorenzi M. Muller cell changes in human diabetic retinopathy. Diabetes. 1998;47:445–449. doi: 10.2337/diabetes.47.3.445. [DOI] [PubMed] [Google Scholar]
- 30.Oh HJ, Lee JS, Song DK, Shin DH, Jang BC, Suh SI, Park JW, Suh MH, Baek WK. D-glucosamine inhibits proliferation of human cancer cells through inhibition of p70S6K. Biochem Biophys Res Commun. 2007;360:840–845. doi: 10.1016/j.bbrc.2007.06.137. [DOI] [PubMed] [Google Scholar]
- 31.Fadden P, Haystead TA, Lawrence JC., Jr Identification of phosphorylation sites in the translational regulator, PHAS-I, that are controlled by insulin and rapamycin in rat adipocytes. J Biol Chem. 1997;272:10240–10247. doi: 10.1074/jbc.272.15.10240. [DOI] [PubMed] [Google Scholar]
- 32.Gingras AC, Gygi SP, Raught B, Polakiewicz RD, Abraham RT, Hoekstra MF, Aebersold R, Sonenberg N. Regulation of 4E-BP1 phosphorylation: a novel two-step mechanism. Genes Dev. 1999;13:1422–1437. doi: 10.1101/gad.13.11.1422. [DOI] [PMC free article] [PubMed] [Google Scholar]
- 33.Iannello S, Campione R, Volpicelli G, Belfiore F. Rabbit lens and retina phosphorylate glucose through a glucokinase-like enzyme: study in normal and spontaneously hyperglycemic animals. Journal of diabetes and its complications. 1996;10:68–77. doi: 10.1016/1056-8727(94)00080-8. [DOI] [PubMed] [Google Scholar]
- 34.Oguchi M, Miyatake Y, Ayabe J, Akamatsu N. Phosphorylation of D-glucosamine by rat liver glucokinase. Journal of biochemistry. 1975;77:1117–1121. doi: 10.1093/oxfordjournals.jbchem.a130812. [DOI] [PubMed] [Google Scholar]
- 35.Gandy JC, Rountree AE, Bijur GN. Akt1 is dynamically modified with O-GlcNAc following treatments with PUGNAc and insulin-like growth factor-1. FEBS Lett. 2006;580:3051–3058. doi: 10.1016/j.febslet.2006.04.051. [DOI] [PMC free article] [PubMed] [Google Scholar]
- 36.Song KH, Kang JH, Woo JK, Nam JS, Min HY, Lee HY, Kim SY, Oh SH. The novel IGF-IR/Akt-dependent anticancer activities of glucosamine. BMC cancer. 2014;14:31. doi: 10.1186/1471-2407-14-31. [DOI] [PMC free article] [PubMed] [Google Scholar]
- 37.Heart E, Choi WS, Sung CK. Glucosamine-induced insulin resistance in 3T3-L1 adipocytes. Am J Physiol Endocrinol Metab. 2000;278:E103–112. doi: 10.1152/ajpendo.2000.278.1.E103. [DOI] [PubMed] [Google Scholar]
- 38.Nakamura M, Barber AJ, Antonetti DA, LaNoue KF, Robinson KA, Buse MG, Gardner TW. Excessive hexosamines block the neuroprotective effect of insulin and induce apoptosis in retinal neurons. J Biol Chem. 2001;276:43748–43755. doi: 10.1074/jbc.M108594200. [DOI] [PubMed] [Google Scholar]
- 39.Nelson BA, Robinson KA, Buse MG. Defective Akt activation is associated with glucose- but not glucosamine-induced insulin resistance. Am J Physiol Endocrinol Metab. 2002;282:E497–506. doi: 10.1152/ajpendo.00438.2001. [DOI] [PubMed] [Google Scholar]


