

Abstract
Objectives
Few studies have examined the joint impact of neighborhood disadvantage and low social cohesion on health. Moreover, no study has considered the joint impact of these factors on a cumulative disease risk profile among a large sample of African American adults. Using data from the Jackson Heart Study, we examined the extent to which social cohesion modifies the relationship between neighborhood disadvantage and cumulative biological risk (CBR)—a measure of accumulated risk across multiple physiological systems.
Methods
Our analysis included 4,408 African American women and men ages 21–85 residing in the Jackson, MS Metropolitan Area. We measured neighborhood disadvantage using a composite score of socioeconomic indicators from the 2000 US Census and social cohesion was assessed using a 5-item validated scale. Standardized z-scores of biomarkers representing cardiovascular, metabolic, inflammatory, and neuroendocrine systems were combined to create a CBR score. We used two-level linear regression models with random intercepts adjusting for socio-demographic and behavioral covariates in the analysis. A three-way interaction term was included to examine whether the relationship between neighborhood disadvantage and CBR differed by levels of social cohesion and gender.
Results
The interaction between neighborhood disadvantage, social cohesion and gender was statistically significant (p=0.05) such that the association between living in a disadvantaged neighborhood and CBR was strongest for men living in neighborhoods with low levels of social cohesion (B=0.63, SE: 0.32). In gender-specific models, we found a statistically significant interaction between neighborhood disadvantage and social cohesion for men (p=0.05) but not for women (p=0.50).
Conclusion
Neighborhoods characterized by high levels of economic disadvantage and low levels of social cohesion contribute to higher cumulative risk of disease among African American men. This suggests that they may face a unique set of challenges that put them at greater risk in these settings.
Keywords: United States, Neighborhoods, African Americans, Cumulative Biological Risk, Health Inequities
INTRODUCTION
A considerable amount of empirical research has linked the economic and social conditions of neighborhoods to adverse health outcomes (Chichlowska et al., 2008; Diez-Roux, Kiefe, et al., 2001; Johns et al., 2012; Kawachi & Berkman, 2003; Kim, 2008; Kim, Diez Roux, Kiefe, Kawachi, & Liu, 2010; Leal & Chaix, 2011; O’Campo et al., 2008; Pickett & Pearl, 2001; Roberts, 1997; Ross & Mirowsky, 2001). Neighborhoods characterized by high rates of poverty and unemployment coupled with high levels of social disorganization represent some of the worst residential environments and have been found to be particularly detrimental to health. Individuals residing in these areas, who are overwhelmingly poor and African American, are what William Julius Wilson (1987) refers to as the truly disadvantaged because they are faced with a milieu of economic and social problems that taken together can influence a number risk factors for disease and result in an accumulation of risk across multiple physiological systems.
A complex set of social processes operate within the context of disadvantaged neighborhoods to influence disease risk. Of these processes, social cohesion has gained considerable attention within the public health literature (Baum, Ziersch, Zhang, & Osborne, 2009; de Vries, van Dillen, Groenewegen, & Spreeuwenberg, 2013; Fone et al., 2007; Fone et al., 2014; Johns et al., 2012; Kim et al., 2010; Mair et al., 2009). Formulated by Sampson, Raudenbush, and Earls (1997), social cohesion represents one dimension of the concept “collective efficacy” which is defined as the “linkages of mutual trust” (i.e. social cohesion) and the “shared willingness to intervene for the common good” (i.e. informal social control) (Sampson & Raudenbush, 1999). Within disadvantaged neighborhood settings, these “linkages” are often compromised and lead to a number of neighborhood conditions that are detrimental to health and well-being. For example, coupled with informal social control, social cohesion has been found to influence rates of crime and violence within disadvantaged neighborhoods such that lower levels of social cohesion and informal social control are associated with higher rates of crime and violence (Sampson et al., 1997). Combined with the effects of poor socioeconomic conditions, these have the potential to induce stress (Ross & Mirowsky, 2001), elevate blood pressure (Mujahid et al., 2008), promote unhealthy coping behaviors such as smoking and high alcohol use (Kuipers, van Poppel, van den Brink, Wingen, & Kunst, 2012; Slopen et al., 2012), and may create environments that are unsafe for engaging in healthy behaviors such as physical activity (Cleland et al., 2010). Ultimately, this may lead to dysregulation across multiple physiological systems resulting in higher levels of cumulative biological risk. In contrast, high levels of social cohesion may be leveraged within the context of poor neighborhoods to advocate for resources that are conducive to health thereby mitigating some of the harmful effects of these settings (Altschuler, Somkin, & Adler, 2004; Swaroop & Morenoff, 2006).
It is plausible that the joint impact of neighborhood disadvantage and low levels of social cohesion is particularly detrimental to health. This may be especially true for African Americans in the United States who have historically been impacted by the confluence of economic and racial residential segregation which has resulted in their disproportionate exposure to these deleterious neighborhood environments (Massey, 2001; Massey & Denton, 1993). Additionally, these settings may represent a kind of “double jeopardy” for African American men who often face a unique set of challenges such as limited employment opportunities and exposure to a number of psychosocial stressors, including discrimination, making them particularly vulnerable to these toxic neighborhood settings. Though plausible, neighborhood socioeconomic conditions and social cohesion are often examined independently with little attention devoted to their joint impact. Additionally, of the studies that have examined their joint impact on health outcomes (Fone et al., 2007; Fone et al., 2014; Kim et al., 2010) no studies, that we are aware, have done so among a large sample of African Americans in relation to a profile of cumulative disease risk.
To address these gaps, we used data from the Jackson Heart Study (JHS) — the largest community-based epidemiologic study of African American adults in the United States— to examine the extent to which social cohesion modified the relationship between neighborhood disadvantage and CBR. This present study builds upon our previously published work that found an independent association between neighborhood disadvantage and CBR in this population (Barber, Hickson, Kawachi, Subramanian, & Earls, 2015). We hypothesized that the impact of living in a disadvantaged neighborhood would be strongest for individuals living in neighborhoods with low levels of social cohesion compared to individuals living in neighborhoods with high levels of social cohesion. Furthermore, based on prior findings (Kim et al., 2010), we also hypothesized that the stronger association between neighborhood disadvantage and CBR would be most salient for men.
METHODS
Study Area
The JHS is based in Jackson, Mississippi, a mid-sized metropolitan area located in the southeastern United States. In 2000 when the study began, the population of the city and surrounding areas was just under 500,000 making it the largest metropolitan area in the state of Mississippi. The median household income for the Jackson Metropolitan Area was $39,425 and the household poverty rate was 17.6%, comparable to the rest of the state but well above the 11.3% for the rest of the country (U.S. Census Bureau, 2001). Moreover, like many southern cities, a relatively large portion of the population was African American (45.5%) (U.S. Census Bureau, 2012).
Study Population
The sample for this analysis was drawn from the first wave (September 2000–March 2004) of the JHS. The study population included adults aged 21–85 from three counties in the Jackson Metropolitan Area—Hinds, Madison, and Rankin— and was obtained using four sampling strategies: a random sample of adults drawn from a commercially available list of households with adults aged 35–84 (17%); volunteers aged 35–84 recruited through participant referral or outreach activities (30%); participants in the Jackson field center of the Atherosclerosis Risk in Communities (ARIC) study (31%); and relatives of JHS participants, ≥ 21 years of age comprising the JHS Family Sub-Study (22%). A total baseline sample of 5,301 participants (men, n=1,906; women, n=3,395) were recruited into the JHS and 98.8% (n=5,236) were retrospectively geocoded to 102 census tracts (Robinson et al., 2010). Hickson et al. (2011) conducted a spatial Bayesian analysis of the JHS which showed that at the census tract level, the sample was representative of the underlying African American population living within the Jackson Metropolitan Area with two exceptions: the distribution of JHS women was more representative than JHS men, and participants residing in mixed and predominantly African American census tracts were more representative than those residing in predominantly white census tracts.
Data collection for the first wave of the study involved a home interview and an on-site clinical examination. Extensive clinical, demographic, social, cultural, and behavioral information was obtained including extensive data on a number of biomarkers representing several physiological systems. A full description of data collection methods has been provided elsewhere (Carpenter et al., 2004; T. J. Payne et al., 2005; Taylor et al., 2005). All JHS participants provided informed consent and research procedures were approved by the institutional review boards of Jackson State University, Tougaloo College, and the University of Mississippi Medical Center.
Analytic Sample
The analytic sample for this study initially included all geocoded participants in the baseline sample residing in neighborhoods with data on social cohesion (n=5,227). We excluded participants with missing data on one or more of the biomarkers included in the assessment of CBR (n=644) and behavioral covariates (n=175). In order to retain sample size and statistical power, we did not exclude individuals missing data on family income level and educational attainment (n=663), but instead included an indicator variable denoting missing information on these variables. The resulting analytic sample was comprised of 4,408 participants residing in 100 census tracts.
Measurement
Neighborhood Variables
Neighborhood Disadvantage
Development of the neighborhood disadvantage score has been described in detail elsewhere (Barber et al., 2015). Briefly, census tracts served as proxies for neighborhoods (Krieger, 2006) and exploratory factor analysis was used to develop a composite score of neighborhood disadvantage using indicators from the 2000 US Census. These included: % of households below poverty, % of households receiving public assistance, % of unemployed adults, % of adults with less than a HS education, % of households with >1 person per room (crowding), % of vacant housing units, % of female-headed households, and % of households with no vehicle. We created the final neighborhood disadvantage score by summing the z-scores (mean=0, SD=1) for each indicator (Cronbach’s alpha=0.93) with higher scores denoting higher neighborhood disadvantage (range: −10.3 to 20; median: −2.3). The score was then dichotomized at the median value such that neighborhoods with scores above the median were classified as the “most disadvantaged” (mean score= 5.8; range: −2.2 to 20.2) and neighborhoods with scores at or below the median were classified as the “least disadvantaged” (mean score= −5.7; range: −10.3 to −2.4). These two categories demonstrated excellent convergent validity with neighborhood characteristics that have been found to be associated with poor neighborhood socioeconomic conditions (Barber et al., 2015).
Social Cohesion
Social cohesion was assessed during a follow-up phone interview approximately three years after the baseline examination using the following five items from the validated social cohesion scale developed by Sampson et al. (1997): (1) This is a close-knit neighborhood; (2) People around here are willing to help their neighbors; (3) People in this neighborhood generally don’t get along (reverse-coded); (4) People in this neighborhood can be trusted; (5) People in this neighborhood don’t share the same values (reverse-coded). Response options were on a 4-point Likert scale ranging from ‘strongly agree’ (4) to ‘strongly disagree’ (1).
Consistent with prior work (Mujahid et al., 2008), we used three-level hierarchical models to derive empirical Bayes estimates of social cohesion for each census tract of residence at baseline by pooling responses of all respondents within a tract. This approach creates a more valid and reliable measure of the construct of interest by aggregating information from multiple informants and by borrowing information across tracts to improve estimates for tracts with few observations. The neighborhood social cohesion scores in this study ranged from 2.7 to 3.2, had satisfactory reliability (0.72) and had an intra-class correlation of 0.09.
For use in this analysis, we categorized social cohesion as high (0) vs. low (1) by dichotomizing the score at the median. To determine whether or not these categories represented meaningful levels of social cohesion (i.e. differentiated neighborhoods with high and low social cohesion), we conducted a t-test that compared the mean perceived safety scores for the two categories of social cohesion. This was based on prior research linking lower neighborhood social cohesion and informal social control to higher rates of neighborhood crime and violence (Sampson et al., 1997). As expected, neighborhoods with low social cohesion had lower levels of perceived safety (p<0.0001).
Outcome Variable
Cumulative Biological Risk
Cumulative biological risk is a comprehensive measure of risk across multiple physiological systems (Crimmins & Seeman, 2004) that has been linked to a number of health outcomes including incident cardiovascular disease, physical functioning and cognitive decline (Juster, McEwen, & Lupien, 2010; Seeman, McEwen, Rowe, & Singer, 2001). We used eight biomarkers representing four physiological systems to measure CBR at baseline: metabolic– glycosylated hemoglobin A1c (%), fasting total cholesterol-HDL cholesterol ratio, waist circumference (cm); cardiovascular– systolic blood pressure (mmHg), diastolic blood pressure (mmHg), resting heart rate (beats per 30 seconds); neuroendocrine– serum cortisol (μg/mL); and inflammatory– high sensitivity c-reactive protein (mg/dL). Inclusion of biomarkers for our study was based on availability within the JHS dataset as well as use in similar studies (King, Morenoff, & House, 2011; Merkin et al., 2009). Though the exact combination of biomarkers we included varies slightly from other studies, the biomarkers and physiological systems captured in our measure of CBR overlap considerably with previously validated measures that have been linked to subsequent disease onset (Juster et al., 2010; McEwen & Gianaros, 2010; Seeman et al., 2001). All biomarkers utilized in the score were assessed using standard laboratory and clinical procedures (Carpenter et al., 2004).
Consistent with prior work in the JHS (Barber et al., 2015), we used a standardized z-score approach to develop an overall CBR score (Juster et al., 2010). Though count-based approaches exist which assign individuals a point for each biomarker that exceeds a clinically relevant cut-off, we chose to use the z-score approach to retain information on the full range of values for each biomarker and in recognition that even when clinically relevant cut-offs are not reached, moderate elevations in risk factors across multiple systems can result in increased risk of disease (Crimmins & Seeman, 2004). Standardized z-scores for each biomarker (mean=0, SD=1) were averaged within each system to create sub-index scores; these scores were then summed to create the final CBR score (range: −5.6 to 20.8).
Covariates
We controlled for a number of individual socio-demographic characteristics that may confound the relationship between neighborhood disadvantage and CBR. These included age (in years), gender (male-1; female-0), family income, and educational attainment. Self-reported validated questionnaires (T. J. Payne et al., 2005) administered by trained African American interviewers during the home induction interview were used to obtain data on these variables. Response options for family income included 11 categories ranging from <5,000 to >100,000 that were collapsed into four categories that accounted for family size and the federally-defined poverty level: low, lower-middle, upper-middle, and high. Educational attainment responses were classified into three categories: less than or equal to high school, some college, and college or more.
We also included health behaviors in the analysis, as they may confound or partially mediate the relationship between neighborhood disadvantage and CBR: percentage of calories from dietary fat, physical activity, cigarette smoking status, and alcohol consumption. Consumption of dietary fat was assessed during the clinic examination using items from a 158-item validated self-report food-frequency questionnaire (Carithers et al., 2009) and calculated as the percentage of calories from fat consumed per day. Leisure time physical activity was assessed during the clinic examination via a 30-item self-report questionnaire modified from the Baecke physical activity questionnaire used in the ARIC study and validated against accelerometer (Smitherman et al., 2009). This information was then used to create an Active Living Index, a summary score of the frequency and duration of watching television, walking and/or biking to work, school or errands and physical exercise that ranged from 1 (low leisure time physical activity) to 5 (high leisure time physical activity). Cigarette smoking status was assessed via self-report during the home interview and dichotomized as current vs. former/never. Alcohol consumption (grams per day) was estimated from the frequency and portion sizes of beer, wine and liquor reported in the food frequency questionnaire and included as a continuous variable.
Statistical Analysis
We assessed pooled and gender-specific distributions of individual biomarkers, CBR sub-indices, the overall CBR score, and covariates. Means and standard deviations were calculated for continuous variables and frequency distributions were calculated for categorical variables. Participants with missing data on biomarkers and behavioral covariates were compared to the analytic sample in relation to age, gender, education, and health behaviors to assess differences. We also calculated gender-specific, unadjusted mean CBR scores for cross-classified categories of neighborhood disadvantage and social cohesion.
We began the modeling process by fitting a “null” two-level variance components model, with random terms for census tracts (i.e. neighborhoods) and individuals to examine the within-neighborhood (level 1) and between-neighborhood (level 2) variation in CBR. Both estimates for the random components were statistically significant (level 1 variance: estimate= 3.5, SE=0.07, p<0.0001; level 2 variance: estimate= 0.06, SE= 0.02, p= 0.0078; intra-class correlation=0.02). Based on results from the null model and given the theoretical conceptualization of neighborhood disadvantage and social cohesion as factors that operate at the neighborhood level, we fit two-level linear regression models with random intercepts to assess the relationship between neighborhood disadvantage and CBR. The outcome, CBR, was modeled as a continuous variable and included in the model at level 1 along with individual-level covariates. Neighborhood disadvantage and social cohesion were included in the model as dichotomous variables at level 2.
Our regression analysis involved several modeling steps. First, we fit gender-specific models that adjusted for socio-demographic characteristics and included an interaction between neighborhood disadvantage and social cohesion. Based on statistically significant interactions for men (p=0.05) but not for women (p=0.50) we assessed the three-way interaction between neighborhood disadvantage, social cohesion and gender by fitting a pooled model that included neighborhood disadvantage, social cohesion, socio-demographic covariates and a three-way interaction term for neighborhood disadvantage, social cohesion, and gender as well all lower order interactions (Braumoeller, 2004).
Where,
Finally, based on the statistically significant three-way interaction term from the pooled model we examined the association between neighborhood disadvantaged and CBR in gender-specific models stratified by levels of social cohesion (i.e. high vs. low) that adjusted for socio-demographic characteristics (model 1) and further adjusted for behavioral covariates (model 2).
In secondary analyses, we examined the relationship between neighborhood characteristics and each sub-index of CBR using the same modeling procedure. All two-level linear regression models were fit using the PROC Mixed procedure in SAS (Singer, 1998). All analyses were carried out using SAS® software, Version 9.3 (SAS® Institute, Inc., Cary, NC).
RESULTS
Neighborhood Characteristics
There were considerable differences in neighborhood characteristics for the most disadvantaged neighborhoods compared to the least disadvantaged neighborhoods in the Jackson Metropolitan Area (Barber et al., 2015). For example, the average median household income in the least disadvantaged neighborhoods was more than double that of the most disadvantaged neighborhoods ($53,437 vs. $25,413). Moreover, the percentage of households in poverty was on average 28.1 in the most disadvantaged neighborhoods and 7.2 in the least disadvantaged neighborhoods.
Sample Characteristics
The sample included 2,799 women and 1,609 men with an average age of 54.5 years. Individuals missing data on biomarkers and covariates were slightly older, more likely to have never smoked and more likely to have less than a high school education. Seventy-three percent of the sample resided in the most disadvantaged neighborhoods with over half of the sample reporting upper-middle or high family incomes and over 30% reporting a completed college education. Men and women had similar levels of physical activity and dietary fat intake; however alcohol consumption was substantially higher among men and men were more likely than women to be current smokers (see Table 1).
Table 1.
Analytic Sample Characteristics by Gender in the JHS 2000–2004
| Full Sample (n=4,408) |
Women (n=2,800) |
Men (n=1,608) |
|
|---|---|---|---|
| Age, yrs | 54.5 | 54.9 | 53.7 |
| Education, % | |||
| ≤High School | 27.3 | 37.6 | 36.8 |
| Some College/Vocational | 29.2 | 29.2 | 29.2 |
| College | 33.3 | 33.1 | 33.7 |
| Missing | 0.20 | 0.18 | 0.25 |
| Family Income Level, % | |||
| Low | 12.5 | 14.8 | 8.5 |
| Lower-Middle | 21.2 | 22.7 | 18.5 |
| Upper-Middle | 25.6 | 25.5 | 25.8 |
| High | 25.9 | 21.9 | 32.8 |
| Missing | 14.8 | 15.0 | 14.4 |
| Current Smoker, % | 12.7 | 9.8 | 17.9 |
| Active Living Score | 2.1 | 2.1 | 2.1 |
| Calories from Fat, % | 35.0 | 35.1 | 35.0 |
| Alcohol Consumption, grams/day | 4.3 | 1.7 | 8.7 |
| Medication Use, % | |||
| Anti-Hypertensive Medication | 48.4 | 52.8 | 40.7 |
| Lipid-Lowering Medication | 11.8 | 12.2 | 11.3 |
| CBR Scorea, Mean (SD) | −0.06 (1.0) | −0.17 (1.9) | 0.12 (1.8) |
| Cardiovascular Sub-Indexb, Mean (SD) | −0.005 (0.67) | −0.04 (0.6) | 0.06 (0.7) |
| Systolic Blood Pressure (mmHg) | 126.7 (18.2) | 126.2 (18.3) | 127.7 (18.0) |
| Diastolic Blood Pressure (mmHg) | 79.0 (10.4) | 77.5 (10.1) | 81.7 (10.4) |
| Resting Heart Rate (beats per 30 secs) | 34.0 (5.0) | 34.3 (4.8) | 33.5 (5.1) |
| Inflammatory Sub-Indexb, Mean (SD) | 0.005 (1.0) | 0.17 (1.1) | −0.30 (0.84) |
| C-Reactive Protein (mg/dL) | 0.5 (0.7) | 0.60 (0.8) | 0.33 (0.6) |
| Metabolic Sub-Indexb, Mean (SD) | −0.031 (0.66) | −0.09 (0.7) | 0.08 (0.7) |
| Glycosylated Hemoglobin (%) | 5.9 (1.2) | 5.9 (1.2) | 5.9 (1.2) |
| HDL Cholesterol (mg/dL) | 51.9 (14.7) | 55.2 (14.7) | 46.2 (12.8) |
| Total Cholesterol (mg/dL) | 199.0 (39.4) | 200.5 (39.3) | 196.4 (39.4) |
| Waist Circumference (cm) | 100.5 (16.2) | 100.2 (16.8) | 100.9 (15.0) |
| Neuroendocrine Sub-Indexb, Mean (SD) | −0.022 (0.99) | −0.20 (0.96) | 0.28 (1.0) |
| Serum Cortisol (ug/dL) | 9.8 (4.1) | 9.1 (3.9) | 11.0 (3.9) |
CBR scores were created by summing the average z-scores of cardiovascular, metabolic, inflammatory, and neuroendocrine sub-indices.
Mean z-scores for each sub-index were an average of the biomarker z-scores within the sub-index.
Gender-specific mean CBR scores for cross-classified categories of neighborhood disadvantage and social cohesion showed that men living in the most disadvantaged neighborhoods with low levels of social cohesion had the highest CBR scores (Mean: 0.38, 95% CI: 0.22–0.53, see Figure 1). Furthermore, we found that men living in more affluent neighborhoods with high levels of social cohesion had higher CBR scores (Mean: −0.08, 95% CI: −0.25–0.09) than men living in more affluent neighborhoods with low levels of social cohesion (Mean: −0.33, 95% CI: −0.70–0.04, see Figure 1).
Figure 1.

Unadjusted mean CBR scores by neighborhood disadvantage and social cohesion Among Men in the JHS 2000–2004 (n=1,608)
Regression Results
In gender-specific regression models, we found a marginally significant interaction between neighborhood disadvantage and social cohesion for men (p=0.05) but not for women (p=0.50). The three-way interaction representing the joint impact of neighborhood disadvantage, social cohesion, and gender was statistically significant (p=0.05), confirming that the interaction between neighborhood disadvantage and social cohesion was gender-specific in our sample. Furthermore, the estimate for the three-way interaction indicated a stronger association for men, living in neighborhoods with high levels of disadvantage and low levels of social cohesion (β=0.63, SE: 0.32).
Results for gender-specific models stratified by social cohesion are found in Tables 2 and 3. Regression models for men (Table 2) revealed a stronger association between neighborhood disadvantage and CBR for individuals living in neighborhoods with low social cohesion (β=0.46 SE: 0.23, p-value=0.06). The estimate was marginally non-significant likely due to the smaller sample size within the strata. We also found a non-significant, inverse association between neighborhood disadvantage and CBR among men living in neighborhoods with high levels of social cohesion (β=−0.004 SE: 0.12, p-value=0.97). However, the magnitude and direction of this association should not be interpreted as a complete diminishing of the effect of neighborhood disadvantage in these settings. A close examination of the data shows that the inverse association within the context of neighborhoods with high levels of social cohesion appears to be driven, in part, by the higher than expected levels of CBR among men living in the least disadvantaged neighborhoods with high levels of social cohesion (see Figure 2). Moreover, the mean values of CBR were still highest in the most disadvantaged neighborhoods, irrespective of levels of social cohesion. Thus, while our findings provide evidence that low social cohesion may intensify the impact neighborhood disadvantage has on cumulative risk of disease among men, our findings are limited in providing evidence about the degree to which high social cohesion buffers the impact of neighborhood disadvantage in this group. As the interaction models suggested, there were no differences in the association among women (Table 3).
Table 2.
Association Between Neighborhood Disadvantage and Cumulative Biological Risk by High vs. Low Levels of Social Cohesion for Men in the JHS 2000–2004 (n=1,608)
| Model 1 | Model 2 | |||
|---|---|---|---|---|
| β | SE | β | SE | |
| Living in a neighborhood with high social cohesion, n=914 | ||||
|
| ||||
| Neighborhood Disadvantage | −0.004 | 0.12 | −0.03 | 0.12 |
| Age | 0.02 | 0.005**** | 0.02 | 0.005**** |
| Family Income | ||||
| Low | 0.62 | 0.25* | 0.45 | 0.245 |
| Lower-Middle | 0.36 | 0.19 | 0.31 | 0.19 |
| Upper Middle | 0.17 | 0.15 | 0.14 | 0.15 |
| High (REF) | ||||
| Education | ||||
| ≤ High School | −0.04 | 0.16 | −0.12 | 0.15 |
| Some College | 0.06 | 0.15 | −0.05 | 0.14 |
| College (REF) | ||||
| Health Behaviors | ||||
| % Calories from Fat | 0.03 | 0.01** | ||
| Active Living Score | −0.21 | 0.07** | ||
| Alcohol Use | 0.01 | 0.002**** | ||
| Current Smoker | 0.21 | 0.16 | ||
|
| ||||
| Living in a neighborhood with low social cohesion, n=694 | ||||
|
| ||||
| Neighborhood Disadvantage | 0.46 | 0.23 | 0.39 | 0.24 |
| Age | 0.01 | 0.01* | 0.01 | 0.01* |
| Family Income | ||||
| Low | 0.15 | 0.29 | 0.12 | 0.29 |
| Lower-Middle | 0.42 | 0.23 | 0.38 | 0.23 |
| Upper Middle | 0.40 | 0.21 | 0.38 | 0.21 |
| High (REF) | ||||
| Education | ||||
| ≤ High School | 0.35 | 0.20 | 0.31 | 0.20 |
| Some College | 0.21 | 0.20 | 0.18 | 0.20 |
| College (REF) | ||||
| Health Behaviors | ||||
| % Calories from Fat | 0.01 | 0.01 | ||
| Active Living Score | −0.17 | 0.09 | ||
| Alcohol Use | −0.001 | 0.003 | ||
| Current Smoker | 0.37 | 0.19* | ||
<0.0001
<0.001
<0.01
≤0.05
The p-value for the interaction between neighborhood disadvantage and social cohesion was marginally significant (p=0.05).
Table 3.
Association Between Neighborhood Disadvantage and Cumulative Biological Risk by High vs. Low Levels of Social Cohesion for Women in the JHS 2000–2004 (n=2,800)
| Model 1 | Model 2 | |||
|---|---|---|---|---|
| β | SE | β | SE | |
| Living in a neighborhood with high social cohesion, n=1,500 | ||||
|
| ||||
| Neighborhood Disadvantage | 0.16 | 0.11 | 0.12 | 0.11 |
| Age | 0.03 | 0.004**** | 0.02 | 0.004**** |
| Family Income | ||||
| Low | 0.39 | 0.19* | 0.36 | 0.19 |
| Lower-Middle | 0.10 | 0.16 | 0.07 | 0.16 |
| Upper Middle | 0.01 | 0.14 | −0.02 | 0.14 |
| High (REF) | ||||
| Education | ||||
| ≤ High School | 0.42 | 0.14** | 0.33 | 0.14* |
| Some College | 0.21 | 0.13 | 0.16 | 0.13 |
| College (REF) | ||||
| Health Behaviors | ||||
| % Calories from Fat | −0.004 | 0.01 | ||
| Active Living Score | −0.25 | 0.06**** | ||
| Alcohol Use | −0.001 | 0.01 | ||
| Current Smoker | 0.33 | 0.17* | ||
|
| ||||
| Living in a neighborhood with low social cohesion, n=1,300 | ||||
|
| ||||
| Neighborhood Disadvantage | 0.16 | 0.19 | 0.15 | 0.19 |
| Age | 0.02 | 0.004**** | 0.02 | 0.01*** |
| Family Income | ||||
| Low | 0.16 | 0.20 | 0.15 | 0.20 |
| Lower-Middle | 0.002 | 0.18 | 0.003 | 0.18 |
| Upper Middle | −0.03 | 0.17 | −0.02 | 0.17 |
| High (REF) | ||||
| Education | ||||
| ≤ High School | 0.28 | 0.15 | 0.22 | 0.15 |
| Some College | 0.30 | 0.15* | 0.28 | 0.15 |
| College (REF) | ||||
| Health Behaviors | ||||
| % Calories from Fat | 0.002 | 0.01 | ||
| Active Living Score | −0.21 | 0.07* | ||
| Alcohol Use | 0.01 | 0.01 | ||
| Current Smoker | 0.04 | 0.18 | ||
<0.0001
<0.001
<0.01
≤0.05
The p-value for the interaction between neighborhood disadvantage and social cohesion was not statistically significant (p=0.50).
Figure 2.
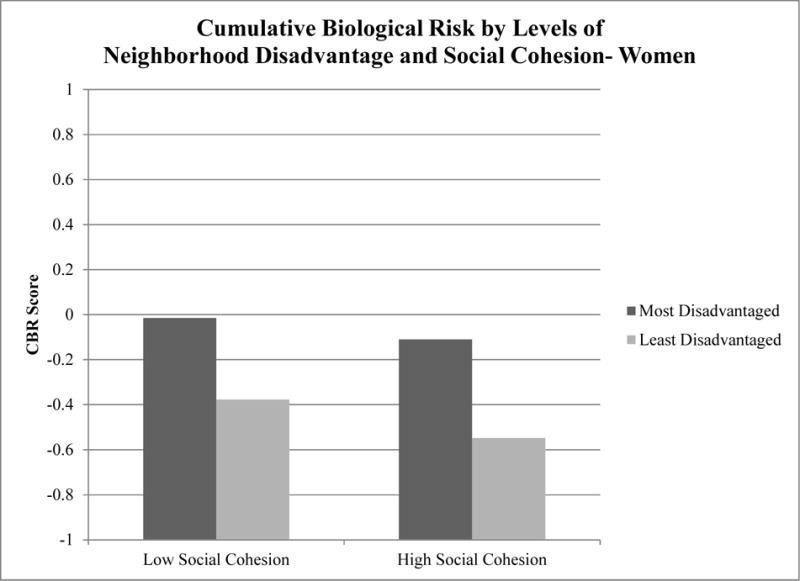
Unadjusted mean CBR scores by neighborhood disadvantage and social cohesion Among Women in the JHS 2000–2004 (n=2,800)
Finally, when we examined CBR sub-indices, the pattern was similar for the neuroendocrine component (i.e. cortisol); the three-way interaction term was statistically significant (p<0.01) and in gender-specific models stratified by social cohesion, the association was strongest among men living in neighborhoods with low levels of social cohesion (β=0.36 SE: 0.12, p-value<0.01). Interactions were not statistically significant for cardiovascular, metabolic, or inflammatory sub-indices (data not shown).
DISCUSSION
In a large, community-based sample of African American adults, we found that the association between neighborhood disadvantage and CBR was strongest for men living in neighborhoods with low levels of social cohesion. This supports our hypothesis that low levels of social cohesion may exacerbate the impact that living in a disadvantaged neighborhood has on cumulative risk of disease. We found no differences in the association among women. Additionally, a considerable portion of the association appeared to be driven by the neuroendocrine component of CBR (i.e. cortisol) suggesting that the compounded impact of neighborhood disadvantage and low levels of social cohesion may influence cumulative risk among men, in part, through stress-mediated pathways. These findings among African American men are consistent with the posited mechanisms linking low levels of social cohesion to health within the context of disadvantaged neighborhoods. These include, for example, higher rates of crime and violence (Sampson et al., 1997) and physical and social signs of disorder (e.g. garbage, broken windows, graffiti) (Sampson & Raudenbush, 1999) all of which have been linked to psychosocial distress within these settings (Ross & Mirowsky, 2001). Moreover, neighborhoods with low levels of social cohesion are often areas with high degrees of population turnover (Sampson et al., 1997) and fewer social structures such as churches and civic organizations that often serve as stabilizing anchors in the community. As a result, these neighborhoods are not only plagued by poor socio-economic conditions, but also a lack of social infrastructure that taken together, may increase overall cumulative risk of disease.
Research examining the independent impact of neighborhood socioeconomic conditions and social cohesion have generally found that high levels of disadvantage and low levels of social cohesion adversely influence health outcomes (Barber et al., 2015; Chichlowska et al., 2008; Clark et al., 2013; Diez-Roux, Merkin, et al., 2001; Kim et al., 2010; Leal & Chaix, 2011; Merkin et al., 2009; Mujahid et al., 2008) though in some instances, weaker (or no) associations have been found for men (Chichlowska et al., 2008; Clark et al., 2013; Kim et al., 2010). Only a few studies that we are aware of have examined their combined impact (Fone et al., 2007; Fone et al., 2014; Kim et al., 2010). Consistent with our study, a study of young adults in the US found that low social cohesion and high neighborhood deprivation was associated with increased risk of carotid artery calcification for men, but not women (Kim et al., 2010). Moreover, another study found that individuals living in deprived neighborhoods with high levels of social cohesion had better self-reported mental health profiles than individuals living in deprived neighborhoods with low levels of social cohesion (Fone et al., 2007)— a finding confirmed in subsequent longitudinal analyses (Fone et al., 2014). No gender differences were reported in either of these studies.
Our study found no evidence that social cohesion modified the association between neighborhood disadvantage and CBR among women, which may suggest that men and women interface with their neighborhood environments in different ways. For example, some investigators have suggested that men and women may have different levels of exposure to the various features of the neighborhood environment (Stafford, Cummins, Macintyre, Ellaway, & Marmot, 2005). Though some might initially argue that women spend more time in the neighborhoods in which they live (i.e. are “more exposed”), this view may be shortsighted within the context of disadvantaged neighborhoods. An argument could be made that African American men, in particular, who tend to experience prolonged spells of unemployment (W. J. Wilson, 1996), spend more time in the neighborhoods in which they live and are “more exposed” to their neighborhood environments and the adverse contextual factors such as crime and violence that accompany low levels of social cohesion. Moreover, they may encounter these adverse contextual exposures in more direct ways putting them at increased risk within these settings.
Another plausible explanation is that men and women may cope with the social and economic conditions of their neighborhood environments in different ways. For example, there is research that suggests that when faced with the immense psychosocial pressures of restrictive and oppressive economic and social environments (e.g. poor neighborhoods with low levels of social cohesion), some individuals, particularly African Americans at lower levels of SES, will engage in “prolonged, high-effort coping” (i.e. John Henryism) in a sometimes futile attempt to “overcome” the barriers in their environment (James, 1994). Over time, this active form of coping can manifest into a number of poor health outcomes (James, Keenan, Strogatz, Browning, & Garrett, 1992) linked to cumulative risk of disease. Though this coping strategy is not necessarily gender-specific (James, 1994) and has been observed among both men and women, a recent investigation in the present study population found that high effort coping was correlated with SES among men but not among women (Subramanyam et al., 2013). This may provide some support for differential coping within this group and future research should explore this more closely.
Our study is not without limitations. Due to the cross-sectional nature of the study, the temporal sequence of the exposure, covariates, and outcome cannot be determined limiting our ability to make causal claims regarding the observed associations. Moreover, our measure of social cohesion was derived from aggregated responses of a self-reported scale answered by an all-African American sample. Though some level of measurement error is likely, we have reason to believe that this measure was not merely a reflection of the “connections” individuals may feel because of kinship with a particular racial group. Data from our study showed that our measure of social cohesion was inversely correlated with % African American at the census tract level such that neighborhoods with higher proportions of African Americans had lower levels of social cohesion. This is consistent with the theoretical framework underpinning social cohesion which predicts that high proportions of African Americans in a neighborhood are strongly correlated with high levels of disadvantage and thus lower levels of social cohesion (Sampson et al., 1997). Additionally, though we were thoughtful about the cut-offs we used to designate ‘high” and “low” levels of social cohesion, they are nevertheless arbitrary cut-offs. Furthermore, census tracts served as proxies for neighborhoods which may or may not reflect the functional units in which complex social processes such as social cohesion take place. Finally, our measure of cortisol was a one-time serum measure which has been found to be sensitive to factors associated with the setting of data collection such as acute stressors and/or circadian rhythm (Stalder & Kirschbaum, 2012). Though factors such as acute stressors cannot be ruled out, most blood draws for cortisol were taken in the morning, which may have mitigated fluctuations in cortisol due to circadian rhythm.
Despite these limitations, our study has important strengths. Ours is the first study, to our knowledge, to examine the synergistic effect of neighborhood disadvantage and social cohesion on an objective cumulative risk profile among a large community-based sample of African American adults. We provide compelling evidence that the joint impact of neighborhood disadvantage and low levels of social cohesion is particularly detrimental for African American men. Moreover, our use of a multi-level analytic approach allowed us to distinguish between individual and neighborhood disadvantage and also allowed us to examine social cohesion as a social process that operates at the level of the neighborhood and not the individual. In addition, our primary outcome of interest was an objective measure of cumulative risk that included not only cardiovascular and metabolic components of cumulative risk but also inflammatory and neuroendocrine components in an effort to better capture the accumulation of risk across multiple physiological systems. Moreover, these biomarkers were assessed within the context of a clinical setting using standardized protocols reducing the potential for measurement error.
This study has attempted to capture the joint impact of high levels of disadvantage and low levels of social cohesion on disease risk among African Americans, a population in the United States that has been persistently exposed to these toxic neighborhood environments. The next logical step is to consider whether or not modifications in social cohesion can in fact mitigate some of the impact of neighborhood disadvantage on disease risk. This, however, is far from straightforward. For one, social processes like social cohesion are in many ways a direct result of the economic conditions of the neighborhoods in which they arise and thus cannot be addressed in isolation (Sampson et al., 1997). For this reason, many have cautioned against viewing these social processes as “panaceas” to the social ills that are characteristic of disadvantaged settings (Portes, 1998). Furthermore, if not handled carefully, focusing solely on the social processes within these settings as opposed to the broader socioeconomic conditions of the neighborhood environment could be viewed as “blaming the community”, analogous to the de-contextualization of the individual health and health behaviors of poor and minority populations that often results in short-sighted, individual-based interventions. Finally, far from being simply a “characteristic” of the neighborhood, social cohesion and other forms of social resources are processes that are dynamic and arise and develop over time.
Reservations aside, social cohesion and related social processes do provide a sense of “agency” that can often be absent from both the diagnosis of problems that arise in these settings and the development of viable solutions designed to foster positive change. This notion of agency is particularly salient in the American South where the history of collective action among African Americans and other marginalized groups has for decades been a hallmark of resistance against restrictive structural and economic conditions (C. M. Payne, 2007; Tuck, 2010). With these considerations in mind, policies and interventions within disadvantaged settings should seek to foster social cohesion by building on latent community strengths and capacity and by actively engaging local community leaders and organizations in community development efforts (Swaroop & Morenoff, 2006). This, combined with policies that directly address the socioeconomic conditions of neighborhoods such as job creation and expansion of educational opportunities, may, over time, improve neighborhood economic and social conditions and ultimately lead to better overall health and well-being of individuals who live in these settings.
CONCLUSION
Our study adds to the growing body of literature that links the economic and social conditions of neighborhood environments to health and well-being. The joint impact of neighborhood disadvantage and low social cohesion may be particularly detrimental for African American men who face a number of challenges that put them at increased risk in these settings. Interventions and policies designed to address both neighborhood economic and social conditions may be best suited to address cumulative risk of disease in this group.
Research Highlights.
Examined the joint impact of neighborhood disadvantage and low social cohesion on cumulative biological risk
Low social cohesion exacerbated the impact of neighborhood disadvantage for African American men
The association was driven by the neuroendocrine component of cumulative biological risk
Acknowledgments
This research was supported by funding from the National Institutes of Health National Research Service Award training grant, CVD Epidemiology Training Program in Behavior, the Environment and Global Health (T32 HL 098048-02) and the NIH Initiative to Maximize Student Diversity (5 R25 GM 055353) grant funding. The creation of Jackson Heart Study (JHS) Neighborhood Environment Variables was supported by CIAHD: Michigan Center for Integrative Approaches to Health Disparities funded by the National Institute on Minority Health and Health Disparities, by EPA and NIMHD: Environment Supplement P60 MD002249 05S1 (PI: Dr. Diez Roux) and by the MESA Neighborhood Study R01 HL071759 (PI: Dr. Diez Roux) funded by the National Institutes of Health, National Heart, Lung, and Blood Institute. We thank all members of the Environment Assessment Team (Amanda Dudley, Jana Hirsch, Kari Moore, Melissa Zagorski, Paul Christine, Paulina Kaiser, Samson Gebreab, Shannon Brines, and Steven Wang) for their contributions to the collection and cleaning of geographical data and the creation of the neighborhood environment variables. The Jackson Heart Study is supported by contracts HHSN268201300046C, HHSN268201300047C, HHSN268201300048C, HHSN268201300049C, and HHSN268201300050C from the National Heart, Lung, and Blood Institute and the National Institute on Minority Health and Health Disparities. Special thanks to the JHS research staff and study participants.
Footnotes
Publisher's Disclaimer: This is a PDF file of an unedited manuscript that has been accepted for publication. As a service to our customers we are providing this early version of the manuscript. The manuscript will undergo copyediting, typesetting, and review of the resulting proof before it is published in its final citable form. Please note that during the production process errors may be discovered which could affect the content, and all legal disclaimers that apply to the journal pertain.
References
- Altschuler A, Somkin CP, Adler NE. Local services and amenities, neighborhood social capital, and health. Social Science & Medicine. 2004;59(6):1219–1229. doi: 10.1016/j.socscimed.2004.01.008. doi: http://dx.doi.org/10.1016/j.socscimed.2004.01.008. [DOI] [PubMed] [Google Scholar]
- Barber S, Hickson DA, Kawachi I, Subramanian SV, Earls F. Neighborhood Disadvantage and Cumulative Biological Risk Among a Socioeconomically Diverse Sample of African American Adults: An Examination in the Jackson Heart Study. Journal of Racial and Ethnic Health Disparities. 2015:1–13. doi: 10.1007/s40615-015-0157-0. [DOI] [PMC free article] [PubMed] [Google Scholar]
- Baum FE, Ziersch AM, Zhang G, Osborne K. Do perceived neighbourhood cohesion and safety contribute to neighbourhood differences in health? Health Place. 2009;15(4):925–934. doi: 10.1016/j.healthplace.2009.02.013. [DOI] [PubMed] [Google Scholar]
- Braumoeller BF. Hypothesis Testing and Multiplicative Interaction Terms. International Organization. 2004;58(4):807–820. doi: 10.2307/3877804. [DOI] [Google Scholar]
- Carithers TC, Talegawkar SA, Rowser ML, Henry OR, Dubbert PM, Bogle ML, Tucker KL. Validity and calibration of food frequency questionnaires used with African-American adults in the Jackson Heart Study. J Am Diet Assoc. 2009;109(7):1184–1193. doi: 10.1016/j.jada.2009.04.005. [DOI] [PMC free article] [PubMed] [Google Scholar]
- Carpenter MA, Crow R, Steffes M, Rock W, Heilbraun J, Evans G, Sarpong D. Laboratory, reading center, and coordinating center data management methods in the Jackson Heart Study. Am J Med Sci. 2004;328(3):131–144. doi: 10.1097/00000441-200409000-00001. Retrieved from http://www.ncbi.nlm.nih.gov/pubmed/15367870 http://graphics.tx.ovid.com.ezp-prod1.hul.harvard.edu/ovftpdfs/FPDDNCDCBFPFGG00/fs046/ovft/live/gv023/00000441/00000441-200409000-00001.pdf. [DOI] [PubMed] [Google Scholar]
- Chichlowska KL, Rose KM, Diez-Roux AV, Golden SH, McNeill AM, Heiss G. Individual and neighborhood socioeconomic status characteristics and prevalence of metabolic syndrome: the Atherosclerosis Risk in Communities (ARIC) Study. Psychosom Med. 2008;70(9):986–992. doi: 10.1097/PSY.0b013e318183a491. [DOI] [PMC free article] [PubMed] [Google Scholar]
- Clark CR, Ommerborn MJ, Hickson DA, Grooms KN, Sims M, Taylor HA, Albert MA. Neighborhood Disadvantage, Neighborhood Safety and Cardiometabolic Risk Factors in African Americans: Biosocial Associations in the Jackson Heart Study. PLoS ONE. 2013;8(5):1–10. doi: 10.1371/journal.pone.0063254. [DOI] [PMC free article] [PubMed] [Google Scholar]
- Cleland V, Ball K, Hume C, Timperio A, King AC, Crawford D. Individual, social and environmental correlates of physical activity among women living in socioeconomically disadvantaged neighbourhoods. Soc Sci Med. 2010;70(12):2011–2018. doi: 10.1016/j.socscimed.2010.02.028. [DOI] [PubMed] [Google Scholar]
- Crimmins EM, Seeman TE. Integrating biology into the study of health disparities. Population and Development Review. 2004;30:89–107. [Google Scholar]
- de Vries S, van Dillen SM, Groenewegen PP, Spreeuwenberg P. Streetscape greenery and health: Stress, social cohesion and physical activity as mediators. Soc Sci Med. 2013;94:26–33. doi: 10.1016/j.socscimed.2013.06.030. [DOI] [PubMed] [Google Scholar]
- Diez-Roux AV, Kiefe CI, Jacobs DR, Jr, Haan M, Jackson SA, Nieto FJ, Schulz R. Area characteristics and individual-level socioeconomic position indicators in three population-based epidemiologic studies. Ann Epidemiol. 2001;11(6):395–405. doi: 10.1016/s1047-2797(01)00221-6. [DOI] [PubMed] [Google Scholar]
- Diez-Roux AV, Merkin SS, Arnett D, Chambless L, Massing M, Nieto FJ, Watson RL. Neighborhood of residence and incidence of coronary heart disease. N Engl J Med. 2001;345(2):99–106. doi: 10.1056/NEJM200107123450205. [DOI] [PubMed] [Google Scholar]
- Fone D, Dunstan F, Lloyd K, Williams G, Watkins J, Palmer S. Does social cohesion modify the association between area income deprivation and mental health? A multilevel analysis. Int J Epidemiol. 2007;36(2):338–345. doi: 10.1093/ije/dym004. [DOI] [PubMed] [Google Scholar]
- Fone D, White J, Farewell D, Kelly M, John G, Lloyd K, Dunstan F. Effect of neighbourhood deprivation and social cohesion on mental health inequality: a multilevel population-based longitudinal study. Psychol Med. 2014:1–12. doi: 10.1017/s0033291713003255. [DOI] [PubMed] [Google Scholar]
- Hickson DA, Waller LA, Gebreab SY, Wyatt SB, Kelly J, Antoine-Lavigne D, Sarpong DF. Geographic representation of the jackson heart study cohort to the African-American population in Jackson, Mississippi. Am J Epidemiol. 2011;173(1):110–117. doi: 10.1093/aje/kwq317. [DOI] [PMC free article] [PubMed] [Google Scholar]
- James SA. John Henryism and the health of African-Americans. Cult Med Psychiatry. 1994;18(2):163–182. doi: 10.1007/BF01379448. [DOI] [PubMed] [Google Scholar]
- James SA, Keenan NL, Strogatz DS, Browning SR, Garrett JM. Socioeconomic status, John Henryism, and blood pressure in black adults. The Pitt County Study. Am J Epidemiol. 1992;135(1):59–67. doi: 10.1093/oxfordjournals.aje.a116202. Retrieved from http://aje.oxfordjournals.org.ezp-prod1.hul.harvard.edu/content/135/1/59.full.pdf. [DOI] [PubMed] [Google Scholar]
- Johns LE, Aiello AE, Cheng C, Galea S, Koenen KC, Uddin M. Neighborhood social cohesion and posttraumatic stress disorder in a community-based sample: findings from the Detroit Neighborhood Health Study. Soc Psychiatry Psychiatr Epidemiol. 2012;47(12):1899–1906. doi: 10.1007/s00127-012-0506-9. [DOI] [PMC free article] [PubMed] [Google Scholar]
- Juster RP, McEwen BS, Lupien SJ. Allostatic load biomarkers of chronic stress and impact on health and cognition. Neurosci Biobehav Rev. 2010;35(1):2–16. doi: 10.1016/j.neubiorev.2009.10.002. [DOI] [PubMed] [Google Scholar]
- Kawachi I, Berkman L. Neighborhoods and Health. Oxford University Press; 2003. [Google Scholar]
- Kim D. Blues from the neighborhood? Neighborhood characteristics and depression. Epidemiol Rev. 2008;30:101–117. doi: 10.1093/epirev/mxn009. [DOI] [PubMed] [Google Scholar]
- Kim D, Diez Roux AV, Kiefe CI, Kawachi I, Liu K. Do neighborhood socioeconomic deprivation and low social cohesion predict coronary calcification?: the CARDIA study. Am J Epidemiol. 2010;172(3):288–298. doi: 10.1093/aje/kwq098. [DOI] [PMC free article] [PubMed] [Google Scholar]
- King KE, Morenoff JD, House JS. Neighborhood context and social disparities in cumulative biological risk factors. Psychosom Med. 2011;73(7):572–579. doi: 10.1097/PSY.0b013e318227b062. [DOI] [PMC free article] [PubMed] [Google Scholar]
- Krieger N. A century of census tracts: health & the body politic (1906–2006) J Urban Health. 2006;83(3):355–361. doi: 10.1007/s11524-006-9040-y. [DOI] [PMC free article] [PubMed] [Google Scholar]
- Kuipers MA, van Poppel MN, van den Brink W, Wingen M, Kunst AE. The association between neighborhood disorder, social cohesion and hazardous alcohol use: a national multilevel study. Drug Alcohol Depend. 2012;126(1–2):27–34. doi: 10.1016/j.drugalcdep.2012.04.008. [DOI] [PubMed] [Google Scholar]
- Leal C, Chaix B. The influence of geographic life environments on cardiometabolic risk factors: a systematic review, a methodological assessment and a research agenda. Obes Rev. 2011;12(3):217–230. doi: 10.1111/j.1467-789X.2010.00726.x. [DOI] [PubMed] [Google Scholar]
- Mair C, Diez Roux AV, Shen M, Shea S, Seeman T, Echeverria S, O’Meara ES. Cross-sectional and longitudinal associations of neighborhood cohesion and stressors with depressive symptoms in the multiethnic study of atherosclerosis. Ann Epidemiol. 2009;19(1):49–57. doi: 10.1016/j.annepidem.2008.10.002. [DOI] [PMC free article] [PubMed] [Google Scholar]
- Massey D. Residential Segregation and Neighborhood Conditions in U.S. Metropolitan Areas. In: Smesler NJ, Wilson WJ, Mitchell F, editors. America Becoming: Racial Trends and Their Consequences. Vol. 1. Washington, D.C: National Academy Press; 2001. [Google Scholar]
- Massey D, Denton N. American Apartheid: segregation and the making of the underclass. Harvard University Press; 1993. [Google Scholar]
- McEwen BS, Gianaros PJ. Central role of the brain in stress and adaptation: links to socioeconomic status, health, and disease. Ann N Y Acad Sci. 2010;1186:190–222. doi: 10.1111/j.1749-6632.2009.05331.x. [DOI] [PMC free article] [PubMed] [Google Scholar]
- Merkin SS, Basurto-Dávila R, Karlamangla A, Bird CE, Lurie N, Escarce J, Seeman T. Neighborhoods and cumulative biological risk profiles by race/ethnicity in a national sample of U.S. adults: NHANES III. Ann Epidemiol. 2009;19(3):194–201. doi: 10.1016/j.annepidem.2008.12.006. [DOI] [PMC free article] [PubMed] [Google Scholar]
- Mujahid MS, Diez Roux AV, Morenoff JD, Raghunathan TE, Cooper RS, Ni H, Shea S. Neighborhood characteristics and hypertension. Epidemiology. 2008;19(4):590–598. doi: 10.1097/EDE.0b013e3181772cb2. [DOI] [PubMed] [Google Scholar]
- O’Campo P, Burke JG, Culhane J, Elo IT, Eyster J, Holzman C, Laraia BA. Neighborhood deprivation and preterm birth among non-Hispanic Black and White women in eight geographic areas in the United States. Am J Epidemiol. 2008;167(2):155–163. doi: 10.1093/aje/kwm277. [DOI] [PubMed] [Google Scholar]
- Payne CM. I’ve got the light of freedom: the organizing tradition and the mississippi freedom struggle. Berkeley and Los Angeles, CA: University of California Press; 2007. [Google Scholar]
- Payne TJ, Wyatt SB, Mosley TH, Dubbert PM, Guiterrez-Mohammed ML, Calvin RL, Williams DR. Sociocultural methods in the Jackson Heart Study: conceptual and descriptive overview. Ethn Dis. 2005;15(4 Suppl 6):S6-38–48. Retrieved from http://www.ncbi.nlm.nih.gov/pubmed/16317984. [PubMed] [Google Scholar]
- Pickett KE, Pearl M. Multilevel analyses of neighbourhood socioeconomic context and health outcomes: a critical review. J Epidemiol Community Health. 2001;55(2):111–122. doi: 10.1136/jech.55.2.111. Retrieved from http://www.ncbi.nlm.nih.gov/pubmed/11154250. [DOI] [PMC free article] [PubMed] [Google Scholar]
- http://www.ncbi.nlm.nih.gov/pmc/articles/PMC1731829/pdf/v055p00111.pdf
- Portes A. Social Capital: Its origins and applications in modern sociology. Annual Review of Sociology. 1998;24:1–24. [Google Scholar]
- Roberts EM. Neighborhood social environments and the distribution of low birthweight in Chicago. Am J Public Health. 1997;87(4):597–603. doi: 10.2105/ajph.87.4.597. Retrieved from http://www.ncbi.nlm.nih.gov/pubmed/9146438. [DOI] [PMC free article] [PubMed] [Google Scholar]
- http://www.ncbi.nlm.nih.gov/pmc/articles/PMC1380839/pdf/amjph00503-0071.pdf
- Robinson JC, Wyatt SB, Hickson D, Gwinn D, Faruque F, Sims M, Taylor HA. Methods for retrospective geocoding in population studies: the Jackson Heart Study. J Urban Health. 2010;87(1):136–150. doi: 10.1007/s11524-009-9403-2. [DOI] [PMC free article] [PubMed] [Google Scholar]
- Ross CE, Mirowsky J. Neighborhood Disadvantage, Disorder, and Health. J Health Soc Behav. 2001;42(3):258–276. doi: 10.2307/3090214. [DOI] [PubMed] [Google Scholar]
- Sampson RJ, Raudenbush SW. Systematic Social Observation of Public Spaces: A New Look at Disorder in Urban Neighborhoods. American Journal of Sociology. 1999;105(3):603–651. doi: 10.1086/210356. [DOI] [Google Scholar]
- Sampson RJ, Raudenbush SW, Earls F. Neighborhoods and violent crime: a multilevel study of collective efficacy. Science. 1997;277(5328):918–924. doi: 10.1126/science.277.5328.918. Retrieved from http://www.sciencemag.org/content/277/5328/918.full.pdf. [DOI] [PubMed] [Google Scholar]
- Seeman TE, McEwen BS, Rowe JW, Singer BH. Allostatic load as a marker of cumulative biological risk: MacArthur studies of successful aging. Proc Natl Acad Sci U S A. 2001;98(8):4770–4775. doi: 10.1073/pnas.081072698. [DOI] [PMC free article] [PubMed] [Google Scholar]
- Singer J. Using SAS PROC MIXED to fit multilevel models, hierarchical models, and individual growth models. Journal of Educational and Behavioral Statistics. 1998;24(4):323–355. [Google Scholar]
- Slopen N, Dutra LM, Williams DR, Mujahid MS, Lewis TT, Bennett GG, Albert MA. Psychosocial stressors and cigarette smoking among African American adults in midlife. Nicotine Tob Res. 2012;14(10):1161–1169. doi: 10.1093/ntr/nts011. [DOI] [PMC free article] [PubMed] [Google Scholar]
- Smitherman TA, Dubbert PM, Grothe KB, Sung JH, Kendzor DE, Reis JP, Taylor HA. Validation of the Jackson Heart Study Physical Activity Survey in African Americans. J Phys Act Health. 2009;6(Suppl 1):S124–132. doi: 10.1123/jpah.6.s1.s124. Retrieved from http://www.ncbi.nlm.nih.gov/pubmed/19998858. [DOI] [PubMed] [Google Scholar]
- Stafford M, Cummins S, Macintyre S, Ellaway A, Marmot M. Gender differences in the associations between health and neighbourhood environment. Soc Sci Med. 2005;60(8):1681–1692. doi: 10.1016/j.socscimed.2004.08.028. [DOI] [PubMed] [Google Scholar]
- Stalder T, Kirschbaum C. Analysis of cortisol in hair–state of the art and future directions. Brain Behav Immun. 2012;26(7):1019–1029. doi: 10.1016/j.bbi.2012.02.002. [DOI] [PubMed] [Google Scholar]
- Subramanyam MA, James SA, Diez-Roux AV, Hickson DA, Sarpong D, Sims M, Wyatt SB. Socioeconomic status, John Henryism and blood pressure among African-Americans in the Jackson Heart Study. Soc Sci Med. 2013;93:139–146. doi: 10.1016/j.socscimed.2013.06.016. [DOI] [PMC free article] [PubMed] [Google Scholar]
- Swaroop S, Morenoff JD. Building Community: The Neighborhood Context of Social Organization. Social Forces. 2006;84(3):1665–1695. doi: 10.1353/sof.2006.0058. [DOI] [Google Scholar]
- Taylor HA, Wilson JG, Jones DW, Sarpong DF, Srinivasan A, Garrison RJ, Wyatt SB. Toward resolution of cardiovascular health disparities in African Americans: design and methods of the Jackson Heart Study. Ethn Dis. 2005;15(4 Suppl 6):S6-4–17. Retrieved from http://www.ncbi.nlm.nih.gov/pubmed/16320381. [PubMed] [Google Scholar]
- Tuck S. We ain’t what we ought to be: the Black freedom struggle from Empancipation to Obama. Cambridge, MA: Belknap Press of Harvard University Press; 2010. [Google Scholar]
- U.S. Census Bureau. Money Income in the United States: 2000. 2001 Jun 16; 2010. Retrieved from http://www.census.gov/hhes/www/income/data/incpovhlth/2000/tables.html.
- U.S. Census Bureau. Patterns of Metropolitan and Micropolitan Population Change: 2000 to 2010. 2012 Retrieved from http://www.census.gov/population/metro/data/pop_data.html.
- Wilson J. The Truly Disadvantage: the inner city, the underclass and social policy. University of Chicago Press; 1987. [Google Scholar]
- Wilson WJ. When work disappears: the world of the new urban poor. New York: Vintage; 1996. [Google Scholar]