Abstract
Epidermal growth factor receptor (EGFR) is central to epithelial cell physiology and deregulated EGFR signaling has a key role in a variety of human carcinomas. Here we show that silencing of the EGF-related factor amphiregulin (AREG) markedly inhibits the expansion of human keratinocytes through mitotic failure and accumulation of cells with ≥4n DNA content. RNA-seq-based transcriptome analysis revealed that tetracycline-mediated AREG silencing significantly altered the expression of 2,331 genes, 623 of which were not normalized by treatment with EGF. Interestingly, genes irreversibly up-regulated by suppression of AREG overlapped with genes involved in keratinocyte differentiation. Moreover, a significant proportion of the irreversibly down-regulated genes featured upstream binding sites recognized by FoxM1, a key transcription factor in the control of mitosis that is widely dysregulated in cancer. The downregulation of FoxM1 and its target genes preceded mitotic arrest. Constitutive expression of FoxM1 in AREG knockdown cells normalized cell proliferation, reduced the number of cells with ≥4n DNA content, and rescued expression of FoxM1 target genes. These results demonstrate that AREG controls G2/M progression and cytokinesis in keratinocytes via activation of a FoxM1-dependent transcriptional program, suggesting new avenues for treatment of epithelial cancer.
Keywords: epidermal growth factor receptor, amphiregulin, keratinocytes, cell cycle, proliferation
INTRODUCTION
Epidermal homeostasis requires balance between keratinocyte proliferation and differentiation1; however the underlying regulatory network controlling this balance remains incompletely understood.2 Epidermal growth factor receptor (EGFR) signaling is an important regulator of epidermal development and homeostasis3–6 and plays an important role in the control of multiple keratinocyte functions including migration,7,8 proliferation,9 differentiation,10–12 survival13,14 and activation of innate and adaptive immune responses.15–17 Deregulated EGFR signaling is a hallmark of epithelial cancer 18, and EGFR is a validated target in several types of carcinomas.19–22 EGFR becomes activated in response to binding members of the EGF ligand family,23 several of which are expressed in human keratinocytes and skin including amphiregulin (AREG), betacellulin, epigen, epiregulin, heparin-binding EGF-like growth factor (HB-EGF), and transforming growth factor-alpha (TGF-a).7,24,25 Metalloproteinase-mediated cleavage of the transmembrane precursors of these growth factors is thought to be required for major EGFR ligand functions including cell proliferation and migration.23
Different EGFR ligands mediate keratinocyte behavior in different cellular contexts.7 AREG participates in embryonic morphogenesis of mammary gland and bone.26,27 It is the predominant autocrine growth factor for cultured keratinocytes,7,9,28 and is markedly upregulated in hyperproliferative skin conditions including psoriasis and wound healing.17,29,30 AREG is gaining increasing relevance in cancer research and treatment, since it is overexpressed in a wide variety of tumors, is a marker of poor prognosis and resistance to anti-EGFR therapies in a variety of epithelial neoplasms, and it may confer tumor cells with autonomous growth.31–34
The mechanisms by which AREG regulates proliferation remain to be elucidated. We recently reported that shRNA-mediated silencing of the AREG gene markedly inhibits keratinocyte growth in a way that cannot be reversed by addition of EGF or other EGFR ligands.9 Interestingly, AREG silencing results in the accumulation of flattened keratinocytes that are often binucleated.9 In the present study, we set out to further elucidate the mechanism(s) by which proAREG controls keratinocyte proliferation and differentiation.
Using conditional AREG knockdown keratinocytes9 in combination with high throughput RNA sequencing (RNA-seq) and lentivirus-mediated gene expression, here we functionally implicate Forkhead box protein M1 (FoxM1), a winged helix transcription factor,35 as a key mediator of AREG’s effects upon keratinocyte proliferation and differentiation. Because FoxM1 is a major regulator of G2/M progression36 that is widely overexpressed in human cancer and implicated in cancer progression and metastasis,35 these findings have important mechanistic implications for the role of AREG in the pathogenesis and treatment of epithelial cancer.
RESULTS
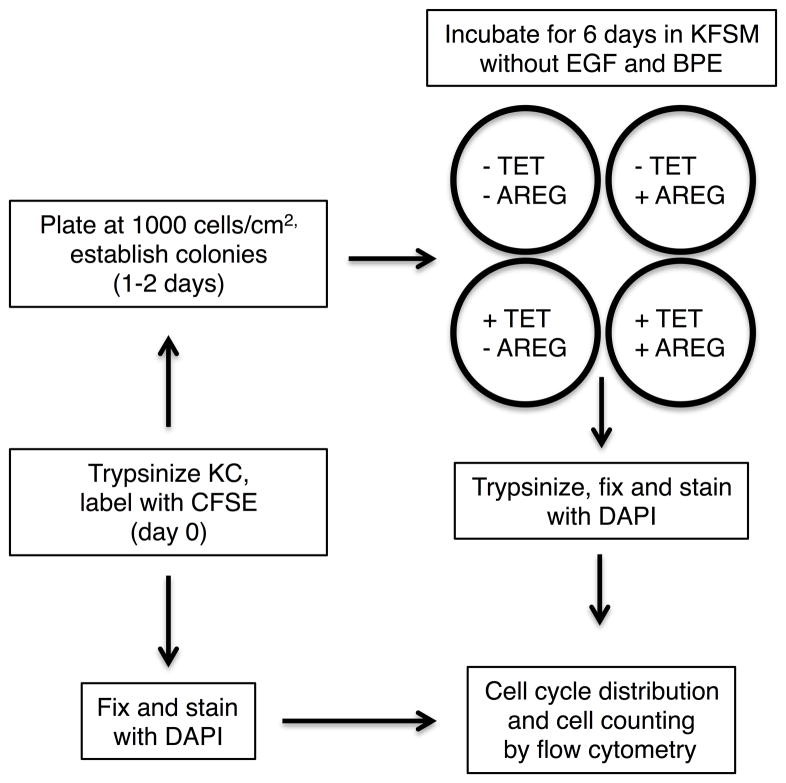
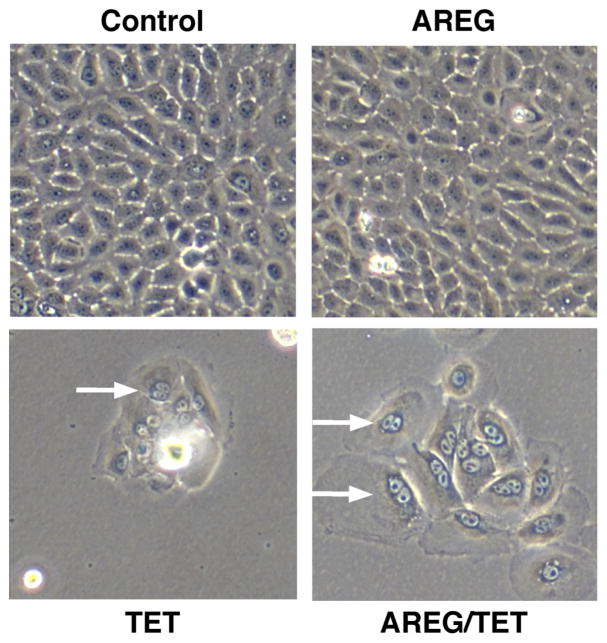
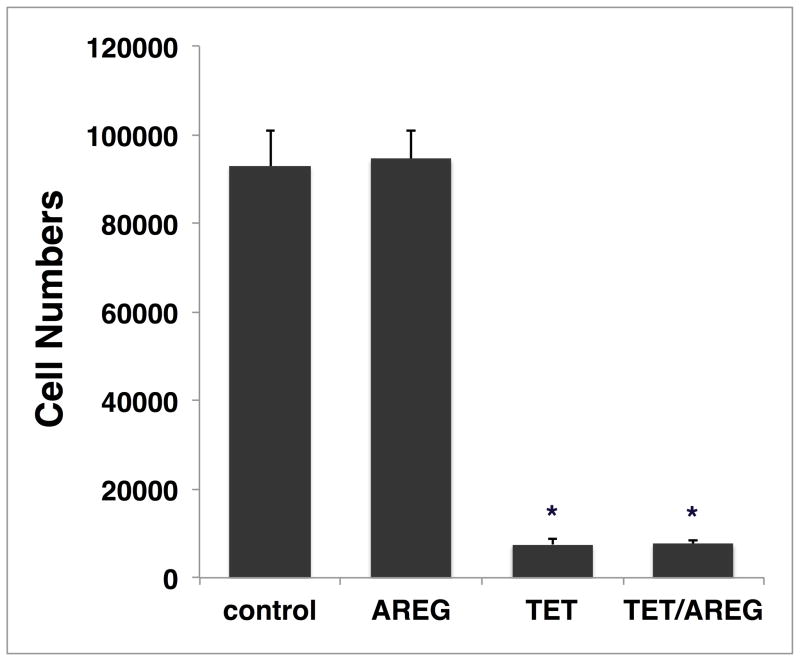
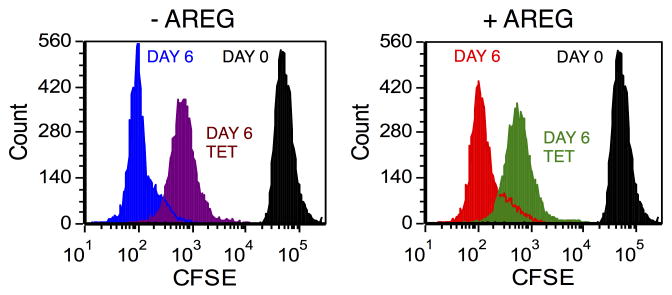
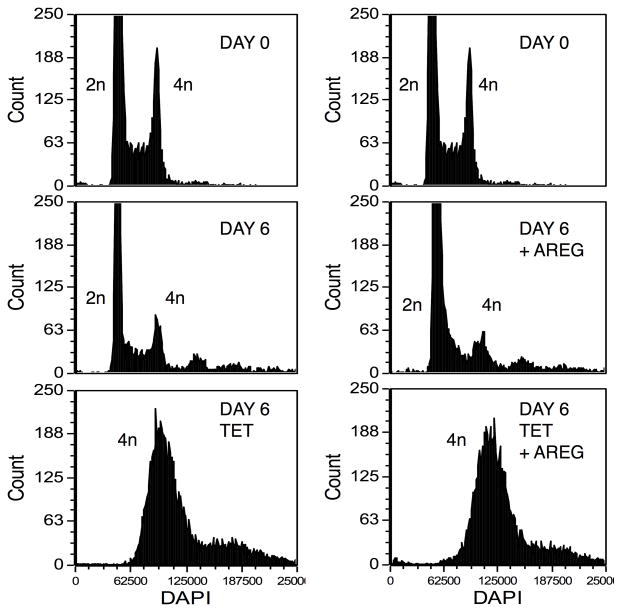
We subjected the inducible AREG knockdown keratinocyte cell line N/TERT-TR-shAREG to autocrine growth assays as described7 and determined cell counts, proliferation, and cell cycle distribution by flow cytometry (Figure 1A). Tet-mediated AREG silencing led to the appearance of flattened, binucleated cells that differed markedly in appearance from to the “cobblestone” morphology of these cells grown in the absence of Tet (Figure 1B). Although addition of recombinant human (rh)AREG (or rhEGF or rhTGF-α, data not shown) had little or no effect in the absence of Tet (Figure 1B, upper panels), prominent cell enlargement was observed in its presence (lower panels). As assessed by flow-cytometry-based cell counting (Figure 1C) and by carboxyfluorescein succinimidyl ester (CFSE) dye dilution (Figure 1D), AREG silencing resulted in a 12.5-fold decrease in cell counts and an 8-fold reduction in proliferation, respectively, irrespective of addition of 100 ng/ml exogenous rhAREG. Relative to logarithmic-phase N/TERT-TR-shAREG keratinocytes grown in complete medium (Figure 1E, upper panel), six-day growth under autocrine conditions led to a modest increase of cells with >4n DNA content in the absence of Tet (middle panels). However, addition of Tet caused a massive increase in cells with ≥4n DNA content (lower panels). Notably, neither the decreased proliferation nor the number of cells with ≥4n DNA content could be reversed by 100 ng/ml rhAREG. We confirmed that trypsinization generated single-cell suspensions by forward vs. side scattering and by fluorescence microscopy (data not shown).
Figure 1. AREG silencing profoundly alters keratinocyte morphology and cell cycle distribution in human keratinocytes.
(A) Overview of the keratinocyte cell growth assay with and without 1 μg/ml Tet with and without 100 ng/ml rhAREG. (B) Parental N/TERT-TR-shAREG keratinocytes were subjected to growth assays and photographed at the end of the six-day assay. Note that Tet-induced AREG silencing leads to the appearance of binucleated cells (arrows). (C) Quantification of cell numbers as assessed by flow cytometry-based cell counting using fluorescent reference beads. Data are expressed as cell numbers and represent 10% of the total cells per well. Data are mean +/− standard error of the mean (SEM, n=4 with three biological replicates per experiment and condition). Significant pairwise contrasts (mean ratio; corrected P): control vs. Tet (12.8; 0.0097), control vs. Tet/AREG (12.2; 0.0051), AREG vs. Tet (13.1; 0.011), AREG vs. Tet/AREG (12.5; 0.0041). (D and E) CFSE-labeled keratinocytes were used in six day growth assays followed by DAPI labeling and analysis by flow cytometry. “Day 0” denotes keratinocytes at the time of plating. Note that Tet-induced AREG silencing causes a marked decrease in cell division (~8-fold reduction relative to control keratinocytes, as assessed by reduced dye dilution) (D) accompanied by a large increase in cells with ≥4n DNA content (E) even in the presence of exogenous AREG.
Using high throughput complementary DNA sequencing (RNA-seq), we next analyzed the effect of AREG knockdown on the transcriptome of N/TERT-TR-shAREG cells in the presence or absence of exogenous rhEGF. Tet-induced AREG knockdown was effective (5.4% of control), and, as expected, was not normalized by addition of 20 ng/ml EGF to the Tet-treated cultures (6.2% of control). We evaluated 12,916 genes for differential expression, including only those genes with expression ≥1 cpm (count per million reads) that mapped to protein coding regions in at least 3 of the 6 samples involved in the comparison (Tet-treated vs control). Of these, a total of 2,331 were identified as altered significantly by Tet (differentially-expressed genes, or DEGs). Of these, 1,271 DEGs were increased (FC > 2, FDR < 0.05) and 1,060 were decreased (FC < 0.50, FDR < 0.05). Among the DEGs, 623 (215 up, 408 down) were not normalized by addition of EGF (see Materials and Methods for definition of normalization). In contrast, 375 genes (243 up, 132 down) were normalized by EGF treatment. The remaining 1,333 DEGs were of uncertain status with respect to normalization of expression by EGF treatment. The lists of DEGs are provided in the supplementary data (Excel Data Files).
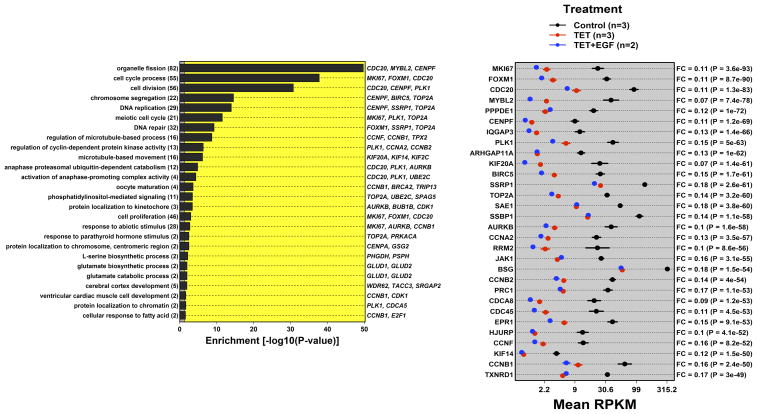
Gene Ontology (GO) analysis performed using the GOstats package37 revealed that the set of genes whose expression was down-regulated by Tet and not normalized by addition of rhEGF was significantly enriched for biological processes of cell cycle regulation, chromosome segregation, DNA replication, and DNA repair (Figure 2A, left panel). In addition to the FOXM1 and MYBL2 genes encoding the cooperating transcription factors FoxM1 and B-Myb,38,39 the 30 most significantly down-regulated genes not normalized by EGF included several other genes involved in the regulation of mitosis, including KIF20A, AURKB, CENPF, BIRC5, and PLK135,36,40 (Figure 2A, right panel). Consistent with these observations, the 1 KB upstream regions of genes down-regulated by AREG silencing and not normalized by EGF were significantly (p = 2.75 ×10⁻⁸) enriched for binding sites recognized by FoxM1, a key transcription factor involved in the G2/M cell cycle checkpoint,36 as well as for E2F transcription factors involved in cell cycle progression (Figure S1).
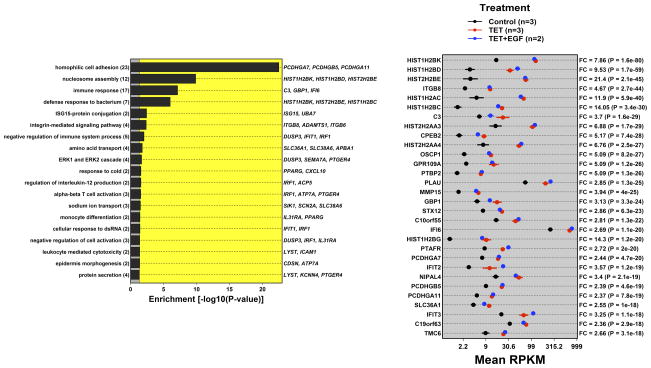
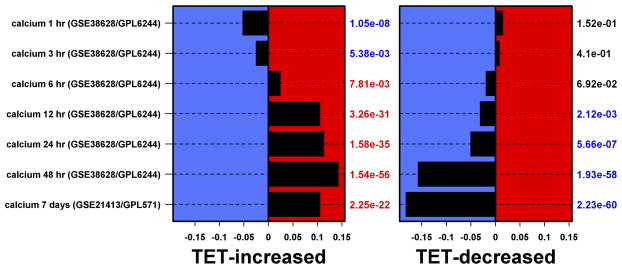
Figure 2. AREG silencing reduces expression of genes regulating G2/M and/or cytokinesis.
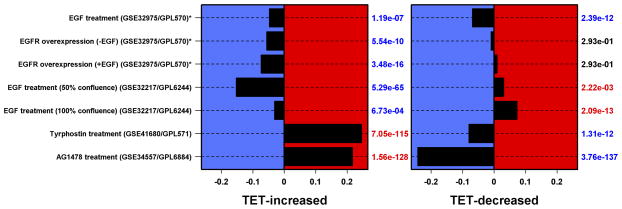
N/TERT-TR-shAREG cells were incubated in the presence or absence of Tet with and without 20 ng/ml EGF for 60 h, followed by analysis of global gene expression by RNA-seq. (A and B) Gene ontology analysis of genes downregulated by Tet and not normalized by EGF (A) or upregulated by Tet and not repressed by EGF (B). Left panels: bars indicate P -values for the most significant GO terms with the categories on the left, (followed by the number of genes for each category in parentheses), and the most significantly altered transcripts shown on the right. Right panels: Gene names are indicated on the left and fold-change (FC) for Tet versus control and P -values are shown on the right. Black = control, blue = Tet, red = Tet + EGF. Numbers underneath the panel are mean RPKM (reads per kilobase per million mapped reads). Only the 30 most significant genes are shown. (C) Overlap between DEGs whose expression was increased or decreased by Tet and genes whose expression is altered by Ca2+-mediated keratinocyte differentiation (red = increased by calcium, blue = decreased). (D) Overlap between DEGs whose expression was increased or decreased by Tet and genes whose expression is altered by EGF treatment, EGFR overexpression or EGFR inhibitor (Tyrphostin or AG1478) treatment (red = increased by treatment or EGFR overexpression, blue = decreased).
Genes whose expression was up-regulated by Tet and not normalized by EGF were enriched for biological processes of homophilic cell adhesion (cadherins), nucleosome assembly (H2 histones), and immune response (C3, IFIT2, IFIT3) (Figure 2B). Genes whose expression was increased by Tet treatment and normalized by EGF were enriched for biological processes of organismal development and metabolism (Figure S2), whereas genes that were reduced by Tet treatment and normalized by EGF were enriched for processes of immune response and regulation of cell communication (Figure S3). Notably, the DEGs engendered by AREG silencing (up- or down-regulated, irrespective of normalization by EGF) overlapped significantly (P < 0.001 by Wilcoxon rank sum test, see Methods) with genes whose expression is altered in response to six hours of Ca2+-mediated keratinocyte differentiation (Figure 2C) and in response to EGFR inhibitor treatment (Figure 2D).
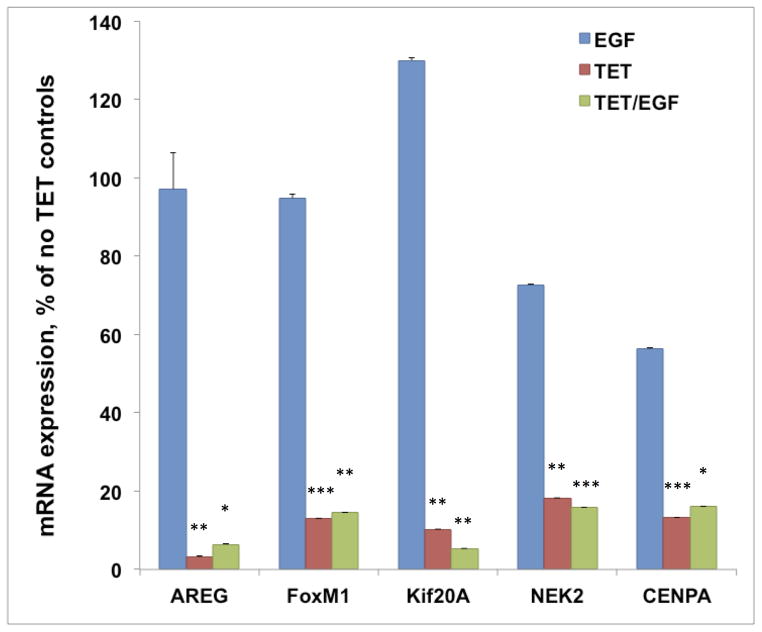
We confirmed the RNA-seq results for a subset of genes on the same samples by QRT-PCR using pre-validated TaqMan assays (Figure 3), revealing excellent agreement with the RNA-seq results shown in Figure 2. These QRT-PCR data also confirm the lack of normalization for these genes by exogenous EGF.
Figure 3. Exogenous EGF does not restore expression of FoxM1 and its target genes in response to AREG silencing.
N/TERT-TR-shAREG cells were incubated in the presence or absence of Tet with and without 20 ng/ml EGF for 60 h. Gene expression was analyzed by QRT-PCR of total RNA with TaqMan assays for genes indicated in the figure. Data are expressed as percent of untreated controls, mean +/− SEM. Pairwise comparison of the three treatments compared to control showed nominally significant differences (* = P <0.05, ** = P <0.005 and *** = P <0.0005) for all five genes for Tet (n=4) and for TET/EGF (n=3).
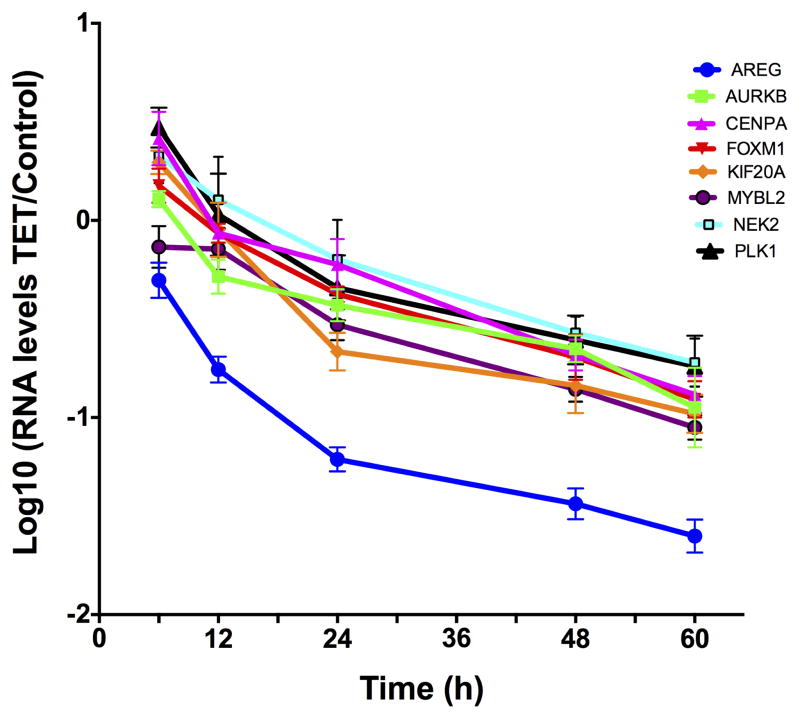
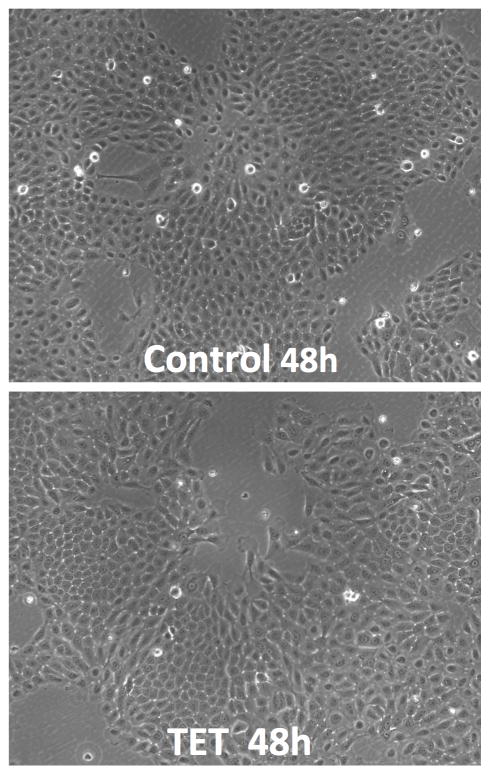
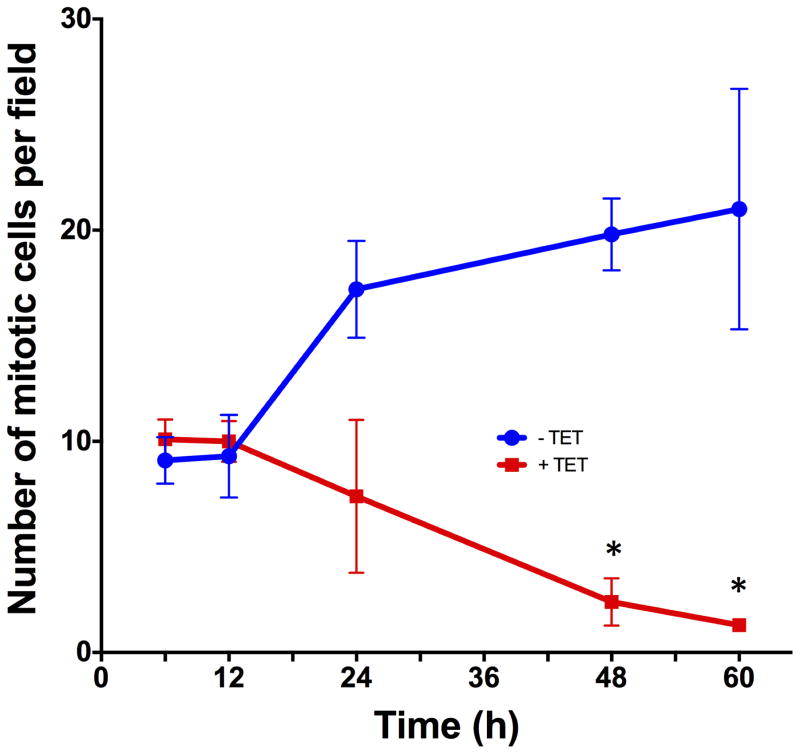
To determine the temporal relationship between AREG silencing, down-regulation of FOXM1 and its targets, and the cellular response, we performed time course experiments in the presence or absence of Tet. As depicted in Figure 4, AREG mRNA was reduced by more than 80% after 12 hours of Tet treatment, preceding the reduction of FOXM1 and target gene expression by 12 to 24 hours. Averaging over all eight genes, mRNA levels showed a significant decreasing linear trend with increasing time of Tet treatment (corrected P = 0.025), accounting for 88% of the total variation in RNA levels. Reduction in AREG RNA levels was greater than that of the other seven assayed genes at all times; this difference averaged across time is nominally significant for all seven genes (P ≤ 0.0044) and significant after correction for multiple testing (P ≤ 0.040) for four of them (FOXM1, KIF20A, NEK2, PLK1). Expression of all tested genes was reduced by more than 75% after 48 h of treatment without any noticeable changes in keratinocyte morphology (Figure 4B). However, we found a significant reduction in mitotic cell counts starting at 48 hours of treatment, lagging the reduction in expression of FOXM1 and its target genes (Figure 4C).
Figure 4. Down-regulation of FoxM1 and its target genes precedes reduction in mitotic cell counts after AREG silencing.
N/TERT-TR-shAREG cells were incubated for various times in the presence or absence of Tet. (A) Gene expression was analyzed by QRT-PCR with TaqMan assays as indicated. Data are expressed for each combination of time and gene as the log-transformed ratio of mean (n = 4) RNA levels for Tet treatment and untreated controls; error bars are within-subject standard error by the Cousineau-Morley method. (B) Representative photos of keratinocytes incubated for 48h in the presence or absence of Tet. (C) Mitotic cell counts of representative fields at various times of treatment. Data are mean +/− SEM (n=3) differences in counts for Tet treated and untreated cells are nominally significant at 48h (P =0.032) and 60h (P =0.031).
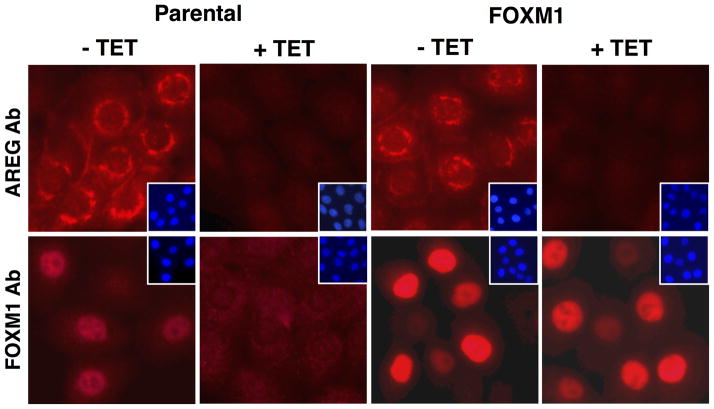
Because FoxM1 is known to regulate many genes whose products are involved in the G2/M transition and mitosis,35 we asked whether overexpression of FoxM1 could rescue keratinocyte growth and FoxM1 target gene expression in response to AREG silencing. To this end, we transduced the parental AREG knockdown cell line with a constitutively-expressed lentiviral expression construct encoding FoxM1 (FoxM1-rescue cells). After antibiotic selection, we compared expression of AREG and FoxM1 proteins in FoxM1-rescue cells to the parental cells. As shown by Western blotting (Figure 5A) and immunofluorescence (Figure 5B), the localization of AREG protein expression and the reduction of AREG levels in response to Tet treatment was very similar in both cell lines. AREG immunoreactivity was primarily localized in the perinuclear area and on the cell membrane and was strongly reduced by Tet treatment. FoxM1 protein was detected in nuclear and cytoplasmic extracts by Western blotting (Figure 5A), but appeared to be concentrated in the nucleus as assessed by immunostaining (Figure 5B). As assessed by both techniques, Tet-induced AREG silencing abolished FoxM1 protein expression in the parental cell line. FoxM1 protein expression was increased in FoxM1-rescue cells compared to parental cells (Figure 5 A and B), as was FoxM1 mRNA (~ 3-fold vs. parental cells, data not shown). Interestingly, Tet-induced AREG silencing reduced FoxM1 protein levels even in FoxM1-rescue cells, by more than 50% in the nuclear fraction (Figure 5A). Quantitation revealed that this reduction was due to a marked decrease in the proportion of cells with strong nuclear FoxM1 staining (23% vs 13% after 48 hours of Tet treatment, Figure 5C).
Figure 5. Constitutive expression of FoxM1 preserves nuclear and cytoplasmic FoxM1 protein in response to AREG silencing.
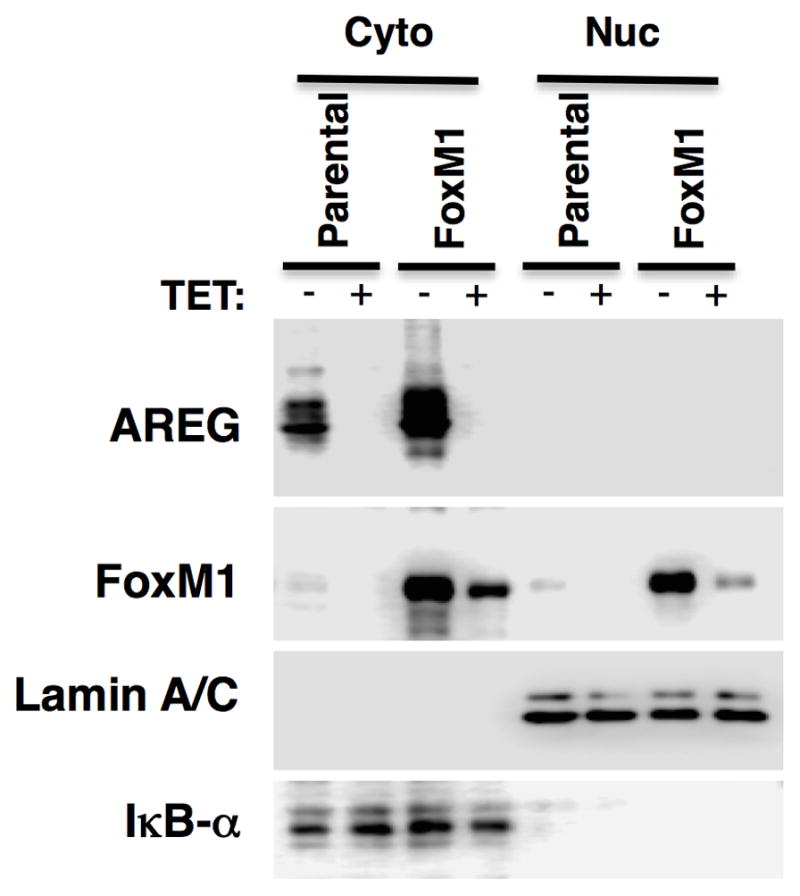
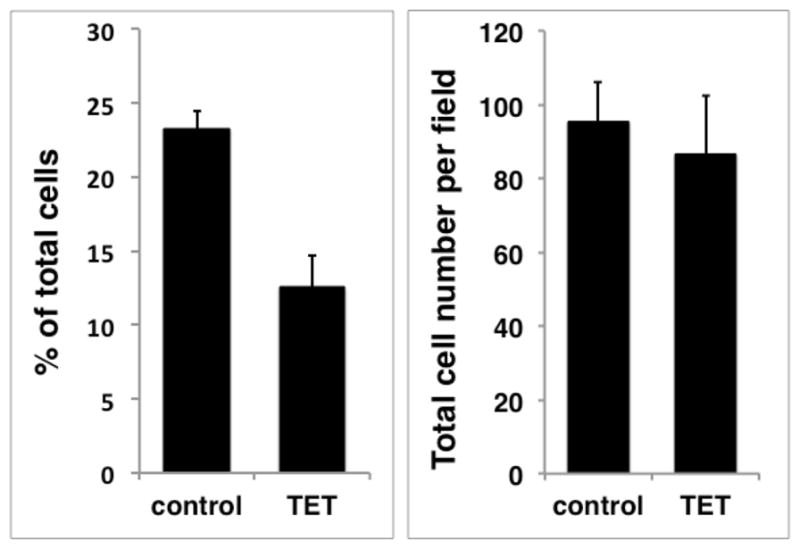
N/TERT-TR-shAREG keratinocytes (parental) and N/TERT-TR-shAREG keratinocytes stably infected with a constitutive FoxM1 expression construct (FoxM1-rescue cells) were cultured in KSFM medium in the presence or absence of Tet. (A) Western blots with cytoplasmic (Cyto) and nuclear (Nuc) extracts from parental and FoxM1 cells incubated for 60 h with and without Tet. Lamin A/C85 and Ikappa-B-alpha (IκB-α)86 were used as nuclear and cytoplasmic markers, respectively. (B) Immunofluorescence staining of cells incubated with and without Tet for 48 h. Insets represent DAPI staining of the same fields. Identical exposure times were used for each antibody staining and paired treatment (+/− Tet) within each cell line. (C) Quantitation of nuclear FoxM1 staining. Only cells expressing high levels of FoxM1 were scored (see Materials and Methods). Data are expressed as (left panel) percentage of strongly FoxM1-positive cells per microscopic field (10X objective, 100X final magnification); and (right panel) total cell numbers per field. Data shown represent mean and range of two experiments.
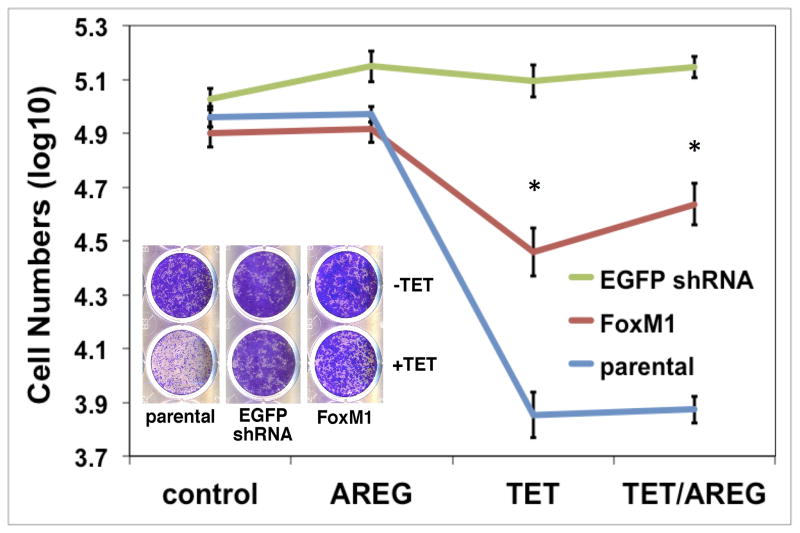
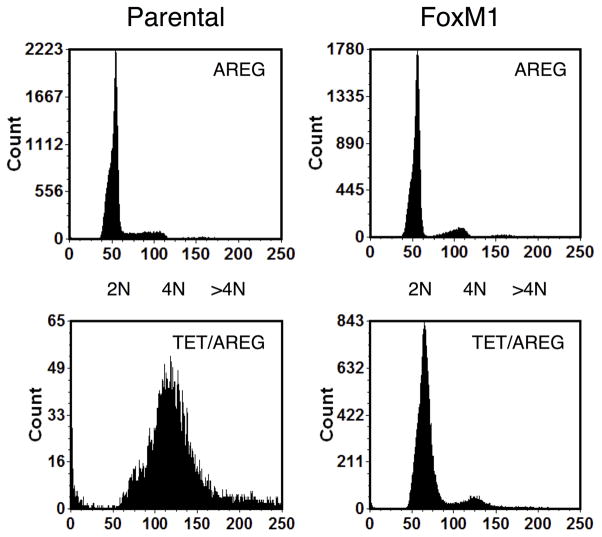
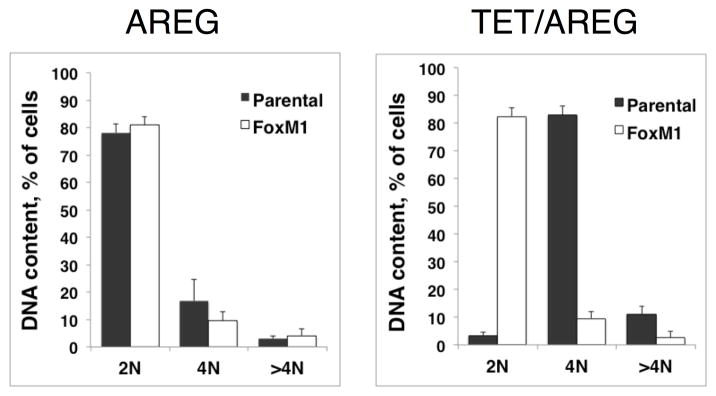
Next, we used the FoxM1-rescue cells in autocrine keratinocyte growth assays and compared them to parental cells as well a control cell line with Tet-inducible expression of an shRNA targeting enhanced green fluorescent protein (EGFP). In this series of experiments, and as observed previously,9 shRNA-mediated AREG knockdown led to a >90% reduction in keratinocyte cell number in parental cells, whether in the presence or absence of 100 ng/ml rhAREG (P =0.00012 and P =0.0096, respectively, Figure 6A). Indicative of FoxM1 rescue of the growth-inhibitory effects of Tet in this system, the growth of FoxM1-rescue cells was significantly greater than that of parental cells after AREG silencing, whether in the presence (P = 0.004) or in the absence (P = 0.029) of exogenous AREG (Figure 6A). As shown in Figure 6B, flow cytometric analysis of DAPI-stained keratinocytes revealed that FoxM1 expression markedly reduced the accumulation of cells with ≥ 4n DNA content in AREG-silenced cells (a representative example is shown in Figure 6B, and all experiments are quantitated in Figure 6C). Very similar results were observed in the presence or absence of added AREG (Figure S4). In contrast, Tet-induced expression of a non-targeting shRNA against EGFP had no effect on cell numbers (Figure 6A) and cell cycle distribution (Figure S5), ruling out nonspecific effects of Tet on keratinocyte proliferation.
Figure 6. FoxM1 expression normalizes keratinocyte responses to cellular changes induced by AREG silencing.
N/TERT-TR-shAREG keratinocytes (parental), control keratinocytes with a Tet-inducible shRNA targeting EGFP (EGFP shRNA) and N/TERT-TR-shAREG keratinocytes stably infected with a constitutive FoxM1 expression construct (FoxM1) were subjected to six day growth assays in the presence or absence of 1 μg/ml Tet with and without 100 ng/ml recombinant human AREG. (A) Cell numbers were assessed by flow cytometry based cell counting with fluorescent reference beads. Data are expressed as log(10) of total cell numbers for the four different treatments that are indicated underneath the x-axes. Data represent keratinocyte cell numbers per cm2 of growth area, and represent mean +/− within-subject SE computed by the Cousineau-Morley method, n=4 for the parental and FoxM1 cell lines, n=3 for EGFP shRNA cell line, with three biological replicates per “n”. The inset shows a crystal violet staining of a typical result. Significant pairwise contrasts (mean ratio; corrected P): Tet treatment: FoxM1 vs. parental (4.0; 0.029), EGFP shRNA vs. parental (17.4; 0.00096), EGFP shRNA vs. FoxM1 (4.3; 0.027); Tet/AREG treatment: FoxM1 vs. parental (5.8; 0.0040), EGFP shRNA vs. parental (18.8; 0.00012), EGFP shRNA vs. FoxM1 (3.2; 0.032). (B) Cell cycle distribution of DAPI-stained keratinocytes at the end of six-day growth assays. (C) Quantitation of cell cycle distributions for all experiments. Data are expressed as % of cells with 2N, 4N or > 4N DNA content, mean +/− standard deviation, n=4.
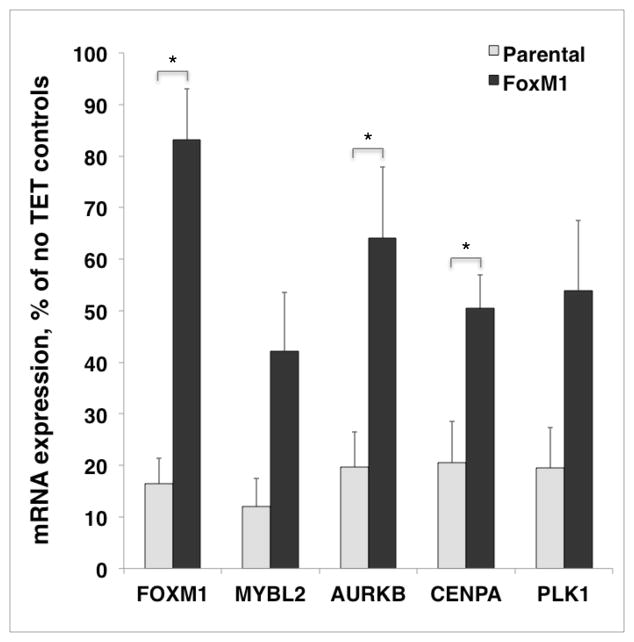
To determine whether expression of FoxM1 in AREG knockdown cells restores cell cycle-related gene expression, we performed QRT-PCR for a FoxM1 and a subset of its target genes. As shown in Figure 7, FoxM1 target gene expression was normalized after constitutive expression of FoxM1 in AREG knockdown cells.
Figure 7. Constitutive expression of FoxM1 in AREG knockdown cells overcomes reduced FoxM1 target gene expression after AREG silencing.
Parental and FoxM1 expressing N/TERT keratinocytes were grown to 40% confluence and incubated for 48h under autocrine conditions in the presence or absence of tetracycline (Tet). Gene expression in total RNA was analyzed by quantitative real-time PCR with TaqMan gene expression assays (Applied Biosystems) for FOXM1, MYBL2, AURKB, CENPA and PLK1. Data were normalized to the housekeeping gene RPLP0 and are expressed for each gene and cell line as percent of untreated controls (no Tet). Data are mean +/− SEM, n=3 with two to three biological replicates per “n”. Asterisks denote genes for which control-normalized mRNA expression in the Tet-treated FoxM1 cells is significantly greater than that in the parental cell line (nominal P <0.05).
DISCUSSION
Some but not all effects of AREG silencing can be reversed by EGFR ligands
Recently, we reported that AREG silencing profoundly inhibits keratinocyte proliferation in a way that could not be reversed by addition of exogenous AREG or other EGF ligands,9 arguing that AREG participates in the regulation of proliferation in a manner that is separate from the traditionally-accepted role of binding of its extracellular domain to the EGF receptor. Similarly, in this study, we also found many DEGs whose expression could not be normalized by exogenous EGF, a result that would not be expected if soluble EGFR ligands were able to compensate completely for the lack of proAREG. We did however find many genes whose expression was normalized by rhEGF (Figures S2 and S3), demonstrating that that there are many robust cellular responses to soluble EGFR ligands. In this regard, we have previously shown that soluble EGF and AREG are capable of reversing the effects of AREG silencing on extracellular-regulated kinase (ERK) phosphorylation, but not on growth inhibition.9
Effects of AREG silencing on cell cycle progression
We found that many genes whose expression is down-regulated by AREG silencing and not normalized by EGF are involved in the regulation of the cell cycle, notably with respect to mitosis, nuclear division, and cell division (Figure 2A). Many of these genes encode proteins known to be important for G2/M cell cycle progression and/or cytokinesis,36 a finding consonant with the appearance of many binucleated keratinocytes with ≥4n DNA content in AREG knockdown cells (Figure 1D). Notably, many of these genes feature upstream binding sites recognized by FoxM1, including KIF20A,40 CDC25C,41 AURKA,42 AURKB,43 CENPA, CENPF, NEK2, and PLK135 (Figures 2A and S1). FoxM1 is a winged helix transcription factor that regulates numerous genes whose products function during G2/M and cytokinesis.35,36 It also regulates molecular events related to cell proliferation at other stages of the cell cycle.44 FoxM1 is overexpressed in hepatocellular, breast, head and neck, cervical and basal cell carcinomas45–47 and has been functionally implicated in cancer progression and metastasis.44,48,49 Due to these properties, FoxM1 is currently attracting substantial interest as a potential target in cancer diagnosis and therapy.50
The MYBL2 gene encoding B-Myb was also one of the most prominently down-regulated transcripts whose expression could not be normalized by EGF (Figure 2A). This would be consistent with recent studies showing recruitment of FoxM1 and B-Myb to a multiprotein complex known as MuvB, which promotes mitotic gene expression during the G2/M phase of the cell cycle.38,39 Members of the E2F transcription factor family also play key roles during G1/S transition and S-phase, as E2F1 target genes encode proteins that are important for DNA synthesis and chromosomal replication.51 Because AREG halts cell cycle progression at G2/M, its silencing also blocks the transition of keratinocytes to G1/S, thereby accounting for the strong enrichment for E2F binding sites we observed in our TF binding site analysis of genes irreversibly down-regulated by AREG silencing (Figure S1).
N/TERT-2G keratinocytes are defective in p16INK4 (CDKN2A) signaling52 and our RNA-seq data confirm that this gene is not expressed in N/TERT-2G-derived AREG knockdown cells in the presence or absence of Tet (data not shown). p16INK4 inhibits cyclin-dependent kinases 4 and 6, preventing phosphorylation of retinoblastoma 1 and inhibiting progression from G1 to S-phase in the context of cellular senescence.53 p16INK4 signaling is also frequently impaired in cancers.54 Given that AREG silencing stops the growth of N/TERT keratinocytes despite their defect in p16INK4 signaling, our data suggest that the requirement for proAREG for G2/M transition and/or cytokinesis may provide a novel target for epithelially-derived tumors in which the p16INK4 -related senescence checkpoint has been lost.
It could be argued that the significant reduction in mitotic gene expression is simply an effect of, rather than the cause of, AREG shRNA-induced growth arrest. However, our time course experiments show that down-regulation of FoxM1 and several of its target genes follows the reduction of AREG transcripts (Figure 4A) and precedes the reduction in mitotic keratinocytes (Figure 4C). Even more important, we show that overexpression of FoxM1 in AREG knockdown cells significantly rescues keratinocyte proliferation (Figure 6A), normalizes cell cycle parameters (Figure 6B and C), and restores the expression of FoxM1-dependent genes (Figure 7). While the molecular details remain to be elucidated, these findings support the hypothesis that AREG regulates keratinocyte proliferation and G2/M transition via a FoxM1-dependent transcriptional program.
Apart from transcriptional regulation, FoxM1 protein activity is regulated at many levels, including RNA stability, translation, protein stability, and post-translational modification.38,55,56 FoxM1 protein is hardly detectable in quiescent cells and increases in the late G1 phase of the cell cycle, reaching maximal levels in G2/M before returning to low levels after completion of cytokinesis.35,56,57 Loss of FoxM1 expression in this context appears to be due to its degradation at mitotic exit in a Cdh1(FZR1/CDC20C)-dependent manner.56 In FoxM1-rescue cells, which expressed considerably higher levels of FoxM1 protein (Figure 5) and threefold more mRNA (data not shown) than their parental counterparts, we observed a marked decrease in FoxM1 protein after AREG silencing, whose magnitude (> 50% in the nuclear fraction) was much greater than the Tet-induced reduction in FoxM1 mRNA (~17%, Figure 7) after 48 hours of Tet treatment. This decrease also exceeded what would have been expected due to the reduction of endogenous FoxM1 expression in parental cells (Figure 5A). We found that this was due to a decrease in the percentage of strongly FoxM1-positive nuclei, rather than a homogeneous reduction in the amount of FoxM1 per cell (Figure 5C). While the mechanistic basis for these observations remains to be determined, these data are strongly suggestive of a functional interaction between AREG and FoxM1 in the context of cell cycle regulation, potentially involving a role for AREG in maintaining FoxM1 protein stability.
Effects of AREG silencing on keratinocyte differentiation
FoxM1 expression is high in actively proliferating cells and low in terminally differentiated tissues.58 Moreover, we and others have found that AREG depletion can induce multiple markers of epithelial differentiation.9,25 Consistent with these observations, genes whose expression was up-regulated by Tet-induced AREG silencing and not normalized by EGF were strongly enriched for biological processes related to differentiation (Figure 2B). Keratinocyte differentiation is strongly influenced by extracellular calcium concentration59 and inhibition of EGFR tyrosine kinase activity60 and we found a significant overlap between DEGs in AREG-silenced keratinocytes and genes involved in calcium-mediated keratinocyte differentiation (Figure 2C) as well as genes whose expression is altered by inhibition of EGFR tyrosine kinase activity (Figure 2D). Indeed, over 90% of the experiments manifesting significant overlap with DEGs engendered by AREG silencing involved experimental manipulations resulting in growth inhibition and/or promotion of differentiation, including inhibition of signal transduction mechanisms such as ERK and p38 known to be tightly coupled to EGFR in keratinocytes; silencing of genes known to block differentiation of keratinocytes or overexpression of genes known to inhibit differentiation of keratinocytes; treatment with growth-inhibitory cytokines; and treatments such as mitomycin C and irradiation that are known to be toxic to keratinocytes (data not shown). As discussed earlier for other keratinocyte responses to soluble EGFR ligands9 (Figures S2 and S3), it is notable that exogenous rhAREG profoundly increases the size of flattened, differentiated keratinocytes after AREG silencing, despite being unable to overcome mitotic blockade (Figure 1B).
Loss of FoxM1 expression leads to profound cell cycle defects, with cells that enter mitosis but fail to complete cell division, resulting in mitotic catastrophe and/or endoreplication.61,62 Overexpression of FoxM1 can restore mitotic spindle integrity.63 In this regard, it is notable that mitotic blockage has also been implicated in the process of keratinocyte differentiation. Thus, keratinocytes continue to replicate their DNA without equivalent execution of cell division as they differentiate, resulting in the production of large cells with increased DNA content as cells progress through the suprabasal layers.2,64,65 In addition, the inhibition of mitotic kinases such as CDK1, Aurora kinase B, or PLK1 triggers polyploidization and differentiation of primary keratinocytes.64,65 These published results are very consistent with our findings that in addition to producing binucleated cells with ≥4n DNA content (Figure 1), AREG silencing leads to the accumulation of flattened keratinocytes that are strongly engaged in terminal differentiation (Figure 2). Whether the effects of AREG silencing on keratinocyte differentiation formally depend on the integrity of nuclear content requires further investigation.
Summary and model
In summary, our data show that AREG controls cell division in keratinocytes via activation of a FoxM1-dependent transcriptional program and, that FoxM1 expression can rescue the G2/M-arrested state of AREG knockdown cells. Moreover, AREG silencing also promotes keratinocyte differentiation, in a manner that may be dependent upon the induction of genomic instability due to loss of FoxM1. As shown here and elsewhere,9 keratinocyte growth arrest after AREG silencing cannot be rescued by exogenous EGFR ligands. Moreover, we have recently shown that a construct expressing the transmembrane and cytoplasmic domains of AREG can rescue keratinocyte growth arrest after AREG silencing.66 At the same time, several lines of evidence indicate that soluble, shed AREG (or other EGFR ligands) can profoundly influence keratinocyte differentiation (Figures 1B and 2C).
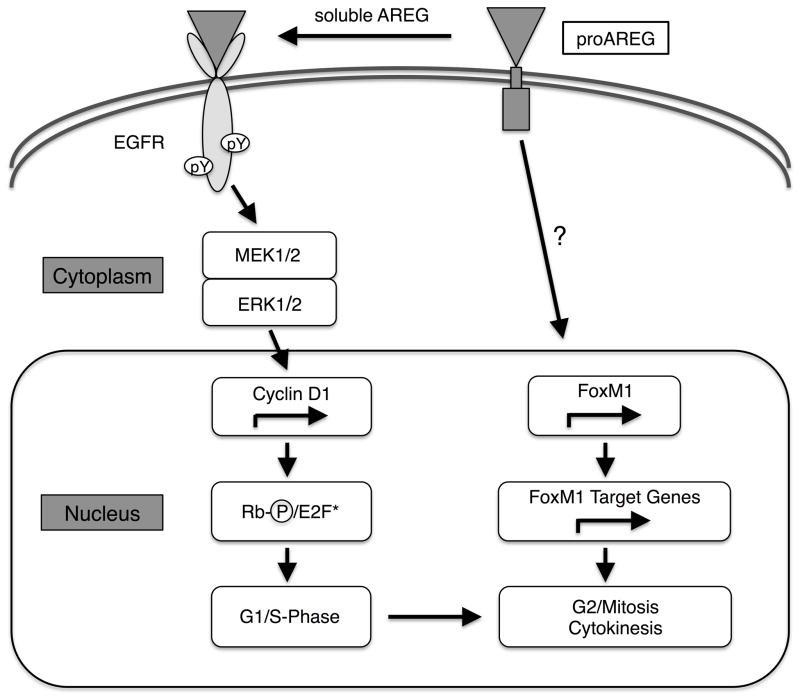
Based on these observations, we propose a model by which traditional EGFR signaling activated by soluble ligands promotes ERK signaling eventuating in cyclin D1 phosphorylation of Rb, resulting in activation of E2F family transcription factors and progression to S phase, while the cytoplasmic domain of AREG may support a FoxM1-dependent program necessary for G2/M transition and cytokinesis (Figure 8). Loss of AREG expression is envisioned to trigger keratinocyte differentiation, possibly due to loss of genomic integrity, even though soluble EGFR ligands from a variety of sources may support keratinocyte differentiation once this program has been initiated. If confirmed, this model may provide new strategies for halting the growth of epithelial cancer cells by promoting their differentiation, especially in tumours that have overcome G1/S arrest checkpoints and/or are resistant to current anti-EGFR therapies.
Figure 8. Model for bimodal regulation of epithelial cell proliferation by AREG.
Proteolytic cleavage of the membrane-bound AREG precursor (proAREG) results in the release of soluble AREG that binds and activates EGFR ultimately promoting G1/S progression via pathways that involve classical MEK/ERK signaling, cyclin D1 phosphorylation of Rb and activation of E2F family transcription factors. A second, as yet not completely characterized intracellular pathway, possibly involving the proAREG cytoplasmic domain, supports a separate FoxM1-dependent program necessary for G2/M transition and cytokinesis.
MATERIALS AND METHODS
Reagents
rhAREG and rhEGF were obtained from R&D Systems (Minneapolis, MN) and Peprotech (Rocky Hill, NJ), respectively. Rabbit polyclonal AREG antibodies were obtained from Proteintech (# 16036-1-AP, Chicago, IL) and FoxM1 (# sc-502) and Lamin A/C (# sc-7292) antibodies were from Santa Cruz Biotechnology (Santa Cruz, CA). IkappaB-alpha (IκB-α, # 9242) was purchased from Cell Signaling Technology (Beverly, MA). Blasticidin, zeocin, puromycin, geneticin and lipofectamine 2000 were from Invitrogen (Carlsbad, CA). All other chemicals were obtained from Sigma (St. Louis, MO).
Cell lines and culture conditions
All keratinocyte cell lines in this study were derived from the immortalized but non-transformed keratinocyte line N/TERT-2G52 by stable transfection with lentiviral expression constructs (see below). N/TERT-TR-shAREG and N/TERT-TR-shEGFP, two cell lines with tetracycline-inducible expression of small hairpin RNA (shRNA) targeting AREG and EGFP, respectively, have been previously described9 and were grown in keratinocyte serum-free medium (KFSM, Invitrogen) with 0.4 mM CaCl2 in the presence of zeocin and blasticidin.9 Human embryonic kidney cells (293FT, Invitrogen) were cultured in Dulbecco’s Modified Eagle medium (DMEM, Invitrogen) supplemented with 10% fetal bovine serum (FBS, Invitrogen) and 500 μg/ml geneticin.
Library construction and RNA-seq
Total RNA was isolated from subconfluent N/TERT-TR-shAREG keratinocytes treated for 60 hours with and without 1 μg/ml Tet with and without 20 ng/ml EGF (Qiagen RNeasy Minikits, Valencia, CA) and RNA quality and quantity were assessed using an Agilent Bioanalyzer. Complementary DNA libraries were prepared from polyadenylated RNA, and libraries for high throughput sequencing were prepared using the Illumina mRNA-Seq kit according to the manufacturer’s protocol (Illumina, San Diego, CA). Libraries were sequenced one sample per lane in an 8-lane flow cell on the Illumina Genome Analyzer IIx. Sequence reads were aligned to the reference genome (NCBI build 37) using Bowtie and splice junctions were identified using Tophat.67,68 Expression values were expressed as the number of reads per kilobase per million mapped reads (RPKM). One sample per sequencing lane sequencing generated on average 31 million reads, resulting in approximately 2.4 gigabases per sample. RNA-seq data has been deposited to Gene Expression Omnibus (GEO); accession # to be announced.
Analysis of differentially expressed genes
Differential expression analyses were performed using edgeR with dispersions estimated using the Cox-Reid method.69 To control the FDR, raw p-values from this analysis were adjusted using the Benjamini-Hochberg method,70 and genes were identified as differentially expressed in response to AREG silencing based upon a fold-change (FC) threshold of 2 (FC > 2 or < 0.5) between Tet-treated and untreated cells, with an FDR-adjusted P-value of 0.05. We defined DEGs whose expression was not normalized by EGF as those with two-fold-altered expression in both Tet-treated and Tet + EGF-treated cells (FDR < 0.05; relative to control). DEGs for which expression normalized following EGF addition were excluded from this set (P < 0.05; Tet versus Tet + EGF). Conversely, we defined DEGs whose expression was normalized by EGF as those altered two-fold in Tet-treated cells (FDR < 0.05; relative to control), with expression subsequently altered two-fold in the direction of control cells following addition of EGF (FDR < 0.05; Tet versus Tet + EGF). DEGs for which expression had not completely normalized were excluded from this set (P < 0.05; control versus Tet + EGF).
Functional annotation of transcriptome data
Functional annotation was performed using Gene Ontology,71 KEGG,72 and Reactome.73 Significantly enriched gene ontology and KEGG pathway terms were identified using the conditional hypergeometric test implemented in the GOstats package (function: hyperGTest).37 Enriched Reactome pathways were identified using the R ReactomePA package (function: enrichPathway).74 To identify transcription factor binding sites enriched in 1 kb sequences upstream of differentially expressed genes, we used semiparametric generalized additive logistic models (GAM).75 For all human genes, we scanned upstream regions for matches to a set of 1937 position weight matrix (PWM) motifs, which represent the empirically-determined binding affinities of known human transcription factors and unconventional DNA-binding proteins. Methods used to aggregate and filter the complete set of 1937 motifs have been described previously.76 Likewise, methods used to detect PWM-DNA matches have been described.69,76 After we identified PWM-DNA motif matches, GAM models were used to identify those motifs significantly enriched in 1 kb upstream regions of differentially expressed genes.75 To control the FDR for all 1937 motifs included in our analysis, raw p-values generated from GAM models were adjusted using the Benjamini-Hochberg method.70 The specific FoxM1 motif (consensus: 5-TGCAAA/TTTGCA-3) identified as significantly enriched in sequences upstream of TET-decreased genes (not normalized by EGF) was generated using a protein microarray assay and was obtained from the human protein-DNA interaction database (hPDI).77
Significance of overlap of DEGs with datasets involving treatment of keratinocytes with calcium and EGFR inhibitors was determined from a Wilcoxon rank sum test comparing DEGs to non-DEGs. Differential expression patterns in each experiment were quantified using signed log10-transformed p-values, with positive values indicating increased expression and negative values indicating decreased expression. The rank sum test was then used to compare log10-transformed p-values between DEGs and non-DEGs. As a final step, a Benjamini-Hochberg p-value correction is applied to generated FDR-correct p-values, accounting for the fact that the analyses was repeated with respect to many different experiments.78
Lentivirus-mediated gene expression
Complementary DNAs encoding FoxM1 were cloned into the lentiviral expression vectors pLVX-aAcGFP-N1 (Clontech, Mountain View, CA) and used for lentivirus production in 293FT cells as previously described.9 Stably transduced keratinocyte cell lines with constitutive expression of these constructs were generated by infecting the inducible AREG knockdown cell line N/TERT-TR-shAREG followed by antibiotic selection with 10 μg/ml puromycin as previously described.9
QRT-PCR assays
Total RNA from keratinocytes was isolated (RNeasy Mini Kits, Qiagen, Valencia, CA), reversed transcribed using the ABI High Capacity cDNA Reverse Transcription Kit (Applied Biosystems, Foster City, CA) and transcripts were quantified with predesigned TaqMan gene expression assays (Applied Biosystems). Data are expressed as fold-change relative to the housekeeping gene large ribosomal protein, P0 (RPLP0) (fold-change versus RPLP0 = 2 −(CT target -CT RPLP0) multiplied by 102) or expressed as percent of untreated controls (no Tet control). The following predesigned TaqMan gene expression assays from Applied Biosystems were used in this study: AREG (Hs00158832_m1) and (Hs00950668_m1), FOXM1 (Hs01073586_m1), (AURKB Hs00177782_m1), CENPA (Hs00903938), KIF20A (Hs00993573_m1), PLK1 (Hs00153444_m1), MYBL2 (Hs00942543_m1), and RPLP0 (Hs9999902_m1).
Keratinocyte growth assays
Keratinocytes were plated in six well plates at 1,000 cells/cm2 in complete KSFM medium and allowed to grow for approximately two days until they had formed colonies containing 4–8 cells. The cells were then cultured for six days in basal KSFM (without added EGF or bovine pituitary extract) in the presence or absence of Tet (1 μg/ml) with and without AREG (100 ng/ml). At the end of the growth assay, keratinocyte cultures were either stained with crystal violet and photographed or analyzed by flow cytometry as described below.
CFSE labeling
Subconfluent keratinocytes were trypsinized, centrifuged for 6 min at 200 x g, washed with phosphate-buffered saline (PBS) and then incubated with CFSE for 5 min on ice. The cells were washed repeatedly and resuspended in KFSM, counted and plated at 1,000 cells/cm2 as described in “keratinocyte cell growth assays” above. Aliquots of the CFSE-labeled cells at the time of plating were fixed and processed as described in flow cytometry analysis as described below.
Flow cytometry
Keratinocytes were dislodged by trypsinization and concentrated by centrifugation for 6 minutes at 400 x g. After removal of the supernatants, cells were resuspended in PBS and fixed by addition of 4.5 volumes of 75% ethanol at 4°C. After an additional centrifugation step as above, cells were washed with PBS and resuspended in PBS containing 0.1% Triton X-100 and 1μg/ml of 4′,6-diamidino-2-phenylindole (DAPI). After addition of equal numbers of 7.7 μm Sphero AccuCount Fluorescent Particles (Spherotech, Lake Forest, IL) to each of the cell suspensions, keratinocytes were analyzed for cell number and cell cycle distribution using an LSR2 flow cytometer (BD Bioscience, Franklin Lakes, NJ).
Immunofluorescence
Parental and FoxM1 cells were plated on sterile coverslips at 5,000 cells/cm2 and cultured in KSFM until approximately 20% confluent, followed by incubation in the presence or absence of Tet for 48h. After two washes in phosphate buffered saline (PBS), cells were fixed in 4% paraformaldehyde and permeabilized by incubation in 0.5% Triton X-100/0.1 % sodium citrate for 5 minutes at RT. Pre-blocking was done by incubation in PBS/5% goat serum for one hour at room temperature. AREG and FoxM1 were visualized by staining with anti-AREG antibodies (Proteintech) and anti-FoxM1 antibodies (Santa Cruz) respectively, followed by incubation with biotinylated secondary goat anti-rabbit IgG antibodies (Vector Laboratories, Burlingame, CA) and streptavidin-Alexa Fluor 594 conjugate (Invitrogen). Images were captured using an Axioskop fluorescence microscope (Carl Zeiss, Jena, Germany) equipped with 1.4 megapixel Jenoptic ProgRes CFCool camera (Jenoptics, Jena, Germany). For quantitation of cells with strong nuclear FoxM1 staining, random microscopic fields were taken with equal exposure times at 100 x magnification. For this analysis, only those nuclei were counted that manifested bright fluorescence, with the cutoff defined by nuclei which remained visible after electronically reducing image intensity by 50%.
Western Blotting
Parental and FoxM1 cells were grown in keratinocyte serum-free medium to 20% confluence, followed by incubation in the presence or absence of 1 μg/ml TET for 60 hours. Cells were washed with PBS, dislodged by trypsinization and pelleted by centrifugation (6 min at 500g). Cell pellets were in cytoplasmic extraction reagent 1 (NE-PER Nuclear and Cytoplasmic Extraction Reagents, Thermo Scientific, Rockford, IL) and processed for the isolation of nuclear and cytoplasmic proteins according to the manufacturer’s instructions. Equal amounts of total lysate (RIPA) or nuclear and cytoplasmic extracts were analyzed by western blotting as previously described.28 Chemiluminescence imaging was performed using a C-Digit Blot Scanner (LI-COR, Lincoln, NE).
Statistical analysis of cell culture experiments
Observations for outcome variables (cell counts and mRNA levels) were log10-transformed to normalize distributions and to ensure that tests for differences in logged means were equivalent to tests for nonzero logged ratios of the means. The latter effect was sought because ratios of assayed values were more consistent across experimental replications than their differences. To avoid pseudoreplication79,80 all transformed measurements from technical and cell well replicates of an experimental unit were averaged before analysis. Because cell culture experiments were designed to study two or three factors simultaneously, two-way and three-way mixed-design or repeated measures ANOVA was used to test for main effects of factors, interactions among factors, and trends and pairwise contrasts among levels of a factor, following standard guidelines (cf. Figures 7.2 and 8.6 of Maxwell and Delaney).81 Lentiviral expression construct was treated as a between-subjects factor; all other independent variables (cell culture treatment, gene, time) were treated as within-subject factors. Unadjusted F-tests were used for omnibus testing of equality of the means for the between-subjects construct factor, followed when appropriate by Dunnett’s T3 post hoc test for all pairwise contrasts, which does not assume homogeneity of variance. The Greenhouse-Geisser epsilon-adjusted univariate test, which is robust to heterogeneity of pairwise treatment differences, was used for omnibus tests involving within-subject factors; post hoc pairwise comparisons of all within-subject factor levels were carried out using Bonferroni-corrected paired t-tests. For time, trend tests (linear, quadratic, and cubic) were performed, since the levels of this within-subjects factor are naturally ordered. Correction of p-values for multiple testing was implemented to control the familywise error rate at α = 0.05 for each type of major effect (main and interaction) in each ANOVA; all reported p-values are two-sided. As designated in the figures, error bars are either ordinary SEM or within-subject standard errors computed by Morey’s correction82 of Cousineau’s alternative83 to the method of Loftus and Masson.84
Supplementary Material
Acknowledgments
We thank Mahdu Prasad for assistance with RNA-seq assays and Dr. James Rheinwald (Harvard Medical School, Boston, MA) for providing the N/TERT-2G keratinocyte cell line. This work was in part supported by the National Institute for Arthritis, Musculoskeletal and Skin Disease (NIAMS), National Institutes of Health (NIH award K01 AR050462 and R03 AR049420 to SWS and R01 AR052889 to JTE). JTE is supported by the Ann Arbor Veterans Affairs Hospital.
Abbreviations used in this paper
- AREG
amphiregulin
- CFSE
carboxyfluorescein succinimidyl ester
- DEG
differentially expressed gene
- EGF
epidermal growth factor
- EGFP
enhanced green fluorescent protein
- EGFR
EGF receptor
- ERK
extracellular signal-regulated kinase
- FoxM1
forkhead box protein M1
- GF
growth factor
- HB-EGF
heparin-binding EGF-like growth factor
- QRT-PCR
quantitative real time polymerase chain reaction
- Tet
tetracycline
- TGF-α
transforming growth factor-α
Footnotes
CONFLICT OF INTEREST
The authors state no conflict of interest.
References
- 1.Blanpain C, Fuchs E. Epidermal homeostasis: a balancing act of stem cells in the skin. Nat Rev Mol Cell Biol. 2009;10:207–217. doi: 10.1038/nrm2636. [DOI] [PMC free article] [PubMed] [Google Scholar]
- 2.Gandarillas A, Freije A. Cycling up the epidermis: reconciling 100 years of debate. Exp Dermatol. 2014;23:87–91. doi: 10.1111/exd.12287. [DOI] [PubMed] [Google Scholar]
- 3.Murillas R, Larcher F, Conti CJ, Santos M, Ullrich A, Jorcano JL. Expression of a dominant negative mutant of epidermal growth factor receptor in the epidermis of transgenic mice elicits striking alterations in hair follicle development and skin structure. Embo J. 1995;14:5216–5223. doi: 10.1002/j.1460-2075.1995.tb00206.x. [DOI] [PMC free article] [PubMed] [Google Scholar]
- 4.Miettinen PJ, Berger JE, Meneses J, Phung Y, Pedersen RA, Werb Z, et al. Epithelial immaturity and multiorgan failure in mice lacking epidermal growth factor receptor. Nature. 1995;376:337–341. doi: 10.1038/376337a0. [DOI] [PubMed] [Google Scholar]
- 5.Sibilia M, Wagner EF. Strain-dependent epithelial defects in mice lacking the EGF receptor [published erratum appears in Science 1995 Aug 18;269(5226):909] Science. 1995;269:234–238. doi: 10.1126/science.7618085. [DOI] [PubMed] [Google Scholar]
- 6.Threadgill DW, Dlugosz AA, Hansen LA, Tennenbaum T, Lichti U, Yee D, et al. Targeted disruption of mouse EGF receptor: effect of genetic background on mutant phenotype. Science. 1995;269:230–234. doi: 10.1126/science.7618084. [DOI] [PubMed] [Google Scholar]
- 7.Stoll SW, Johnson JL, Bhasin A, Johnston A, Gudjonsson JE, Rittie L, et al. Metalloproteinase-mediated, context-dependent function of amphiregulin and HB-EGF in human keratinocytes and skin. The Journal of investigative dermatology. 2010;130:295–304. doi: 10.1038/jid.2009.211. [DOI] [PMC free article] [PubMed] [Google Scholar]
- 8.Kansra S, Stoll SW, Johnson JL, Elder JT. Src family kinase inhibitors block amphiregulin-mediated autocrine ErbB signaling in normal human keratinocytes. Mol Pharmacol. 2005;67:1145–1157. doi: 10.1124/mol.104.004689. [DOI] [PubMed] [Google Scholar]
- 9.Stoll SW, Johnson JL, Li Y, Rittie L, Elder JT. Amphiregulin carboxy-terminal domain is required for autocrine keratinocyte growth. The Journal of investigative dermatology. 2010;130:2031–2040. doi: 10.1038/jid.2010.98. [DOI] [PMC free article] [PubMed] [Google Scholar]
- 10.Boonstra J, De Laat SW, Ponec M. Epidermal growth factor receptor expression related to differentiation capacity in normal and transformed keratinocytes. Exp Cell Res. 1985;161:421–433. doi: 10.1016/0014-4827(85)90098-9. [DOI] [PubMed] [Google Scholar]
- 11.Poumay Y, Pittelkow MR. Cell density and culture factors regulate keratinocyte commitment to differentiation and expression of suprabasal K1/K10 keratins. The Journal of investigative dermatology. 1995;104:271–276. doi: 10.1111/1523-1747.ep12612810. [DOI] [PubMed] [Google Scholar]
- 12.Peus D, Hamacher L, Pittelkow MR. EGF-receptor tyrosine kinase inhibition induces keratinocyte growth arrest and terminal differentiation. The Journal of investigative dermatology. 1997;109:751–756. doi: 10.1111/1523-1747.ep12340759. [DOI] [PubMed] [Google Scholar]
- 13.Stoll SW, Benedict M, Mitra R, Hiniker A, Elder JT, Nuñez G. EGF receptor signaling inhibits keratinocyte apoptosis: evidence for mediation by Bcl-XL. Oncogene. 1998;16:1493–1499. doi: 10.1038/sj.onc.1201657. [DOI] [PubMed] [Google Scholar]
- 14.Jost M, Class R, Kari C, Jensen PJ, Rodeck U. A central role of Bcl-X(L) in the regulation of keratinocyte survival by autocrine EGFR ligands. The Journal of investigative dermatology. 1999;112:443–449. doi: 10.1046/j.1523-1747.1999.00543.x. [DOI] [PubMed] [Google Scholar]
- 15.Mascia F, Lam G, Keith C, Garber C, Steinberg SM, Kohn E, et al. Genetic ablation of epidermal EGFR reveals the dynamic origin of adverse effects of anti-EGFR therapy. Sci Transl Med. 2013;5:199ra110. doi: 10.1126/scitranslmed.3005773. [DOI] [PMC free article] [PubMed] [Google Scholar]
- 16.Lichtenberger BM, Gerber PA, Holcmann M, Buhren BA, Amberg N, Smolle V, et al. Epidermal EGFR controls cutaneous host defense and prevents inflammation. Sci Transl Med. 2013;5:199ra111. doi: 10.1126/scitranslmed.3005886. [DOI] [PubMed] [Google Scholar]
- 17.Johnston A, Gudjonsson JE, Aphale A, Guzman AM, Stoll SW, Elder JT. EGFR and IL-1 signaling synergistically promote keratinocyte antimicrobial defenses in a differentiation-dependent manner. The Journal of investigative dermatology. 2011;131:329–337. doi: 10.1038/jid.2010.313. [DOI] [PMC free article] [PubMed] [Google Scholar]
- 18.Yarden Y, Pines G. The ERBB network: at last, cancer therapy meets systems biology. Nat Rev Cancer. 2012;12:553–563. doi: 10.1038/nrc3309. [DOI] [PubMed] [Google Scholar]
- 19.Yoshida T, Zhang G, Haura EB. Targeting epidermal growth factor receptor: Central signaling kinase in lung cancer. Biochem Pharmacol. 2010 doi: 10.1016/j.bcp.2010.05.014. [DOI] [PubMed] [Google Scholar]
- 20.Jean GW, Shah SR. Epidermal growth factor receptor monoclonal antibodies for the treatment of metastatic colorectal cancer. Pharmacotherapy. 2008;28:742–754. doi: 10.1592/phco.28.6.742. [DOI] [PubMed] [Google Scholar]
- 21.Chen LF, Cohen EE, Grandis JR. New strategies in head and neck cancer: understanding resistance to epidermal growth factor receptor inhibitors. Clinical cancer research : an official journal of the American Association for Cancer Research. 2010;16:2489–2495. doi: 10.1158/1078-0432.CCR-09-2318. [DOI] [PMC free article] [PubMed] [Google Scholar]
- 22.Tebbutt N, Pedersen MW, Johns TG. Targeting the ERBB family in cancer: couples therapy. Nat Rev Cancer. 2013;13:663–673. doi: 10.1038/nrc3559. [DOI] [PubMed] [Google Scholar]
- 23.Sanderson MP, Dempsey PJ, Dunbar AJ. Control of ErbB signaling through metalloprotease mediated ectodomain shedding of EGF-like factors. Growth Factors. 2006;24:121–136. doi: 10.1080/08977190600634373. [DOI] [PubMed] [Google Scholar]
- 24.Rittie L, Kansra S, Stoll SW, Li Y, Gudjonsson JE, Shao Y, et al. Differential ErbB1 signaling in squamous cell versus basal cell carcinoma of the skin. Am J Pathol. 2007;170:2089–2099. doi: 10.2353/ajpath.2007.060537. [DOI] [PMC free article] [PubMed] [Google Scholar]
- 25.Robertson ED, Weir L, Romanowska M, Leigh IM, Panteleyev AA. ARNT controls the expression of epidermal differentiation genes through HDAC- and EGFR-dependent pathways. J Cell Sci. 2012;125:3320–3332. doi: 10.1242/jcs.095125. [DOI] [PubMed] [Google Scholar]
- 26.Sternlicht MD, Sunnarborg SW. The ADAM17-amphiregulin-EGFR axis in mammary development and cancer. J Mammary Gland Biol Neoplasia. 2008;13:181–194. doi: 10.1007/s10911-008-9084-6. [DOI] [PMC free article] [PubMed] [Google Scholar]
- 27.Qin L, Tamasi J, Raggatt L, Li X, Feyen JH, Lee DC, et al. Amphiregulin is a novel growth factor involved in normal bone development and in the cellular response to parathyroid hormone stimulation. J Biol Chem. 2005;280:3974–3981. doi: 10.1074/jbc.M409807200. [DOI] [PubMed] [Google Scholar]
- 28.Kansra S, Stoll SW, Johnson JL, Elder JT. Autocrine extracellular signal-regulated kinase (ERK) activation in normal human keratinocytes: metalloproteinase-mediated release of amphiregulin triggers signaling from ErbB1 to ERK. Mol Biol Cell. 2004;15:4299–4309. doi: 10.1091/mbc.E04-03-0233. [DOI] [PMC free article] [PubMed] [Google Scholar]
- 29.Schelfhout VR, Coene ED, Delaey B, Waeytens AA, De Rycke L, Deleu M, et al. The role of heregulin-alpha as a motility factor and amphiregulin as a growth factor in wound healing. J Pathol. 2002;198:523–533. doi: 10.1002/path.1240. [DOI] [PubMed] [Google Scholar]
- 30.Stoll S, Garner W, Elder J. Heparin-binding ligands mediate autocrine epidermal growth factor receptor activation In skin organ culture. The Journal of clinical investigation. 1997;100:1271–1281. doi: 10.1172/JCI119641. [DOI] [PMC free article] [PubMed] [Google Scholar]
- 31.Fontanini G, De Laurentiis M, Vignati S, Chine S, Lucchi M, Silvestri V, et al. Evaluation of epidermal growth factor-related growth factors and receptors and of neoangiogenesis in completely resected stage I-IIIA non-small-cell lung cancer: amphiregulin and microvessel count are independent prognostic indicators of survival. Clinical cancer research : an official journal of the American Association for Cancer Research. 1998;4:241–249. [PubMed] [Google Scholar]
- 32.Busser B, Sancey L, Brambilla E, Coll JL, Hurbin A. The multiple roles of amphiregulin in human cancer. Biochim Biophys Acta. 2011;1816:119–131. doi: 10.1016/j.bbcan.2011.05.003. [DOI] [PubMed] [Google Scholar]
- 33.Rhodes DR, Kalyana-Sundaram S, Mahavisno V, Varambally R, Yu J, Briggs BB, et al. Oncomine 3.0: genes, pathways, and networks in a collection of 18,000 cancer gene expression profiles. Neoplasia. 2007;9:166–180. doi: 10.1593/neo.07112. [DOI] [PMC free article] [PubMed] [Google Scholar]
- 34.Tinhofer I, Klinghammer K, Weichert W, Knodler M, Stenzinger A, Gauler T, et al. Expression of amphiregulin and EGFRvIII affect outcome of patients with squamous cell carcinoma of the head and neck receiving cetuximab-docetaxel treatment. Clinical cancer research : an official journal of the American Association for Cancer Research. 2011;17:5197–5204. doi: 10.1158/1078-0432.CCR-10-3338. [DOI] [PubMed] [Google Scholar]
- 35.Laoukili J, Stahl M, Medema RH. FoxM1: at the crossroads of ageing and cancer. Biochim Biophys Acta. 2007;1775:92–102. doi: 10.1016/j.bbcan.2006.08.006. [DOI] [PubMed] [Google Scholar]
- 36.Laoukili J, Kooistra MR, Bras A, Kauw J, Kerkhoven RM, Morrison A, et al. FoxM1 is required for execution of the mitotic programme and chromosome stability. Nat Cell Biol. 2005;7:126–136. doi: 10.1038/ncb1217. [DOI] [PubMed] [Google Scholar]
- 37.Falcon S, Gentleman R. Using GOstats to test gene lists for GO term association. Bioinformatics. 2007;23:257–258. doi: 10.1093/bioinformatics/btl567. [DOI] [PubMed] [Google Scholar]
- 38.Sadasivam S, Duan S, DeCaprio JA. The MuvB complex sequentially recruits B-Myb and FoxM1 to promote mitotic gene expression. Genes Dev. 2012;26:474–489. doi: 10.1101/gad.181933.111. [DOI] [PMC free article] [PubMed] [Google Scholar]
- 39.Down CF, Millour J, Lam EW, Watson RJ. Binding of FoxM1 to G2/M gene promoters is dependent upon B-Myb. Biochim Biophys Acta. 2012;1819:855–862. doi: 10.1016/j.bbagrm.2012.03.008. [DOI] [PubMed] [Google Scholar]
- 40.Fontijn RD, Goud B, Echard A, Jollivet F, van Marle J, Pannekoek H, et al. The human kinesin-like protein RB6K is under tight cell cycle control and is essential for cytokinesis. Molecular and cellular biology. 2001;21:2944–2955. doi: 10.1128/MCB.21.8.2944-2955.2001. [DOI] [PMC free article] [PubMed] [Google Scholar]
- 41.Wang H, Teh MT, Ji Y, Patel V, Firouzabadian S, Patel AA, et al. EPS8 upregulates FOXM1 expression, enhancing cell growth and motility. Carcinogenesis. 2010;31:1132–1141. doi: 10.1093/carcin/bgq058. [DOI] [PMC free article] [PubMed] [Google Scholar]
- 42.Yang G, Chang B, Yang F, Guo X, Cai KQ, Xiao XS, et al. Aurora kinase A promotes ovarian tumorigenesis through dysregulation of the cell cycle and suppression of BRCA2. Clinical cancer research : an official journal of the American Association for Cancer Research. 2010;16:3171–3181. doi: 10.1158/1078-0432.CCR-09-3171. [DOI] [PMC free article] [PubMed] [Google Scholar]
- 43.Lens SM, Medema RH. The survivin/Aurora B complex: its role in coordinating tension and attachment. Cell cycle. 2003;2:507–510. doi: 10.4161/cc.2.6.559. [DOI] [PubMed] [Google Scholar]
- 44.Raychaudhuri P, Park HJ. FoxM1: a master regulator of tumor metastasis. Cancer research. 2011;71:4329–4333. doi: 10.1158/0008-5472.CAN-11-0640. [DOI] [PMC free article] [PubMed] [Google Scholar]
- 45.Okabe H, Satoh S, Kato T, Kitahara O, Yanagawa R, Yamaoka Y, et al. Genome-wide analysis of gene expression in human hepatocellular carcinomas using cDNA microarray: identification of genes involved in viral carcinogenesis and tumor progression. Cancer research. 2001;61:2129–2137. [PubMed] [Google Scholar]
- 46.Pilarsky C, Wenzig M, Specht T, Saeger HD, Grutzmann R. Identification and validation of commonly overexpressed genes in solid tumors by comparison of microarray data. Neoplasia. 2004;6:744–750. doi: 10.1593/neo.04277. [DOI] [PMC free article] [PubMed] [Google Scholar]
- 47.Teh MT, Wong ST, Neill GW, Ghali LR, Philpott MP, Quinn AG. FOXM1 is a downstream target of Gli1 in basal cell carcinomas. Cancer research. 2002;62:4773–4780. [PubMed] [Google Scholar]
- 48.Xue J, Lin X, Chiu WT, Chen YH, Yu G, Liu M, et al. Sustained activation of SMAD3/SMAD4 by FOXM1 promotes TGF-beta-dependent cancer metastasis. The Journal of clinical investigation. 2014 doi: 10.1172/JCI71104. [DOI] [PMC free article] [PubMed] [Google Scholar]
- 49.Kong X, Li L, Li Z, Le X, Huang C, Jia Z, et al. Dysregulated expression of FOXM1 isoforms drives progression of pancreatic cancer. Cancer research. 2013;73:3987–3996. doi: 10.1158/0008-5472.CAN-12-3859. [DOI] [PMC free article] [PubMed] [Google Scholar]
- 50.Alvarez-Fernandez M, Medema RH. Novel functions of FoxM1: from molecular mechanisms to cancer therapy. Frontiers in oncology. 2013;3:30. doi: 10.3389/fonc.2013.00030. [DOI] [PMC free article] [PubMed] [Google Scholar]
- 51.Chandler H, Peters G. Stressing the cell cycle in senescence and aging. Current opinion in cell biology. 2013;25:765–771. doi: 10.1016/j.ceb.2013.07.005. [DOI] [PubMed] [Google Scholar]
- 52.Dickson MA, Hahn WC, Ino Y, Ronfard V, Wu JY, Weinberg RA, et al. Human keratinocytes that express hTERT and also bypass a p16(INK4a)-enforced mechanism that limits life span become immortal yet retain normal growth and differentiation characteristics. Molecular and cellular biology. 2000;20:1436–1447. doi: 10.1128/mcb.20.4.1436-1447.2000. [DOI] [PMC free article] [PubMed] [Google Scholar]
- 53.Serrano M, Lee H, Chin L, Cordon-Cardo C, Beach D, DePinho RA. Role of the INK4a locus in tumor suppression and cell mortality. Cell. 1996;85:27–37. doi: 10.1016/s0092-8674(00)81079-x. [DOI] [PubMed] [Google Scholar]
- 54.Okamoto A, Demetrick DJ, Spillare EA, Hagiwara K, Hussain SP, Bennett WP, et al. Mutations and altered expression of p16INK4 in human cancer. Proceedings of the National Academy of Sciences of the United States of America. 1994;91:11045–11049. doi: 10.1073/pnas.91.23.11045. [DOI] [PMC free article] [PubMed] [Google Scholar]
- 55.Ma RY, Tong TH, Cheung AM, Tsang AC, Leung WY, Yao KM. Raf/MEK/MAPK signaling stimulates the nuclear translocation and transactivating activity of FOXM1c. J Cell Sci. 2005;118:795–806. doi: 10.1242/jcs.01657. [DOI] [PubMed] [Google Scholar]
- 56.Laoukili J, Alvarez-Fernandez M, Stahl M, Medema RH. FoxM1 is degraded at mitotic exit in a Cdh1-dependent manner. Cell cycle. 2008;7:2720–2726. doi: 10.4161/cc.7.17.6580. [DOI] [PubMed] [Google Scholar]
- 57.Leung TW, Lin SS, Tsang AC, Tong CS, Ching JC, Leung WY, et al. Over-expression of FoxM1 stimulates cyclin B1 expression. FEBS Lett. 2001;507:59–66. doi: 10.1016/s0014-5793(01)02915-5. [DOI] [PubMed] [Google Scholar]
- 58.Yao KM, Sha M, Lu Z, Wong GG. Molecular analysis of a novel winged helix protein, WIN. Expression pattern, DNA binding property, and alternative splicing within the DNA binding domain. J Biol Chem. 1997;272:19827–19836. doi: 10.1074/jbc.272.32.19827. [DOI] [PubMed] [Google Scholar]
- 59.Hennings H, Michael D, Cheng C, Steinert P, Holbrook K, Yuspa SH. Calcium regulation of growth and differentiation of mouse epidermal cells in culture. Cell. 1980;19:245–254. doi: 10.1016/0092-8674(80)90406-7. [DOI] [PubMed] [Google Scholar]
- 60.Liu B, Xia X, Zhu F, Park E, Carbajal S, Kiguchi K, et al. IKKalpha is required to maintain skin homeostasis and prevent skin cancer. Cancer cell. 2008;14:212–225. doi: 10.1016/j.ccr.2008.07.017. [DOI] [PMC free article] [PubMed] [Google Scholar]
- 61.Wonsey DR, Follettie MT. Loss of the forkhead transcription factor FoxM1 causes centrosome amplification and mitotic catastrophe. Cancer research. 2005;65:5181–5189. doi: 10.1158/0008-5472.CAN-04-4059. [DOI] [PubMed] [Google Scholar]
- 62.Edgar BA, Orr-Weaver TL. Endoreplication cell cycles: more for less. Cell. 2001;105:297–306. doi: 10.1016/s0092-8674(01)00334-8. [DOI] [PubMed] [Google Scholar]
- 63.Schuller U, Zhao Q, Godinho SA, Heine VM, Medema RH, Pellman D, et al. Forkhead transcription factor FoxM1 regulates mitotic entry and prevents spindle defects in cerebellar granule neuron precursors. Molecular and cellular biology. 2007;27:8259–8270. doi: 10.1128/MCB.00707-07. [DOI] [PMC free article] [PubMed] [Google Scholar]
- 64.Freije A, Ceballos L, Coisy M, Barnes L, Rosa M, De Diego E, et al. Cyclin E drives human keratinocyte growth into differentiation. Oncogene. 2012;31:5180–5192. doi: 10.1038/onc.2012.22. [DOI] [PubMed] [Google Scholar]
- 65.Zanet J, Freije A, Ruiz M, Coulon V, Sanz JR, Chiesa J, et al. A mitosis block links active cell cycle with human epidermal differentiation and results in endoreplication. PloS one. 2010;5:e15701. doi: 10.1371/journal.pone.0015701. [DOI] [PMC free article] [PubMed] [Google Scholar]
- 66.Stoll SW, Stuart PE, Lambert S, Rittie L, Johnston A, Nair RP, et al. The C-Terminal Domain of Amphiregulin Promotes G2/M Progression In Human Keratinocytes. The Journal of Investigative Dermatology. 2014 doi: 10.1016/j.jid.2015.10.061. submitted. [DOI] [PMC free article] [PubMed] [Google Scholar]
- 67.Trapnell C, Pachter L, Salzberg SL. TopHat: discovering splice junctions with RNA-Seq. Bioinformatics. 2009;25:1105–1111. doi: 10.1093/bioinformatics/btp120. [DOI] [PMC free article] [PubMed] [Google Scholar]
- 68.Garber M, Grabherr MG, Guttman M, Trapnell C. Computational methods for transcriptome annotation and quantification using RNA-seq. Nat Methods. 2011;8:469–477. doi: 10.1038/nmeth.1613. [DOI] [PubMed] [Google Scholar]
- 69.Robinson MD, McCarthy DJ, Smyth GK. edgeR: a Bioconductor package for differential expression analysis of digital gene expression data. Bioinformatics. 2010;26:139–140. doi: 10.1093/bioinformatics/btp616. [DOI] [PMC free article] [PubMed] [Google Scholar]
- 70.Benjamini Y, Hochberg Y. Controlling the false positive discovery rate: A practical and powerful approach to multiple testing. J Royal Stat Soc (B) 1995;57:289–300. [Google Scholar]
- 71.Ashburner M, Ball CA, Blake JA, Botstein D, Butler H, Cherry JM, et al. Gene ontology: tool for the unification of biology. The Gene Ontology Consortium Nat Genet. 2000;25:25–29. doi: 10.1038/75556. [DOI] [PMC free article] [PubMed] [Google Scholar]
- 72.Kanehisa M, Goto S, Sato Y, Furumichi M, Tanabe M. KEGG for integration and interpretation of large-scale molecular data sets. Nucleic acids research. 2012;40:D109–114. doi: 10.1093/nar/gkr988. [DOI] [PMC free article] [PubMed] [Google Scholar]
- 73.Matthews L, Gopinath G, Gillespie M, Caudy M, Croft D, de Bono B, et al. Reactome knowledgebase of human biological pathways and processes. Nucleic acids research. 2009;37:D619–622. doi: 10.1093/nar/gkn863. [DOI] [PMC free article] [PubMed] [Google Scholar]
- 74.Yu G. R package version 1.10.0. ReactomePA: Reactome Pathway Analysis. [DOI] [PubMed] [Google Scholar]
- 75.Swindell WR, Johnston A, Xing X, Little A, Robichaud P, Voorhees JJ, et al. Robust shifts in S100a9 expression with aging: a novel mechanism for chronic inflammation. Scientific reports. 2013;3:1215. doi: 10.1038/srep01215. [DOI] [PMC free article] [PubMed] [Google Scholar]
- 76.Swindell WR, Johnston A, Xing X, Voorhees JJ, Elder JT, Gudjonsson JE. Modulation of epidermal transcription circuits in psoriasis: new links between inflammation and hyperproliferation. PloS one. 2013;8:e79253. doi: 10.1371/journal.pone.0079253. [DOI] [PMC free article] [PubMed] [Google Scholar]
- 77.Xie Z, Hu S, Blackshaw S, Zhu H, Qian J. hPDI: a database of experimental human protein-DNA interactions. Bioinformatics. 2010;26:287–289. doi: 10.1093/bioinformatics/btp631. [DOI] [PMC free article] [PubMed] [Google Scholar]
- 78.Swindell WR, Stuart PE, Sarkar MK, Voorhees JJ, Elder JT, Johnston A, et al. Cellular dissection of psoriasis for transcriptome analyses and the post-GWAS era. BMC medical genomics. 2014;7:27. doi: 10.1186/1755-8794-7-27. [DOI] [PMC free article] [PubMed] [Google Scholar]
- 79.Cumming G, Fidler F, Vaux DL. Error bars in experimental biology. The Journal of cell biology. 2007;177:7–11. doi: 10.1083/jcb.200611141. [DOI] [PMC free article] [PubMed] [Google Scholar]
- 80.Lazic SE. The problem of pseudoreplication in neuroscientific studies: is it affecting your analysis? BMC neuroscience. 2010;11:5. doi: 10.1186/1471-2202-11-5. [DOI] [PMC free article] [PubMed] [Google Scholar]
- 81.Maxwell SE, Delaney HD. Designing Experiments and Analyzing Data: A Model Comparison Perspective. 2. Psychology Press; New York, London: 2004. p. 868. [Google Scholar]
- 82.Morey RD. Confidence intervals from normalized data: A correction to Cousineau (2005) Tutorials in Quantitative Methods for Psychology. 2008;4:61–64. [Google Scholar]
- 83.Cousineau D. Confidence intervals in within-subject designs: A simpler solution to Loftus and Masson’s method. Tutorials in Quantitative Methods for Psychology. 2005;1:42–45. [Google Scholar]
- 84.Loftus GR, Masson ME. Using confidence intervals in within-subject designs. Psychonomic bulletin & review. 1994;1:476–490. doi: 10.3758/BF03210951. [DOI] [PubMed] [Google Scholar]
- 85.Gruenbaum Y, Wilson KL, Harel A, Goldberg M, Cohen M. Review: nuclear lamins--structural proteins with fundamental functions. Journal of structural biology. 2000;129:313–323. doi: 10.1006/jsbi.2000.4216. [DOI] [PubMed] [Google Scholar]
- 86.Bonnard M, Mirtsos C, Suzuki S, Graham K, Huang J, Ng M, et al. Deficiency of T2K leads to apoptotic liver degeneration and impaired NF-kappaB-dependent gene transcription. EMBO J. 2000;19:4976–4985. doi: 10.1093/emboj/19.18.4976. [DOI] [PMC free article] [PubMed] [Google Scholar]
Associated Data
This section collects any data citations, data availability statements, or supplementary materials included in this article.


