Abstract
Blood flow plays a critical role in regulating embryonic cardiac growth and development, with altered flow leading to congenital heart disease. Progress in the field, however, is hindered by a lack of quantification of hemodynamic conditions in the developing heart. In this study, we present a methodology to quantify blood flow dynamics in the embryonic heart using subject-specific computational fluid dynamics (CFD) models. While the methodology is general, we focused on a model of the chick embryonic heart outflow tract (OFT), which distally connects the heart to the arterial system, and is the region of origin of many congenital cardiac defects. Using structural and Doppler velocity data collected from optical coherence tomography (OCT), we generated 4D (3D + time) embryo-specific CFD models of the heart OFT. To replicate the blood flow dynamics over time during the cardiac cycle, we developed an iterative inverse-method optimization algorithm, which determines the CFD model boundary conditions such that differences between computed velocities and measured velocities at one point within the OFT lumen are minimized. Results from our developed CFD model agree with previously measured hemodynamics in the OFT. Further, computed velocities and measured velocities differ by less than 15% at locations that were not used in the optimization, validating the model. The presented methodology can be used in quantifications of embryonic cardiac hemodynamics under normal and altered blood flow conditions, enabling an in depth quantitative study of how blood flow influences cardiac development.
Keywords: chick embryonic heart, outflow tract, hemodynamics, cardiac development, congenital heart disease, cardiac defects, inverse methods
1 Introduction
Normal cardiac development is the result of a complex interplay of genetic and environmental factors. Under some circumstances, however, malformations in the heart at birth or congenital heart disease (CHD) occur. In the US alone, CHD affects nearly 1% (~30,000) of newborns with many of them requiring surgical interventions (Go et al 2013). Initiation, formation and subdivision of the heart are genetically controlled processes (Brand 2003; Srivastava 2006; Bruneau 2008); however, blood flow plays a critical role in regulating cardiac development by providing hemodynamic stimuli (such as blood pressure and wall shear stress) to cardiac tissues. These mechanical stimuli modulate development through mechanotransduction mechanisms (Hogers et al 1997; Loots et al 2003; Azhar et al 2003; Bartman and Hove 2005; Groenendijk et al 2005; Hove 2006; Groenendijk et al 2007; Egorova et al 2011; Ten Dijke et al 2012; Lim and Thiery 2012; Goetz et al 2014). Using animal models, it has been shown that altering cardiac blood flow during early development leads to congenital heart defects resembling those seen in humans (Clark and Rosenquist 1977; Sedmera et al 1997; Vos et al 2003; Miller et al 2003; Granados-Riveron and Brook 2012; Midgett et al 2014). Yet the mechanisms by which blood flow modulates intrinsic developmental programs leading to cardiac malformations when blood flow is abnormal are not well understood.
Difficulties in quantifying hemodynamics in the embryonic heart have hindered progress in understanding how blood flow affects cardiac development. To quantify embryonic cardiac blood flow, research groups have used diverse techniques. A common difficulty is that even at early stages of development the heart is moving (beating) and tiny (< 1mm). Therefore technologies used to measure blood flow must be able to resolve highly dynamic velocities in a small heart that rapidly beats, dramatically changing its geometry over time. Methodologies employed to measure embryonic blood flow dynamics range from particle image velocity (PIV) to Doppler techniques. Using micro PIV (μPIV) (Jones et al 2004; Vennemann et al 2006; Hove 2006; Milan et al 2006), either red blood cells or particles inserted in the circulation are followed over time with a series of images that allow localization and tracking of specific particles and hence localized quantification of blood flow velocities. PIV and μPIV can also be performed from images that exhibit speckles, using speckle tracking algorithms. The main disadvantages of PIV techniques are the need for specialized equipment and manipulations (in the case of particle labeling) and that typically the method obtains the projection of 3D velocity vectors on a 2D plane, losing information on the 3D nature of cardiac blood flow. Using Doppler techniques (such as flow laser velocimetry and Doppler ultrasound), only one component of the 3D velocity vector is measured, and even though assumptions on blood flow velocity direction can be made, information on the 3D nature of cardiac blood flow is also lost. Among Doppler techniques, Doppler optical coherence tomography (OCT) has recently been extensively used to measure embryonic cardiac blood flow (Yelbuz 2002; Jenkins et al 2006; Jenkins et al 2007; Larina et al 2008; Ma et al 2010; Syed et al 2011). This is because OCT can simultaneously acquire structural and Doppler data from embryonic hearts with the same high resolution (≤ 10 μm) and at relatively high image frame rates (e.g. 140 frames/sec). This means that using OCT one can simultaneously acquire a sequence of structural cardiac images together with ‘flow’ cardiac images. Doppler OCT, like other techniques, however, is limited by its measurable range, noise, and measurement of a 1D projection of the velocity vector, rendering incomplete flow information. Assumptions are needed to obtain a more complete representation of blood flow velocity within the developing heart (Ma et al 2010) and estimating endocardial wall shear stresses (WSS), which are key in the mechanotransduction of flow signals (Taber and Humphrey 2001; Loots et al 2003; Groenendijk et al 2004; Groenendijk et al 2007; Taber 2009; Santhanakrishnan and Miller 2011; Goetz et al 2014). One way of obtaining 3D flow data and WSS is by applying computational fluid dynamics (CFD) to embryonic cardiac modeling.
We present here a subject-specific CFD model of the embryonic tubular heart. While the model is general, as an example of application we focus on the hemodynamics of an embryonic chick heart at an early developmental stage, approximately Hamburger Hamilton stage 18 (HH18) (Hamburger and Hamilton 1951). Embryonic chick hearts are practical for analyzing cardiovascular development due to their low cost, easy accessibility for in-vivo imaging, and because chick hearts resemble the human embryonic heart closely, with genetic programs highly conserved among vertebrate species. Around HH18, the embryonic heart has a tubular structure with no valves or heart chambers, and pumps blood by a peristaltic-like motion. The heart consists of a primitive atrium and primitive ventricle, and the heart outflow tract (OFT) connects the ventricle to the arterial system. We further focused on the OFT portion of the embryonic heart as major congenital heart defects are known to develop from this region (Bartelings and Gittenberger-de Groot 1991; Icardo 1996; van den Hoff et al 1999; Hove et al 2003; Gittenberger-de Groot et al 2005).
Subject-specific or image-based CFD modeling of cardiovascular segments has been extensively used in assessing hemodynamic conditions in humans and animal models, and in understanding how hemodynamics vary from subject to subject and under pathophysiological conditions. The field was enabled by the availability of images depicting 3D cardiovascular segments of interest. Most image-based modeling strategies start by extracting static (not moving) geometries of interest from images, creating a CFD model from those geometries, and then imposing flow and/or normal traction (pressure) boundary conditions to the model inlets and outlets (Steinman 2002; Taylor and Steinman 2010; Chandran et al 2011). A few studies have also extracted dynamic cardiac geometries from images (Schenkel et al 2009; Mihalef et al 2011; Chandran and Vigmostad 2013). Boundary conditions used for these CFD models depend on data availability, and range from data measured in the same subject, to average or estimated data based on previous studies. Subject-specific models have tremendously impacted our understanding of pathological cardiovascular conditions and the role of blood flow on them, and promise to enable personalized medicine approaches. Optimization strategies have also been used in the context of hemodynamic modeling, typically to determine geometrical parameters, such as dimensions of grafts for implantation (Marsden et al 2008; Taylor and Steinman 2010). We use here subject-specific strategies with an optimization approach that uses known (measured) flow velocities in a small region within the heart OFT lumen to determine unknown boundary conditions in the embryonic heart.
Other research groups have used CFD to quantify hemodynamic parameters in the early developing heart. Computational studies have been performed to investigate the influence of hemodynamics on developmental phenomena such as atrioventricular valve formation, aortic arch development and cardiac looping, e.g. (Taber et al 1993; Groenendijk et al 2005; Pekkan et al 2008; Wang et al 2009; Taber 2009; Yalcin et al 2011; Freund et al 2012; Kowalski et al 2012; Kowalski et al 2014; Biechler et al 2014). Groups have also investigated hemodynamics in the chick embryonic OFT (Bharadwaj et al 2012; Menon et al 2015). These OFT models, however, were performed on static geometries (no motion) from fixed tissues and therefore do not take into account the dynamic motion of the OFT walls during the cardiac cycle. Our new CFD model differs from previously developed models in that it takes into account the motion of the heart OFT walls obtained from in vivo imaging.
Our previous models (Liu et al 2011; Liu et al 2012), while based on OCT in vivo imaging, used idealized geometries for the OFT, assuming an elliptical lumen shape. Boundary conditions for these models consisted of normal traction forces imposed at the inlet and outlet surfaces (resulting in an imposed pressure drop from the OFT inlet to its outlet). The main limitation of these models was that embryo-specific pressures could not be measured in the same embryo, and thus average measured pressure values (obtained from other embryos) had to be used. Modeling different embryo hearts using the same average inlet and outlet pressures, however, assumed that only geometry affects biological variations in flows, and neglects the effects of other contributions, limiting analysis of variations. This is particularly important when studying treatments or interventions that alter blood flow, especially when those treatments/interventions produce different blood flow conditions from embryo to embryo, such as studies reported in (Shi et al 2013; Midgett et al 2014). The CFD model presented here is “truly” subject-specific in that it uses both the OFT lumen geometry from OCT images and lumen velocities from simultaneously acquired Doppler OCT images. Velocities are used to find appropriate boundary conditions for the model so that differences between measured and computed velocities are minimized. This ensures that both geometry and blood flow are properly captured and can therefore vary from embryo to embryo to reflect biological and hemodynamic-intervention variations. In this manuscript we focused on describing the modeling strategies employed in our subject-specific model of the HH18 chick heart OFT. Model validation is presented and possible model refinements are discussed. Our subject-specific CFD models enable computation of time-varying cardiac blood flow within the OFT and WSS on endocardial cells.
2 Methods
This paper focuses on describing our methodology to model embryonic cardiac hemodynamics. To this end, and as an example of application, we chose one set of images from one control chicken embryo heart OFT. Our model development strategy starts by imaging the chick embryo heart OFT using OCT, which simultaneously acquires structural images and Doppler data. OCT images are then synchronized and reconstructed into 4D images, from which the heart OFT lumen-wall interface is segmented (extracted in the form of a surface mesh). A dynamic geometrical model of the heart OFT lumen is then constructed for CFD simulations over the cardiac cycle. To ensure that blood flow velocities are correctly captured within the model, we extracted Doppler OCT data from a point q within the OFT lumen, and implemented a procedure that adjusts model boundary conditions such that the difference between CFD computed and OCT measured velocity at the point q is minimized. This strategy ensures that blood velocities and cardiac geometry are embryo-specific.
2.1 Embryo Preparation and OCT Imaging
Embryo preparation and OCT imaging were described in detail before (Liu et al 2009; Liu et al 2012; Shi et al 2013; Midgett et al 2014). Briefly, we placed fertilized white leghorn eggs into an incubator (Genisys 1588, Savannah, GA) for about 72 hours. Embryos were then removed from the incubator, and their stages checked following Hamburger and Hamilton staging (Hamburger and Hamilton 1951). Embryos were then prepared for OCT imaging and placed in a temperature controlled environment. The egg position was adjusted so that imaging of the heart OFT was optimal.
OCT images were acquired using our custom-made OCT system (central wave length λ = 1310 nm; maximum line-scan rate of 47 kHz). Our imaging protocol consisted of imaging 2D OFT cross-sections over time (B-modes) for a total of 195 frames (about 4 cardiac cycles). B-mode images were acquired along the OFT (proximally to distally) with 12.5 μm distance between consecutive B-mode cross-sections. A B-mode of a longitudinal section was also acquired for post-processing synchronization. B-mode images were acquired at 140 frames per second (fps), with each frame consisting of 256 A-scans (line scans). A total of 65 B-mode cross-sections along the OFT were acquired. Images from only one control (normal) embryo were used in this study.
OCT measures the phase change, Δφ, between sequential line scans, from which velocity data can be computed as follows:
| (1) |
where Vz, the Doppler velocity, is the vertical component of the velocity (in the direction of the OCT light beam, which is the vertical direction in acquired B-mode scans), and for our system, the refractive index was n = 1.35, and the time difference between two adjacent line scans (1/A-scan rate) was set to τ = 21μs. The Doppler feature of OCT is essential to simultaneously obtain structural and hemodynamic data of the embryonic heart, and has been validated before (Midgett and Rugonyi 2014).
OCT data acquisition was non-gated, and we used a retrospective image gating algorithm to obtain 4D structural images of the embryonic heart OFT. To this end, we used the periodicity of the cardiac cycle, structural similarity, and a longitudinal B-mode image sequence, as described in detail in (Liu et al 2009). Our post-processing image synchronization strategy allowed us to capture the peristaltic-like motion of the developing heart OFT.
2.2 OCT Dynamic Image Segmentation
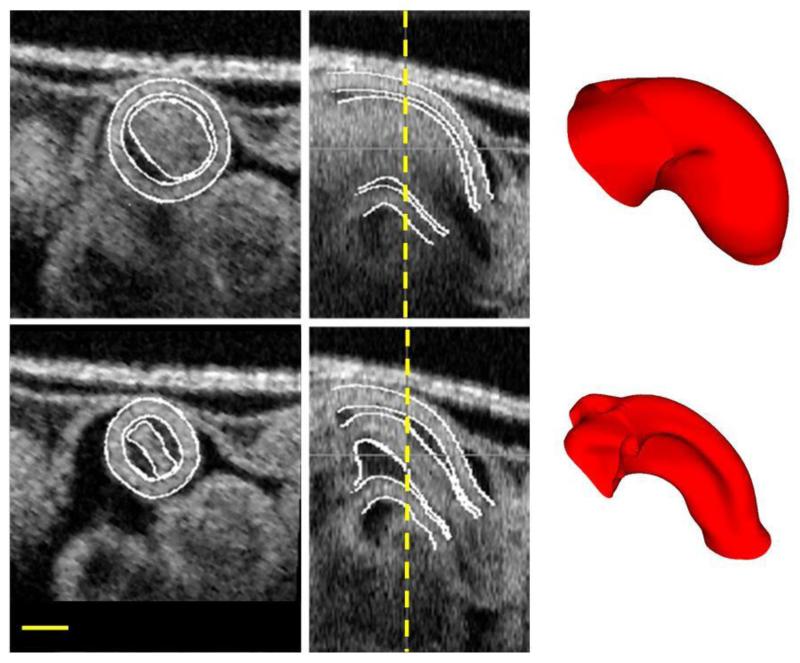
An in-house image segmentation algorithm was used to extract the OFT lumen-wall surfaces (the interface between the blood and the cardiac tissue) from the 4D OCT structural images, as described in (Yin et al 2012). The algorithm allowed extraction of OFT lumen surfaces as a sequence of surface meshes that represent the OFT tissue motion over the cardiac cycle (see Figure 1). To achieve smooth, structured, and deformable volumetric meshes from these lumen surface meshes, the surface meshes were further processed. To this end, we implemented a consistent mesh parameterization strategy followed by a strain minimization algorithm (Phan et al 2011). In brief, lumen meshes were parameterized using: 1) a longitudinal parameter, v, which defines quasi cross-sections along the OFT; and 2) a contour parameter, u, which defines the lumen contour for each cross-section. This parameterization guided generation of a consistent grid-like lumen-surface mesh that further satisfied the following conditions: i) quasi cross-sections did not intersect within the OFT; ii) nodes were placed such that geodesic distances between nodes were approximately the same, and iii) changes in geodesic distances over time were minimized. The lumen surface meshes were then used to construct structured volume meshes of the OFT lumen that captured the motion of the OFT walls over time. These volume meshes were used in the embryo-specific CFD model of the embryonic heart OFT.
Figure 1.
Structural OCT images of the chick embryonic OFT utilized in this study. The top row represents the OFT at a fully expanded configuration, while the bottom row represents the OFT at a fully contracted configuration. The images on the left represent a cross-section, the ones in the middle show a corresponding longitudinal section, with the location of the cross-section marked with a dashed vertical line. Shown on the right are the final surface meshes obtained at the end of segmentation. Scale bar is 200μm.
2.3 Doppler OCT Velocity Extraction
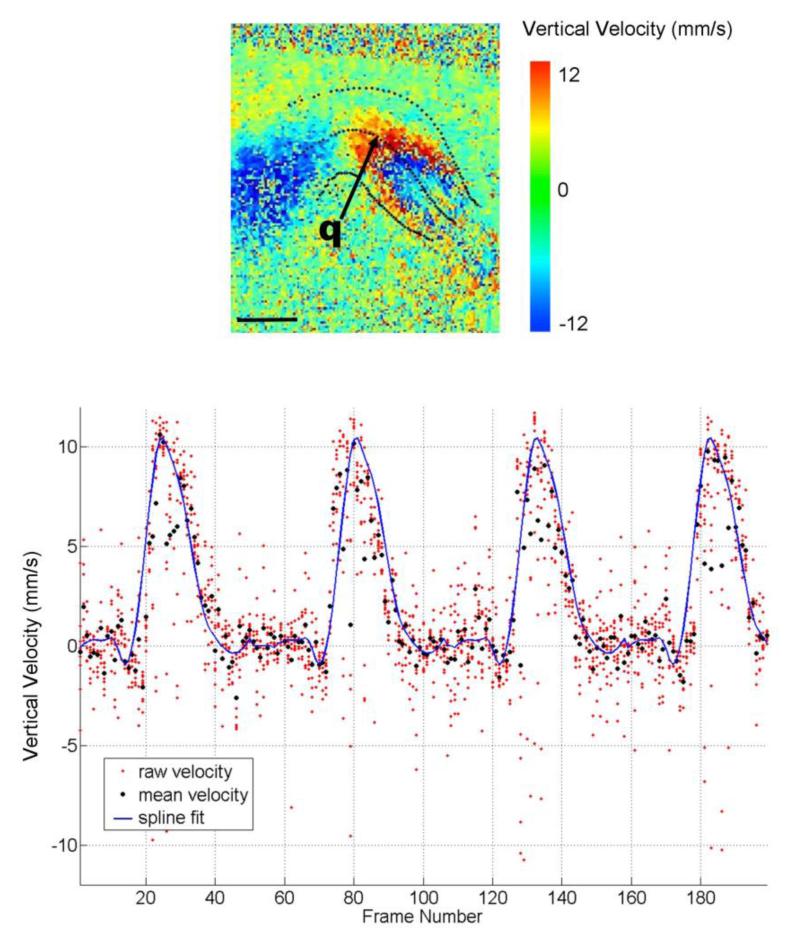
Doppler OCT velocity data (from one point) was used, together with the embryo-specific geometry, in an inverse-based CFD model of the chick embryonic OFT. We used Equation (1) to compute Vz in the OFT from OCT phase data (see Figure 2, top). We then selected a point q in the OFT lumen (arrow in Figure 2, top) from which we extracted Vz over time. The point q was chosen such that the following criteria were satisfied: 1) no wrapping over the entire cardiac cycle; wrapping occurs when phase shifts change from π to −π or vice-versa (in our system corresponding to a threshold vertical velocity of ~ ± 12 mm/s); 2) q was close to the OFT centerline and inside the segmented lumen surface. Velocity data from point q were then used to determine boundary conditions in the CFD model of the OFT.
Figure 2.
Doppler Velocity extracted from OCT data. (Top) Doppler velocities on a longitudinal section of the OFT, depicting the component of the velocity vector in the vertical direction of the image (the direction of the OCT beam). Vertical velocity magnitudes are displayed in color. Lumen boundaries and the OFT centerline are marked with dotted lines. Blood flows from left to right, and thus blood flow to the left is upwards (coded as negative velocity) and to the right it is downward (positive velocities). To the far right, in addition, phase wrapping can be observed by the characteristic abrupt change in velocity sign (red to blue). The arrow indicates the point q from which we extracted velocity data over the cardiac cycle for the CFD model optimization procedure. Scale bar is 200μm. (Bottom) Vertical velocity extracted from point q. The plot shows the raw vertical velocity data from Doppler OCT, for a 3×3 pixel region around the selected point (red dots); together with the final averaged velocity values after two-step filtering processes for each time frame (black dots). The spline fit of the processed velocity data (blue solid line) is overlaid with the raw and averaged velocity data for comparison.
Before using velocity data in our models, noise reduction strategies were applied. First, instead of extracting data from one point (pixel), we extracted velocity data within a small finite region comprising 3×3 pixels around the selected point q from each image frame, resulting in 9 vertical velocity values for each frame and about 4 cardiac cycles (see Figure 2, bottom). We then removed outliers in a two-step process. In the first step, using velocity values from each frame, we calculated the mean vertical velocity and its standard deviation , where i represents the frame number. Next we filtered the data by removing velocities outside the range . In the second step, we repeated this procedure using the remaining vertical velocities, and updated and . Removing outliers was not straight forward, and the factor α was carefully chosen after an empirical analysis that yielded a factor α =1.3 for the first step and α = 0.8 for the second step. We chose α to be smaller in the second step, thus setting a stricter condition for filtering velocity data. After this second step of filtering, mean velocities were computed again (Figure 2 bottom, black dots). Because data was filtered for each frame, and we had about 4 cardiac cycles worth of data, we further averaged velocities among cardiac cycles. To this end, we first aligned the data from each cardiac cycle using the maximum velocities as reference, and then averaged the velocities. Lastly, we fit a spline using least-squares fit through our averaged velocity data (Figure 2 bottom, solid line). Overall, this procedure reduced the noise in the data significantly and smoothed the velocity distribution over the cardiac cycle. A smoothed velocity distribution was essential for implementation of a robust CFD optimization procedure, avoiding artificial jumps in flow velocity and pressure.
2.4 CFD Model of the Embryonic Outflow Tract
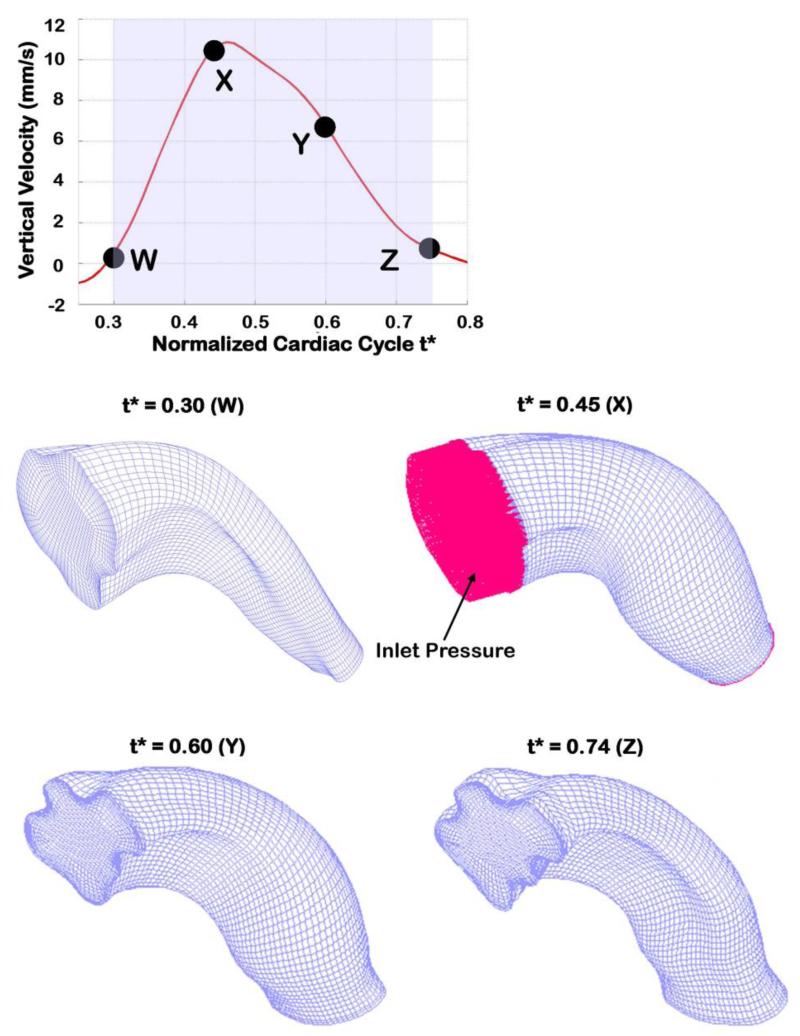
Our image-based CFD model of the heart OFT used embryo-specific cardiac geometries and blood flow velocities (at point q) obtained from OCT. CFD simulations were performed using the commercial computational mechanics software ADINA (Watertown, MA). The OFT lumen volume was meshed using hexahedral elements, in particular the 8-node flow-condition-based interpolation (FCBI) elements (Bathe and Zhang 2002) available in ADINA. Note that 72 meshes were constructed, representing the OFT over the cardiac cycle as it opens, becomes fully open, and closes (See Figure 3). For each time step, however, the same number of elements was used. The mesh density close to the OFT wall was increased to more precisely calculate the velocity gradients, and hence wall shear stresses. A convergence study (see Section 3.1) demonstrated that the meshes employed were appropriate for CFD simulations.
Figure 3.
OFT meshes at different times during the cardiac cycle. The top plot shows the smoothed (fitted) Doppler vertical velocity extracted from pointq, showing the portion of the cardiac cycle that was modeled (shaded region). Specific normalized time points (t*) for which meshes are depicted are also shown. The OFT model was meshed using 8 node FCBI hexahedral elements. Normal traction (~ pressure) was imposed as a boundary at the OFT inlet, while the traction at the outlet was set to zero, shown for t* = 0.45 only.
Blood flows through the OFT during about half of the cardiac cycle (Rugonyi et al 2008; Shi et al 2013; Midgett and Rugonyi 2014)(see Figure 2). No flow is observed when the OFT lumen is closed, a geometrical configuration that is very difficult to reproduce in CFD models. Therefore, after normalizing time to the cardiac-cycle period (t* ∈ [0,1]) and approximately centering maximum flow at t* = 0.5, we modeled the OFT hemodynamics from t* = 0.3 to t* = 0.74 (see Figure 3), when flow through the OFT was measurable.
We modeled blood flow within the OFT using the Navier-Stokes equations. Blood flow properties employed were blood density ρ = 1060 kg / m3, and blood viscosity μ = 0.003 kg/m-s. At the early stages of cardiac and embryonic development studied here, blood has a low hematocrit (~19%) (Al-Roubaie et al 2011) and thus it behaves closer to Newtonian than adult blood, justifying the use of Navier-Stokes equations (Gaehtgens et al 1981; Al-Roubaie et al 2011).
Model boundary conditions were chosen to reproduce measured blood flow velocities in the embryonic heart. Given the small dimensions of the OFT and low flow Reynolds numbers (Re ≤ 6) (Liu et al 2012; Midgett et al 2014), we simulated blood flow at each time step using quasi steady-state conditions, namely a steady-state solution was achieved at each time step. Even though the OFT walls were moving over the cardiac cycle, because of the quasi-steady approximation, we used fixed walls and no-slip boundary conditions at the OFT wall (the lumen-wall interface) at each time step. These approximations were later verified (see Section 4.2.3). At the OFT inlet and outlet surfaces, we prescribed normal traction (effectively blood pressure) boundary conditions. This choice of boundary conditions essentially established a pressure drop, ΔP, between the inlet and the outlet of the OFT model. Thus, instead of applying a normal traction at the inlet and outlet of our OFT model, we set the normal traction to zero at the OFT outlet and imposed a uniform (>0) normal traction at the OFT inlet, effectively imposing ΔP at the inlet surface. Because the OFT is tubular, this ΔP drives blood flow through the OFT in our CFD model. In modeling the embryonic OFT, boundary conditions are not known, and measurements of these conditions in the same embryo that is imaged are not practical. ΔP is chosen, as described below, using an optimization procedure such that CFD computed velocities match Doppler measured velocities.
2.5 Optimization Procedure to Compute Blood Flow Velocities
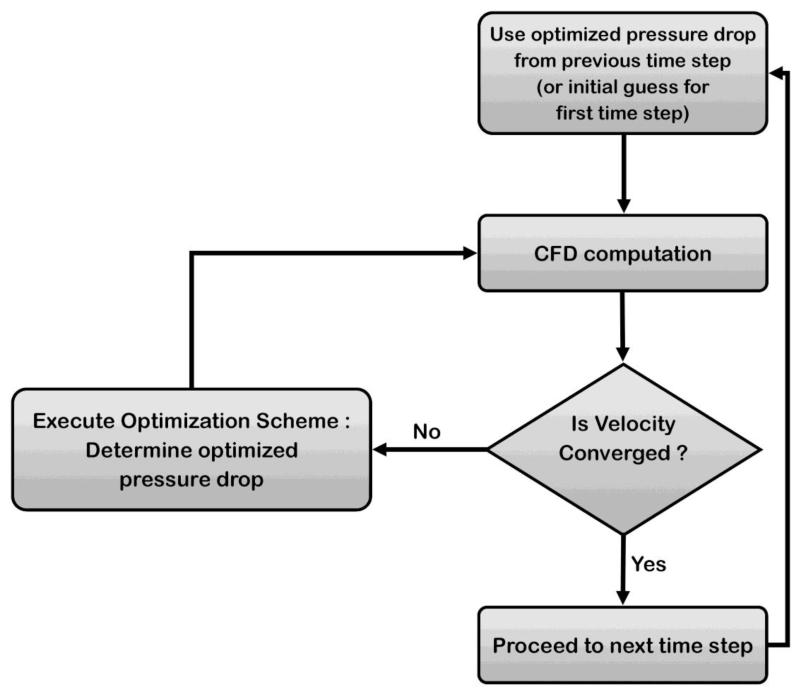
We started the optimization procedure by imposing an initial, guessed normal traction (ΔP) at the OFT inlet, and performing a CFD simulation. For the very first time step simulated (t* = 0.3), the initial guess was an arbitrary yet small number; for subsequent time steps, the normal traction from the previous step was used as initial guess. We then compared the CFD computed VZ at point q with the measured VZ at this point. If the velocity values were the same (within a small tolerance, < 1%), we moved to the next time step. If values differed, then the imposed normal traction was updated (using the optimization algorithm described below) and another CFD simulation performed. The inlet normal traction continued to be updated until the difference between computed and measured velocities was less than 1%, and we could move to the next time step (see Figure 4 for a schematics of the optimization procedure employed).
Figure 4.
Schematic of optimization procedure. For each time step, we begin with an initial ΔP: the optimized ΔP from the previous step, or an user-input initial guess for the very first time step. Using ΔP as the inlet boundary conditions, CFD computations are performed. Velocity data is then extracted from the simulation results and compared to the measured velocity data at the selected point q. If the velocity is converged (difference between computed and measured velocities at point q < 1%), the procedure moves to the next time step, otherwise ΔP is updated through the optimization scheme (Equation 3).
The optimization algorithm used to find an updated normal traction value (ΔP) is based on the secant method. The Hagen-Poiseuille equation for flow in a cylindrical tube establishes a linear relationship between the pressure drop from the inlet to the outlet surfaces, ΔP, and the axial velocity V,
| (2) |
where R is the tube radius, L its length, μ denotes the fluid viscosity, and r a radial position within the tube (r = 0 corresponds to centerline, peak velocity). Equation (2), cannot be directly employed to determine the pressure difference in the OFT since the OFT’s geometry deviates from a cylindrical tube. Due to the low Reynold’s number and the tube-like structure of the OFT, the ΔP versus V relationship is expected to be a smooth, monotonically increasing function. Thus, an iterative secant method for finding the ΔP that optimizes the velocity at point q (minimizing the difference between measured and computed velocities) was implemented. Using this method, at each k-th iteration, the updated pressure drop ΔPk+1 was calculated as:
| (3) |
where VDoppler is the measured Doppler velocity in the vertical direction, Vk the k-th CFD computed vertical velocity component for the corresponding inlet pressure ΔPk. For the very first iteration step, k = 1, an initial guess is used for ΔP1, from which V1 is computed using the CFD model; and we used ΔP0 = 0 and V0 = 0. For all subsequent steps, we used the previously obtained pressure drop ΔPk to begin iterations.
The optimization procedure was implemented using in-house written programs that made the process automatic. The procedure was run in a high-performance computing (HPC) Exacloud cluster available at OHSU. A bash script was written to call ADINA (more specifically ADINA-F, which is the CFD module in ADINA) at every time and iteration step. The bash script used the current ΔP (either the initial guess, or the ΔP provided by the optimization algorithm) to prepare the input for ADINA-F and start the simulation. Simulation of the CFD model generated output files containing blood flow velocity data. A Fortran subroutine was then called within the bash script to check the computed velocity against the Doppler velocity and, if the two velocities differed (>1% difference), compute the new ΔP estimate using Equation (3). When velocities were the same (<1% difference), ΔP was recorded, CFD results saved, and the bash script moved to the next time step and repeated the optimization procedure within the new time step. At each time step the procedure was quite efficient requiring not more than 2-3 iterative steps to reach convergence.
3 Results
Results from our subject-specific CFD model of the embryonic heart OFT simulated over the cardiac cycle are presented. Since blood flows through the OFT only during about half of the cardiac cycle (Rugonyi et al 2008; Shi et al 2013; Midgett et al 2014) only a portion of the cycle was modeled: from normalized time t*=0.3 to t*=0.74. Using the CFD model results, we first checked that the difference between the computed velocity at point q and the measured velocity at point q (used as input for our optimization procedure) were within 1%, to ensure that our strategy was effective. Then we validated computed velocities against Doppler velocities measured at other locations within the OFT (not used in the optimization algorithm), and also compared the resulting pressure drop, ΔP, to measured pressure data. Finally we briefly analyzed hemodynamic parameters in the OFT.
3.1 OFT Geometry, Wall Motion, and Mesh Employed for Simulations
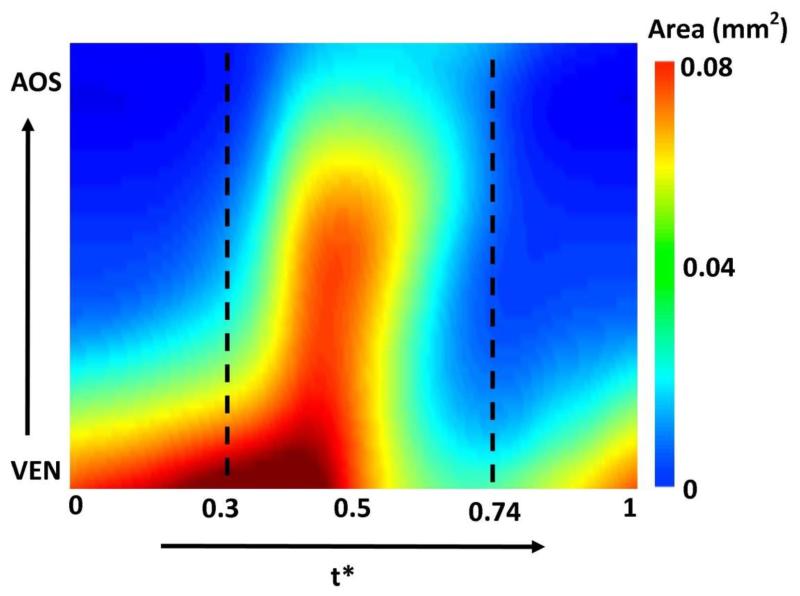
The subject-specific OFT model exhibits a highly dynamic wall motion (see Figure 3). At this developmental stage, the OFT wall has a peristaltic-like motion, with lumen cross-sections expanding and contracting sequentially along the OFT tube (see Figure 5). For the embryo analyzed here, at t* = 0 the OFT inlet cross-section is expanding, while the outlet cross-section is closed. The OFT lumen expanded from inlet to outlet (with the inlet reaching maximal expansion at t* ~ 0.35 and the outlet at t* = 0.47). We modeled the portion of the cardiac cycle (t* = 0.3 to t* = 0.74), which encompasses opening and closing of the OFT lumen (see Figure 5). There is limited or no flow for the initial third of the normalized cardiac cycle (up to ~ t* = 0.3). This is followed by a period of flow acceleration from time t* = 0.30 until t* = 0.47, when the velocities achieved their peak, followed by a period of flow deceleration where the OFT constricts and velocities reduce to an almost no-flow condition towards the end of the simulation (t* = 0.74). The portion of the cardiac cycle that was not modeled represented the cardiac phase with negligible flow.
Figure 5.
OFT lumen cross-sectional area over the cardiac cycle and along the OFT tube length. In the figure, cross-sectional area (mm2) is color-coded in the 2D graph, while time is normalized to the cardiac period (t*) and the length is the axial length along the OFT centerline from inlet (close to the ventricle – VEN) to outlet (close to the aortic sac – AOS). The portion of the cardiac cycle that was modeled (t*=0.3 to t*=0.74) is also marked. The figure depicts in a 2D plot the peristaltic-like motion of the OFT wall.
A convergence study was performed to ensure that the meshes employed in the CFD model of the OFT were appropriate. Our subject-specific model used a total of 52,887 FCBI elements that rendered 55,744 nodes. We refined the mesh to 221,184 elements and 228,241 nodes, and found that computed velocities change by at most 0.6%. We thus concluded that our results were converged and the meshes employed appropriate for CFD simulations of the OFT.
3.2 OFT Model Simulation
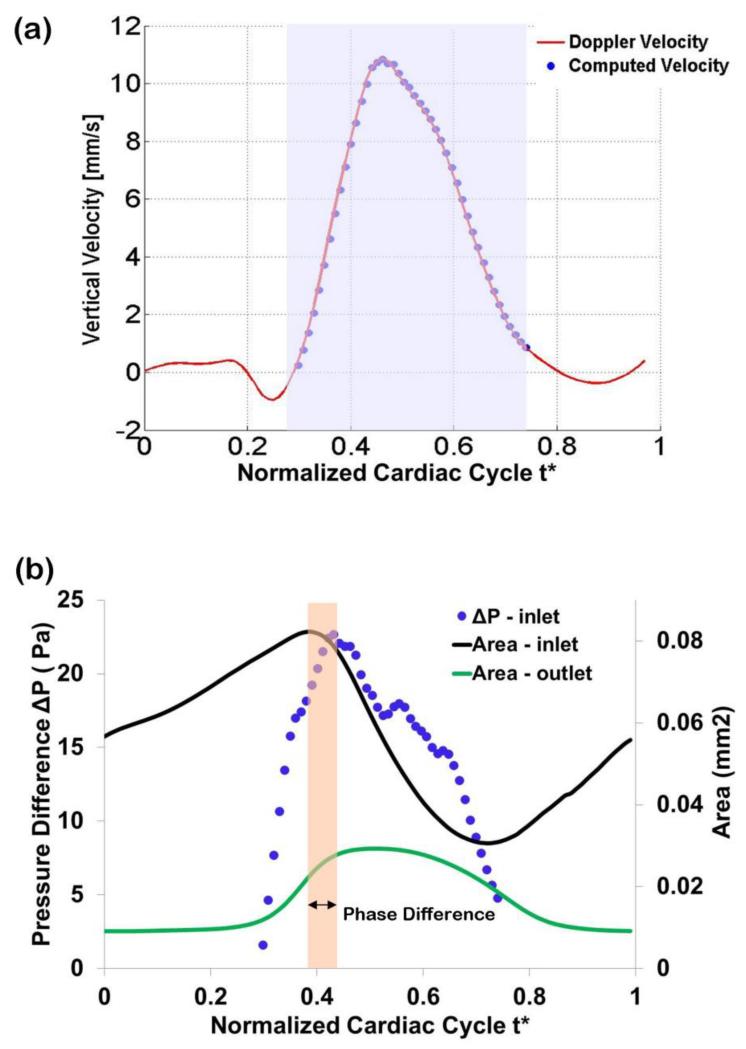
The subject-specific model of the chick embryonic heart OFT replicated measured Doppler OCT velocities over time at the selected point q (see Figure 6a). This was of course expected since we optimized the CFD normal traction boundary conditions (the imposed ΔP) so that CFD computed velocities reproduced Doppler OCT measured velocities (<1% difference) at point q.
Figure 6.
Optimized vertical velocity and pressure drop obtained from the subject-specific OFT model. (a) Comparison of measured Doppler velocity (solid line) and CFD computed velocity (circles) at the selected location (point q, see Figure 2). The shaded region depicts the portion of the cardiac cycle simulated. (b) Computed pressure drop, ΔP, versus model inlet and outlet lumen cross-sectional areas. The phase difference between maximal cross-sectional area at the OFT inlet (t* = 0.38) and maximal ΔP (t* = 0.44) was about 6% of the cardiac cycle, with maximal inlet area preceding the maximal ΔP.
The computed pressure drop (ΔP) between the inlet and the outlet of the OFT increased first as the OFT walls expanded, reached a maximum, and then decreased when the OFT walls were closing (see Figure 6b). The peak in ΔP occurred just after the lumen area at the OFT model inlet reached a maximum, which was expected from previous measurements (Shi et al 2013). The time difference between maximum inlet lumen area and maximum computed ΔP was 6% of the cardiac cycle (Figure 6b). In (Shi et al 2013) this time difference was reported to be 16±8%. Thus our model results lie within previously measured parameters. The optimized ΔP was relatively smooth, especially in the first and last portions of the computed time range: t* = 0.3 to t* = 0.44; and t* = 0.6 to t* = 0.74. There was a portion of the computed cardiac cycle (t* = 0.44 to t* = 0.6), however, in which ΔP was not smooth, with few, albeit small ‘jumps’. These ‘jumps’ could be due to the dynamic motion of the OFT geometry, and/or inaccuracies in segmentation of the OFT. The relatively small jumps, however, should not significantly affect the accuracy of calculations.
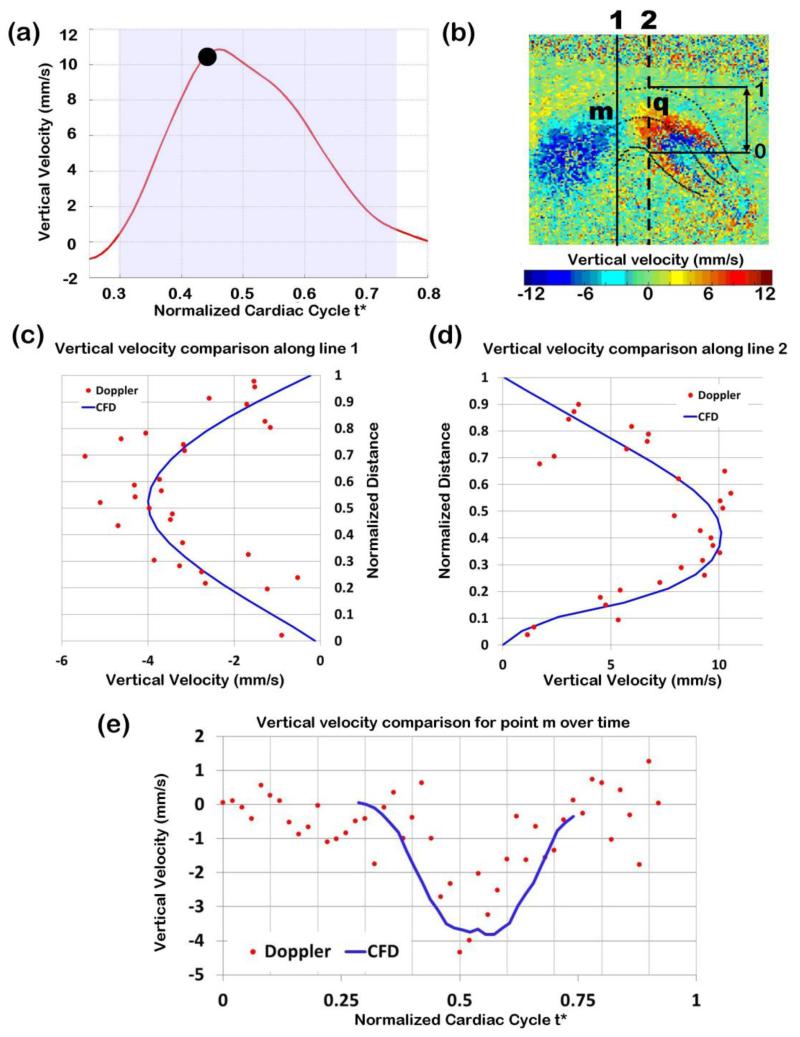
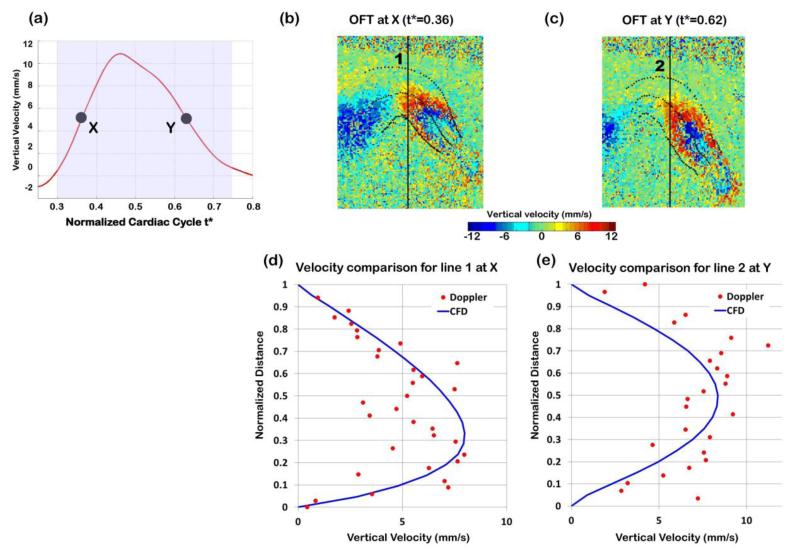
We compared computed and measured blood flow velocities at different positions within the OFT lumen (which were not used in the optimization). Note that because measured Doppler OCT velocities were noisy, we did not expect an exact velocity match, but rather an approximate match of the velocity profile over space or time. Measured and computed velocities were first compared when the OFT was most expanded (t* = 0.47), and velocity was maximum (see Figure 7a to 7d). We also compared measured and computed velocity data over the cardiac cycle for one point within the lumen (point m in Figure 7b), which was not used in the optimization (see Figure 7e). Finally, measured and computed velocities were compared during OFT opening (t* = 0.36) and closing (t* = 0.62) phases (see Figure 8). Measured and computed velocity data agreed well (<15% difference).
Figure 7.
Comparison of Doppler velocity and CFD computed velocities. (a) Vertical velocity measured at point q over time, with the time analyzed (t*=0.47) marked. (b) Doppler velocity image of the expanded OFT configuration, depicting the lines along which Doppler velocities were compared with CFD computed velocities. (c) and (d) Comparison of raw Doppler velocity data (red dots) versus CFD computed velocity (blue solid line): (c) along a line close to the OFT inlet (black solid line in b); and (d) along a line passing through the selected point q (black dotted line in b). Note that the vertical velocities depicted change signs due to the OFT curvature: velocity is upward close the OFT inlet (showing as negative velocities in c) and downwards towards the OFT outlet (showing as positive velocities in d). Distances in (c) and (d) were normalized to the OFT lumen width (distance between the lower lumen boundary and the upper lumen boundary) at the corresponding position. (e) Comparison of Doppler and CFD velocities at point m (shown in (b)) over time from t*=0.3 to t*=0.74.
Figure 8.
Comparison of Doppler velocity and CFD computed velocities when the OFT was opening (t* = 0.36) and closing (t* = 0.62). (a) Vertical velocity measured at point q over time, with times analyzed marked. (b) and (c) Doppler velocity data from OCT depicted on longitudinal sections of the OFT during opening (t* = 0.36) and closing (t* = 0.62), respectively. (d) and (e) Comparison of Doppler velocity data (red dots) versus CFD computed velocity (blue solid line) along a line passing through the selected point q when (d) the OFT is opening and (e) the OFT is closing.
3.3 Blood Flow Velocity in the OFT
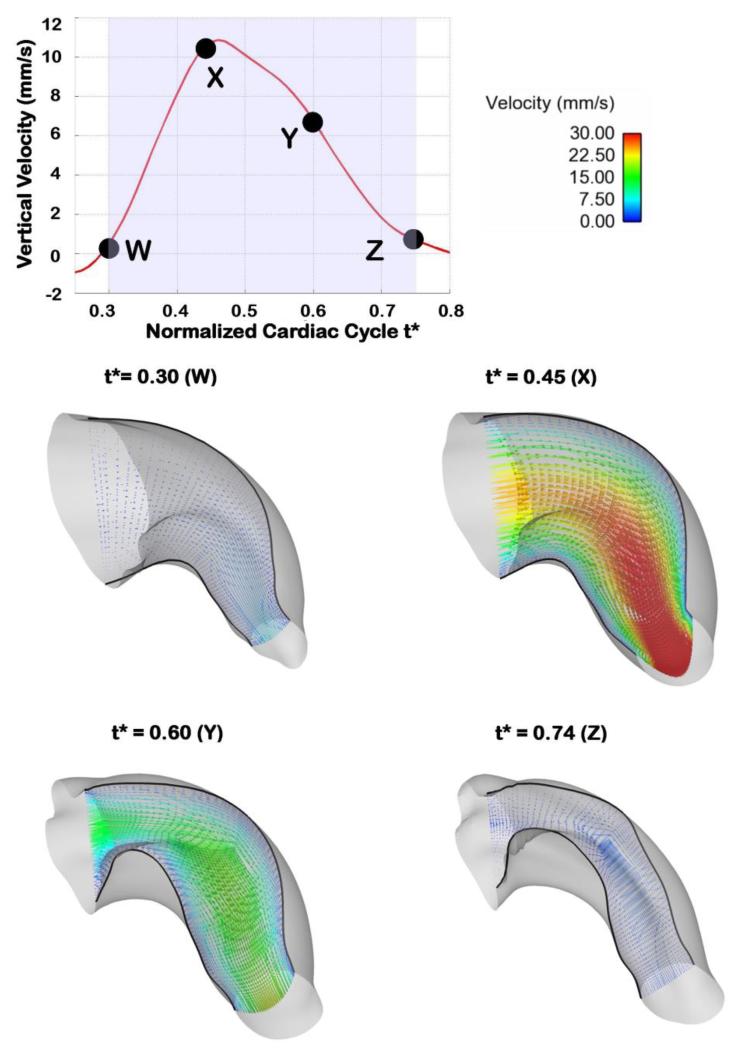
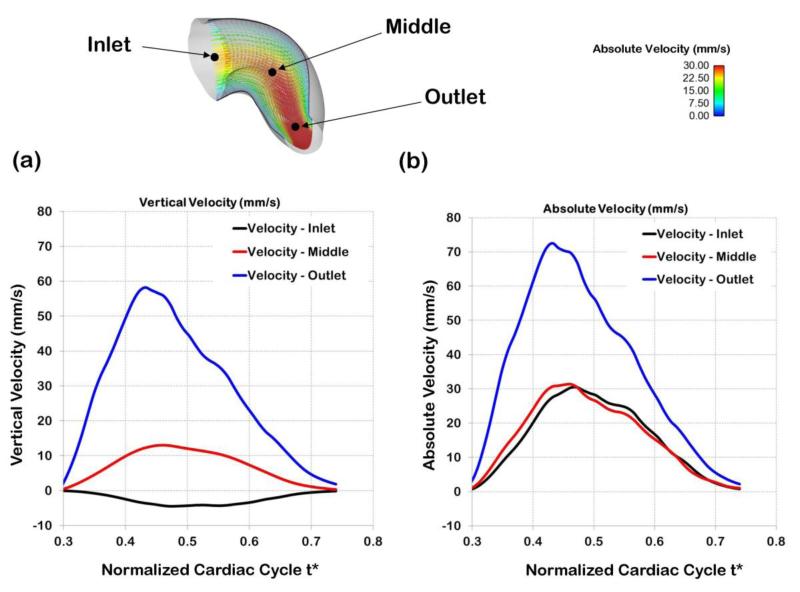
Our subject-specific embryonic heart model reveals the distinctive, dynamic characteristics of blood flow within the heart OFT over the cardiac cycle. As expected, in the modeled portion of the cardiac cycle (t* = 0.3 to t* = 0.74), blood flow rate first increases as the OFT walls expand, then reaches a maximum, and then blood flow rate decreases as the OFT walls contract and the lumen closes (see Figure 9). The OFT 3D curvature and presence of cushions (protrusions of the OFT wall toward the lumen that act as primitive valves), affect velocity profiles. Flow Reynolds number (Re) remain small (maximum Re was 4.2), and there are no evident flow recirculation regions within the OFT. Since the OFT is a tapered tube, velocity magnitudes increase towards the OFT outlet (see Figure 10). The velocity magnitudes at the inlet and at the mid OFT attain a maximum of approximately 32 mm/s (close to the OFT centerline), while the magnitude of the velocity at the outlet reaches a maximum of approximately 72 mm/s. Maximum velocities occur when the OFT walls are most expanded. These results are consistent with previous reports from simulations (Liu et al 2011; Liu et al 2012) and experimental data (Oosterbaan et al 2009; Midgett et al 2014).
Figure 9.
OFT velocity vectors over the cardiac cycle. The top plot shows the vertical velocity at the selected point q, and depicts the times in the cardiac cycle at which 3D plots of blood flow velocity are shown. The four bottom graphs show velocity vectors along a slice through a longitudinal section of the OFT, at distinct normalized times over the portion of the cardiac cycle simulated. The length and coloring of the velocity vectors are based on the velocity magnitude and the boundaries of the longitudinal slice are shown with black solid lines.
Figure 10.
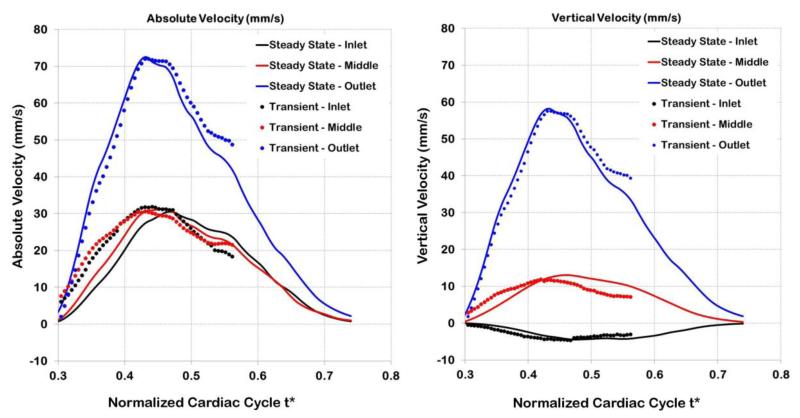
Comparison of centerline velocities at different points along the OFT. The points chosen for comparison (inlet, middle, outlet) are shown on top. The middle point corresponds to the point q selected and used in the optimization procedure. (a) Vertical velocities at the three locations over the portion of the normalized cardiac cycle considered for computations (t* = 0.3 to t* = 0.74). Vertical velocities at the inlet are negative, as opposed to the middle and outlet velocities, due to the OFT geometry and the sign convention used in this work. (b) Absolute velocities (velocity magnitudes) at three locations along the OFT over the modeled portion of the cardiac cycle.
3.4 Wall Shear Stresses
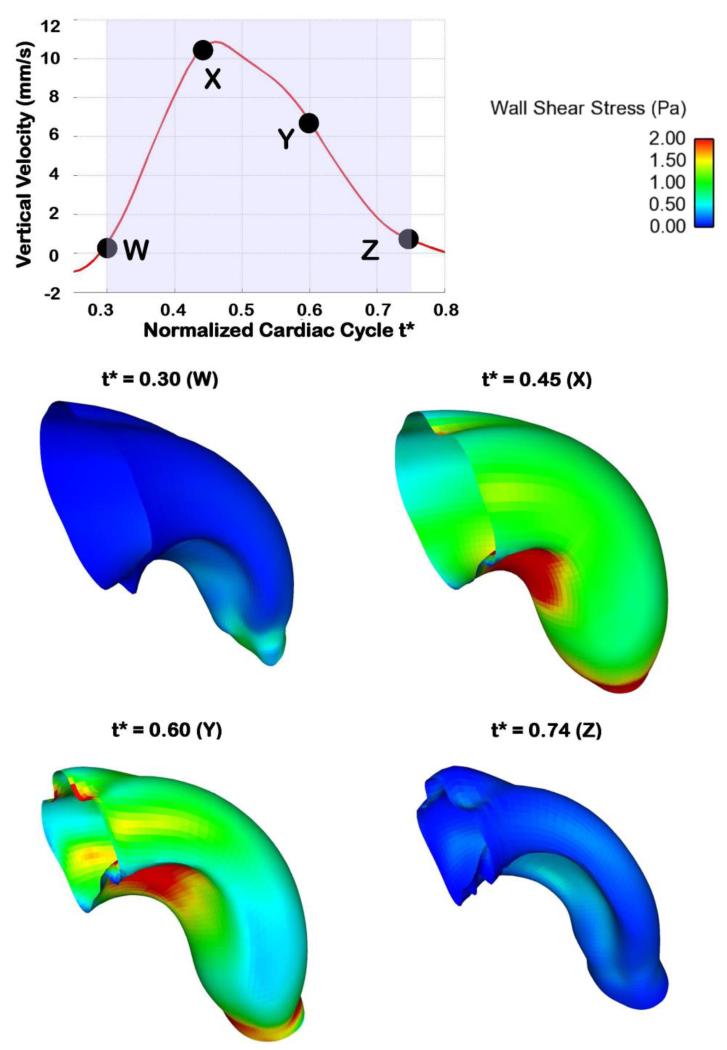
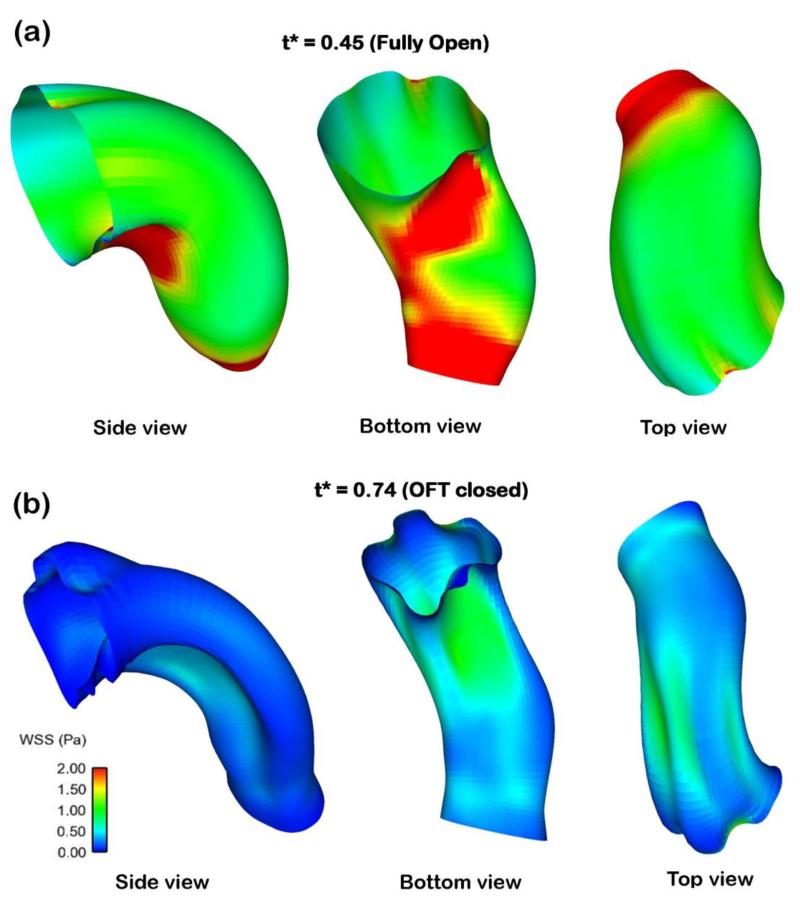
Computed OFT wall shear stress (WSS) distributions over time were consistent with changes in blood flow rate (see Figure 11), with maximal WSS attained at peak flow conditions. WSS ranged from 0-4.5 Pa, with the WSS being heterogeneously distributed over the OFT wall surface. Regions of higher WSS were found on the cushion surface, in particular on the OFT cushion close to the inner curvature (see Figures 11 and 12). This is consistent with our previous reports (Liu et al 2007; Liu et al 2012). Near the OFT outlet WSS was more uniformly distributed along the lumen-wall surface.
Figure 11.
Wall shear stress (WSS) distributions in the OFT at representative times over the portion of the normalized cardiac cycle simulated. The WSS over the OFT ranges from 0 to 4.5 Pa.
Figure 12.
Non-uniform WSS distributions on the OFT lumen-wall surface. The figures depict the OFT under different points of view (coordinate rotation) to better appreciate the heterogeneous spatial distribution of WSS. (a) WSS depicted in a fully open OFT configuration. (b) WSS for a contracted OFT configuration.
4 Discussion
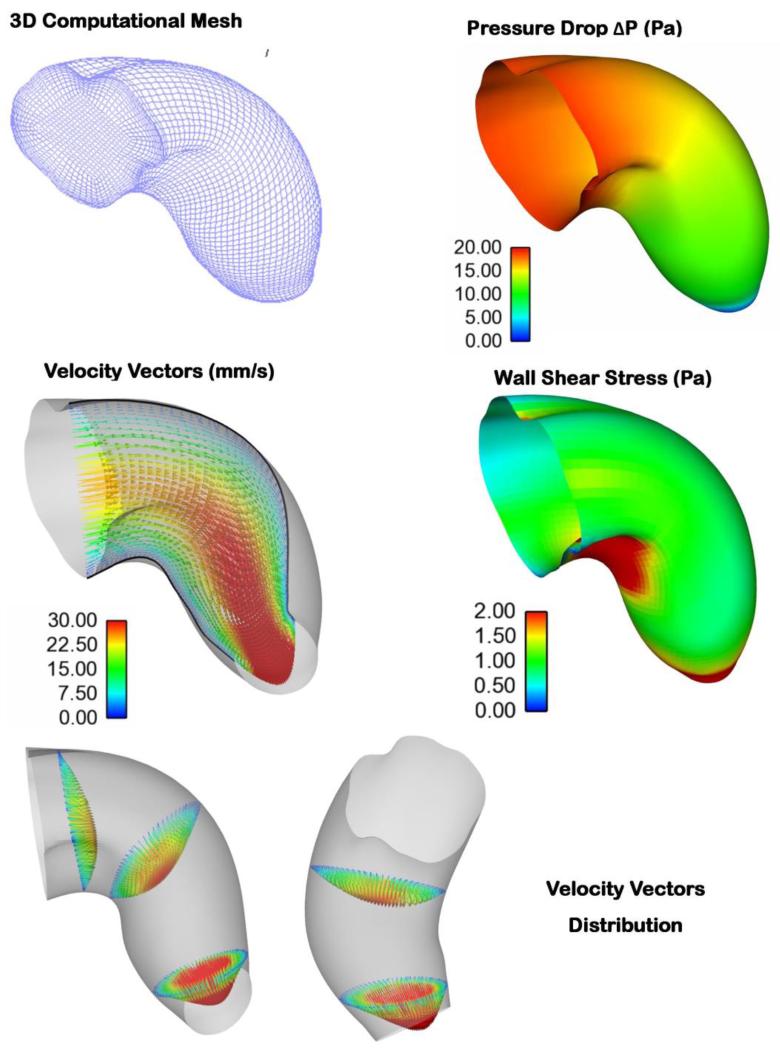
In this paper, we present an inverse-based strategy to model embryo-specific cardiac blood flow dynamics. Instead of imposing inlet and outlet boundary conditions, which are unknown in the OFT, we used internal velocity data in an iterative, inverse model procedure to find the boundary conditions that minimize the difference between computed and measured velocities at one point within the OFT lumen. Our model is unique in that it uses the dynamic embryo-specific OFT lumen wall geometry and measured blood flow velocities (from one point), obtained from OCT imaging. The OFT lumen wall surface geometry was reconstructed from OCT images (Liu et al 2012) and an in-house written image segmentation program (Yin et al 2012). Because OCT simultaneously provides both structural images and Doppler data, we chose a point q within the OFT lumen to extract blood flow Doppler velocity data over time (see Figure 2). Smoothed OCT velocity data were then used in an optimization procedure to determine proper boundary conditions (ΔP) in our model. The computations were limited to about 40% of the cardiac cycle, when there was significant blood flow within the OFT (see Figures 2 and 6). A summary of results during maximum OFT expansion is presented in Figure 13. Because we used both embryo-specific geometry and blood flow velocity, our model can be used in the future to study biological variations in blood flow as well as embryo-specific effects of interventions that alter blood flow dynamics.
Figure 13.
Various hemodynamic parameters depicted for the fully expanded OFT configuration. The figure depicts the OFT mesh, pressure drop, velocity vectors, WSS distributions along the OFT geometry, and 3D velocity profiles at three cross-sections along the OFT geometry. (Bottom left) Side View: Flow is from left to right; (Bottom right) Top View: Flow is from top to bottom.
4.1 Limitations of OCT Doppler Velocity Measurements
Doppler OCT measurements, while extremely useful for hemodynamic analysis, do not reveal all the details of blood flow within the embryonic heart. Limitations of Doppler OCT include: i) only one component (Vz) of the 3D velocity vector is measured, ii) phase wrapping, and iii) data noise. Because only Vz is measured (the velocity in the direction of the OCT beam, vertical direction in our B-mode images), a complete 3D representation of blood flow in the OFT over the cardiac cycle does not directly emerge from Doppler OCT measurements. Other measurements (e.g. imaging the embryo from other directions) would need to be performed to obtain more flow information, but this is not practical and would add additional challenges. Needless to say, no Doppler data emerges from regions in which flow is perpendicular to the OCT beam, leaving gaps in velocity data within the OFT. Assumptions need to be made to obtain the 3D velocity vectors from Doppler OCT data, see e.g. (Ma et al 2010).
Phase wrapping and noise also need to be considered. Noise can be reduced through smoothing and noise-reduction strategies such as those implemented in this paper. Phase wrapping occurs when the measured phase, Δφ, from which Vz is calculated (see Equation 1), exceeds its limiting value of ±π, in which case it will change sign. The sudden change in sign of Δφ, which translates into a change in the sign of VZ (in our system around ± 12 mm/s, see Equation 1), leads to inaccurate velocity data. While unwrapping techniques are available (Zebker and Goldstein 1986; Ma et al 2010), when Δφ exceeds its limiting value it becomes less accurate than when Δφ is within ±π (Ma et al 2010; Liu et al 2012). This eventually leads to signal “wash-out” (or loss of signal) in regions in which velocity is very high. Measured Doppler data is therefore more accurate when obtained from regions that do not show wrapping. Hence, we chose to extract Doppler velocities from a point within the OFT lumen (point q) at which wrapping did not occur, and maximal VZ were slightly below the threshold velocity (12 mm/s) to increase the signal to noise ratio.
Due to limitations in velocity measurements, we chose to complement Doppler OCT measurements with CFD modeling to elucidate the 4D blood flow dynamics in the OFT. In addition, CFD modeling enabled extraction of WSS, which stimulate endocardial cell signals leading to heart growth and remodeling.
4.2 Model Validation
To increase our confidence in the CFD model results, and determine their accuracy, validation was necessary. To this end we compared CFD results to: i) measured velocity data at points/regions not used for optimization (i.e. other than point q); ii) measured pressure data; and iii) results from a dynamic CFD model. These comparisons are discussed in what follows.
4.2.1 Velocity
CFD blood flow velocity results where compared to Doppler velocity data from the same embryo and to velocity values obtained in independent studies. As expected, our optimization algorithm was successful in reproducing vertical velocities at the point q within 1% of the measured Doppler data (see Figure 6a). Comparisons of CFD and measured velocities at regions not used in the optimization (outside of point q) showed good agreement. CFD velocity profiles were comparable to measured Doppler velocities along lines that span the OFT, as did the velocity at one point (different than q) over time (see Figures 7 and 8). The computed velocities approximately follow the measured velocity profile, including perceived symmetries of the profiles. The average root square difference between measured and computed velocities was 1.6 mm/s (< 14% of the maximum velocity), which is reasonable given the amount of Doppler data noise (~18% of typically measured maximum velocities). It is worth mentioning that only one component of the velocity vector, Vz, was compared. Experimentally acquiring the other components, Vx and Vy, would not be practical using OCT, and those components were therefore not validated. Nevertheless, we conclude that the choice of a constant normal traction (ΔP) applied at the inlet surface, which leads to relatively small differences between measured and computed vertical velocities, was a good choice of optimized boundary condition.
Computed results were also comparable to other measurements in the chick embryonic OFT. The maximum velocity obtained here, ~ 32 mm/s at the selected point q, is comparable to the reported values of 40.2±5.7 mm/s at a similar location by Midgett et al. (Midgett et al 2014). Further, the velocities are similar to other previously published values (Oosterbaan et al 2009; Ma et al 2010; Liu et al 2011). The advantage of the presented simulations is that we can determine the chick specific blood flow dynamics distribution, and hence WSS distributions, from subject-specific 4D geometry and velocities. Our model therefore enables computations of subject-specific blood flow velocities within individual chick hearts.
4.2.2 Pressure
Using our optimized embryo-specific CFD model of the OFT, we determined the pressure drop, ΔP, between the inlet and outlet of the OFT over time during the cardiac cycle. The maximum ΔP obtained was about 23 Pa, and changed smoothly and linearly from the OFT inlet to the OFT outlet (see Figure 13). In our models, ΔP increased faster during OFT expansion and then decreased more slowly as the OFT walls were contracting (see Figure 6b). Note that the computed ΔP strongly depends on the velocity values used as input in the model. Uncertainties in the velocities, mainly due to noise in the Doppler velocity measurements, influenced the computed ΔP. Given the small differences between measured and CFD computed velocities, we do expect that the computed ΔP over time is a reasonable estimation of actual pressure drops in the OFT.
We compared the computed ΔP to our previous measured data on blood pressure in the ventricle and aortic sac of chicken embryonic hearts at HH18 (Shi et al 2013). Directly measuring the stage HH18 chick-specific blood pressure drop (ΔP) in the OFT is extremely challenging. This is because pressure measurements in the embryonic heart involve precisely inserting a micropipette into the center of the cardiac lumen (< 400 μm diameter) without damaging the cardiac wall (Keller et al 1991; Hu and Keller 1995; Chabert and Taber 2002; Shi et al 2013). Other difficulties include precise system calibration and controlling data to noise ratios. To circumvent these challenges, our group has measured individual pressures in the ventricle and, separately (for other embryos) in the aortic sac of chicken embryos. Pressure data was acquired simultaneously with ECG data, which allowed synchronization of pressure measurements, and thus estimation of pressure differences (Shi et al 2013). Maximum measured ventricle-aortic sac pressure difference using this technique was 85 ± 50 Pa (uncertainties are due to uncertainties in measured pressure and measured phase lags, as well as biological variations). To estimate ΔP in the OFT, Liu et al extended the OFT model to portions of the heart that were not modeled (e.g. the ventricle and aortic sac), and compared CFD velocity results with measured velocity results (Liu et al 2011). They concluded that maximum ΔP in the OFT of normal HH18 embryos is about 20 Pa and used this ΔP in models that reproduced measured velocities fairly well (Liu et al 2007; Liu et al 2012). Our obtained maximum value of ΔP (23 Pa), agrees very well with these previous studies.
We note that we did not obtain absolute pressure values from our inversion methodology. This is because at each time step we used a quasi-steady approximation (rigid walls, no wall velocity, no transient terms). Therefore, while the position of lumen walls change over time, at each time step velocity depended only on the pressure difference between inlet and outlet (as well as blood properties and the OFT geometry), not the actual pressure. This choice does not affect the blood flow velocity distribution within the OFT obtained, nor OFT wall motion (we have not included fluid-wall effects in our model). Similarly, the choice of blood viscosity (μ) in our models affect ΔP and WSS (by a scaling factor), but does not affect velocity distributions within the OFT model nor wall shear rates. Our proposed inverse methodology enables accurate estimation of blood flow characteristics.
4.2.3 Static versus Dynamic Modeling
The optimization procedure described in this paper was performed under the assumption of quasi-steady conditions. Quasi-steady assumptions neglect effects of flow inertia (transient terms in the Navier-Stokes equations) as well as the instantaneous velocity of the walls (walls are assumed fixed and rigid at each time step). Changes in blood flow over the cardiac cycle were therefore computed as a sequence of steady flow computations with changing geometry. These assumptions need to be validated. Given the small dimensions of the embryonic heart OFT and relatively low velocities, with small Reynolds (Re) and Womersley (Wo) numbers (Re < 5; Wo < 0.5), blood flow in the OFT is dominated by viscous forces with negligible inertia. The OFT wall motion is mainly radial, with radial displacement from the most contracted to the most expanded configuration, u, being about 0.15mm. Radial wall velocity may be estimated as, vr = u/(T/4) = 1.7 mm/s, where T is the period of the cardiac cycle (T = 350ms). The estimated vr < 2mm/s, is still much smaller than the fluid velocity (30 – 70 mm/s at peak expansion), and thus may be neglected. When flow through the OFT is just starting or stopping, and flow velocities are small, however, radial velocities are no longer negligible. Therefore, our models should provide a good description of blood flow dynamics within the OFT except when flow is starting or about to end (near t* = 0.3 or t* = 0.74). We are neglecting also energy transfer from the wall to the flow of blood during contraction and from the flow to the wall during expansion. We emphasize that while in the quasi-steady computations there was no wall velocity, the change in OFT geometry (wall expansion/contraction) among time steps was taken into account.
To better assess the validity of the quasi-steady assumption in the embryo specific chick OFT model, we simulated the fully dynamic system (transient terms and wall velocities were included). For the dynamic simulation, we used the pressure drop ΔP obtained from the optimization procedure as a known boundary condition, and performed a transient CFD simulation over a portion of the cardiac cycle (t* = 0.3 to t* = 0.56), comprising OFT expansion and a portion of the wall contraction phase. The absolute and vertical velocities from the transient and quasi-steady simulations were similar (see Figure 14). Relative differences in velocities ranged from 2% to 8% for vertical and absolute velocities, respectively. As expected, larger differences were found at the beginning of the simulations (t* = 0.3) since wall motion cannot be neglected (i.e. the quasi-steady approximation is not accurate) when axial OFT velocities are small. Overall, however, there is good agreement between quasi-steady and transient simulations, which argues in favor of the negligible effect of inertia in our models.
Figure 14.
Comparison of transient and quasi-steady computations. The transient model is fully dynamic and includes effects of flow inertia and OFT wall velocities as they expand and contract. Velocities are compared at three points within the OFT lumen: close to the OFT model inlet, around the middle of the OFT (at point q) and near the model outlet.
4.2.4 Concluding Remarks on Model Validation
Our subject-specific CFD models of the embryonic chick heart OFT provide a unique tool for hemodynamic analyses. Agreement between measured and computed velocities, as well as measured and computed pressure drop characteristics, is evidence that our CFD models provide a good description of the temporal and spatial distribution of blood flow velocities within the chick embryonic OFT. This, in turn, increases our confidence in the WSS data obtained from our CFD models.
4.3 Wall Shear Stresses
Our CFD models provide a platform for analyzing WSS and unravel how changes in WSS affect cardiac development. Asymmetrical distributions of flow along the OFT, resulting in non-uniform distributions of WSS (see Figures 11, 12 and 13) might have important implications for cardiac development. WSS has long been recognized to be important for endothelial and endocardial cell function (Groenendijk et al 2005; Egorova et al 2011; Ten Dijke et al 2012). However, while researchers agree that WSS is an important contributor to cardiac development (Taber 1998; Groenendijk et al 2004; Santhanakrishnan and Miller 2011; Goenezen et al 2012), how WSS affects heart development is still not well understood. This is in part due to difficulties measuring or computing WSS in vivo in the embryonic heart.
Spatial and temporal WSS distributions were obtained using our CFD model of the OFT. Deriving WSS directly from measured velocities (by measuring velocity profiles) is difficult to achieve experimentally and typically relies on assumptions. Note that WSS (which is the projection of the traction fluid force vector on the surface of the OFT lumen) depend both on the wall geometry and gradients of flow velocity away from the wall, and thus the 3D velocity field and 3D geometry. CFD modeling enhances and complements Doppler OCT measurements, ensuring a complete 4D characterization of cardiac flows and WSS.
The spatial distribution of WSS in the OFT is non-uniform, which implies locally varying stimuli on endocardial cells. For example, the maximum WSS occurs at the lower cushion, located on the inner curvature (see Figures 11 and 12). This agrees with the velocity distribution, which is skewed towards the inner curvature (Figures 9 and 13). Since the OFT is a tapered tube, the WSS close to the OFT outlet are elevated due to higher velocity magnitudes in a smaller cross-sectional area. Additionally, the WSS at the OFT outlet becomes more uniform, because close to the aortic sac cross-sections become more circular. Thus, the shape of the OFT, including the presence of OFT cushions, affect the distribution of hemodynamic stimuli on cardiac cells.
Our simulations indicate that WSS over the entire OFT ranges from 0 - 4.5 Pa. Previous studies (Midgett et al 2014) estimated a maximal WSS of ~1 Pa near the central region of the OFT (based on measured Doppler OCT velocities and assuming Poiseuille flow conditions). This estimation does not account for the presence of cushions and changing curvature. However, barring the inner curvature and inner cushion region, the WSS values obtained by our CFD simulations are close to the 1 Pa estimate in the central region. Other research groups estimated WSS of around 2.1 Pa (Poelma et al 2010) to 3 Pa (Liu et al 2007). The values of WSS estimated here are furthermore within WSS levels reported to be detectable by endothelial and endocardial cells (Dekker et al 2002; Groenendijk et al 2004; Groenendijk et al 2005; Poelma et al 2010), emphasizing the importance of WSS in cardiac development.
4.4 Implications for cardiac function
Our CFD model results show that maximum blood flow velocities and WSS occur when the OFT is most expanded. These results agree with our previous reports from OCT measurements (Liu et al 2007; Liu et al 2012; Shi et al 2013; Midgett et al 2014). As the OFT walls expand, resistance to flow decreases, and thus having maximum flow when the OFT lumen area is maximal implies that flow through the OFT minimizes energy loss. OFT wall motion occurs as a combination of active myocardial contraction and wall interactions with the flow of blood, which is mainly driven by ventricular contraction. At HH18, the chick ventricle contracts almost simultaneously (unpublished observations), while the OFT presents a peristaltic-like wall motion. As blood exits the ventricle at high pressure during ventricular contraction, the OFT walls expand likely in response to the pressure of blood flow. Once blood flow decreases, the OFT walls start contracting until the OFT lumen closes to avoid retrograde flow back to the ventricle. The factors that regulate this behavior are not fully understood. Both mechanics (interaction between blood flow and wall motion) and biology (the conduction system and myocardial contraction) play a role. This behavior is altered by temperature, backflow is observed when the embryos get cold (unpublished observation), and mechanical interventions, wall contraction through the OFT is faster in embryos with outflow tract banding (Shi et al 2013). From the perspective of cardiac performance, our results suggest that ventricular cardiac contraction and flow through the OFT, and therefore pumping of blood to the body, are optimized in the embryo.
5 Conclusion
The inverse modeling procedure presented in this paper provides a unique framework to study the hemodynamics of chick specific embryonic hearts. The results of this study agreed with experimental observations, providing confidence in the models. Computations of blood flow dynamics in the developing heart can therefore be used to achieve an accurate, 4D characterization of hemodynamic conditions during cardiac development. Further, hemodynamic computational models of the developing heart can complement experimental data to more accurately and completely quantify cardiac hemodynamics. Since the models presented here are embryo-specific (using both embryo-specific geometry and velocity data), they can further be used to study biological differences among embryonic hearts, and, more importantly, hemodynamic changes that occur when interventions to alter blood flow dynamics in the developing heart are performed. Our CFD models therefore promise to enable a complete characterization of blood flow dynamics in the developing heart under normal and altered hemodynamic conditions, an essential (and yet missing) part in the study of cardiac malformations due to altered blood flow.
The presented models constitute a proof-of-principle of subject-specific embryonic cardiac hemodynamic simulations. In the future, our CFD models of the OFT could be extended and expanded. We chose to study the hemodynamics in the embryonic heart OFT, but the models can be extended to models of the whole heart, although in this case transfer of energy from the ventricle wall during contraction should be considered. To reduce uncertainties associated with using velocity data from one point within the lumen, the models can be extended to optimize computed velocities from measured velocities within a region or several different regions in the lumen. This is clearly a more involved model, and implementation will depend on the relative cost-benefit of such models. Uncertainties can also be significantly reduced if noise is reduced in OCT measurements. Nevertheless, our models are robust even when OCT imaging and Doppler data were noisy, suggesting that a complete hemodynamic characterization of blood flow in the embryonic developing heart is now possible.
Acknowledgements
This work has been supported in part by grants NIH R01 HL094570 and NSF DBI-1052688. The content is solely the responsibility of the authors and does not necessarily represent the official views of grant giving bodies. Computations were performed on the OHSU-Exacloud cluster. The authors thank Robert Stites of OHSU and Karthik Gururaj of Intel for their invaluable assistance in troubleshooting and working with the Exacloud cluster used for the computations presented.
References
- Al-Roubaie S, Jahnsen ED, Mohammed M, et al. Rheology of embryonic avian blood. Am J Physiol Heart Circ Physiol. 2011;301:H2473–81. doi: 10.1152/ajpheart.00475.2011. doi: 10.1152/ajpheart.00475.2011. [DOI] [PubMed] [Google Scholar]
- Azhar M, Schultz JEJ, Grupp I, et al. Transforming growth factor beta in cardiovascular development and function. Cytokine Growth Factor Rev. 2003;14:391–407. doi: 10.1016/s1359-6101(03)00044-3. doi: 10.1016/S1359-6101(03)00044-3. [DOI] [PMC free article] [PubMed] [Google Scholar]
- Bartelings MM, Gittenberger-de Groot a C. Morphogenetic considerations on congenital malformations of the outflow tract. Part 1: Common arterial trunk and tetralogy of Fallot. Int J Cardiol. 1991;32:213–30. doi: 10.1016/0167-5273(91)90329-n. [DOI] [PubMed] [Google Scholar]
- Bartman T, Hove J. Mechanics and function in heart morphogenesis. Dev Dyn. 2005;233:373–81. doi: 10.1002/dvdy.20367. doi: 10.1002/dvdy.20367. [DOI] [PubMed] [Google Scholar]
- Bathe K-J, Zhang H. A flow-condition-based interpolation finite element procedure for incompressible fluid flows. Comput Struct. 2002;80:1267–1277. doi: 10.1016/S0045-7949(02)00077-9. [Google Scholar]
- Bharadwaj KN, Spitz C, Shekhar A, et al. Computational fluid dynamics of developing avian outflow tract heart valves. Ann Biomed Eng. 2012;40:2212–2227. doi: 10.1007/s10439-012-0574-8. doi: 10.1007/s10439-012-0574-8. [DOI] [PMC free article] [PubMed] [Google Scholar]
- Biechler SV, Junor L, Evans AN, et al. The impact of flow-induced forces on the morphogenesis of the outflow tract. Front Physiol. 2014;5:1–14. doi: 10.3389/fphys.2014.00225. doi: 10.3389/fphys.2014.00225. [DOI] [PMC free article] [PubMed] [Google Scholar]
- Brand T. Heart development: molecular insights into cardiac specification and early morphogenesis. Dev Biol. 2003;258:1–19. doi: 10.1016/s0012-1606(03)00112-x. doi: 10.1016/S0012-1606(03)00112-X. [DOI] [PubMed] [Google Scholar]
- Bruneau BG. The developmental genetics of congenital heart disease. Nature. 2008;451:943–8. doi: 10.1038/nature06801. doi: 10.1038/nature06801. [DOI] [PubMed] [Google Scholar]
- Chabert S, Taber L a. Intramyocardial pressure measurements in the stage 18 embryonic chick heart. Am J Physiol Heart Circ Physiol. 2002;282:H1248–54. doi: 10.1152/ajpheart.00364.2001. doi: 10.1152/ajpheart.00364.2001. [DOI] [PubMed] [Google Scholar]
- Chandran K, Udaykumar H, Reinhardt J. Image-Based Computational Modeling of the Human Circulatory and Pulmonary Systems. Springer; 2011. [Google Scholar]
- Chandran K, Vigmostad S. Patient-specific bicuspid valve dynamics: overview of methods and challenges. J Biomech. 2013;46.2:208–216. doi: 10.1016/j.jbiomech.2012.10.038. [DOI] [PMC free article] [PubMed] [Google Scholar]
- Clark E, Rosenquist G. Spectrum of cardiovascular anomalies following cardiac loop constriction in the chick embryo. Birth Defects Orig. Artic. Ser. 1977 [PubMed] [Google Scholar]
- Dekker RJ, van Soest S, Fontijn RD, et al. Prolonged fluid shear stress induces a distinct set of endothelial cell genes, most specifically lung Krüppel-like factor (KLF2) Blood. 2002;100:1689–98. doi: 10.1182/blood-2002-01-0046. doi: 10.1182/blood-2002-01-0046. [DOI] [PubMed] [Google Scholar]
- Egorova AD, Khedoe PPSJ, Goumans M-JTH, et al. Lack of primary cilia primes shear-induced endothelial-to-mesenchymal transition. Circ Res. 2011;108:1093–101. doi: 10.1161/CIRCRESAHA.110.231860. doi: 10.1161/CIRCRESAHA.110.231860. [DOI] [PMC free article] [PubMed] [Google Scholar]
- Freund JB, Goetz JG, Hill KL, Vermot J. Fluid flows and forces in development: functions, features and biophysical principles. Development. 2012;139:1229–45. doi: 10.1242/dev.073593. doi: 10.1242/dev.073593. [DOI] [PMC free article] [PubMed] [Google Scholar]
- Gaehtgens P, Schmidt F, Will G. Comparative rheology of nucleated and non-nucleated red blood cells. Pflugers Arch Eur J Physiol. 1981;390:278–282. doi: 10.1007/BF00658276. doi: 10.1007/BF00658276. [DOI] [PubMed] [Google Scholar]
- Gittenberger-de Groot AC, Bartelings MM, Deruiter MC, Poelmann RE. Basics of cardiac development for the understanding of congenital heart malformations. Pediatr Res. 2005;57:169–76. doi: 10.1203/01.PDR.0000148710.69159.61. doi: 10.1203/01.PDR.0000148710.69159.61. [DOI] [PubMed] [Google Scholar]
- Go AS, Mozaffarian D, Roger VL, et al. Heart disease and stroke statistics--2013 update: a report from the American Heart Association. Circulation. 2013;127:e6–e245. doi: 10.1161/CIR.0b013e31828124ad. doi: 10.1161/CIR.0b013e31828124ad. [DOI] [PMC free article] [PubMed] [Google Scholar]
- Goenezen S, Rennie MY, Rugonyi S. Biomechanics of early cardiac development. Biomech Model Mechanobiol. 2012;11:1187–204. doi: 10.1007/s10237-012-0414-7. doi: 10.1007/s10237-012-0414-7. [DOI] [PMC free article] [PubMed] [Google Scholar]
- Goetz JG, Steed E, Ferreira RR, et al. Endothelial cilia mediate low flow sensing during zebrafish vascular development. Cell Rep. 2014;6:799–808. doi: 10.1016/j.celrep.2014.01.032. doi: 10.1016/j.celrep.2014.01.032. [DOI] [PubMed] [Google Scholar]
- Granados-Riveron JT, Brook JD. The impact of mechanical forces in heart morphogenesis. Circ Cardiovasc Genet. 2012;5:132–42. doi: 10.1161/CIRCGENETICS.111.961086. doi: 10.1161/CIRCGENETICS.111.961086. [DOI] [PubMed] [Google Scholar]
- Groenendijk BCW, Hierck BP, Gittenberger-De Groot AC, Poelmann RE. Development-related changes in the expression of shear stress responsive genes KLF-2, ET-1, and NOS-3 in the developing cardiovascular system of chicken embryos. Dev Dyn. 2004;230:57–68. doi: 10.1002/dvdy.20029. doi: 10.1002/dvdy.20029. [DOI] [PubMed] [Google Scholar]
- Groenendijk BCW, Hierck BP, Vrolijk J, et al. Changes in shear stress-related gene expression after experimentally altered venous return in the chicken embryo. Circ Res. 2005;96:1291–8. doi: 10.1161/01.RES.0000171901.40952.0d. doi: 10.1161/01.RES.0000171901.40952.0d. [DOI] [PubMed] [Google Scholar]
- Groenendijk BCW, Van der Heiden K, Hierck BP, Poelmann RE. The role of shear stress on ET-1, KLF2, and NOS-3 expression in the developing cardiovascular system of chicken embryos in a venous ligation model. Physiology (Bethesda) 2007;22:380–9. doi: 10.1152/physiol.00023.2007. doi: 10.1152/physiol.00023.2007. [DOI] [PubMed] [Google Scholar]
- Hamburger V, Hamilton HL. A series of normal stages in the development of the chick embryo. J Morphol. 1951;88:49–92. [PubMed] [Google Scholar]
- Hogers B, DeRuiter MC, Gittenberger-de Groot a C, Poelmann RE. Unilateral vitelline vein ligation alters intracardiac blood flow patterns and morphogenesis in the chick embryo. Circ Res. 1997;80:473–81. doi: 10.1161/01.res.80.4.473. [DOI] [PubMed] [Google Scholar]
- Hove JR. Quantifying cardiovascular flow dynamics during early development. Pediatr Res. 2006;60:6–13. doi: 10.1203/01.pdr.0000219584.22454.92. doi: 10.1203/01.pdr.0000219584.22454.92. [DOI] [PubMed] [Google Scholar]
- Hove JR, Köster RW, Forouhar AS, et al. Intracardiac fluid forces are an essential epigenetic factor for embryonic cardiogenesis. Nature. 2003;421:172–7. doi: 10.1038/nature01282. doi: 10.1038/nature01282. [DOI] [PubMed] [Google Scholar]
- Hu N, Keller BB. Relationship of simultaneous atrial and ventricular pressures in stage 16-27 chick embryos. Am J Physiol. 1995;269:H1359–62. doi: 10.1152/ajpheart.1995.269.4.H1359. [DOI] [PubMed] [Google Scholar]
- Icardo JM. Developmental biology of the vertebrate heart. J Exp Zool. 1996;275:144–61. [PubMed] [Google Scholar]
- Jenkins M, Adler D, Gargesha M. Ultrahigh-speed optical coherence tomography imaging and visualization of the embryonic avian heart using a buffered Fourier Domain Mode Locked laser. Opt Express. 2007;15:6251–6267. doi: 10.1364/oe.15.006251. [DOI] [PMC free article] [PubMed] [Google Scholar]
- Jenkins MW, Rothenberg F, Roy D, et al. 4D embryonic cardiography using gated optical coherence tomography. Opt Express. 2006;14:736–48. doi: 10.1364/opex.14.000736. [DOI] [PubMed] [Google Scholar]
- Jones E a V, Baron MH, Fraser SE, Dickinson ME. Measuring hemodynamic changes during mammalian development. Am J Physiol Heart Circ Physiol. 2004;287:H1561–9. doi: 10.1152/ajpheart.00081.2004. doi: 10.1152/ajpheart.00081.2004. [DOI] [PubMed] [Google Scholar]
- Keller BB, Hu N, Serrino PJ, Clark EB. Ventricular pressure-area loop characteristics in the stage 16 to 24 chick embryo. Circ Res. 1991;68:226–231. doi: 10.1161/01.res.68.1.226. doi: 10.1161/01.RES.68.1.226. [DOI] [PubMed] [Google Scholar]
- Kowalski WJ, Teslovich NC, Dur O, et al. Computational hemodynamic optimization predicts dominant aortic arch selection is driven by embryonic outflow tract orientation in the chick embryo. Biomech Model Mechanobiol. 2012;11:1057–73. doi: 10.1007/s10237-012-0373-z. doi: 10.1007/s10237-012-0373-z. [DOI] [PubMed] [Google Scholar]
- Kowalski WJ, Teslovich NC, Menon PG, et al. Left atrial ligation alters intracardiac flow patterns and the biomechanical landscape in the chick embryo. Dev Dyn. 2014;243:652–662. doi: 10.1002/dvdy.24107. doi: 10.1002/dvdy.24107. [DOI] [PMC free article] [PubMed] [Google Scholar]
- Larina IV, Sudheendran N, Ghosn M, et al. Live imaging of blood flow in mammalian embryos using Doppler swept-source optical coherence tomography. J Biomed Opt. 2008;13:060506. doi: 10.1117/1.3046716. doi: 10.1117/1.3046716. [DOI] [PubMed] [Google Scholar]
- Lim J, Thiery JP. Epithelial-mesenchymal transitions: insights from development. Development. 2012;139:3471–86. doi: 10.1242/dev.071209. doi: 10.1242/dev.071209. [DOI] [PubMed] [Google Scholar]
- Liu A, Nickerson A, Troyer A, et al. Quantifying blood flow and wall shear stresses in the outflow tract of chick embryonic hearts. Comput Struct. 2011;89:855–867. doi: 10.1016/j.compstruc.2011.03.003. doi: 10.1016/j.compstruc.2011.03.003. [DOI] [PMC free article] [PubMed] [Google Scholar]
- Liu A, Rugonyi S, Pentecost JO, Thornburg KL. Finite element modeling of blood flow-induced mechanical forces in the outflow tract of chick embryonic hearts. Comput Struct. 2007;85:727–738. doi: 10.1016/j.compstruc.2007.01.014. [Google Scholar]
- Liu A, Wang R, Thornburg KL, Rugonyi S. Efficient postacquisition synchronization of 4-D nongated cardiac images obtained from optical coherence tomography: application to 4-D reconstruction of the chick embryonic heart. J Biomed Opt. 2009;14:044020. doi: 10.1117/1.3184462. doi: 10.1117/1.3184462. [DOI] [PubMed] [Google Scholar]
- Liu A, Yin X, Shi L, et al. Biomechanics of the chick embryonic heart outflow tract at HH18 using 4D optical coherence tomography imaging and computational modeling. PLoS One. 2012;7:e40869. doi: 10.1371/journal.pone.0040869. doi: 10.1371/journal.pone.0040869. [DOI] [PMC free article] [PubMed] [Google Scholar]
- Loots E, Hillen B, Veldman AEP. The role of hemodynamics in the development of the outflow tract of the heart. J Eng Math. 2003;45:91–104. [Google Scholar]
- Ma Z, Liu A, Yin X, et al. Measurement of absolute blood flow velocity in outflow tract of HH18 chicken embryo based on 4D reconstruction using spectral domain optical coherence tomography. Biomed Opt Express. 2010;1:798–811. doi: 10.1364/BOE.1.000798. doi: 10.1364/BOE.1.000798. [DOI] [PMC free article] [PubMed] [Google Scholar]
- Marsden AL, Feinstein JA, Taylor CA. A computational framework for derivative-free optimization of cardiovascular geometries. Comput Methods Appl Mech Eng. 2008;197:1890–1905. doi: 10.1016/j.cma.2007.12.009. [Google Scholar]
- Menon V, Eberth J, Goodwin R, Potts J. Altered Hemodynamics in the Embryonic Heart Affects Outflow Valve Development. J Cardiovasc Dev Dis. 2015;2:108–124. doi: 10.3390/jcdd2020108. doi: 10.3390/jcdd2020108. [DOI] [PMC free article] [PubMed] [Google Scholar]
- Midgett M, Goenezen S, Rugonyi S. Blood flow dynamics reflect degree of outflow tract banding in Hamburger-Hamilton stage 18 chicken embryos. J R Soc Interface. 2014;11:20140643. doi: 10.1098/rsif.2014.0643. doi: 10.1098/rsif.2014.0643. [DOI] [PMC free article] [PubMed] [Google Scholar]
- Midgett M, Rugonyi S. Congenital heart malformations induced by hemodynamic altering surgical interventions. Front Physiol. 2014;5:287. doi: 10.3389/fphys.2014.00287. doi: 10.3389/fphys.2014.00287. [DOI] [PMC free article] [PubMed] [Google Scholar]
- Mihalef V, Ionasec RI, Sharma P, et al. Patient-specific modelling of whole heart anatomy, dynamics and haemodynamics from four-dimensional cardiac CT images. Interface Focus. 2011;1:286–96. doi: 10.1098/rsfs.2010.0036. doi: 10.1098/rsfs.2010.0036. [DOI] [PMC free article] [PubMed] [Google Scholar]
- Milan DJ, Jones IL, Ellinor PT, MacRae C a. In vivo recording of adult zebrafish electrocardiogram and assessment of drug-induced QT prolongation. Am J Physiol Heart Circ Physiol. 2006;291:H269–73. doi: 10.1152/ajpheart.00960.2005. doi: 10.1152/ajpheart.00960.2005. [DOI] [PubMed] [Google Scholar]
- Miller CE, Wong CL, Sedmera D. Pressure overload alters stress-strain properties of the developing chick heart. Am J Physiol Heart Circ Physiol. 2003;285:H1849–56. doi: 10.1152/ajpheart.00384.2002. doi: 10.1152/ajpheart.00384.2002. [DOI] [PubMed] [Google Scholar]
- Oosterbaan AM, Ursem NTC, Struijk PC, et al. Doppler flow velocity waveforms in the embryonic chicken heart at developmental stages corresponding to 5-8 weeks of human gestation. Ultrasound Obstet Gynecol. 2009;33:638–44. doi: 10.1002/uog.6362. doi: 10.1002/uog.6362. [DOI] [PubMed] [Google Scholar]
- Pekkan K, Dasi L, Nourparvar P. In vitro hemodynamic investigation of the embryonic aortic arch at late gestation. J Biomech. 2008;41:1697–1706. doi: 10.1016/j.jbiomech.2008.03.013. [DOI] [PMC free article] [PubMed] [Google Scholar]
- Phan L, Knutsen AK, Bayly PV, et al. Refining shape correspondence for similar objects using strain. 3DOR. 2011:17–24. doi: 10.2312/3DOR/3DOR11/017-024. [Google Scholar]
- Poelma C, Van der Heiden K, Hierck BP, et al. Measurements of the wall shear stress distribution in the outflow tract of an embryonic chicken heart. J R Soc Interface. 2010;7:91–103. doi: 10.1098/rsif.2009.0063. doi: 10.1098/rsif.2009.0063. [DOI] [PMC free article] [PubMed] [Google Scholar]
- Rugonyi S, Shaut C, Liu A, et al. Changes in wall motion and blood flow in the outflow tract of chick embryonic hearts observed with optical coherence tomography after outflow tract banding and vitelline-vein ligation. Phys Med Biol. 2008;53:5077–91. doi: 10.1088/0031-9155/53/18/015. doi: 10.1088/0031-9155/53/18/015. [DOI] [PubMed] [Google Scholar]
- Santhanakrishnan A, Miller L a. Fluid dynamics of heart development. Cell Biochem Biophys. 2011;61:1–22. doi: 10.1007/s12013-011-9158-8. doi: 10.1007/s12013-011-9158-8. [DOI] [PubMed] [Google Scholar]
- Schenkel T, Malve M, Reik M, Markl M. MRI-based CFD analysis of flow in a human left ventricle: methodology and application to a healthy heart. Ann. Biomed. 2009 doi: 10.1007/s10439-008-9627-4. [DOI] [PubMed] [Google Scholar]
- Sedmera D, Pexieder T, Hu N, Clark EB. Developmental changes in the myocardial architecture of the chick. Anat Rec. 1997;248:421–32. doi: 10.1002/(SICI)1097-0185(199707)248:3<421::AID-AR15>3.0.CO;2-R. [DOI] [PubMed] [Google Scholar]
- Shi L, Goenezen S, Haller S, et al. Alterations in pulse wave propagation reflect the degree of outflow tract banding in HH18 chicken embryos. Am J Physiol Heart Circ Physiol. 2013;305:H386–96. doi: 10.1152/ajpheart.00100.2013. doi: 10.1152/ajpheart.00100.2013. [DOI] [PMC free article] [PubMed] [Google Scholar]
- Srivastava D. Genetic regulation of cardiogenesis and congenital heart disease. Annu Rev Pathol. 2006;1:199–213. doi: 10.1146/annurev.pathol.1.110304.100039. doi: 10.1146/annurev.pathol.1.110304.100039. [DOI] [PubMed] [Google Scholar]
- Steinman D a. Image-Based Computational Fluid Dynamics Modeling in Realistic Arterial Geometries. Ann Biomed Eng. 2002;30:483–497. doi: 10.1114/1.1467679. doi: 10.1114/1.1467679. [DOI] [PubMed] [Google Scholar]
- Syed SH, Larin KV, Dickinson ME, Larina IV. Optical coherence tomography for high-resolution imaging of mouse development in utero. J Biomed Opt. 2011;16:046004. doi: 10.1117/1.3560300. doi: 10.1117/1.3560300. [DOI] [PMC free article] [PubMed] [Google Scholar]
- Taber L a. Towards a unified theory for morphomechanics. Philos Trans A Math Phys Eng Sci. 2009;367:3555–83. doi: 10.1098/rsta.2009.0100. doi: 10.1098/rsta.2009.0100. [DOI] [PMC free article] [PubMed] [Google Scholar]
- Taber L a., Humphrey JD. Stress-Modulated Growth, Residual Stress, and Vascular Heterogeneity. J Biomech Eng. 2001;123:528. doi: 10.1115/1.1412451. doi: 10.1115/1.1412451. [DOI] [PubMed] [Google Scholar]
- Taber L, Hu N, Pexieder T. Residual strain in the ventricle of the stage 16-24 chick embryo. Circ. Res. 1993;72 doi: 10.1161/01.res.72.2.455. [DOI] [PubMed] [Google Scholar]
- Taber LA. Mechanical aspects of cardiac development. Prog Biophys Mol Biol. 1998;69:237–255. doi: 10.1016/s0079-6107(98)00010-8. doi: 10.1016/S0079-6107(98)00010-8. [DOI] [PubMed] [Google Scholar]
- Taylor CA, Steinman DA. Image-based modeling of blood flow and vessel wall dynamics: applications, methods and future directions: Sixth International Bio-Fluid Mechanics Symposium and Workshop, March 28-30, 2008 Pasadena, California. Ann Biomed Eng. 2010;38:1188–203. doi: 10.1007/s10439-010-9901-0. doi: 10.1007/s10439-010-9901-0. [DOI] [PubMed] [Google Scholar]
- Ten Dijke P, Egorova AD, Goumans M-JTH, et al. TGF-β signaling in endothelial-to-mesenchymal transition: the role of shear stress and primary cilia. Sci Signal. 2012;5:pt2. doi: 10.1126/scisignal.2002722. doi: 10.1126/scisignal.2002722. [DOI] [PubMed] [Google Scholar]
- Van den Hoff MJ, Moorman a F, Ruijter JM, et al. Myocardialization of the cardiac outflow tract. Dev Biol. 1999;212:477–90. doi: 10.1006/dbio.1999.9366. doi: 10.1006/dbio.1999.9366. [DOI] [PubMed] [Google Scholar]
- Vennemann P, Kiger KT, Lindken R, et al. In vivo micro particle image velocimetry measurements of blood-plasma in the embryonic avian heart. J Biomech. 2006;39:1191–200. doi: 10.1016/j.jbiomech.2005.03.015. doi: 10.1016/j.jbiomech.2005.03.015. [DOI] [PubMed] [Google Scholar]
- Vos SS, Ursem NTC, Hop WCJ, et al. Acutely altered hemodynamics following venous obstruction in the early chick embryo. 2003:1051–1057. doi: 10.1242/jeb.00216. doi: 10.1242/jeb.00216. [DOI] [PubMed] [Google Scholar]
- Wang Y, Dur O, Patrick MJ, et al. Aortic arch morphogenesis and flow modeling in the chick embryo. Ann Biomed Eng. 2009;37:1069–81. doi: 10.1007/s10439-009-9682-5. doi: 10.1007/s10439-009-9682-5. [DOI] [PubMed] [Google Scholar]
- Yalcin HC, Shekhar A, McQuinn TC, Butcher JT. Hemodynamic patterning of the avian atrioventricular valve. Dev Dyn. 2011;240:23–35. doi: 10.1002/dvdy.22512. doi: 10.1002/dvdy.22512. [DOI] [PMC free article] [PubMed] [Google Scholar]
- Yelbuz TM. Optical Coherence Tomography: A New High-Resolution Imaging Technology to Study Cardiac Development in Chick Embryos. Circulation. 2002;106:2771–2774. doi: 10.1161/01.cir.0000042672.51054.7b. doi: 10.1161/01.CIR.0000042672.51054.7B. [DOI] [PubMed] [Google Scholar]
- Yin X, Liu A, Thornburg KL, et al. Extracting cardiac shapes and motion of the chick embryo heart outflow tract from four-dimensional optical coherence tomography images. J Biomed Opt. 2012;17:96005–1. doi: 10.1117/1.JBO.17.9.096005. doi: 10.1117/1.JBO.17.9.096005. [DOI] [PMC free article] [PubMed] [Google Scholar]
- Zebker HA, Goldstein RM. Topographic mapping from interferometric synthetic aperture radar observations. J Geophys Res. 1986;91:4993. doi: 10.1029/JB091iB05p04993. [Google Scholar]


