Abstract
Mass spectrometry imaging (MSI) has become an important analytical tool for many sectors of science and medicine. As the application of MSI expands into new areas of inquiry, existing methodologies must be adapted and improved to meet emerging challenges. Particularly salient is the need for small molecule imaging methods that are compatible with complex multicomponent systems, a challenge that is amplified by the effects of analyte migration and matrix interference. With a focus on microbial biofilms from the opportunistic pathogen Pseudomonas aeruginosa, the relative advantages of two established microprobe-based MSI techniques—polyatomic secondary ion mass spectrometry (SIMS) and laser desorption/ionization—are compared, with emphasis on exploring the effect of surface metallization on small molecule imaging. A combination of qualitative image comparison and multivariate statistical analysis demonstrates that sputtering microbial biofilms with a 2.5 nm layer of gold selectively enhances C60-SIMS ionization for several molecular classes including rhamnolipids and 2-alkyl-quinolones. Metallization also leads to the reduction of in-source fragmentation and subsequent ionization of media-specific background polymers, which improves spectral purity and image quality. These findings show that the influence of metallization upon ionization is strongly dependent on both the surface architecture and the analyte class, and further demonstrate that metal-assisted C60-SIMS is a viable method for small molecule imaging of intact molecular ions in complex biological systems.
I. INTRODUCTION
Bacterial biofilms are one of the oldest and most prolific communal ecosystems on earth. These amalgamations of cells, extracellular deoxyribonucleic acids, proteins, polysaccharides, lipids, and various secondary metabolites present a unique analytical challenge that requires both the application of existing analytical techniques and the invention of novel approaches.1–3 One of the most promising methodologies for studying the chemical composition and distribution of biofilm ecosystems is microprobe mass spectrometry imaging (MSI), which uses a focused beam of ions, photons, or solvent to desorb molecules from a sample for subsequent spatially resolved spectrometric analysis. Over the previous two decades, MSI has emerged as a vital tool for in situ chemical imaging of many biological systems, including biofilms,4–6 cultured neurons and neural networks,7,8 and subcellular structures.9,10
Owing to its broad commercial availability and unparalleled mass range, matrix-assisted laser desorption/ionization (MALDI) is the most widely applied MSI ionization method for many sample types, including biofilms.11,12 While versatile, MALDI is limited by matrix interference in the low mass range (m/z < 500). The application of solvated organic matrix can also induce analyte migration, thereby altering native molecular distributions and limiting the effective spatial resolution.13,14 One means for overcoming the challenges associated with organic matrices is to use “matrix-free” methods for laser desorption/ionization (LDI); a broad assortment of sample preparation strategies, such as the application of metal films and nanoparticles,15–18 or the use of patterned surfaces and clathrate nanostructures,19,20 among other approaches.21,22
Requiring no sample preparation beyond what is necessary for high vacuum compatibility, secondary ion mass spectrometry (SIMS) offers a small molecule imaging approach that is complementary to MALDI. The principal advantages of SIMS include spatial resolution—with many commercial instruments offering a lateral resolution better than 500 nm—and the capability to examine unadulterated samples, thus eliminating matrix interference and mitigating analyte migration. SIMS has been successfully applied to image many biological systems, including biofilms, tissues, and cells.23 The SIMS ion bombardment process is highly energetic, making it most suited for imaging small molecular ions and characteristic molecular fragments (m/z ≲ 500). Energetic ion bombardment also produces surface and subsurface damage that confines analysis to a fraction (typically <1%) of the uppermost layer of the sample surface, thereby reducing the quantity of accessible analyte.23 Researchers have expended great effort on both sample preparation and instrument design, in order to expand molecular coverage and sensitivity.
One important instrumental innovation has been the introduction of cluster and polyatomic primary ion sources, which are now commonly used for biomolecular imaging. These sources spread the kinetic energy of the primary ion impact among many atoms in the projectile, resulting in reduced analyte fragmentation, more efficient molecular ionization, and less subsurface damage.24 Cluster sources have expanded the practical mass range for SIMS above m/z 1000 and enabled analysis of greater portions of the surface and subsurface regions.23,25
On the other end of SIMS inquiry, researchers have focused on developing novel sample treatment strategies broadly aimed at improving ionization. Innovations have included exposure to reactive vapor,26 and application of traditional MALDI matrices,27,28 metal films,16,29 or nanoparticles.30 Applying a thin layer of gold or silver to the sample is particularly appealing due to the wide availability of conventional sputter-coating devices for electron microscopy. Metallization has been investigated for its ability to improve SIMS sensitivity and image quality for samples as diverse as tissue and cells,29,31,32 polymers,33–38 and small organic molecules or molecular mixtures.34,37–43 Unfortunately, the effort to combine the benefits of cluster ionization with metallization has thus far been unsuccessful, with several researchers reporting decreased molecular ion yields for metallized samples when a large polyatomic or cluster source is employed.37,39 To date, most fundamental MetA-SIMS studies have been conducted using spin-cast organic standards or organic polymers on hard surfaces, and we hypothesized that the effects of surface metallization might differ for soft and architecturally complex samples. In this work, we utilize a hybrid imaging mass spectrometer, equipped with both a 20 kV Buckminsterfullerene (C60+) ion beam and a UV laser, to examine the effect of surface metallization upon the ionization of small molecule secondary metabolites in Pseudomonas aeruginosa biofilms, a biological system with a complex molecular composition and surface architecture. We further exploit the hybrid nature of the instrument to compare C60-SIMS, metal-assisted (MetA)-C60-SIMS, and MetA-LDI.
The Gram-negative bacterium and opportunistic pathogen P. aeruginosa offers an excellent model for biofilm biology, as the organism readily forms intricate microbial communities that utilize a diverse collection of small molecules to coordinate behaviors, including colony formation, virulence, and apoptosis.44 We have previously developed methods for the analysis of biofilms using both MetA-LDI and monatomic (Au+ primary ion beam) MetA-SIMS, and found that coating the biofilm surface with a few nanometers of gold improved sensitivity for lipids and small molecule secondary metabolites in LDI and monatomic SIMS.16 In separate work, we created methods that correlate C60-SIMS imaging with confocal Raman microscopy, and applied them to image several small molecule secondary metabolites in the same biofilm model.5,27
In the present study, we have found that while C60-SIMS, MetA-C60-SIMS, and MetA-LDI are all applicable for imaging small molecules in P. aeruginosa biofilms, each method presents its own unique advantages. Our results show that, in comparison to an untreated biofilm, a 2.5 nm layer of gold selectively improves C60-SIMS ionization efficiency for several analyte classes, including rhamnolipids (RHLs) and 2-alkyl-4-quinolones (AQs). Remarkably, the enhancement was not observed for standard solutions deposited on a bare silicon wafer, supporting the hypothesis that surface hardness and projectile penetration substantially influence biomolecular fragmentation and ionization efficiency.36,43 Furthermore, in MetA-C60-SIMS, high-intensity background ions derived from the cell culture medium are selectively suppressed, thereby dramatically improving spectral quality. These findings have potential applications to biomolecular SIMS imaging of samples from diverse origins.
II. EXPERIMENT
A. Materials and reagents
Silicon tiles were purchased from University Wafer (South Boston, MA) and stainless steel sample plates used throughout all MSI experiments were designed in-house and manufactured in the University of Illinois at Urbana-Champaign School of Chemical Sciences Machine Shop. Analytical standards, including 2-heptyl-3-hydroxy-4(1H)-quinolone (Pseudomonas quinolone signal, PQS), 2-heptyl-4-quinolone (HHQ), and R95 rhamnolipid, were purchased from Sigma-Aldrich (St Louis, MO), while 2-heptyl-4-quinoline-N-oxide (HQNO) was purchased from Cayman Chemicals (Ann Arbor, MI). All standards were used as received without further purification.
B. Cell culture and biofilm formation
Pseudomonas aeruginosa (PAO1C) was grown overnight at 37 °C with 240 rpm agitation in a chemically defined, phosphate-buffered, minimal culture medium containing 30 mM sterilized glucose.45 Aliquots (200 μl each) of the resulting culture (optical density of 1 at 600 nm hν) were transferred to 2 cm × 2 cm sterilized silicon shards in a Petri dish. Following 10–15 min of incubation, 18 m of fresh culture medium with 30 mM glucose was gently added, and the bacteria were allowed to grow at 37 °C for 24 h. The liquid medium was carefully removed from the dish, and the resulting colonies were allowed to dry for 1 h in a sterile hood. While care was taken to generate samples with similar morphology, biofilms are inherently heterogeneous, and it is therefore difficult, and possibly undesirable, to cultivate identical biological replicates. Two of the samples prepared for this study were morphologically and chemically similar, while a third contained a central region with low cell density. Control samples were generated by depositing 10 μl of culture medium onto clean silicon shards and drying the resulting spot under a gentle stream of N2. Samples were stored in a positive-pressure nitrogen dry box until analysis.
C. Gold sputter coating and morphological evaluation
Gold sputter coating was performed as previously described16 using a Desk II TSC sputter coater (Denton Vacuum, Moorestown, NJ) with 64 mTorr Ar and 40 mA current. The thickness and morphology of the gold layer were evaluated via atomic force microscopy (AFM) using a Multimode NanoScope IIIa (Veeco Metrology, Inc., Santa Barbara, CA) equipped with a silicon nitride cantilever (ScanAsyst-Air, Bruker AXC, Inc., Madison, WI) with a tip radius of 10–20 nm. Sputtering for 5–6 s resulted in the application of 2.5 nm of gold on silicon (see Sec. III C), which was initially optimized for MetA-C60-SIMS and used throughout all experiments. It is important to note that the optimal overlay thickness is dependent upon many variables, including the analyte of interest, the surface composition, and the choice of microprobe (e.g., projectile mass, laser energy, etc.). For example, previous work has shown that a thicker coating of ∼6 nm is optimal for MetA-UV-LDI (Ref. 29) and that 0.2–2 nm is optimal for monatomic SIMS with Xe+, Bi+, Ar+, and Ga+ bombardment of single-component organic standards.34
Biofilm morphology was evaluated with both AFM (as described above) and scanning electron microscopy (SEM). For SEM, a gold-treated sample was examined using a field-emission environmental scanning electron microscope (Philips XL30 ESEM-FEG, FEI Company, Hillsboro, OR) operated with 5 kV and a working distance of 6.2 mm.
D. Sequential MSI and tandem mass spectrometry (MS2)
Sequential imaging experiments were performed with a hybrid MALDI/C60-SIMS time-of-flight imaging mass spectrometer, which is a modified QSTAR-XL (AB SCIEX, Framingham, MA) described in detail elsewhere.27 Positive-mode imaging was conducted at a raster size of 300 μm × 300 μm with 1.5 s of total acquisition time per pixel. The mass range was confined to m/z 100–1000, with a Q1 ion guide transmission bias of 10%, 20%, 30%, and 40% at m/z 120, 240, 440, and 600, respectively. In1–7+ cluster ions were used for external calibration. Images were collected in Analyst 1.1 and oMALDI Server 5.1 (AB SCIEX), converted from wiff to img format at 20 data points per mass unit, and processed with BioMap (Novartis, Basel, Switzerland).
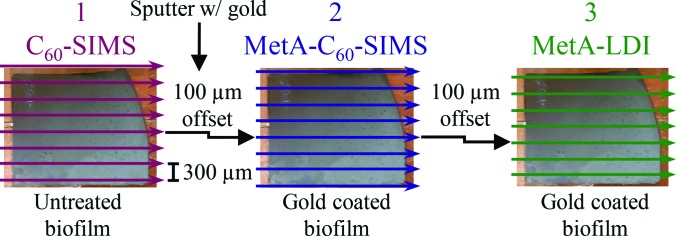
SIMS imaging with neat or metallized samples was performed using a 20 keV continuous C60+ beam (Ionoptika, Ltd., Hampshire, UK) operated with a 80-μm spot size and a 1300 pA sample current for a total ion dose of 5.1 × 10¹³ ions/cm2. For MetA-LDI, a 337 nm Spectra Physics (Santa Clara, CA) VLS-335 pulsed nitrogen laser (oblong spot size of 100 μm× 200 μm) was operated at 40 Hz and 90 μJ. As illustrated in Scheme 1, biofilms were (1) imaged directly by C60-SIMS, (2) coated in 1–2 nm of Au and imaged by MetA-C60-SIMS, and (3) imaged by MetA-LDI. Between each image collection, the analysis region was offset by 100 μm to enable examination of an unperturbed region. It is important to note that the laser spot is larger than the ∼120 μm of unperturbed area; therefore, the peripheries of the LDI rows may have been influenced by the prior SIMS acquisitions.
Scheme 1.
Experimental design for the sequential imaging experiments. The 100 μm offset provided an unperturbed region for each subsequent ionization modality; 2–3 nm of gold was applied between images 1 and 2.
MS2 was performed directly from the sample surface using the spectrometer and microprobe settings described above, argon collision gas, and 20–50 eV collision-induced dissociation as needed.
E. Statistical evaluation of the sequential imaging results
To quantitatively investigate the spectral changes associated with gold coating, MSI data were analyzed with several custom matlab scripts (MathWorks, Natick, MA). AB SCIEX wiff files were converted to mzML with the ProteoWizard msconvert function,46 and the resulting mzML files were further converted to imzML with the imzMLConverter program47 and read into matlab with a modified version of loadimzMLfile from MSiReader.48 The raw spectra were binned at m/z 0.1 for nontargeted analysis, and a total ion count (TIC)-normalized average spectrum was calculated for each image row. For principal component analysis (PCA), the image matrices were concatenated and analyzed with the pca functions in matlab. Score plots depict the score of each averaged row of the image. The data were further analyzed with targeted m/z values corresponding to potential analytes of interest (Table S1).49 The TIC-normalized, maximum intensity within 250 ppm of each m/z value was extracted and averaged by row as before. In addition to PCA, the relative change of absolute intensity was also calculated as the pair-wise difference between corresponding rows of the images.
III. RESULTS AND DISCUSSION
A. Application of a thin gold film reduces fragmentation and ionization of media-specific compounds
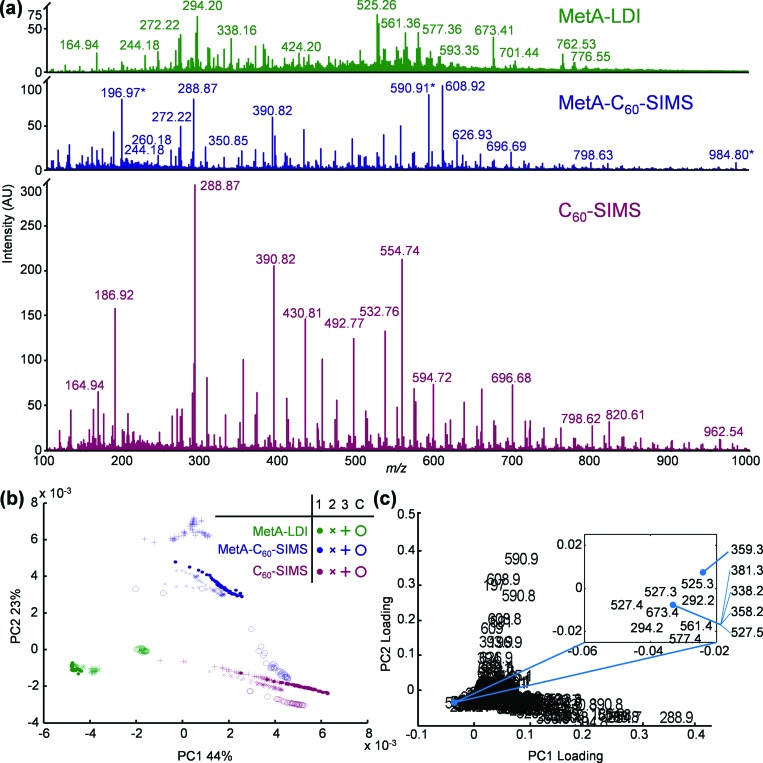
Three separate P. aeruginosa biofilms were sequentially imaged, as described in Sec. II. The growth across two of these samples was macroscopically uniform, while the center of the third sample had a region of visibly thin growth (Fig. S1). Representative spectra for the three imaging modalities are displayed in Fig. 1(a). Each spectrum was generated by averaging the pixels contained within an imaging row, and was drawn from adjacent regions on the same biofilm to diminish intra- and intersample variability. While the three methods generated ions across the entire mass range, the representative C60-SIMS spectrum in Fig. 1(a) contains multiple peaks that are either substantially higher in absolute intensity or exclusive to this ionization mode. A comparison of the C60-SIMS spectra from biofilm 2 with those obtained from the culture media control (Fig. S2) shows that the overwhelming majority of the high intensity ions from the biofilm are also present in the media control, suggesting that the high intensity C60-SIMS ions are derived from constituents of the culture medium, rather than bacteria-specific biomolecules. As can be seen in the representative MetA-C60-SIMS spectrum in Fig. 1(a), following the application of gold, media-specific ion intensities are substantially diminished and the Au+, Au3+, and Au5+ ions (m/z 196.97, 590.91, and 984.80, respectively) are predominant. The MetA-LDI spectrum is also free of the most intense C60-SIMS constituents, and several ions arise in the m/z range corresponding to lipids (e.g., m/z 500–800).
Fig. 1.
(a) Representative mass spectra for MetA-LDI (green), MetA-C60-SIMS (blue), and C60-SIMS (red), generated by averaging pixels across adjacent imaging rows in biofilm 2; (b) scores plot; and (c) loadings plot from unsupervised PCA of 780 average row spectra from biofilms 1 (•), 2 (×), and 3 (+), and the media control C (O). The gold cluster ions are marked with an asterisk (*) in the MetA-C60-SIMS spectrum of panel (a).
The three images from each sample and the media control were deconstructed into individual rows, the pixels contained within each row were averaged together to create a collection of 780 spectra from 12 images, and nontargeted PCA was performed to evaluate the major differences between samples and between ionization methods. The scores and loadings plots for the first two principal components [Figs. 1(b) and 1(c)] show two levels of clustering, with the mode of ionization providing primary clustering, and the sample origin providing secondary clustering.
Those spectra affiliated with C60-SIMS (red) largely group at positive values of PC1 (44% of the total variance in the data set), which are heavily influenced by media-specific background ions (e.g., m/z 288.9, 554.7, 390.8, 186.9, etc.), and toward the null point of PC2 (23% of the variance). This is in contrast with the MetA-C60-SIMS spectra (blue), which separate to positive values of PC2 and the null point of PC1. The positive direction of PC2 is heavily weighted by the Au1–3+ cluster ions and unidentified peaks at m/z 608.8 and 626.9, which are most prominent in the MetA-C60-SIMS spectra. Also of note, many of the C60-SIMS and MetA-C60-SIMS spectra are roughly distributed along lines in the scores plot. This distribution is generally indicative of a sample with roughly constant ratios for ions along a given vector, but that differ in absolute intensity. In this case, the spectra partition along PC1, which is heavily influenced by background ions arising from the cell culture medium. It therefore appears that the spectral distribution reflects a proportional scaling of media-specific ions.
The MetA-LDI spectra (green) are found at negative values of PC1 and PC2, a space influenced by high intensity ions in the lipid mass range (e.g., m/z 525.3, 527.4, 673.4, 577.4, etc.), and by a few prominent low-mass ions at m/z 294.2 and 292.2. MS2 results reveal that m/z 292.2 and 294.2 are similar in structure to compounds from the 2-alkyl-4-quinolone class (Fig. S3). For a more complete discussion of the relevant biomolecules, see Sec. III B. Analogous MS2 evaluation of the high mass ions clustering toward negative PC1 and PC2 reveals that these ions correspond to RHL biosurfactants (Table S2 and Fig. S4).
Interestingly, the MetA-C60-SIMS and MetA-LDI spectra from the media control (open circles) cluster together with biofilm spectra obtained with C60-SIMS. This distribution across PC1 most likely arises because the control is deficient in compounds produced by P. aeruginosa and contains only the background ions that dominate the C60-SIMS spectra. Consistent with the trends observed in the representative spectra of Fig. 1(a), MetA-C60-SIMS primarily separates across PC2 because of the strong Au1–3+ cluster ion signals, MetA-LDI separates in PC1 based upon abundant ions in the lipid range, and C60-SIMS separates based upon the prevalence of background ions from the cell culture medium.
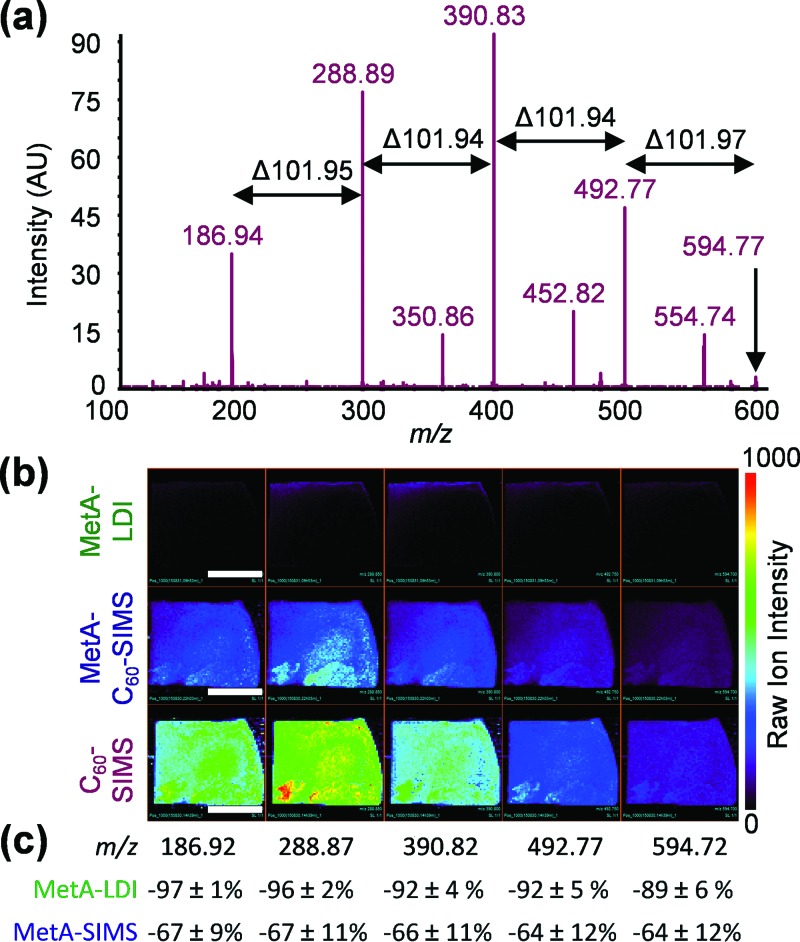
In situ MS2 of the more massive ions from the biofilm and media control reveals that many of the high-intensity ions observed with C60-SIMS are fragments of larger ions. For example, MS2 of m/z 594.77 [Fig. 2(a)] produced the successive loss of 101.95 to generate m/z 492.77, 390.83, 288.89, and 186.94, which are present at high abundance in MS1. Similar peak series are observed for many components of the C60-SIMS spectra; starting with a given low mass ion (e.g., m/z 164.90, 186.91, or 202.85, among others) and successively adding m/z 101.95 results in many of the other high-abundance peaks. The presence of many of the same ions in both MS1 and MS2, and the regular pattern of fragmentation, suggests that these constituents arise from in-source fragmentation of higher molecular weight polymers. Attempts to identify the low mass, media-specific ions through pseudo-MS3 were unsuccessful.
Fig. 2.
(a) In situ C60-SIMS MS2 of a representative media-specific ion, m/z 594.8, produces the successive loss of 101.95 to generate several high-abundance ions that are also found in the MS1 spectra; (b) MS1 images of the m/z 186.92–594.72 ion sequence in biofilm 2; and (c) relative abundance change between C60-SIMS and the other two ionization modalities. The white scale bars in (b) represent 1 cm, and the error in (c) was calculated as the relative standard deviation between biofilms with n = 3.
Remarkably, ionization of these high-abundance polymeric fragments is substantially diminished following metallization. For example, ion images of the m/z 186.91–594.27 sequence in biofilm 2 [Fig. 2(b)]—which are broadly representative of the media-specific ions as a whole—are substantially lower in intensity with MetA-C60-SIMS and MetA-LDI than with C60-SIMS. This phenomenon was quantitatively explored through pairwise comparison of the three imaging modalities [Fig. 2(c)]. Calculating the change in abundance of MetA-C60-SIMS and MetA-LDI relative to C60-SIMS reveals that ionization of media-specific compounds decreases by an average of 65% for MetA-SIMS and 89% for Meta-LDI. Taken together, these results suggest that the gold treatment facilitates a reduction in C60-SIMS in-source fragmentation.
B. Gold treatment exhibits a variable influence on small molecule ion yield
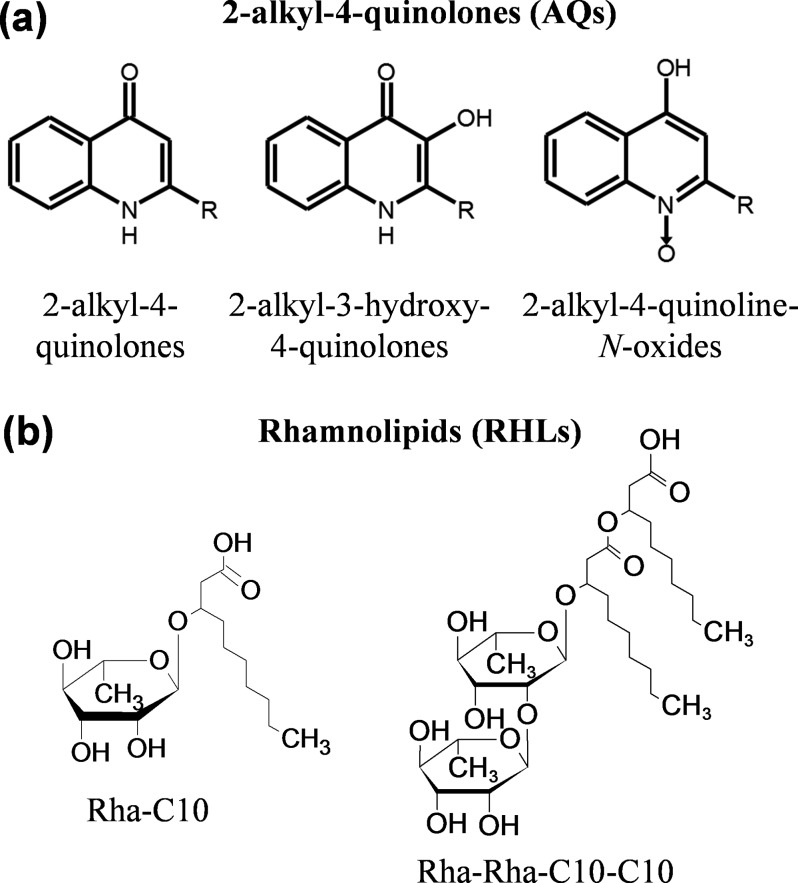
The community-scale coordination of biofilm-bound P. aeruginosa is dependent upon the production and utilization of a wide assortment of small molecule secondary metabolites. Important classes include AQs, of which several have been identified as intercellular signaling molecules,50 and RHLs, which are biosurfactants important for colony morphology and nutrient uptake (see Fig. 3).51 Both compound classes are structurally diverse, with variations in the length, number, and saturation of the aliphatic side-chains, as well as the position of the hydroxyl group in AQs and the number of rhamnose groups in RHLs. It is unclear whether the diversity in structure is matched by a similar diversity in function, as only a few of the over 50 AQs found in P. aeruginosa have assigned functions.52
Fig. 3.
(a) AQs and (b) rhamnolipids (RHLs) produced by P. aeruginosa. Intraclass heterogeneity arises from the length and saturation of the aliphatic sidechain (R), as well as the presence and location of the hydroxyl group in AQs and the number of rhamnose (Rha) and R groups in RHLs. See Table S1 for more information on the specific analytes observed in this study.
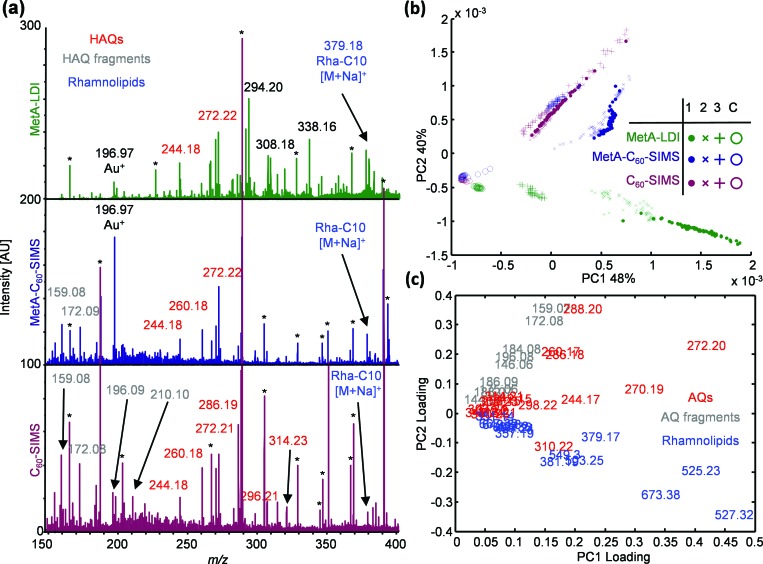
Both AQs and RHLs are abundantly expressed in the bacterial communities examined here and are readily observable with all three imaging modalities. The spectra displayed in Fig. 4(a) show protonated molecular ions for several AQs, including 7, 9, and 11 carbon variants of each of the three major subclasses—e.g., 2-alkyl-4-quinolones (observed at m/z 244.18, 270.17, 272.21, 298.23, and 300.21), 2-alkyl-3-hydroxy-4-quinolones (observed at m/z 260.18, 286.19, 288.20, 314.23, and 316.23), and 2-alkyl-4-quinoline-N-oxides (which are isomeric with 2-alkyl-3-hydroxy-4-quinolones). Several of these ions have been previously assigned via MS2,5,53 and they are similarly characterized in this work (Table S2 and Fig. S4). Also observable in the spectra presented in Fig. 4(a) are AQ fragments (e.g., m/z 159.08, 172.09, 196.09, and 210.10), Au+ at m/z 196.97, and background ions from the cell culture medium (as indicated by asterisks). Several RHLs are also present in both the sodiated ([M + Na] + ) and disodiated ([M + 2Na–H]+) forms; however, with the exception of Rha-C10 at m/z 379.19, most are not observable in the m/z range shown in Fig. 4(a) and can instead be seen in Fig. 1(a). Abundant RHLs include Rha-C10 (m/z 379.17), Rha-C8 (m/z 497.20), Rha-Rha-C10 (m/z 525.26), Rha-C10-C10 (m/z 527.33), and Rha-Rha-C10-C10 (m/z 673.41).
Fig. 4.
(a) Representative spectra for MetA-LDI (green), MetA-C60-SIMS (blue), and C60-SIMS (red) generated by averaging pixels across adjacent imaging rows in biofilm 2; (b) scores plot and (c) loadings plot from targeted PCA of 780 average row spectra from three biofilms 1 (•), 2 (×), and 3 (+), and the media control C (O). Ions marked by an asterisk (*) in (a) are also found in the control sample.
To investigate the intensity changes of AQs and RHLs independent of the media background, targeted PCA was performed by selecting only ions derived from either AQs, AQ fragments, or RHLs. A full list of the ions used for targeted PCA is presented in Table S1. As can be seen in the scores and loadings plots for the first two principal components [Figs. 4(b) and 4(c)], the spectra again cluster with others derived from the same ionization modality, and separate across PC1 (48% of the variance) and PC2 (40% of the variance) following the different compound classes.
As is shown in the scores plot of Fig. 4(b) and the loadings plot of Fig. 4(c), the spectra affiliated with C60-SIMS (red) segregate to positive values of PC2 and are heavily influenced by AQ fragments (labeled in gray) and isomeric ion pairs from the 2-alkyl-3-hydroxy-4-quinolone and 2-alkyl-4-quinoline-N-oxide subclasses at m/z 288.20, 286.18, and 260.17 (red). The MetA-LDI spectra (green) principally separate to positive values of PC1, which is dominated by the most abundant RHLs (Rha-Rha-C10, Rha-C10-C10, and Rha-Rha-C10-C10, at m/z 525.23, 527.32, and 573.38, respectively), and by high-abundance AQs from the 2-alkyl-4-quinolone subclass at m/z 244.17, 270.19, and 272.20 (red). MetA-LDI spectra also separate to negative values of PC2. The negative loading of RHLs in PC2 indicates that this compound class is responsible for the majority of the separation between spectra from MetA-LDI and those from the other modes of ionization.
Also shown in Figs. 4(b) and 4(c), spectra arising from MetA-C60-SIMS (blue) are found between those derived from the other two ionization modalities, with localization at positive values of PC1 and PC2. This grouping appears to be heavily influenced by variable ionization of the AQ subclasses, different amounts of AQ fragmentation, and differences in RHL abundance. AQs from the 2-alkyl-4-quinolone subclass, which is found at the null point of PC2 and positive values of PC1 on the loadings plot, influence the separation between neat C60-SIMS and MetA-C60-SIMS.
The media controls from all three ionization modalities separate to the zero value for PC2 and negative values of PC1, most likely because these spectra have below-average intensities for all analytes. Also of note, biofilm 3 is an outlier, with its spectra clustered toward more negative values of PC1 than the other spectra from similar ionization methods. Examination of the optical images (Fig. S1) reveals that the center of biofilm 3 is largely devoid of the structure associated with the other two samples, and therefore, the observed clustering of this sample most likely arises because a substantial region lacks the target analytes and has a chemical composition more resembling the control.
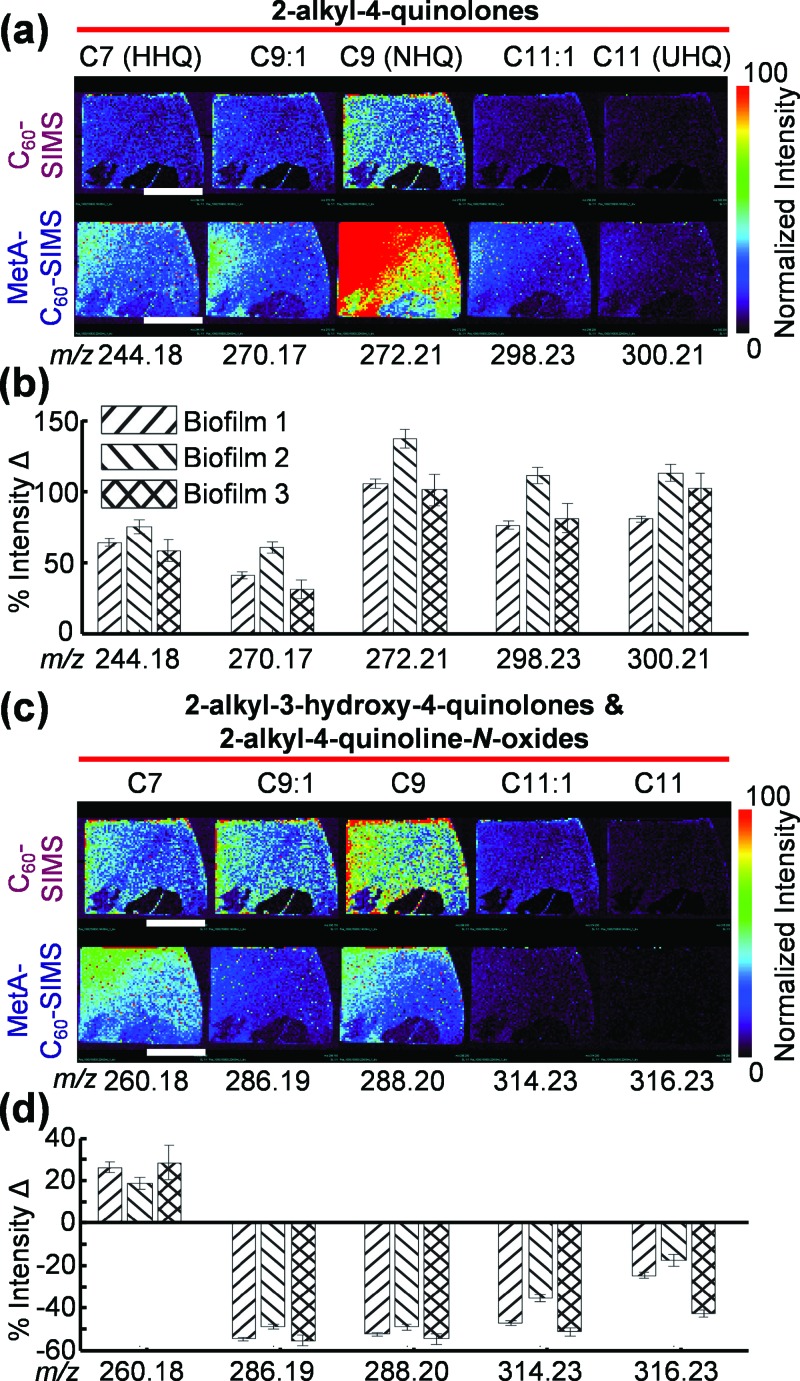
The variation in C60-SIMS AQ ionization was further explored both qualitatively and quantitatively (Fig. 5). Ion images of the 2-alkyl-4-quinolones [Fig. 5(a)] show substantially higher sensitivity following the application of gold, with the 9-carbon variant (2-nonyl-4-quinolone, or NHQ, m/z 272.21) showing the largest enhancement of 120 ± 20% (mean ± SD for biofilms, n = 3). Also notable is the enhanced SIMS sensitivity for the 11 carbon variant (2-undecyl-4-quinolone, or UHQ, m/z 300.21), which is nearly undetectable with C60-SIMS but well within the detection limit for MetA-C60-SIMS. Quantitative comparisons (calculated as the percent change in SIMS signal intensity before and after metallization) of the 2-alkyl-4-quinolone intensities show this same trend, with all analytes from this subclass enhanced by more than 46% following the application of gold [Fig. 5(b)]. Variation between specific analytes is substantial, with NHQ and UHQ showing the most improvement (141 ± 7% and 117 ± 6%, respectively, in biofilm 2, mean ± standard error of the mean), and the double-bonded variant of NHQ (db:NHQ) showing the least improvement (33 ± 7% in biofilm 3).
Fig. 5.
C60-SIMS ion images for AQs in biofilm 2 and relative intensity changes observed for the three samples before and after the application of gold. (a) and (b) 2-alkyl-4-quinolones, (c) and (d) combined 2-alkyl-3-hydroxy-4-quinolones and 2-alkyl-4-quinoline-N-oxides. Each bar on the graph depicts the intensity change for a single ion over a biofilm and the error was calculated as standard error of the mean with n = 61, 58, and 56 for biofilms 1, 2, and 3, respectively. The white scale bar represents 1 cm.
Similar evaluation of the isomeric AQs at m/z 286.19 (db:C9), 288.20 (C9), 314.23 (db:C11), and 316.23 (C11) shows the opposite trend, with a near universal signal depression of ∼44% following gold application [Figs. 5(c) and 5(d)]. The notable exception is m/z 260.18, which corresponds to the protonated molecular ions of 2-alkyl-3-heptyl-4-quinolone (also known as PQS) and 2-heptyl-4-quinoline-N-oxide (HQNO). The PQS/HQNO isomeric pair shows an enhancement of 26 ± 2.5%, 19 ± 3%, and 28 ± 8%, with biofilms 1, 2, and 3, respectively.
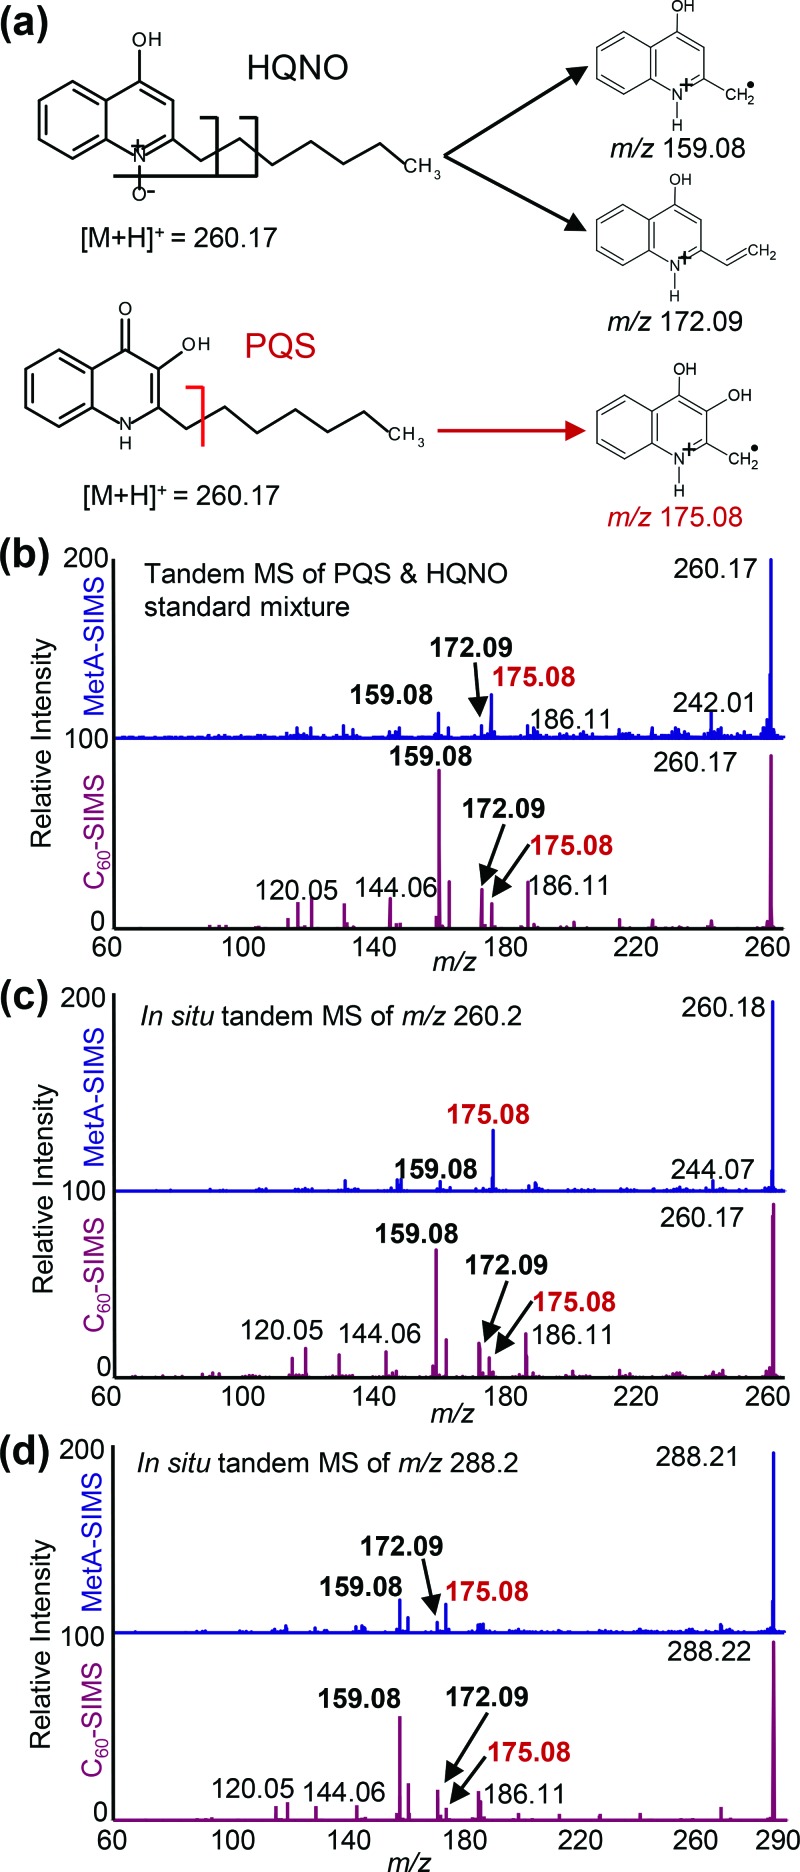
The change in intensity of the isomeric AQ pairs at m/z 260.18, 286.19, and 288.19 was further investigated through MS2 of PQS and HQNO standards (Fig. 6). The most abundant fragments for HQNO and its analogs result from the loss of the N-oxide oxygen and fragmentation of the aliphatic sidechain in either the α- (m/z 159.08) or β-position (m/z 172.09) relative to the quinolone ring. This is in contrast to AQs from the PQS family, which retain the hydroxyl group and undergo aliphatic sidechain fragmentation to produce m/z 175.08 and 188.09 [Fig. 6(a)].53 MS2 of a dried droplet containing both PQS and HQNO standards before the application of gold [Fig. 6(b)] shows fragments for both compounds, with m/z 159.08 as the most intense peak. Following the application of gold, the abundance of the HQNO product ions decreases, while the PQS fragment at m/z 175.08 becomes the most abundant product ion in the MetA-C60-SIMS spectrum. The same trend is observed for MS2 of the isomeric pairs at m/z 260.18 [Fig. 6(c)] and 288.21 [Fig. 6(d)] in the biofilm sample. While the MetA-LDI was not presented in Fig. 6, the N-oxide AQs are largely absent from these spectra, and the overall trends in ionization more closely resemble MetA-C60-SIMS than C60-SIMS. Taken together with the ion images in Fig. 5, these data suggest that the gold coating leads to selective enhancement of PQS and HHQ-type AQs, whereas ionization of the N-oxide AQs is suppressed.
Fig. 6.
(a) Predicted fragmentation patterns for the isomeric AQ pairs, and MS2 before and after metallization of (b) m/z 260.2 in an approximately equimolar mixture of PQS and HQNO standards on a silicon wafer, (c) m/z 260.2 from the biofilm surface, and (d) m/z 288.2 from the biofilm surface. These data show that ionization of N-oxide AQs is preferentially suppressed following metallization.
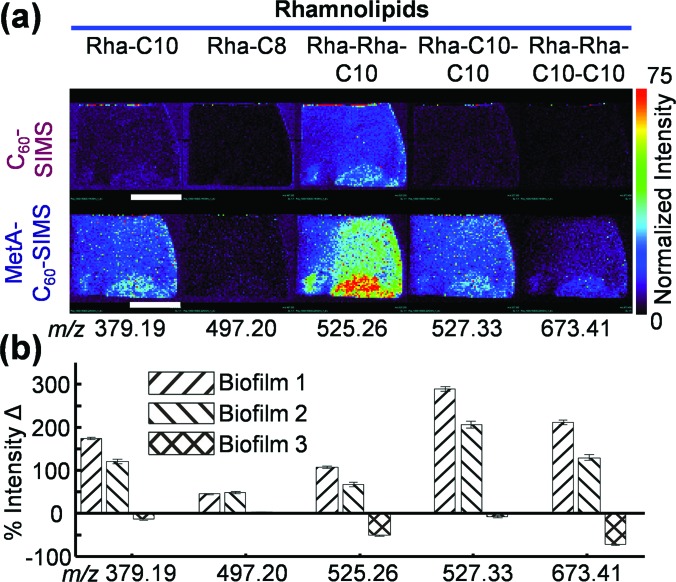
The ionization of RHLs is also substantially enhanced (Fig. 7); however, the effect is highly variable between samples. Biofilms 1 and 2 show a 45%–300% improvement in RHL ionization following the application of gold, while biofilm 3 shows either no change or a decrease in ion abundance. It is likely that this incongruence arises from the distinctive morphology (Fig. S1), as the center of the sample is devoid of a thick biofilm matrix. Further examination of the ion images for biofilm 3 (Fig. S5) shows that the overall RHL abundance is low and mostly localized to the sample edge. One exception to this is Rha-Rha-C10, which appears to have a higher abundance in the biofilm center.
Fig. 7.
(a) RHL ion images for biofilm 2 and (b) relative abundance change for all three biofilms before and after the application of 2–3 nm gold. Each bar on the graph depicts the intensity change for a single ion in a single biofilm and the error was calculated as standard error of the mean with n = 61, 58, and 56 for biofilms 1, 2, and 3, respectively. The white scale bar in (a) represents 1 cm.
C. Evaluation of the gold coating and biofilm morphology
To evaluate the morphology and thickness of the gold coating, a bare silicon wafer was half-masked with clear tape, sputtered with gold, and examined with AFM. After 6 s of sputtering, the average height change across the Au/Si interface was found to be 2.6 nm (±25% SD for n = 4 line scans). Ra values (mean of the absolute height value) were found to be 2.8 Å ± 7% and 1.3 Å ± 8% SD for the gold-coated and bare silicon surfaces, respectively (Fig. S6). These results are in agreement with previous scanning and transmission electron microscopy observations.37,39
Analogous evaluation of the gold-treated biofilms was hindered by the surface heterogeneity; both SEM and AFM showed dramatic height variations, with a deviation of more than 1 μm observed across a lateral distance of 5 μm (Fig. S7). Even with relatively simple organic samples, other authors have reported that variations in surface cohesion result in the formation of 20–100 nm gold islets separated by bare regions of sample; therefore, it is exceedingly unlikely that the biofilm is coated in a uniform layer of gold.29,34 Furthermore, a detailed examination of the deposition of metals onto multilayers of benzene revealed that metals penetrate into the surface of the sample and form subsurface clusters.54 Thus, it is probable that much of the sputtered gold penetrates the biofilm surface to form subsurface structures.
IV. INSIGHTS INTO THE MECHANISM OF MetA-c60-SIMS
The mechanism behind MetA-SIMS ionization enhancement is still under debate; nevertheless, several credible hypotheses have been proposed. It has been suggested that metallization can induce changes in the local band structure and work function of the surface, leading to preferential ionization, even in instances when sputtering efficiency remains unchanged.18,38,39 The increase in small molecule ion yields may also arise from a mitigation of matrix effects, as was initially shown by Inoue and Murase40 using a simple mixture of Irganox 1010 and silicon oil. Another intriguing theory is that a combination of analyte migration and increased sputtering efficiency through surface hardening are responsible for the enhancement effect. Using both Ga+ and SF5+ primary ions to analyze a series of organic dyes, Adriaensen et al.41 showed that protonated molecular ions and characteristic fragments increase in intensity following gold and silver application. As the sample aged, the protonated molecular ions generally decreased in intensity while the characteristic fragment ions increased in intensity. This result, as well as the observation that ionization of larger polymers—which would presumably be tangled together with other analytes and therefore be less mobile—is depressed following metal application, suggests that endogenous small molecules migrate onto the top of the gold islands and become more accessible to the primary ion beam.38
Augmenting molecular migration is the idea of surface stopping power; an increase in the hardness of a surface leads to the deposition of a higher proportion of the primary ion beam energy in the near-surface region of the sample and accordingly, an increase in sputtering yield for intact secondary ions. For monatomic ion beams, this hypothesis has been widely supported empirically and theoretically.34–37,39,55,56 In a pair of studies, Heile et al.36,43 investigated the relationship between the primary ion beam composition and surface hardness and showed that as the effective thickness of the metal layer increases, there is a tradeoff between an accessible surface (i.e., uncoated area) and hardness. These findings partially explain the previous observation that metallization reduces ionization when polyatomic projectiles are used. Even on neat organic samples, polyatomic projectiles produce shallow impact craters with minimal subsurface damage; therefore, the metal coating reduces the accessible area without providing the benefit of reduced surface penetration.36 In agreement with previous observations on hard surfaces, examination of AQ standards on a silicon wafer before and after the application of gold shows a substantial reduction in ion yield (68%, 32%, and 90% reduction for HHQ, PQS, and HQNO, respectively, Fig. S8).
In contrast with the samples routinely studied by the SIMS imaging community (e.g., single and few component polymers, spin–cast organic standards, and even cell culture or tissue slices), bacterial biofilms present a heterogeneous surface both with respect to hardness and overall architecture. Taking these considerations into account, it is likely that the observed signal enhancement is the result of several different effects including: (1) a reduction in the fragmentation and ionization of high molecular weight background polymers from the cell culture medium, and thus, a reduction in matrix effects; (2) a more efficient collision cascade and molecular ejection event; (3) reduced fragmentation of larger biomolecules (e.g., RHLs), and therefore, increased ionization of intact molecular ions; and (4) chemical phenomena, such as differential molecular diffusion onto the top of the gold or alterations in the chemical properties of the surface. The ionization differences between AQ subclasses might arise from differences in depth, preferential migration, or a chemical reaction that produces a secondary byproduct unobservable by MSI.
V. CONCLUSIONS
In this work, we compare the small molecule imaging capabilities of MetA-C60-SIMS to both C60-SIMS and MetA-LDI, and show metallization to be a promising sample treatment for small molecule imaging of complex biological systems. A combination of qualitative image comparison and quantitative statistical analysis shows that sputtering the biofilm surface with an effective 2.5 nm layer of gold provides increased sensitivity and improves spectral purity through reduced ionization of background ions from the cell culture medium. In contrast to standards (Fig. S8) and previous studies reporting universal signal depression, we find that metallization improves in situ C60-SIMS ionization for several molecular classes, including 2-alkyl-4-quinolones and RHLs, by up to 300%. The dramatic reduction in background following the application of gold highlights the utility of MetA-C60-SIMS in cases when the study is afflicted by interference from endogenous background components. When it is necessary to examine intact molecular ions and a premium is placed on high spatial resolution, MetA-C60-SIMS may be the best available option.
The success and degree of the enhancement appears to be dependent upon both the analyte class and the surface composition, suggesting that MetA-SIMS ionization relies upon the interplay between the chemical and physical properties of both the sample and the analytes themselves. While we anticipate that these methods will be broadly applied for polyatomic MetA-SIMS analysis of a diverse assortment sample types, the heterogeneous nature of the enhancement most likely dictates rigorous optimization for each sample under investigation. It is further likely that additional tuning of the thickness and composition of the metal overlay will lead to even greater enhancements than those observed in the present study.
ACKNOWLEDGMENTS
Expert assistance with the AFM and SEM was provided by Leilei Yin, Catherine Wallace, and Scott Robinson from the Beckman Institute Imaging Technology Group, which is partially supported by the National Science Foundation Award No. DBI-9871103. Research reported in this publication was supported by the National Institute of Allergy and Infectious Diseases of the National Institutes of Health under Award No. R01AI113219, and the Department of Energy under Award No. DE SC-0006642. Additional financial support was provided through the Springborn Endowment, the Chemistry-Interface with Biology Training Program (T32 GM70421), and the NSF Graduate Research Fellowship Program. The content is solely the responsibility of the authors and does not necessarily represent the official views of the funding agencies.
References
- 1. Branda S. S., Vik Å., Friedman L., and Kolter R., Trends Microbiol. 13, 20 (2005). 10.1016/j.tim.2004.11.006 [DOI] [PubMed] [Google Scholar]
- 2. Flemming H.-C. and Wingender J., Nat. Rev. Microbiol. 8, 623 (2010). 10.1038/nrmicro2415 [DOI] [PubMed] [Google Scholar]
- 3. Normark S., NPJ Biofilms Microbiomes 1, 15004 (2015). 10.1038/npjbiofilms.2015.4 [DOI] [PMC free article] [PubMed] [Google Scholar]
- 4. Vaidyanathan S., Fletcher J. S., Goodacre R., Lockyer N. P., Micklefield J., and Vickerman J. C., Anal. Chem. 80, 1942 (2008). 10.1021/ac701921e [DOI] [PubMed] [Google Scholar]
- 5. Baig N. F., Dunham S. J. B., Morales-Soto N., Shrout J. D., Sweedler J. V., and Bohn P. W., Analyst 140, 6544 (2015). 10.1039/C5AN01149C [DOI] [PMC free article] [PubMed] [Google Scholar]
- 6. Brauer J. I., Makama Z., Bonifay V., Aydin E., Kaufman E. D., Beech I. B., and Sunner J., Biointerphases 10, 019003 (2015). 10.1116/1.4906744 [DOI] [PubMed] [Google Scholar]
- 7. Rubakhin S. S., Greenough W. T., and Sweedler J. V., Anal. Chem. 75, 5374 (2003). 10.1021/ac034498+ [DOI] [PubMed] [Google Scholar]
- 8. Tucker K., Li Z., Rubakhin S., and Sweedler J., J. Am. Soc. Mass Spectrom. 23, 1931 (2012). 10.1007/s13361-012-0472-1 [DOI] [PMC free article] [PubMed] [Google Scholar]
- 9. Monroe E. B., Jurchen J. C., Lee J., Rubakhin S. S., and Sweedler J. V., J. Am. Chem. Soc. 127, 12152 (2005). 10.1021/ja051223y [DOI] [PubMed] [Google Scholar]
- 10. Ghosal S., Fallon S. J., Leighton T. J., Wheeler K. E., Kristo M. J., Hutcheon I. D., and Weber P. K., Anal. Chem. 80, 5986 (2008). 10.1021/ac8006279 [DOI] [PubMed] [Google Scholar]
- 11. Amstalden van Hove E. R., Smith D. F., and Heeren R. M. A., J. Chromatogr. 1217, 3946 (2010). 10.1016/j.chroma.2010.01.033 [DOI] [PubMed] [Google Scholar]
- 12. Watrous J. D. and Dorrestein P. C., Nat. Rev. Microbiol. 9, 683 (2011). 10.1038/nrmicro2634 [DOI] [PMC free article] [PubMed] [Google Scholar]
- 13. Zhang S., Liu J. A., Chen Y., Xiong S., Wang G., Chen J., and Yang G., J. Am. Soc. Mass Spectrom. 21, 154 (2010). 10.1016/j.jasms.2009.09.024 [DOI] [PubMed] [Google Scholar]
- 14. Gemperline E., Rawson S., and Li L., Anal. Chem. 86, 10030 (2014). 10.1021/ac5028534 [DOI] [PMC free article] [PubMed] [Google Scholar]
- 15. Kurczy M. E. et al. , Nat. Commun. 6, 5998 (2015). 10.1038/ncomms6998 [DOI] [PMC free article] [PubMed] [Google Scholar]
- 16. Lanni E. J., Masyuko R. N., Driscoll C. M., Aerts J. T., Shrout J. D., Bohn P. W., and Sweedler J. V., Anal. Chem. 86, 9139 (2014). 10.1021/ac5020222 [DOI] [PMC free article] [PubMed] [Google Scholar]
- 17. Amendola V., Litti L., and Meneghetti M., Anal. Chem. 85, 11747 (2013). 10.1021/ac401662r [DOI] [PubMed] [Google Scholar]
- 18. Prabhakaran A., Yin J., Nysten B., Degand H., Morsomme P., Mouhib T., Yunus S., Bertrand P., and Delcorte A., Int. J. Mass Spectrom. 315, 22 (2012). 10.1016/j.ijms.2012.02.009 [DOI] [Google Scholar]
- 19. Woo H.-K., Northen T. R., Yanes O., and Siuzdak G., Nat. Protoc. 3, 1341 (2008). 10.1038/nprot.2008.110 [DOI] [PubMed] [Google Scholar]
- 20. Wei J., Buriak J. M., and Siuzdak G., Nature 399, 243 (1999). 10.1038/20400 [DOI] [PubMed] [Google Scholar]
- 21. Peterson D. S., Mass Spectrom. Rev. 26, 19 (2007). 10.1002/mas.20104 [DOI] [PubMed] [Google Scholar]
- 22. Wang F., Hong M., Xu L., and Geng Z., Prog. Chem. 27, 571 (2015). 10.7536/PC141117 [DOI] [Google Scholar]
- 23. Vickerman J. C. and Winograd N., Int. J. Mass Spectrom. 377, 568 (2015). 10.1016/j.ijms.2014.06.021 [DOI] [Google Scholar]
- 24. Brenes D. A., Postawa Z., Wucher A., Blenkinsopp P., Garrison B. J., and Winograd N., J. Phys. Chem. Lett. 2, 2009 (2011). 10.1021/jz200708j [DOI] [PMC free article] [PubMed] [Google Scholar]
- 25. Fearn S., Mater. Sci. Technol. 31, 148 (2014). 10.1179/1743284714Y.0000000668 [DOI] [Google Scholar]
- 26. Angerer T. B., Dowlatshahi Pour M., Malmberg P., and Fletcher J. S., Anal. Chem. 87, 4305 (2015). 10.1021/ac504774y [DOI] [PubMed] [Google Scholar]
- 27. Lanni E. J., Dunham S. J. B., Nemes P., Rubakhin S. S., and Sweedler J. V., J. Am. Soc. Mass Spectrom. 25, 1897 (2014). 10.1007/s13361-014-0978-9 [DOI] [PubMed] [Google Scholar]
- 28. Locklear J. E., Guillermier C., Verkhoturov S. V., and Schweikert E. A., Appl. Surf. Sci. 252, 6624 (2006). 10.1016/j.apsusc.2006.02.206 [DOI] [Google Scholar]
- 29. Altelaar A. F. M., Klinkert I., Jalink K., de Lange R. P. J., Adan R. A. H., Heeren R. M. A., and Piersma S. R., Anal. Chem. 78, 734 (2006). 10.1021/ac0513111 [DOI] [PubMed] [Google Scholar]
- 30. Mohammadi A. S., Fletcher J. S., Malmberg P., and Ewing A. G., Surf. Interface Anal. 46, 379 (2014). 10.1002/sia.5609 [DOI] [Google Scholar]
- 31. Nygren H. and Malmberg P., J. Microsc. 215, 156 (2004). 10.1111/j.0022-2720.2004.01374.x [DOI] [PubMed] [Google Scholar]
- 32. McDonnell L. A., Heeren R. M. A., de Lange R. P. J., and Fletcher I. W., J. Am. Soc. Mass Spectrom. 17, 1195 (2006). 10.1016/j.jasms.2006.05.003 [DOI] [PubMed] [Google Scholar]
- 33. Nittler L., Delcorte A., Bertrand P., and Migeon H. N., Surf. Interface Anal. 45, 18 (2013). 10.1002/sia.5045 [DOI] [Google Scholar]
- 34. Heile A. et al. , Surf. Interface Anal. 40, 538 (2008). 10.1002/sia.2810 [DOI] [Google Scholar]
- 35. Restrepo O., Prabhakaran A., Hamraoui K., Wehbe N., Yunus S., Bertrand P., and Delcorte A., Surf. Interface Anal. 42, 1030 (2010). 10.1002/sia.3203 [DOI] [Google Scholar]
- 36. Heile A., Muhmann C., Lipinsky D., and Arlinghaus H. F., Surf. Interface Anal. 43, 20 (2011). 10.1002/sia.3556 [DOI] [Google Scholar]
- 37. Delcorte A., Yunus S., Wehbe N., Nieuwjaer N., Poleunis C., Felten A., Houssiau L., Pireaux J. J., and Bertrand P., Anal. Chem. 79, 3673 (2007). 10.1021/ac062406l [DOI] [PubMed] [Google Scholar]
- 38. Delcorte A., Médard N., and Bertrand P., Anal. Chem. 74, 4955 (2002). 10.1021/ac020125h [DOI] [PubMed] [Google Scholar]
- 39. Wehbe N., Heile A., Arlinghaus H. F., Bertrand P., and Delcorte A., Anal. Chem. 80, 6235 (2008). 10.1021/ac800568y [DOI] [PubMed] [Google Scholar]
- 40. Inoue M. and Murase A., Surf. Interface Anal. 37, 1111 (2005). 10.1002/sia.2121 [DOI] [Google Scholar]
- 41. Adriaensen L., Vangaever F., and Gijbels R., Anal. Chem. 76, 6777 (2004). 10.1021/ac049108d [DOI] [PubMed] [Google Scholar]
- 42. Keune K. and Boon J. J., Surf. Interface Anal. 36, 1620 (2004). 10.1002/sia.1996 [DOI] [Google Scholar]
- 43. Heile A., Muhmann C., Lipinsky D., and Arlinghaus H. F., Appl. Surf. Sci. 258, 6993 (2012). 10.1016/j.apsusc.2012.03.150 [DOI] [Google Scholar]
- 44. Steinberg N. and Kolodkin-Gal I., J. Bacteriol. 197, 2092 (2015). 10.1128/JB.02516-14 [DOI] [PMC free article] [PubMed] [Google Scholar]
- 45. Morales-Soto N., Anyan M. E., Mattingly A. E., Madukoma C. S., Harvey C. W., Alber M., Deziel E., Kearns D. B., and Shrout J. D., J. Visualized Exp. 98, 52338 (2015). 10.3791/52338 [DOI] [PMC free article] [PubMed] [Google Scholar]
- 46. Chambers M. C. et al. , Nat. Biotechnol. 30, 918 (2012). 10.1038/nbt.2377 [DOI] [PMC free article] [PubMed] [Google Scholar]
- 47. Race A. M., Styles I. B., and Bunch J., J. Proteomics 75, 5111 (2012). 10.1016/j.jprot.2012.05.035 [DOI] [PubMed] [Google Scholar]
- 48. Robichaud G., Garrard K., Barry J., and Muddiman D., J. Am. Soc. Mass Spectrom. 24, 718 (2013). 10.1007/s13361-013-0607-z [DOI] [PMC free article] [PubMed] [Google Scholar]
- 49.See supplementary material at http://dx.doi.org/10.1116/1.4942884E-BJIOBN-11-328602 for a list of the ions used for targeted PCA (Table S1), optical images of all samples (Fig. S1), C60-SIMS spectral comparison of biofilm 2 and the media control (Fig. S2), MetA-LDI MS2 characterization of m/z 292 and 294 (Fig. S3), relevant MS2 information for AQs and RHLs (Table S2 and Fig. S4), SIMS and MetA-SIMS images of RHLs in biofilm 3 (Fig. S5), AFM characterization of gold coated silicon (Fig. S6), AFM and SEM characterization of metalized samples (Fig. S7), and the results of the C60-SIMS examination of neat AQ standards (Fig. S8).
- 50. Huse H. and Whiteley M., Chem. Rev. 111, 152 (2011). 10.1021/cr100063u [DOI] [PMC free article] [PubMed] [Google Scholar]
- 51. Abdel-Mawgoud A. M., Lépine F., and Déziel E., Appl. Microbiol. Biotechnol. 86, 1323 (2010). 10.1007/s00253-010-2498-2 [DOI] [PMC free article] [PubMed] [Google Scholar]
- 52. Heeb S., Fletcher M. P., Chhabra S. R., Diggle S. P., Williams P., and Cámara M., FEMS Microbiol. Rev. 35, 247 (2011). 10.1111/j.1574-6976.2010.00247.x [DOI] [PMC free article] [PubMed] [Google Scholar]
- 53. Lépine F., Milot S., Déziel E., He J., and Rahme L., J. Am. Soc. Mass Spectrom. 15, 862 (2004). 10.1016/j.jasms.2004.02.012 [DOI] [PubMed] [Google Scholar]
- 54. Whitten J. E. and Gomer R., J. Phys. Chem. 100, 2255 (1996). 10.1021/jp952246+ [DOI] [Google Scholar]
- 55. Restrepo O. A., Gonze X., Bertrand P., and Delcorte A., Phys. Chem. Chem. Phys. 15, 7621 (2013). 10.1039/c3cp50346a [DOI] [PubMed] [Google Scholar]
- 56. Restrepo O. A., Prabhakaran A., and Delcorte A., Nucl. Instrum. Methods Phys. Res., B 269, 1595 (2011). 10.1016/j.nimb.2010.11.014 [DOI] [Google Scholar]
Associated Data
This section collects any data citations, data availability statements, or supplementary materials included in this article.
Data Citations
- See supplementary material at http://dx.doi.org/10.1116/1.4942884E-BJIOBN-11-328602 for a list of the ions used for targeted PCA (Table S1), optical images of all samples (Fig. S1), C60-SIMS spectral comparison of biofilm 2 and the media control (Fig. S2), MetA-LDI MS2 characterization of m/z 292 and 294 (Fig. S3), relevant MS2 information for AQs and RHLs (Table S2 and Fig. S4), SIMS and MetA-SIMS images of RHLs in biofilm 3 (Fig. S5), AFM characterization of gold coated silicon (Fig. S6), AFM and SEM characterization of metalized samples (Fig. S7), and the results of the C60-SIMS examination of neat AQ standards (Fig. S8).


