

Summary
The isolation of pure populations of mouse intestinal stem cells (ISCs) is essential to facilitate functional studies of tissue homeostasis, tissue regeneration, and intestinal diseases. However, the purification of ISCs has relied predominantly on the use of transgenic reporter alleles in mice. Here, we introduce a combinational cell surface marker-mediated strategy that allows the isolation of an ISC population transcriptionally and functionally equivalent to the gold standard Lgr5-GFP ISCs. Used on reporter-free mice, this strategy allows the isolation of functional, transcriptionally distinct ISCs uncompromised by Lgr5 haploinsufficiency.
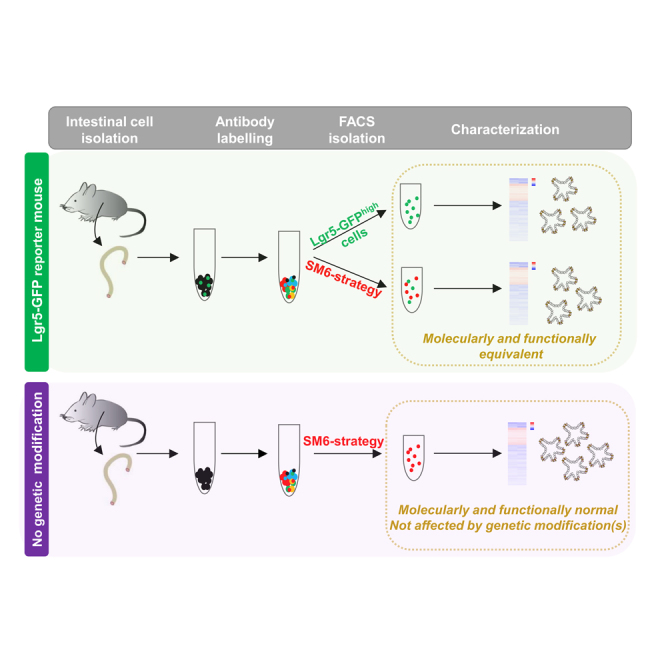
Graphical Abstract
Highlights
-
•
Reporter-free method to purify intestinal stem cells (ISCs)
-
•
Cells share molecular signature with gold standard Lgr5-GFP high cells
-
•
Multidimensional FACS data analysis reveals structure of intestinal crypt
-
•
Lgr5 haploinsufficiency with functional consequences in ISCs from reporter mice
Polo, Abud, and colleagues introduce a cell surface marker-mediated strategy that allows isolation of an intestinal stem cell (ISCs) population transcriptionally and functionally equivalent to the gold standard Lgr5-GFP ISCs. When used on reporter-free mice, this strategy allows the isolation of functional, transcriptionally distinct ISCs uncompromised by Lgr5 haploinsufficiency.
Introduction
The intestinal epithelium is a dynamic tissue that relies on integration of cell division, differentiation, migration, and apoptosis. Intestinal tissue homeostasis and regeneration are facilitated by multipotent tissue stem cells that have the ability to differentiate into multiple mature cell types. Two types of stem cells are currently proposed to reside in small intestinal crypts: cycling crypt base columnar (CBC) cells and +4 reserve cells (Barker, 2014, Clevers, 2013). CBC stem cells maintain daily homeostasis, while their reserve equivalents have been postulated to play a role in tissue regeneration upon injury (Barker, 2014, Clevers, 2013). The functional study of ISCs has been made possible by the recent characterization of ISC markers such as Lgr5, Olfm4, or Sox9low for CBC cells, and Bmi1, Hopx, Lrig1, or Sox9high for their presumed quiescent counterparts (Barker et al., 2007, Gracz and Magness, 2014, Gracz et al., 2010, Powell et al., 2012, Sangiorgi and Capecchi, 2008, Takeda et al., 2011).
Currently, the isolation of pure ISCs is primarily restricted to the use of targeted murine reporter alleles of ISC markers. However, the fidelity and specificity of these genes to mark ISCs is still controversial (Munoz et al., 2012, Tan and Barker, 2014). The most widely used reporter for CBC cell isolation is the Lgr5-Gfp knockin mouse model (Barker et al., 2007), which has facilitated the isolation and characterization of CBC stem cells in many studies (van der Flier et al., 2009). However, this transgenic mouse model has several limitations: (1) the reporter cassette is prone to being silenced in over two-thirds of all crypts resulting in mosaic expression of the Gfp allele (Barker et al., 2007, Munoz et al., 2012); (2) LGR5 constitutes the receptor for R-SPONDINS (Carmon et al., 2011, de Lau et al., 2011, Glinka et al., 2011), potent WNT signal enhancers and stem cell growth factors, and the potential haploinsufficiency induced by the loss of one Lgr5 allele (replaced by the Gfp reporter cassette) cannot be excluded; and (3) the extensive breeding required to cross genetically modified mouse models with the Lgr5-Gfp reporter strain.
Several strategies have been recently developed for CBC cell isolation via cell surface markers and fluorescence-activated cell sorting (FACS; Gracz et al., 2013, King et al., 2012, Merlos-Suarez et al., 2011, Wang et al., 2013). Although they represent considerable advances in the isolation of CBC cells independently of transgenic reporter alleles, these methodologies are suggested to be contaminated with other cell types and have not been fully characterized at the molecular level. The approach by Merlos-Suarez et al. (2011) mainly relies on extracting a subset of EPHB2 high cells from EPCAM+ epithelial cells (named SM2 in our study). However, the EPHB2 receptor is not only expressed at high levels in CBC cells but also in committed progenitor cells (Merlos-Suarez et al., 2011). In another study, Wang et al. (2013) used three crypt base markers (CD24/CD166/CD44) while depleting for GRP78+ progenitor cells (named SM4 in our study). Nonetheless, the resultant population was found to be contaminated by endocrine cells (Wang et al., 2013).
Results and Discussion
To investigate in a comprehensive way how these different cell surface markers are expressed in the different cell populations of the intestinal crypt, we employed two recently developed tools that allow mapping of high-dimensional cytometry data onto two dimensions, yet conserving its high-dimensional structure (Amir el et al., 2013, Qiu et al., 2011). Spanning-tree progression analysis of density-normalized events (SPADE) clusters phenotypically similar cells into nodes (Qiu et al., 2011), while viSNE displays individual cells on a map that preserves their multidimensional separation (Amir el et al., 2013). SPADE and viSNE have been used to interrogate, infer and visualize cellular hierarchies and transitions based on expression of cell surface markers in diverse systems including nuclear reprogramming (Lujan et al., 2015) and hematopoiesis (Qiu et al., 2011).
For the generation of high-dimensional flow cytometry data, intestinal epithelial cells from Lgr5-Gfp reporter mice were labeled with a broad range of intestinal crypt markers including markers of CBC cells (EPHB2, CD24med, CD44, CD166), transit-amplifying cells (GRP78), Paneth cells (CD24high, UEA-1), epithelial cells (EPCAM), and non-epithelial contaminating cells (CD45, CD31) (Figure S1A) (Merlos-Suarez et al., 2011, Wang et al., 2013, Wong et al., 2012). Analysis revealed that CBC cells, as identified by high levels of Lgr5-GFP expression (Lgr5-GFPhigh) (Figures S1B and S1C), clustered together in SPADE trees and on viSNE maps (Figure 1A), and that the expression of EPHB2, CD44, CD166, and CD24 overlapped with this population to various degrees. Interestingly, when nodes/cells of the SPADE trees/viSNE maps were categorized into stem cells (Lgr5-GFPhigh), Paneth cells (CD24high, UEA1high, SSChigh) (Sato et al., 2011), transient amplifying cells (GRP78high), and other mature epithelial cell types (EPCAM-positive or EPCAM-negative, or low for CBC cell markers, negative for Paneth cell markers), the known intestinal cell hierarchy could be inferred (Figures 1B and 1C). The pool of Lgr5-GFPhigh stem cells was closely associated with the niche cells (Paneth cells) and, via a stream of transient amplifying cells, was connected to the other mature epithelial cell types. Therefore, this suggested that the combination of surface markers with multidimensional analysis could be used to identify sorting strategies for the purification of CBC cells.
Figure 1.

Multidimensional Analyses of Flow Cytometry Data and Isolation Strategy
(A) Representative SPADE trees and viSNE maps colored for expression of Lgr5-GFPhigh, EphB2, CD44, CD166, GRP78, CD24, and UEA-1. For ease of comparison and as a reference, the Lgr5-GFPhigh population (green) was superimposed on a viSNE map (gray).
(B and C) SPADE tree (B) and viSNE map (C), both with superimposed intestinal hierarchy, denoted in (C) by arrows.
(D) Gating strategy used on live cells to isolate the SM6 population via cell surface markers.
(E) viSNE map with locations of Lgr5-GFPhigh, SM2, SM4, and SM6 populations overlaid in blue.
As both SM2 (based on EPHB2 and EPCAM markers) and SM4 (a combination of CD24, CD44, CD166, and GRP-78 markers) strategies (Figures S1B, S1D, and S1E) failed to isolate a pure CBC cell population (Merlos-Suarez et al., 2011, Wang et al., 2013) and importantly as their key cell surface makers (EPHB2, CD44, CD166) have different expression patterns (Figure 1A), we utilized viSNE to explore whether a reporter-free sorting strategy combining the different intestinal crypt surface markers, termed SM6 (Figure 1D), could improve the purity of the CBC cell population to a level comparable with the Lgr5-GFPhigh cells. Briefly, cells were depleted for contaminating CD31 and CD45 cells (endothelial and hematopoietic cells) and enriched for a specific population of CD166low CD24med cells. These cells were subsequently gated into CD44high GRP78neg-low cells and then only the EPCAMhigh/EPHB2high cells were sorted (see Supplemental Experimental Procedures for more details).
By using viSNE maps, the degree of overlap between SM2, SM4, and SM6 populations and the reference Lgr5-GFPhigh cells was investigated (Figure 1E). Interestingly, the SM2 gating strategy was not able to exclude a considerable number of cells that clustered outside of the region occupied by the Lgr5-GFPhigh population. However, both SM4 and SM6 strategies produced homogeneous appearing populations that overlapped well with Lgr5-GFPhigh cells. As previously mentioned, the expression of the Lgr5-Gfp cassette is mosaic and, accordingly, many CBC cells are not labeled by GFP. To investigate whether the SM6 gating strategy was superior at purifying a homogeneous population of CBC cells, a Lgr5-GFP back gating analysis was conducted on SM2, SM4, and SM6 populations. The enrichment of both Lgr5-GFPhigh cells and Lgr5-GFPlow cells within SM2, SM4, and SM6 cell populations was assessed. It is generally accepted that only Lgr5-GFPhigh cells represent CBC cells, while Lgr5-GFPlow cells are committed progenitors of Lgr5-GFPhigh cells. In agreement, single-cell PCR for Lgr5 demonstrated that nearly all Lgr5-GFPhigh cells express the transcript in contrast to only a small fraction of Lgr5-GFPlow cells (Figures S1G and S1H). Our analysis showed that the SM6 strategy was better than SM2 and SM4 cell isolation strategies in enriching for Lgr5-GFPhigh cells, while depleting for Lgr5-GFPlow cells. However, these differences were only significant between SM6 and SM4 (Figures S1I and S1J). In order to adequately benchmark the quality of our method with the existing methods, we first performed RNA sequencing with the Lgr5-Gfp line on five FACS-purified groups: SM2, SM4, SM6, Lgr5-GFPhigh reference population, and cells negative or low for all of the cell surface markers used (negative) (Figure 2A, Figures S1B–S1F, Table S1). All the cell populations, with the exception of negative cells, had a similar transcriptional signature (Figure 2B). We used principal component analysis (PCA) to compare the sequencing data of the different isolation strategies. Importantly, the transcriptional signatures of SM6 and Lgr5-GFPhigh cells overlapped, indicating that these two populations were highly similar. SM2 and SM4 cell populations clustered further away and were therefore more different (Figure 2C) although still relatively close to the Lgr5-GFPhigh population. Unsupervised hierarchical clustering on a population level also confirmed that CBC cell-enriched populations (SM2, SM4, Lgr5-GFPhigh, and SM6) were clustered and distinct from the negative population (Figure 2D). Lgr5-GFPhigh and SM6 cells formed a separate subgroup within this CBC cell-enriched branch (Figure 2D) confirming high similarity. Moreover, we could not find any genes that were significantly differentially expressed between the SM6 and Lgr5-GFPhigh populations (Figure 2E) (2-fold, Benjamin-Hockberg correction). However, several genes were upregulated in SM2 and SM4 populations, mostly related to secretory cell lineage identity as already reported by Wang et al. (2013) for the SM4 approach (Figure 2E and Table S2). Together, these results indicate that cells isolated using our FACS sorting strategy are highly similar to the Lgr5-GFPhigh cells from a transcriptional viewpoint.
Figure 2.

Bulk Profiling of Prospective CBC Cell Populations
(A) Schematic overview of the experimental procedure.
(B–D) Heatmap (D), principal component analysis (C), and unsupervised hierarchical clustering (D) for the RNA sequencing data derived from the five populations of interest: negative, SM2, SM4, SM6, and Lgr5-GFPhigh (n = 2, experimental replicates). The displayed data are the average of two datasets for each group.
(E) Number of differentially expressed (DE) genes between Lgr5-GFPhigh and SM2, SM4, or SM6 (n = 2, experimental replicates).
Expression of the Lgr5-Gfp reporter is mosaic in the intestine and only marks around a third of all CBC cells. The SM6 and Lgr5-GFPhigh approaches allow the isolation of comparable cell numbers (SM6, 2.7% ± 0.4%; Lgr5-GFPhigh, 2.6% ± 0.2% of all live cells) because the loss of a proportion of CBC cells via the SM6 method is a necessary trade-off between cell number and purity. In order to exclude the majority of the Lgr5-GFPlow cells, very stringent gating for EPHB2 is required (Figure 1D).
We performed single-cell transcriptional profiling for a broad panel of CBC and +4 reserve stem cell markers to determine the degree of homogeneity of the SM6 and Lgr5-GFPhigh isolated cell populations (Figures S2A–S2F). PCA revealed that SM6 and Lgr5-GFPhigh single-cell signatures overlapped and were highly homogeneous as indicated by the ellipses, representing 67% of the cells in each population (Figures 3A and 3B). The other strategies (SM2 and SM4) were more different. Violin plot analysis, which shows the distribution of gene expression per cell for any given population, demonstrated that all the different cell isolation methods were enriched for cells expressing ISC cell marker genes (Lgr5, Olfm4, Bmi1, Lrig1, HopX, Sox9, CD44, EphB2) (Figures 3C and S2G). Notably, this analysis also established that SM6 and Lgr5-GFPhigh single cells had an analogous gene expression pattern at the individual cell level (Figures 3C and S2G). Co-expression of the key CBC markers Lgr5, EphB2, and CD44 was detected in 90.1% and 90.3% of the individual cells from SM6 (n = 61) and Lgr5-GFPhigh (n = 62) isolation methods, respectively, compared with only 61% for SM4 (n = 31) and 79% for SM2 (n = 29) (Figures 3D and S2H). Analysis of the co-expression of +4 ISC marker genes demonstrated a similar trend, where the majority of these genes were co-expressed in each cell in the SM6 and Lgr5-GFPhigh populations (Figures 3D and S2H), as previously described (Li et al., 2014). However, we noted slight differences between SM6 and Lgr5-GFPhigh in the numbers of cells positive for the ISC marker Sox9. SM6 cells were more enriched for Sox9-positive cells (95.1%) compared with the Lgr5-GFPhigh strategy (79%) (Figure S2H). In summary, our single-cell transcriptional analysis, based on these key genes, demonstrates that our isolation method gives rise to a homogeneous population of CBC cells which co-express key stem cell markers in a similar way to the well-established Lgr5-Gfp model.
Figure 3.

Single-Cell Profiling and Functional Capacities of Prospective CBC Cell Populations
(A and B) Principal component analysis of the single-cell data for Lgr5-GFPhigh, SM6, SM4, and SM2 cell populations∗.
(C) Violin plots for key ISC marker genes for Lgr5-GFPhigh, SM6, and negative cells∗.
(D) Venn diagrams for some key ISC marker genes for Lgr5-GFPhigh and SM6∗.
(E) Organoid formation assay performed for Lgr5-GFPhigh, negative, SM2, SM4, and SM6 single-cell populations (mean ± SEM, n = 3, experimental replicates, paired Student’s t test, two-tailed).
(F) Principal component analysis.
(G) Beeswarm plot (one-way ANOVA with post hoc Bonferroni test; thick line, median; thin lines, quartiles)∗. ns, not significant.
(H) Organoid formation assay performed for Lgr5-GFPhigh, SM6-TG (SM6 strategy applied on transgenic Lgr5-Gfp animals), and SM6-WT (SM6 strategy applied on WT animals) single-cell populations (mean ± SEM, n = 4, experimental replicates, paired Student’s t test, one-tailed).
∗Replicates single-cell data: Lgr5GFPhigh 62 cells pooled from two independent experiments, SM6/SM6-TG 61 cells pooled from two independent experiments, SM4 29 cells from one experiment, SM2 31 cells from one experiment, SM6-WT 30 cells from one experiment, Negative 31 cells from one experiment.
Although SM6 and Lgr5-GFPhigh CBC cell transcriptional signatures were highly similar, we wanted to confirm that these cells had similar functional capacities. Cells isolated using SM2, SM4, SM6, Lgr5-GFPhigh, and negative strategies were assessed in an in vitro organoid assay (n = 3 for each cell population, five technical replicates per experiment). Although similar to the culture conditions described by Wang et al. (2013) for the growth of SM4 single cells, our culture conditions included the use of recombinant WNT3A, and the Rho kinase inhibitor Y-27632 was preferred to thiazovivin. All the cells, with the exception of negative cells, were capable of forming normal, round cystic organoids (Figure S2I), a classic architecture observed at day 4 after seeding when organoids are generated from single cells (Wang et al., 2013). However, there were significant differences in the number of organoids generated by the different sorting protocols. Cells isolated using SM6 and Lgr5-GFPhigh sorting methods generated organoids at the same efficiency, which was almost 2-fold higher than the SM2 or SM4 strategies (Figure 3E). As the SM6 cell population is composed of both Lgr5-GFP-negative and Lgr5-GFP-positive cells (Figure S3A), we also investigated the organoid-forming potential of these two populations. At day 4, SM6-Lgr5-GFPnegative cells formed only marginally less organoids (0.91-fold) than SM6-Lgr5-GFPhigh cells (Figure S3B). This demonstrates the capacity of the SM6 strategy to isolate Lgr5-positive stem cells that have silenced the GFP reporter. Together, these results confirm that SM6 and Lgr5-GFPhigh cells are molecularly and functionally similar.
The establishment of a robust ISC isolation protocol that does not rely on the use of transgenic reporter alleles is critical to study ISCs in any transgene-free mouse strain. Therefore, we used our SM6 strategy to isolate cells from wild-type (WT) C57BL/6 animals (Figure S3C) and performed single-cell transcriptional analysis. The WT single cells (n = 30), isolated using the SM6 strategy (SM6-WT), had a transcriptional signature that was similar to the Lgr5-GFPhigh cells (n = 62) (Figures S2A, S2F, and S3D). Moreover, PCA revealed that SM6-WT and Lgr5-GFPhigh single-cell signatures overlapped and that the homogeneity of these cell populations was comparable (Figure 3F). However, a detailed analysis of the level of expression of the Lgr5 gene at the single-cell level in cells with detectable transcript levels revealed that at least 50% of cells isolated using the Lgr5-GFPhigh strategy (38 of 60 cells) or SM6 strategy from Lgr5-Gfp mice (28 of 55 cells), which we will refer to now as SM6-TG to clearly differentiate it from SM6-WT, expressed half the amount of Lgr5 compared with the cells isolated using the SM6 strategy from WT animals, SM6-WT (Figure 3G). These results suggest that the loss of one Lgr5 allele due to the insertion of the reporter cassette is not fully compensated by the functional Lgr5 allele at the individual cell level. In order to investigate in detail potential transcriptional differences between SM6-TG and SM6-WT cells, we performed RNA sequencing on freshly purified cells and found five genes to be differentially expressed (Figure 3E). Confirming our single-cell data, one of these genes was Lgr5, which was expressed at approximately 2-fold higher levels in SM6-WT cells compared with SM6-TG cells. The other four genes were the estrogen receptor Esr1 (Cleveland et al., 2009), the immune-modulated Erdr1, a protective gene against cancer progression (Jung et al., 2011), the energy metabolism-associated gene insulin-degrading enzyme, Ide, and the fatty acid-binding protein 1, Fabp1. These four genes have not been reported to be WNT target genes, and we hypothesize that their differential expression is either a direct or indirect consequence of Lgr5 haploinsufficiency. In order to address whether the observed transcriptional changes in these few genes, in particular Lgr5 haploinsufficiency, induced functional defects, we isolated Lgr5-GFPhigh, SM6-TG, and SM6-WT cells from littermate male animals (kept under the same housing conditions to minimize genetic and environmental differences) and subjected the cells to an organoid formation assay (n = 4, four experimental replicates with five technical replicates per experiment). At day 4, Lgr5-GFPhigh cells gave rise to organoids at an efficiency of ∼7% in contrast to SM6-WT cells, which gave rise to organoids at an efficiency of ∼10% (Figures 3H and S3F; data are presented as fold change relative to Lgr5-GFPhigh). In order to further characterize the organoids generated from distinct cell populations, the expression of CBC stem cell markers (Ascl2, Lgr5, Olfm4), WNT signaling-related genes (Axin-2, C-myc, Troy), a niche marker (Egf), and differentiation markers (Chromogranin A, Lysozyme) were evaluated by quantitative RT-PCR (Figure S3G). This analysis revealed comparable expression levels of differentiation markers in organoids of all three groups. In SM6-WT organoids, a trend of higher expression of stem cell markers (Lgr5, Olfm4) and WNT target gene Axin 2 was observed compared with Lgr5-GFPhigh and SM6-TG (Figure S3G), but the differences were not statistically significant. Esr1, Ide, Fabp1, and Erdr1 were expressed at comparable levels in organoid cultures of all three groups, and we speculate that the strong canonical WNT agonists in our culture media (CHIR, WNT3A, R-SPONDIN) might have compensated for direct or indirect effects of Lgr5 haploinsufficiency. Taken together, these results suggest a potential functional deficiency within Lgr5-GFP cells with negative consequences on initial organoid establishment frequency.
In summary, we present a cell surface marker-mediated isolation protocol (a step-by-step protocol can be found in the Supplemental Experimental Procedures) for the purification of a highly enriched and homogeneous population of CBC stem cells molecularly and functional comparable with ISCs extracted from Lgr5-Gfp mice. This strategy can also be utilized to isolate CBC cells from non-transgenic animals that express presumably normal physiological levels of Lgr5, Esr1, Ide, Fabp1, and Erdr1. The isolation strategy comprises a unique tool that should facilitate investigation of both intrinsic and extrinsic regulators of ISCs during normal homeostasis, age-related intestinal degeneration, and tumorigenesis.
Experimental Procedures
Animals Used in This Study
Adult Lgr5-eGFP-IRES-CreERT2 (courtesy of Professor Hans Clevers) and WT littermate male mice (6–12 weeks old, C57BL/6 background) were used in all experiments. Animals were housed in specific pathogen-free animal house conditions at the animal facility (Monash Animal Services) in strict accordance with good animal practice as defined by the National Health and Medical Research Council (Australia) Code of Practice for the Care and Use of Animals for Experimental Purposes. Experimental procedures were approved by the Monash Animal Research Platform Animal Ethics Committee. Animals were maintained under a 12/12 hr light/dark cycle at a temperature of 20°C with free access to food and water. For further information see, Supplemental Experimental Procedures.
Author Contributions
J.M.P., H.E.A., C.M.N., and T.J. designed the study and devised the FACS isolation protocol. C.M.N. performed FACS experiments, SPADE/viSNE, and the molecular experiments of the cells with support of A.S.K. and J.C.; T.J. performed cell preparation and organoid functional experiments with support from K.H. F.R. analyzed fluidigm and RNA sequencing data under the guidance of D.R.P. and J.M.P. C.M.N., T.J., H.E.A., and J.M.P. wrote the manuscript. All authors approved and contributed to the final version of the manuscript.
Acknowledgments
We are grateful for the high-quality cell sorting service and technical input provided by the Monash Flowcore Facility. Furthermore, the authors thank the ACRF Centre for Cancer Genomic Medicine at the MHTP Medical Genomics Facility for assistance with next generation library preparation and Illumina sequencing. This work was supported by an NHMRC project grant APP1061883 to J.M.P. and H.E.A. J.M.P. was supported by a Silvia and Charles Senior Medical Viertel Fellowship.
Published: February 25, 2016
Footnotes
This is an open access article under the CC BY-NC-ND license (http://creativecommons.org/licenses/by-nc-nd/4.0/).
Supplemental Information includes Supplemental Experimental Procedures, three figures, and three tables and can be found with this article online at http://dx.doi.org/10.1016/j.stemcr.2016.01.014.
Contributor Information
Helen E. Abud, Email: helen.abud@monash.edu.
Jose M. Polo, Email: jose.polo@monash.edu.
Accession Numbers
The accession number for whole transcriptome sequencing experiments reported in this paper is SRA: SRP066815.
Supplemental Information
References
- Amir el A.D., Davis K.L., Tadmor M.D., Simonds E.F., Levine J.H., Bendall S.C., Shenfeld D.K., Krishnaswamy S., Nolan G.P., Pe'er D. viSNE enables visualization of high dimensional single-cell data and reveals phenotypic heterogeneity of leukemia. Nat. Biotechnol. 2013;31:545–552. doi: 10.1038/nbt.2594. [DOI] [PMC free article] [PubMed] [Google Scholar]
- Barker N. Adult intestinal stem cells: critical drivers of epithelial homeostasis and regeneration. Nat. Rev. Mol. Cell Biol. 2014;15:19–33. doi: 10.1038/nrm3721. [DOI] [PubMed] [Google Scholar]
- Barker N., van Es J.H., Kuipers J., Kujala P., van den Born M., Cozijnsen M., Haegebarth A., Korving J., Begthel H., Peters P.J., Clevers H. Identification of stem cells in small intestine and colon by marker gene Lgr5. Nature. 2007;449:1003–1007. doi: 10.1038/nature06196. [DOI] [PubMed] [Google Scholar]
- Carmon K.S., Gong X., Lin Q., Thomas A., Liu Q. R-spondins function as ligands of the orphan receptors LGR4 and LGR5 to regulate Wnt/beta-catenin signaling. Proc. Natl. Acad. Sci. USA. 2011;108:11452–11457. doi: 10.1073/pnas.1106083108. [DOI] [PMC free article] [PubMed] [Google Scholar]
- Cleveland A.G., Oikarinen S.I., Bynote K.K., Marttinen M., Rafter J.J., Gustafsson J.A., Roy S.K., Pitot H.C., Korach K.S., Lubahn D.B. Disruption of estrogen receptor signaling enhances intestinal neoplasia in Apc(Min/+) mice. Carcinogenesis. 2009;30:1581–1590. doi: 10.1093/carcin/bgp132. [DOI] [PMC free article] [PubMed] [Google Scholar]
- Clevers H. The intestinal crypt, a prototype stem cell compartment. Cell. 2013;154:274–284. doi: 10.1016/j.cell.2013.07.004. [DOI] [PubMed] [Google Scholar]
- de Lau W., Barker N., Low T.Y., Koo B.K., Li V.S., Teunissen H., Kujala P., Haegebarth A., Peters P.J., van de Wetering M. Lgr5 homologues associate with Wnt receptors and mediate R-spondin signalling. Nature. 2011;476:293–297. doi: 10.1038/nature10337. [DOI] [PubMed] [Google Scholar]
- Glinka A., Dolde C., Kirsch N., Huang Y.L., Kazanskaya O., Ingelfinger D., Boutros M., Cruciat C.M., Niehrs C. LGR4 and LGR5 are R-spondin receptors mediating Wnt/beta-catenin and Wnt/PCP signalling. EMBO Rep. 2011;12:1055–1061. doi: 10.1038/embor.2011.175. [DOI] [PMC free article] [PubMed] [Google Scholar]
- Gracz A.D., Magness S.T. Defining hierarchies of stemness in the intestine: evidence from biomarkers and regulatory pathways. Am. J. Physiol. Gastrointest. Liver Physiol. 2014;307:G260–G273. doi: 10.1152/ajpgi.00066.2014. [DOI] [PMC free article] [PubMed] [Google Scholar]
- Gracz A.D., Ramalingam S., Magness S.T. Sox9 expression marks a subset of CD24-expressing small intestine epithelial stem cells that form organoids in vitro. Am. J. Physiol. Gastrointest. Liver Physiol. 2010;298:G590–G600. doi: 10.1152/ajpgi.00470.2009. [DOI] [PMC free article] [PubMed] [Google Scholar]
- Gracz A.D., Fuller M.K., Wang F., Li L., Stelzner M., Dunn J.C., Martin M.G., Magness S.T. Brief report: CD24 and CD44 mark human intestinal epithelial cell populations with characteristics of active and facultative stem cells. Stem Cells. 2013;31:2024–2030. doi: 10.1002/stem.1391. [DOI] [PMC free article] [PubMed] [Google Scholar]
- Jung M.K., Park Y., Song S.B., Cheon S.Y., Park S., Houh Y., Ha S., Kim H.J., Park J.M., Kim T.S. Erythroid differentiation regulator 1, an interleukin 18-regulated gene, acts as a metastasis suppressor in melanoma. J. Invest. Dermatol. 2011;131:2096–2104. doi: 10.1038/jid.2011.170. [DOI] [PubMed] [Google Scholar]
- King J.B., von Furstenberg R.J., Smith B.J., McNaughton K.K., Galanko J.A., Henning S.J. CD24 can be used to isolate Lgr5+ putative colonic epithelial stem cells in mice. Am. J. Physiol. Gastrointest. Liver Physiol. 2012;303:G443–G452. doi: 10.1152/ajpgi.00087.2012. [DOI] [PMC free article] [PubMed] [Google Scholar]
- Li N., Yousefi M., Nakauka-Ddamba A., Jain R., Tobias J., Epstein J.A., Jensen S.T., Lengner C.J. Single-cell analysis of proxy reporter allele-marked epithelial cells establishes intestinal stem cell hierarchy. Stem Cell Rep. 2014;3:876–891. doi: 10.1016/j.stemcr.2014.09.011. [DOI] [PMC free article] [PubMed] [Google Scholar]
- Lujan E., Zunder E.R., Ng Y.H., Goronzy I.N., Nolan G.P., Wernig M. Early reprogramming regulators identified by prospective isolation and mass cytometry. Nature. 2015;521:352–356. doi: 10.1038/nature14274. [DOI] [PMC free article] [PubMed] [Google Scholar]
- Merlos-Suarez A., Barriga F.M., Jung P., Iglesias M., Cespedes M.V., Rossell D., Sevillano M., Hernando-Momblona X., da Silva-Diz V., Munoz P. The intestinal stem cell signature identifies colorectal cancer stem cells and predicts disease relapse. Cell Stem Cell. 2011;8:511–524. doi: 10.1016/j.stem.2011.02.020. [DOI] [PubMed] [Google Scholar]
- Munoz J., Stange D.E., Schepers A.G., van de Wetering M., Koo B.K., Itzkovitz S., Volckmann R., Kung K.S., Koster J., Radulescu S. The Lgr5 intestinal stem cell signature: robust expression of proposed quiescent '+4' cell markers. EMBO J. 2012;31:3079–3091. doi: 10.1038/emboj.2012.166. [DOI] [PMC free article] [PubMed] [Google Scholar]
- Powell A.E., Wang Y., Li Y., Poulin E.J., Means A.L., Washington M.K., Higginbotham J.N., Juchheim A., Prasad N., Levy S.E. The pan-ErbB negative regulator Lrig1 is an intestinal stem cell marker that functions as a tumor suppressor. Cell. 2012;149:146–158. doi: 10.1016/j.cell.2012.02.042. [DOI] [PMC free article] [PubMed] [Google Scholar]
- Qiu P., Simonds E.F., Bendall S.C., Gibbs K.D., Jr., Bruggner R.V., Linderman M.D., Sachs K., Nolan G.P., Plevritis S.K. Extracting a cellular hierarchy from high-dimensional cytometry data with SPADE. Nat. Biotechnol. 2011;29:886–891. doi: 10.1038/nbt.1991. [DOI] [PMC free article] [PubMed] [Google Scholar]
- Sangiorgi E., Capecchi M.R. Bmi1 is expressed in vivo in intestinal stem cells. Nat. Genet. 2008;40:915–920. doi: 10.1038/ng.165. [DOI] [PMC free article] [PubMed] [Google Scholar]
- Sato T., van Es J.H., Snippert H.J., Stange D.E., Vries R.G., van den Born M., Barker N., Shroyer N.F., van de Wetering M., Clevers H. Paneth cells constitute the niche for Lgr5 stem cells in intestinal crypts. Nature. 2011;469:415–418. doi: 10.1038/nature09637. [DOI] [PMC free article] [PubMed] [Google Scholar]
- Takeda N., Jain R., LeBoeuf M.R., Wang Q., Lu M.M., Epstein J.A. Interconversion between intestinal stem cell populations in distinct niches. Science. 2011;334:1420–1424. doi: 10.1126/science.1213214. [DOI] [PMC free article] [PubMed] [Google Scholar]
- Tan D.W., Barker N. Intestinal stem cells and their defining niche. Curr. Top. Dev. Biol. 2014;107:77–107. doi: 10.1016/B978-0-12-416022-4.00003-2. [DOI] [PubMed] [Google Scholar]
- van der Flier L.G., van Gijn M.E., Hatzis P., Kujala P., Haegebarth A., Stange D.E., Begthel H., van den Born M., Guryev V., Oving I. Transcription factor achaete scute-like 2 controls intestinal stem cell fate. Cell. 2009;136:903–912. doi: 10.1016/j.cell.2009.01.031. [DOI] [PubMed] [Google Scholar]
- Wang F., Scoville D., He X.C., Mahe M.M., Box A., Perry J.M., Smith N.R., Lei N.Y., Davies P.S., Fuller M.K. Isolation and characterization of intestinal stem cells based on surface marker combinations and colony-formation assay. Gastroenterology. 2013;145:e1–e21. doi: 10.1053/j.gastro.2013.04.050. [DOI] [PMC free article] [PubMed] [Google Scholar]
- Wong V.W., Stange D.E., Page M.E., Buczacki S., Wabik A., Itami S., van de Wetering M., Poulsom R., Wright N.A., Trotter M.W. Lrig1 controls intestinal stem-cell homeostasis by negative regulation of ErbB signalling. Nat. Cell Biol. 2012;14:401–408. doi: 10.1038/ncb2464. [DOI] [PMC free article] [PubMed] [Google Scholar]
Associated Data
This section collects any data citations, data availability statements, or supplementary materials included in this article.