

Abstract
Background
Genetic variation in both the composition and distribution of fat and muscle in the body is important to human health as well as the healthiness and value of meat from cattle and sheep. Here we use detailed phenotyping and a multi-trait approach to identify genes explaining variation in body composition traits.
Results
A multi-trait genome wide association analysis of 56 carcass composition traits measured on 10,613 sheep with imputed and real genotypes on 510,174 SNPs was performed. We clustered 71 significant SNPs into five groups based on their pleiotropic effects across the 56 traits. Among these 71 significant SNPs, one group of 11 SNPs affected the fatty acid profile of the muscle and were close to 8 genes involved in fatty acid or triglyceride synthesis. Another group of 23 SNPs had an effect on mature size, based on their pattern of effects across traits, but the genes near this group of SNPs did not share any obvious function. Many of the likely candidate genes near SNPs with significant pleiotropic effects on the 56 traits are involved in intra-cellular signalling pathways. Among the significant SNPs were some with a convincing candidate gene due to the function of the gene (e.g. glycogen synthase affecting glycogen concentration) or because the same gene was associated with similar traits in other species.
Conclusions
Using a multi-trait analysis increased the power to detect associations between SNP and body composition traits compared with the single trait analyses. Detailed phenotypic information helped to identify a convincing candidate in some cases as did information from other species.
Electronic supplementary material
The online version of this article (doi:10.1186/s12864-016-2538-0) contains supplementary material, which is available to authorized users.
Key words: GWAS, Multi-trait, Meta-analysis, Pleiotropy, Genes, Body composition, Sheep, Human
Background
Body composition, including the distribution and composition of fat and muscle, is of great interest in a number of species. In humans it is predictive of health outcomes, and in cattle and sheep it affects the efficiency of meat production and the value and healthiness of the meat. Genetic variation in these traits is well documented. In humans the heritability of body mass index has been estimated to be 0.42 [1]. The genetic architecture of body mass index (BMI) appears to be highly polygenic, with the 97 loci of largest estimated effect accounting for ∼ 2.7 % of BMI variance [2]. In cattle and sheep, carcass composition traits have similar heritabilities to BMI in humans [3–5].
Genome wide association studies have been very successful at finding genetic variants, such as single nucleotide polymorphisms (SNPs), associated with body size and composition in humans and livestock [1, 2, 6, 7]. In some cases, the gene through which the causal variant acts is clear and the physiological pathway to the phenotype is at least partly understood. However, sometimes the causal gene is ambiguous and often the physiological pathway is almost unknown. For instance, genetic variants near the gene LCORL have been implicated as affecting size in several species [6–9], but the mechanism by which they do this is unknown.
In identifying the genes involved and the mechanism by which they act, an advantage of studies in animal species is that more detailed phenotypes relating to body composition can be collected. For example, these can include the amounts of bone, muscle and fat and the chemical composition of the fat and muscle. Since common physiological mechanisms (e.g. growth hormone) affect the growth of muscle, fat and bone and presumably the detailed composition of fat and muscle, detailed phenotypes should help to clarify the mechanism by which genetic variants affect these traits. For instance, selection for leanness and muscling led to reduced muscle oxidative capacity and iron concentration implying a change in the proportions of different muscle fibre types [10].
In this study, we did not record muscle fibre type directly but did record phenotypes associated with fibre type. Muscles vary in muscle fibre type composition [11]. Muscles with a predominance of slow twitch (type 1) fibres have a higher capacity for fatty acid uptake and lipid oxidation, have abundant mitochondria, and are rich in myoglobin that is responsible for the red colour of meat. Whereas, muscles requiring rapid contraction generating substantial force, such as some locomotory muscles, have a greater proportion of fast twitch fibres (type IIb and IIx), which largely depend on glycolytic metabolism for energy generation and are whiter and have fewer mitochondria [12, 13]. These muscles have lower activity of isocitrate dehydrogenase (ICDH) which is crucial in the oxygen-dependent citric acid cycle of mitochondria [14]. The rate of protein turnover in muscle fibres, pre- and post-slaughter, affects the growth of muscle and the tenderness of the meat. For instance, in sheep the callipyge mutation increases muscle in the trunk and hind quarters and decreases tenderness [15, 16]. Thus, it is likely that genetic variants affect multiple traits associated with the growth of muscle and fat and their detailed composition.
It is often suggested that detailed phenotyping will aid the identification of genetic variants affecting complex traits and help to elucidate the pathway by which they act. Here we test this hypothesis by phenotyping sheep for 56 traits associated with muscle and fat growth and composition.
Usually GWAS, for instance on human height and BMI, are analysed one trait at a time ignoring patterns of pleiotropy amongst these traits. However, the pattern of pleiotropy may help to identify the gene underlying an association and the mechanism through which it acts. Bolormaa et al. [17] showed that a multi-trait analysis, by combining the results from GWAS on 32 individual traits in beef cattle, increased the power to detect pleiotropic QTL. They also showed that cluster analysis identified groups of QTL with similar patterns of pleiotropic effects. It would help us to identify the genes underlying QTL and to understand their mechanisms of action, if these groups of QTL represent genes with similar function or belonging to the same pathways.
In this study we have analysed 56 detailed body composition phenotypes on 10,613 sheep with genotypes for 510,174 SNPs. We have tested four hypotheses:
that a multi-trait analysis increases power to detect and map QTL,
that detailed phenotyping increases power to identify the causal gene underlying the QTL and the mechanism by which it acts,
that variants in different genes that act in the same pathway have a similar pattern of effects across traits, and
that variants in the same genes affect growth and body composition in multiple species.
Results
Single-trait genome-wide association studies
In this study, 10,613 sheep that had real or imputed genotypes for 510,174 SNPs, were measured for up to 56 traits (Table 1), and belonged to a large number of breeds (Merino, MER; Poll Dorset, PD; Border Leicester, BL; Suffolk, SUF; white Suffolk, WS; Texel, TEX; Corriedale, CORR; Coopworth, COOP; and various Crosses, MIX; Fig. 1). GWAS, in which each SNP was fitted one at time, were performed for 56 traits including carcass weight, fatness, muscling, tenderness, meat colour, and fatty acid (FA) composition of fat (Table 1). Population structure was accounted for by fitting breed composition and a multi-generation pedigree. Table 2 presents the number of significant (P < 10−5 and P < 5 × 10⁻⁷) SNPs. Twenty nine traits had more than 10 significant SNPs (P < 5 × 10⁻⁷), resulting in a false discovery rate (FDR) of less than 2.6 % (Table 2).
Table 1.
Number of records, mean, standard deviation (SD) and heritability estimate (h2) of each trait for the genotyped animals
| Trait code (unit) | No. | Mean | SD | Vp | h2 | Trait name |
|---|---|---|---|---|---|---|
| PSWT (kg) | 9193 | 48.5 | 7.3 | 17.8 | 0.23 | Slaughter weight |
| HCWT (kg) | 10428 | 22.1 | 4.1 | 5.3 | 0.27 | Hot carcass weight |
| LLWT (g) | 8226 | 357.9 | 68.9 | 2001.9 | 0.33 | Loin weight |
| TOP (g) | 8228 | 598.3 | 101.0 | 3137.5 | 0.31 | Topside weight |
| RND (g) | 8229 | 457.7 | 73.7 | 1833.8 | 0.32 | Round weight |
| BONE (g) | 8225 | 940.9 | 139.4 | 6508.5 | 0.31 | leg + aitch bone weight |
| LEGBONE (g) | 7472 | 547.7 | 68.9 | 2051.3 | 0.48 | Leg bone weight |
| LMY (%) | 9797 | 53.4 | 9.7 | 4.6 | 0.26 | Lean meat yield |
| DRESSING (%) | 9024 | 45.1 | 3.7 | 5.4 | 0.37 | Dressing% |
| DMLOIN (%) | 8035 | 26.7 | 1.1 | 0.8 | 0.26 | Dry matter |
| IMF (%) | 8242 | 4.3 | 1.0 | 0.7 | 0.51 | Intramuscular fat |
| LLFAT (g) | 8215 | 200.1 | 103.5 | 3071.1 | 0.17 | Loin fat weight |
| CFATSCORE | 5224 | 3.0 | 1.0 | 0.3 | 0.12 | Carcass fat score |
| CCFAT (mm) | 10183 | 4.0 | 2.3 | 2.8 | 0.21 | Fat Depth C |
| HGRFAT (mm) | 8384 | 13.2 | 5.5 | 10.0 | 0.34 | Fat depth GR |
| CFAT5 (mm) | 8132 | 7.0 | 3.4 | 5.1 | 0.18 | Fat Depth 5th rib |
| CEMW (mm) | 10343 | 60.2 | 5.2 | 14.4 | 0.35 | Carcass eye muscle width |
| CEMD (mm) | 10345 | 29.0 | 4.5 | 8.4 | 0.16 | Carcass eye muscle depth |
| CEMA (cm2) | 10345 | 14.0 | 2.9 | 3.1 | 0.24 | Eye muscle area |
| SHEARF5 (N) | 9991 | 29.1 | 10.6 | 63.0 | 0.25 | Shear force day 5 |
| SHEARF1 (N) | 5325 | 41.3 | 14.3 | 103.5 | 0.28 | Shear force day 1 |
| MYOGLOBIN (mg/g wet) | 8138 | 6.3 | 1.8 | 1.3 | 0.25 | Myoglobin |
| GLYCOGEN (mmol/kg) | 3116 | 61.3 | 14.1 | 140.7 | 0.16 | Glycogen |
| ICDH activity (umol/min/g wet) | 4742 | 4.6 | 1.7 | 0.9 | 0.27 | ICDH activity |
| RCL4 | 4631 | 36.7 | 2.9 | 4.2 | 0.43 | Retail coloura L day 4 |
| RCL3 | 4757 | 36.7 | 2.8 | 4.2 | 0.40 | Retail coloura L day 3 |
| RCL2 | 4756 | 37.0 | 2.8 | 4.1 | 0.35 | Retail coloura L day 2 |
| RCL1 | 4756 | 35.0 | 3.2 | 4.3 | 0.27 | Retail coloura L day 1 |
| RCb4 | 4631 | 16.7 | 2.5 | 1.7 | 0.11 | Retail coloura b day 4 |
| RCb3 | 4753 | 17.6 | 2.5 | 2.1 | 0.10 | Retail coloura b day 3 |
| RCb2 | 4755 | 18.4 | 2.4 | 2.1 | 0.04 | Retail coloura b day 2 |
| RCb1 | 4750 | 15.2 | 2.4 | 2.1 | 0.08 | Retail coloura b day 1 |
| RCa4 | 4630 | 15.6 | 2.2 | 2.2 | 0.29 | Retail coloura a day 4 |
| RCa3 | 4757 | 16.7 | 2.5 | 2.8 | 0.27 | Retail coloura a day 3 |
| RCa2 | 4756 | 18.2 | 2.8 | 3.9 | 0.22 | Retail coloura a day 2 |
| RCa1 | 4756 | 17.0 | 2.2 | 2.1 | 0.18 | Retail coloura a day 1 |
| CFb | 9764 | 4.6 | 4.1 | 1.3 | 0.13 | Fresh colour b* |
| CFa | 9758 | 16.0 | 5.3 | 1.7 | 0.08 | Fresh colour a* |
| CFL | 9754 | 34.4 | 3.1 | 4.2 | 0.21 | Fresh colour L* |
| PH24LL | 10299 | 5.7 | 0.2 | 0.0 | 0.16 | LL pH 24 h |
| PH24ST | 8223 | 5.8 | 0.2 | 0.0 | 0.19 | ST pH 24 h |
| IRON (wet, mg/kg) | 8083 | 20.0 | 3.4 | 7.3 | 0.24 | Iron (wet) |
| ZINC (wet, mg/kg) | 8099 | 24.9 | 4.6 | 16.7 | 0.22 | Zinc (wet) |
| EPADPADHA (mg/100gb) | 6539 | 48.4 | 16.9 | 69.2 | 0.14 | EPAc1 + DPAc2 + DHAc3 |
| EPADHA (mg/100gb) | 6536 | 23.5 | 10.4 | 23.1 | 0.18 | EPAc1 + DHAc3 |
| FA_C22_6n3 (mg/100gb) | 8140 | 6.9 | 3.2 | 3.5 | 0.26 | DHAc3 (C22:6n3) |
| FA_C22_5n3 (mg/100gb) | 8142 | 24.1 | 9.2 | 21.3 | 0.08 | DPAc2 (C22:5n3) |
| FA_C20_5n3 (mg/100gb) | 8141 | 15.4 | 7.9 | 13.4 | 0.13 | EPAc1 (C20:5n3) |
| FA_C20_4n6 (mg/100gb) | 8139 | 45.7 | 14.9 | 57.5 | 0.16 | Arachidonic acid (C20:4n6) |
| FA_C20_3n6 (mg/100gb) | 8136 | 4.5 | 1.4 | 0.8 | 0.16 | DGLAc4 (C20:3n6) |
| FA_C18_2n6 (mg/100gb) | 8130 | 134.7 | 40.2 | 482.1 | 0.15 | Linoleic acid (C18:2n6) |
| FA_C18_0 (mg/100gb) | 8124 | 481.3 | 161.5 | 9903.2 | 0.19 | Stearic acid (C18:0) |
| FA_C16_0 (mg/100gb) | 8131 | 650.9 | 224.0 | 17030.0 | 0.11 | Palmitic acid (C16:0) |
| FA_C14_0 (mg/100gb) | 8128 | 70.2 | 29.5 | 402.6 | 0.15 | Myristic acid (C14:0) |
| FA_C12_0 (mg/100gb) | 8116 | 4.3 | 2.4 | 2.7 | 0.13 | Lauric acid (C12:0) |
| FA_C10_0 (mg/100gb) | 8108 | 4.5 | 2.3 | 2.5 | 0.11 | Capric acid (C10:0) |
aretail colour trait using HunterLab colour meter, bmg/100 g wet muscle tissue, c1Eicosapentaenoic acid, c2Docosapentaenoic acid, c3Docosahexaenoic acid, c4Dihomo-γ-linolenic acid
Fig. 1.
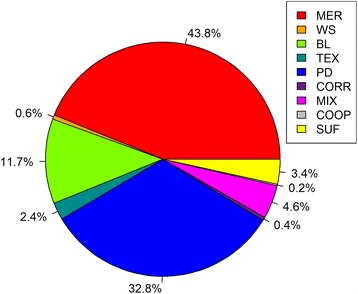
Pie chart showing percentages of total of 10,613 animals in each of sheep populations
Table 2.
Number of SNPs and their false discovery rates (%) for each trait beforeb (P < 5 × 10⁻⁷ and P < 5 × 10⁻⁷) and afterc (P < 5 × 10⁻⁷) fitting the 23 lead SNPs in the model
| P < 1 × 10⁻⁵ | P < 5 × 10⁻⁷ | |||||
|---|---|---|---|---|---|---|
| Traita | No.b | FDRb | No.b | FDRb | No.c | FDRc |
| PSWT | 245 | 2.1 | 105 | 0.2 | 44 | 0.6 |
| HCWT | 156 | 3.3 | 24 | 1.1 | 18 | 1.4 |
| LLWT | 64 | 8.0 | 28 | 0.9 | 12 | 2.1 |
| TOP | 58 | 8.8 | 10 | 2.6 | ||
| RND | 158 | 3.2 | 83 | 0.3 | 7 | 3.6 |
| BONE | 565 | 0.9 | 379 | 0.1 | 165 | 0.2 |
| LEGBONE | 888 | 0.6 | 626 | 0.04 | 596 | 0.04 |
| LMY | 256 | 2.0 | 125 | 0.2 | 12 | 2.1 |
| DRESSING | 256 | 2.0 | 112 | 0.2 | 14 | 1.8 |
| DMLOIN | 82 | 6.2 | 30 | 0.9 | 2 | 12.8 |
| IMF | 58 | 8.8 | 13 | 2.0 | 5 | 5.1 |
| LLFAT | 120 | 4.3 | 58 | 0.4 | 7 | 3.6 |
| CFATSCORE | 13 | 39.2 | ||||
| CCFAT | 223 | 2.3 | 122 | 0.2 | 12 | 2.1 |
| HGRFAT | 275 | 1.9 | 167 | 0.2 | 18 | 1.4 |
| CFAT5 | 43 | 11.9 | 9 | 2.8 | 1 | 25.5 |
| CEMW | 88 | 5.8 | 20 | 1.3 | 3 | 8.5 |
| CEMD | 23 | 22.2 | 2 | 12.8 | ||
| CEMA | 32 | 15.9 | 6 | 4.3 | 3 | 8.5 |
| SHEARF5 | 37 | 13.8 | 13 | 2.0 | 3 | 8.5 |
| SHEARF1 | 19 | 26.9 | 2 | 12.8 | ||
| MYOGLOBIN | 37 | 13.8 | 13 | 2.0 | 2 | 12.8 |
| GLYCOGEN | 52 | 9.8 | 20 | 1.3 | 2 | 12.8 |
| ICDHACTIVITY | 75 | 6.8 | 35 | 0.7 | 6 | 4.3 |
| RCL4 | 41 | 12.4 | 10 | 2.6 | 3 | 8.5 |
| RCL3 | 21 | 24.3 | 6 | 4.3 | 1 | 25.5 |
| RCL2 | 19 | 26.9 | 3 | 8.5 | 0 | |
| RCL1 | 12 | 42.5 | 0 | 0 | ||
| RCb4 | 6 | 85.0 | 0 | 0 | ||
| RCb3 | 9 | 56.7 | 0 | 0 | ||
| RCb2 | 5 | 102.0 | 0 | 0 | ||
| RCb1 | 19 | 26.9 | 2 | 12.8 | 0 | |
| RCa4 | 48 | 10.6 | 18 | 1.4 | 0 | |
| RCa3 | 55 | 9.3 | 24 | 1.1 | 0 | |
| RCa2 | 57 | 8.9 | 29 | 0.9 | 0 | |
| RCa1 | 68 | 7.5 | 23 | 1.1 | 1 | 25.5 |
| CFb | 6 | 85.0 | 0 | 0 | ||
| CFa | 36 | 14.2 | 2 | 12.8 | 3 | 8.5 |
| CFL | 18 | 28.3 | 4 | 6.4 | 23 | 1.1 |
| PH24LL | 154 | 3.3 | 89 | 0.3 | 10 | 2.6 |
| PH24ST | 55 | 9.3 | 24 | 1.1 | 0 | |
| IRON | 27 | 18.9 | 6 | 4.3 | 4 | 6.4 |
| ZINC | 9 | 56.7 | 2 | 12.8 | 0 | |
| EPADPADHA | 11 | 46.4 | 1 | 25.5 | 0 | |
| EPADHA | 12 | 42.5 | 3 | 8.5 | 2 | 12.8 |
| FA_C22_6n3 | 47 | 10.9 | 17 | 1.5 | 1 | 25.5 |
| FA_C22_5n3 | 6 | 85.0 | 1 | 25.5 | 1 | 25.5 |
| FA_C20_5n3 | 20 | 25.5 | 5 | 5.1 | 0 | |
| FA_C20_4n6 | 37 | 13.8 | 2 | 12.8 | 0 | |
| FA_C20_3n6 | 35 | 14.6 | 9 | 2.8 | 4 | 6.4 |
| FA_C18_2n6 | 11 | 46.4 | 1 | 25.5 | 0 | |
| FA_C18_0 | 23 | 22.2 | 7 | 3.6 | 0 | |
| FA_C16_0 | 21 | 24.3 | 3 | 8.5 | 1 | 25.5 |
| FA_C14_0 | 54 | 9.4 | 20 | 1.3 | 0 | |
| FA_C12_0 | 31 | 16.5 | 3 | 8.5 | 1 | 25.5 |
| FA_C10_0 | 22 | 23.2 | 9 | 2.8 | 1 | 25.5 |
a = empty cells are not available
Besides FDR, a Q-Q plot can demonstrate the rate of false positives as shown for 4 traits in Fig. 2. The Q-Q line deviates most from expectations in HGRFAT, followed by CEMA, SHEARF1, and FA_C22_5n3, which is consistent with FDR results being lowest in HGRFAT. The deviation of the Q-Q plots from expectation (at low P values) is evidence of polygenic inheritance [18], not inflation of the test statistic due to population structure, which has been well captured in our analysis by fitting breed and pedigree (see a model used in single-trait GWAS in materials and methods section). Many significant SNPs were clustered together within narrow regions on chromosome (OAR) 2, 3, 5, 6, 11, 12, 14, 18, 20, and 26. In a number of cases, those SNPs had associations with more than one trait.
Fig. 2.
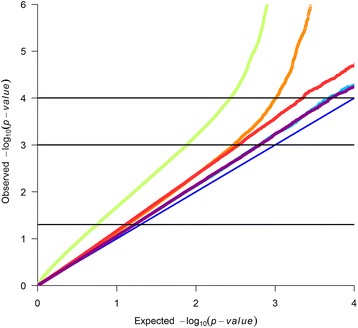
Quantile-quantile plot of P-values from single SNP genome wide association study of HGRFAT (darkorange), CEMA (red), SHEARF1 (skyblue), and FA_C22_5n3 (magenta), and from multi-trait analysis (olivegreen1). Observed and expected P-values would fall on the light blue line if there was no association. The top horizontal line is P < 0.0001, middle horizontal line is P < 0.001, and the bottom horizontal line is P < 0.05
Multi-trait analysis to detect pleiotropy
Combining the single trait GWAS in a multi-trait meta-analysis using a method described by [17] resulted in 586 significant SNPs (P < 5 × 10⁻⁷) (Fig. 3a). This corresponded to a FDR of 0.04 %, which was lower than for any individual trait tested in the single-trait GWAS, except LEGBONE.
Fig. 3.
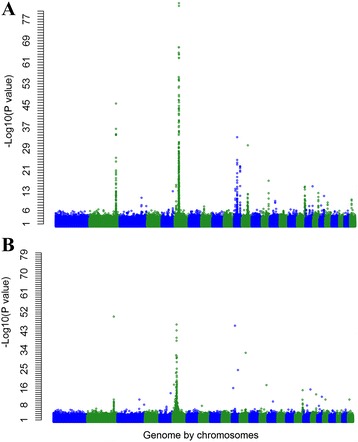
The Manhattan plot showing the –log10 (P-values) of SNPs of the multi-trait test of the whole genome (except the X chromosome) before (a) and after (b) fitting 23 lead SNPs in the model
To avoid testing a large number of closely linked SNPs, only the most significant SNPs (P < 10−5) within each 1 Mb window (98 SNPs) was selected from the multi-trait analysis in the discovery set (80 % of total of 10,613 animals from 9 different sheep breeds) for validation in an independent set of animals (the remaining 20 % of total animals). For each of 98 significant SNPs (Table 3), we performed a multiple regression analysis in which the SNP genotype is the dependent variable and the 56 phenotypes are the independent variables. This resulted in a linear index of 56 traits that had the maximum correlation with genotypes of one of the corresponding (98) significant SNPs. The association between a SNP and its corresponding linear index was subsequently tested in the validation sample. Out of the 98 SNPs that were found significant in the discovery sample, 35 were significant (P < 0.05) in the validation sample and all had an effect in the same direction in the validation sample as in the discovery sample (Table 3). This number validated (35) was higher than for any single trait (PSWT, LEGBONE, DRESS%, and CCFAT; Table 2), showing that multi-trait analysis detected and validated more associations than any single-trait analysis.
Table 3.
Number of significant SNPs (P < 10−5) in reference population that were also significant in the validation population
| P value in validation | No. of SNP | FDR% | %-same |
|---|---|---|---|
| multi-trait | |||
| 0.0001 | 17 | 0.05 | 100 |
| 0.001 | 24 | 0.3 | 100 |
| 0.01 | 31 | 2.2 | 100 |
| 0.05 | 35 | 9.5 | 100 |
| all | 98 | 73 | |
| single-trait (PSWT) | |||
| 0.0001 | 2 | 0.2 | 100 |
| 0.001 | 4 | 0.9 | 100 |
| 0.01 | 4 | 9.2 | 80 |
| 0.05 | 5 | 34.2 | 83 |
| all | 29 | 71 | |
| single-trait (LEGBONE) | |||
| 0.0001 | 8 | 0.06 | 100 |
| 0.001 | 9 | 0.5 | 100 |
| 0.01 | 13 | 3.4 | 100 |
| 0.05 | 17 | 11.2 | 100 |
| all | 48 | 84 | |
| single-trait (DRESS%) | |||
| 0.0001 | 2 | 0.19 | 100 |
| 0.001 | 3 | 1.23 | 100 |
| 0.01 | 7 | 4.67 | 100 |
| 0.05 | 9 | 16.4 | 90 |
| all | 31 | 78 | |
| single-trait (CCFAT) | |||
| 0.0001 | |||
| 0.001 | 1 | 2.2 | 100 |
| 0.01 | 3 | 6.6 | 100 |
| 0.05 | 4 | 22.6 | 100 |
| all | 19 | 83 |
%-same = percentage of SNPs, which have an effect in the same direction in both validation and reference sets
The multi-trait analysis showed utility to map QTL more precisely. Figure 4 summarises one such case, plotting all significant SNP effects for 6 single trait GWAS and the multi-trait statistic in a region of OAR 11. The multi-trait statistic identifies the SNP at 26,445,930 base pairs as most significant (P = 1.32 × 10⁻²⁷), while the 6 separate traits map the QTL between 25,849,323 – 26,445,930 base pairs.
Fig. 4.
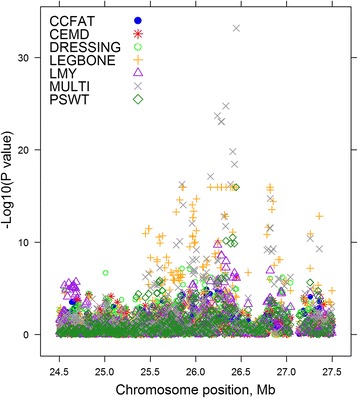
The –log10 (P-values) of single SNP regressions for 6 traits and multi-trait chi-squared statistic on a region of OAR 11
Conditional analyses accounting for 23 lead SNPs
The multi-trait analyses identified many narrow regions, containing more than one significant SNPs (e.g. on OAR 2, 3, 5, 6, 11, 12, 14, 18, 20, and 26; Fig. 3a). We selected 23 ‘lead SNPs’ (SNPlead) (Table 4), which were significant and not closely linked and therefore presumably tagging 23 independent QTL across the ovine genome. Table 5 lists their t values across all 56 traits. We then tested whether the selected SNPlead were perfectly tagging QTL in their respective regions by rerunning all single trait GWAS, while simultaneously fitting all 23 SNPlead (Table 4). Then the meta-analysis combining all traits was repeated. All 23 lead SNPs remained significant when fitted jointly suggesting that each is likely to tag a different QTL. Fitting the 23 SNPs substantially reduced the number of significant SNPs near the SNPlead (e.g., OAR 14 at 54 Mb and OAR 11 at 13, 26, and 50 Mb; Fig. 3b), showing that the SNPlead is in high linkage disequilibrium with the QTL in the region. However, in some cases (e.g. OAR 6 at 37 Mb), SNPs close to the SNPlead remained significant after fitting all 23 SNPlead, which may indicate that the SNPlead is in imperfect LD with the causal mutation or that there are multiple QTL in the region. In fact, there were still many significant SNPs (P < 5 × 10⁻⁷) scattered throughout the genome after fitting the 23 SNPlead indicating that there are likely to be many more smaller QTL affecting the 56 traits.
Table 4.
Total number of significant SNPs (P < 5 × 10⁻⁷), their FDR (%), and number of significant SNP on each chromosome (which is in parenthesis) for the 23 linear indexes corresponding to the 23 lead SNPs
| Groupa | SNP order | Linear indexb code | Mappedc gene code | Total No. SNPd | FDR (%) | chromosome number (number of significant SNPse) |
|---|---|---|---|---|---|---|
| 1 | 1st | OAR16_31.9 Mb | GHR | 86 | 0.30 | 3 (1), 6 (83), 8 (1), 24 (1) |
| 1 | 2nd | OAR14_34.8 Mb | LCAT | |||
| 1 | 3rd | OAR11_26.4 Mb | SLC16A11 | 231 | 0.11 | 1 (2), 3 (1), 5 (2), 6 (218), 9 (4), 11 (2), 13 (2) |
| 1 | 4 th | OAR6_37.5 Mb | LCORL | 489 | 0.05 | 1 (3), 2 (1), 6 (475), 7 (1), 9 (2), 11 (6), 15 (1) |
| 2 | 5th | OAR26_13.99 Mb | ACSL | |||
| 2 | 6th | OAR11_13.3 Mb | ACACA | 8 | 3.19 | 11 (6), 17 (2) |
| 2 | 7th | OAR11_49.9 Mb | FASN | 12 | 2.13 | 5 (1), 11 (6), 13 (4), 24 (1) |
| 2 | 8th | OAR6_15.2 Mb | SNORA70 | 14 | 1.82 | 6 (12), 11 (1), 13 (1) |
| 3 | 9th | OAR19_57.1 Mb | MRPS25 | 3 | 8.50 | 1 (1), 3 (2) |
| 3 | 10th | OAR2_219.6 Mb | PLCD4 | 57 | 0.45 | 1 (3), 2 (54) |
| 3 | 11th | OAR3_17.9 Mb | APOL6 | 3 | 8.50 | 3 (2), 23 (1) |
| 3 | 12th | OAR5_93.4 Mb | CAST | 5 | 5.10 | 3 (1), 5 (1), 11 (1), 21 (2) |
| 3 | 13th | OAR18_64.5 Mb | MEG8_2 | 32 | 0.80 | 18 (32) |
| 4 | 14 th | OAR8_25.0 Mb | ||||
| 4 | 15th | OAR22_20.3 Mb | PKD2L1 | 11 | 2.32 | 1 (1), 6 (2), 18 (8) |
| 4 | 16th | OAR12_49.6 Mb | SAMD11 | 15 | 1.70 | 12 (14), 17 (1) |
| 5 | 17th | OAR14_54.6 Mb | GYS1 | 10 | 2.55 | 2 (6), 4 (1), 10 (1), 18 (2) |
| 5 | 18th | OAR3_21.9 Mb | PNPLA3 | |||
| 5 | 19th | OAR21_39.7 Mb | FADS2 | |||
| 5 | 20th | OAR19_30.8 Mb | 5S-rRNA | |||
| 5 | 21st | OAR20_44.1 Mb | SMIM13 | 9 | 2.83 | 20 (9) |
| 5 | 22nd | OAR21_14.96 Mb | ||||
| 5 | 23rd | OAR15_47.5 Mb | U1 | 1 | 25.51 | 25 (1) |
a = Group of the lead SNPs that were clustered together as shown on Fig. 5
b = 23 linear indexes corresponding to the 23 lead SNPs
c = Genes located within 30 kb from each of lead SNPs excluding LCORL, and gene names are in Table 6
d = Total number of significant SNPs which are significantly (P < 5 × 10⁻⁷) associated with each of linear indexes
e = Number of significant SNP on each chromosome is in parentheses
Table 5.
Effects of 23 lead SNPs on the individual traits (signed values with |t| > 1 are shown)
| Group 1a | Group 2a | Group 3a | Group 4a | Group 5a | |||||||||||||||||||
|---|---|---|---|---|---|---|---|---|---|---|---|---|---|---|---|---|---|---|---|---|---|---|---|
| Lead SNP orderb | 1st | 2nd | 3rd | 4th | 5th | 6th | 7th | 8th | 9th | 10th | 11th | 12th | 13th | 14th | 15th | 16th | 17th | 18th | 19th | 20th | 21st | 22nd | 23rd |
| PSWT | 1.8 | 8.3 | 6.3 | 2.4 | −1.8 | 3.7 | 2.3 | 2.3 | −1.4 | 2.2 | |||||||||||||
| HCWT | 5.6 | 1.6 | 1.3 | −1.4 | 1.1 | 3.0 | 1.0 | 4.0 | |||||||||||||||
| LLWT | 1.4 | 1.6 | 1.1 | 2.1 | 3.1 | 6.5 | −1.3 | 1.6 | −1.7 | 1.3 | |||||||||||||
| TOP | 2.0 | 3.4 | 5.5 | −1.2 | −1.8 | 2.9 | 2.4 | 3.3 | 1.2 | −1.6 | 1.4 | 2.5 | |||||||||||
| RND | 2.5 | 7.2 | 8.1 | −1.7 | 3.1 | 1.9 | 1.4 | −1.0 | −1.0 | 2.5 | |||||||||||||
| BONE | 2.7 | 2.7 | 10.9 | 13.7 | 2.2 | 2.6 | 1.3 | −2.2 | 1.7 | 1.2 | |||||||||||||
| LEGBONE | 5.7 | 2.4 | 12.3 | 19.1 | −1.3 | 2.7 | −1.6 | −1.1 | −1.0 | 2.3 | |||||||||||||
| LMY | 3.3 | 1.2 | 5.0 | 8.7 | 1.2 | −1.5 | 1.9 | −1.2 | 2.9 | 1.8 | −2.5 | −2.5 | −1.0 | ||||||||||
| DRESS% | −3.6 | −3.1 | −3.4 | −8.7 | −2.4 | 1.2 | 1.1 | −1.6 | −1.3 | 1.5 | 4.7 | ||||||||||||
| DMLOIN | −1.2 | −2.6 | −6.4 | −2.1 | −1.3 | −2.1 | 2.7 | 1.9 | 1.1 | ||||||||||||||
| IMF | −1.7 | −1.8 | −4.0 | 2.2 | −1.8 | −2.0 | −5.9 | −1.6 | 2.7 | 1.3 | −1.4 | −1.5 | 1.2 | −1.3 | |||||||||
| LLFAT | −2.5 | −4.1 | −6.4 | 2.0 | 1.8 | 1.7 | 1.9 | 1.1 | 2.5 | 3.2 | 2.7 | ||||||||||||
| CFATSCORE | −2.4 | 1.1 | −4.1 | −4.0 | 1.1 | 1.2 | 1.4 | −1.5 | −1.4 | 2.0 | |||||||||||||
| CCFAT | −2.5 | −2.9 | −3.1 | −9.2 | 3.0 | 1.4 | −2.1 | 1.9 | −1.7 | 1.2 | −1.5 | −1.7 | 1.3 | ||||||||||
| HGRFAT | −3.4 | −1.9 | −7.1 | −9.3 | 1.8 | 2.2 | −2.0 | 1.6 | 1.3 | −1.5 | 1.9 | 1.5 | 1.5 | 1.0 | |||||||||
| CFAT5 | −2.2 | −2.2 | −4.6 | −4.6 | −2.0 | 2.0 | 1.4 | 1.9 | −1.2 | −1.5 | 2.9 | ||||||||||||
| CEMW | 2.1 | 1.2 | 5.4 | 1.1 | 1.2 | 1.1 | −2.2 | −1.9 | 2.3 | ||||||||||||||
| CEMD | −2.9 | −1.8 | −5.0 | −3.8 | 1.4 | 3.7 | 1.5 | −2.5 | 1.6 | 1.6 | −1.5 | ||||||||||||
| CEMA | −1.0 | −1.9 | −3.4 | 1.1 | 2.7 | 1.6 | 2.0 | −3.5 | 1.0 | −1.6 | 1.9 | ||||||||||||
| SHEARF5 | 2.5 | 1.2 | 3.3 | 3.7 | 1.2 | −1.0 | −3.4 | −2.6 | 8.0 | 5.6 | 1.2 | −1.1 | 1.8 | 1.2 | −4.5 | ||||||||
| SHEARF1 | 2.7 | 1.8 | 1.1 | 1.8 | 1.4 | −1.2 | −2.4 | −1.3 | 5.5 | 3.3 | −1.5 | −1.3 | 2.6 | −1.3 | |||||||||
| MYOGLOBIN | 2.4 | −2.3 | −3.6 | −1.3 | 5.4 | 5.5 | 6.3 | 2.1 | 2.0 | 2.1 | 1.4 | −1.9 | −1.2 | ||||||||||
| GLYCOGEN | 2.0 | −1.9 | 1.5 | 7.2 | 1.0 | 1.0 | 8.8 | −1.0 | |||||||||||||||
| ICDHACTIVITY | −1.2 | −1.5 | 1.4 | −1.4 | 5.4 | −1.8 | −6.9 | −1.8 | 1.4 | −1.0 | −1.4 | ||||||||||||
| RCL4 | −1.1 | 1.4 | 2.3 | 1.3 | −4.9 | −4.3 | −5.1 | −1.5 | −3.0 | −1.5 | −2.5 | −3.4 | 1.6 | 2.3 | |||||||||
| RCL3 | −2.1 | 2.0 | 2.2 | −4.0 | −5.5 | −4.6 | −2.5 | −3.7 | −2.3 | −2.2 | −3.1 | 2.0 | 2.5 | ||||||||||
| RCL2 | −1.4 | 1.6 | 2.8 | −3.7 | −5.3 | −4.2 | −2.9 | −3.7 | −2.7 | −2.5 | −3.5 | −1.5 | 1.3 | 1.2 | 1.7 | ||||||||
| RCL1 | 1.2 | 1.8 | −3.8 | −2.3 | −3.8 | −1.6 | −2.7 | −1.1 | 3.7 | 1.1 | 1.9 | 1.9 | 1.3 | 1.2 | |||||||||
| RCb4 | 1.2 | −1.3 | −2.6 | 1.1 | 2.9 | 1.6 | 1.6 | −1.1 | |||||||||||||||
| RCb3 | −1.7 | −2.0 | 1.7 | 1.0 | 1.5 | 1.2 | 1.8 | −2.8 | |||||||||||||||
| RCb2 | −2.8 | −1.2 | 1.1 | −1.1 | 2.5 | 1.5 | 2.0 | 2.6 | 2.2 | ||||||||||||||
| RCb1 | −1.7 | −2.6 | −2.0 | −1.8 | 5.0 | 1.9 | 3.6 | 3.2 | 1.4 | 1.3 | |||||||||||||
| RCa4 | −1.6 | −3.3 | −1.6 | 4.1 | 3.9 | 2.1 | 1.3 | 1.4 | 7.4 | 4.1 | 1.5 | 2.1 | 2.4 | −1.5 | −1.1 | ||||||||
| RCa3 | 1.1 | −2.7 | −1.1 | −3.9 | 1.2 | −1.7 | 2.0 | 3.7 | 5.6 | 2.6 | 2.0 | 7.5 | 4.7 | 1.6 | 1.6 | ||||||||
| RCa2 | 1.2 | −2.4 | −1.7 | −4.1 | −1.3 | −1.6 | 3.6 | 3.2 | 5.3 | 2.3 | 1.6 | 7.2 | 6.0 | 1.4 | 1.5 | 1.3 | −1.1 | ||||||
| RCa1 | −1.1 | −3.3 | −4.1 | −1.8 | 2.0 | 6.7 | 2.8 | 3.2 | 2.0 | 1.5 | 6.6 | 3.0 | 1.4 | −2.6 | |||||||||
| CFb | −1.2 | −3.1 | 1.3 | −2.9 | 1.3 | −1.2 | 2.4 | 2.9 | 3.1 | ||||||||||||||
| CFa | −1.6 | −3.9 | −2.4 | 6.9 | 3.9 | −1.0 | 3.4 | 4.3 | −1.4 | −1.2 | 1.9 | ||||||||||||
| CFL | −1.2 | 1.0 | 1.3 | 1.3 | −5.9 | −2.4 | −6.1 | −3.7 | −2.3 | 1.7 | 2.5 | −1.1 | |||||||||||
| PH24LL | 2.5 | 3.0 | −2.1 | −11.1 | −2.5 | −1.1 | −4.9 | −3.1 | −1.9 | 1.6 | |||||||||||||
| PH24ST | −1.4 | −2.0 | −9.0 | −1.1 | 1.3 | −5.6 | −1.2 | −1.1 | −2.5 | ||||||||||||||
| IRON | −2.8 | −1.5 | 1.4 | 5.2 | 6.2 | 3.7 | 1.4 | 1.5 | −1.9 | −1.3 | 1.1 | 1.2 | −2.7 | −3.5 | |||||||||
| ZINC | 1.3 | −2.3 | −3.7 | −2.3 | 1.1 | −1.7 | −1.9 | ||||||||||||||||
| EPADPADHA | 1.1 | −1.8 | 1.1 | −1.3 | 2.5 | 3.3 | −1.1 | −1.2 | −7.6 | −2.2 | 3.6 | −1.3 | 1.3 | ||||||||||
| EPADHA | 1.0 | 1.2 | 1.9 | 4.3 | 1.5 | −1.3 | −7.5 | −2.1 | 2.6 | 1.6 | 1.9 | −1.2 | −1.8 | ||||||||||
| FA_C22_6n3 | 2.5 | 1.1 | −1.4 | 2.8 | 1.0 | −1.8 | 2.4 | 3.6 | −1.3 | −1.3 | −6.8 | −1.0 | 1.5 | 2.6 | 6.8 | −1.6 | |||||||
| FA_C22_5n3 | −1.5 | 2.8 | 1.0 | −1.4 | −1.1 | 1.0 | −1.3 | −5.8 | 3.5 | −2.7 | |||||||||||||
| FA_C20_5n3 | 1.1 | 2.4 | 4.1 | −1.6 | 2.2 | −1.1 | −8.2 | 3.3 | 2.4 | ||||||||||||||
| FA_C20_4n6 | 2.0 | 1.3 | 1.5 | 1.3 | −1.4 | 1.9 | 5.4 | −2.3 | 1.2 | 1.1 | −4.6 | −2.9 | −1.6 | 3.1 | |||||||||
| FA_C20_3n6 | 2.1 | −1.4 | −1.2 | 2.6 | −1.2 | 2.2 | 2.8 | −2.0 | 2.1 | −5.7 | 2.4 | 8.2 | 1.3 | ||||||||||
| FA_C18_2n6 | 2.7 | 3.7 | −2.0 | −6.1 | −1.8 | −2.2 | |||||||||||||||||
| FA_C18_0 | −1.3 | 2.3 | 2.5 | −2.5 | −1.6 | −1.8 | −1.0 | −2.1 | −3.0 | −2.7 | 5.5 | 1.4 | 1.2 | 1.2 | |||||||||
| FA_C16_0 | −1.8 | 3.6 | 4.9 | 6.0 | −1.6 | −1.1 | −1.3 | −1.6 | 1.2 | −2.0 | 1.2 | −1.0 | −1.1 | ||||||||||
| FA_C14_0 | −2.7 | −2.7 | 4.9 | 8.4 | 3.7 | −2.9 | −1.2 | ||||||||||||||||
| FA_C12_0 | −1.7 | 1.0 | −3.6 | −4.5 | 2.2 | 3.3 | 3.0 | −3.3 | −1.7 | 2.9 | 2.3 | −1.9 | |||||||||||
| FA_C10_0 | 1.5 | −3.3 | 7.2 | 3.8 | 3.0 | −2.1 | −3.0 | −1.2 | −1.1 | 1.3 | 1.2 | 2.4 | −2.0 | ||||||||||
Cluster analysis to find QTL with a similar pattern of effects across traits
The correlation of effects across all 56 traits was calculated for all pairs of SNPlead (Fig. 5). While the correlation of effects for the SNPlead 3 (OAR 6) and the SNPlead 4 (OAR 11) was more than 0.8, most correlations were moderate to low. A moderate to low correlation suggests QTL with different patterns of effects across traits, however, sampling errors in estimating SNP effects also reduce the absolute value of the correlation. If two QTL affect the same physiological pathway one might expect them to have the same pattern of effects and, hence, a higher correlation. Cluster analysis of the 23 SNPlead (Table 4) based on the correlation matrix divided them into 5 loosely defined groups (Fig. 5), which shared patterns of effects across traits (Table 5).
Fig. 5.
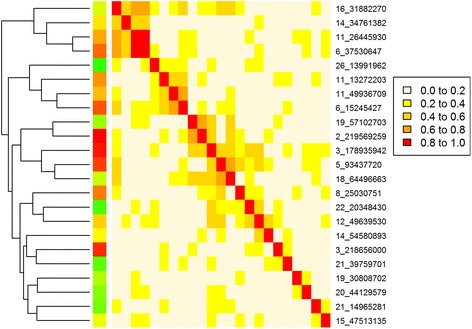
Correlation matrix between the 23 lead SNPs calculated from SNP effects on 56 traits
Group 1 consisted of 4 SNPlead on OAR 16, 14, 11 and 6 (Table 4 and Fig. 5). This group clustered as an outer branch (Fig. 5), indicating that this group of SNPs was distinct from the other 4 groups. Table 5 shows that these 4 SNPlead increased carcass and skeletal weights and lean meat yield and decreased dressing percentage, fatness, and muscling. They could be described as changing mature (skeletal or carcass) size.
Group 2 consisted of 4 SNPlead (Table 4 and Fig. 5). These SNPlead had an allele that increased the concentration of saturated FA with carbon chain of C16, C14, C12, and C10 (palmitic, myristic, lauric, and capric acids, respectively) and decreased stearic acid (C18:0) and/or some unsaturated FA (Table 5). There was also a tendency for the allele that increased saturated FA composition to also increase fatness (Table 5). They could be described as changing fat composition.
Group 3 consisted of 5 SNPlead that influenced meat retail colour (by increasing redness of meat (RCa*) and decreasing lightness of meat (RCl*)) and increased myoglobin and wet iron content in muscle. However, on other traits, they separated into two subgroups (Table 4 and Fig. 5). One sub-group consisted of 2 SNPs (9th and 10th SNPlead) that increased meat tenderness (i.e., decreased shear force), eye muscle area and eye muscle depth, glycogen, isocitrate dehydrogenase (ICDH) activity, and polyunsaturated FA (omega-3 and -6) level and decreased meat pH level (Table 5). The other sub-group contained 3 SNPs (11th, 12th, and 13th SNPlead), and 2 of them (12th and 13th SNPlead) had decreased meat tenderness and increased top side, loin weight and eye muscular area. Additionally, the 13th SNPlead (OAR18_64.5 Mb) decreased intramuscular fatness and increased leanness. They could be described as influencing meat colour and eating quality.
Group 4 consisted of 3 SNPlead (Table 4). Correlations between these SNPlead were only moderate and they were also moderately correlated with some SNPlead from group 3 (Fig. 5). This group tended to influence meat colour and polyunsaturated (omega-3 and -6) FA levels (Table 5). Additionally, the 14th SNPlead decreased muscling and the 16th SNPlead significantly decreased ICDH activity and omega-3 and -6 FA levels. They could be described as affecting meat colour and FA composition.
Group 5 consisted of 7 SNPs, which were less correlated and do not form a consistent group (Fig. 5). The 17th SNP (OAR14_54.6 Mb) increased glycogen content and meat redness (increased FCa*), and decreased ultimate pH (pH24) (Table 5). This was similar to the 10th and 9th SNPlead in Group 3, but it did not affect tenderness. The 23rd SNPlead (OAR15_47.5 Mb) increased hot carcass weight and dressing percentage and decreased iron content. Each of the other 5 SNPs (18th-22nd SNPlead) in this group had a significant effect on specific traits including FA composition or fatness or tenderness.
Searching for more QTL in the same pathway using linear indices of SNPlead
Genes that operate in the same pathway might be expected to show the same pattern of pleiotropic effects. We wanted to harness the power of our multi-trait analysis to add additional QTL to the 5 broad functional groups. For each of the 23 lead SNPs, we used the same linear index as was used previously to validate the SNP effects. That is, we calculated the linear combination of the 56 traits that was most highly correlated with the genotypes at each of the SNPlead [19]. Then we performed new GWAS using the linear index as if it was a new trait. All SNPlead were also fitted simultaneously in the GWAS, as we were primarily interested in finding additional QTL to those captured by the SNPlead. This process added a total of 687 significant SNPs (P < 5 × 10⁻⁷) that were assigned to the same group as the SNPlead whose linear index was used as the phenotype (Table 4). Usually this procedure identified a set of closely linked SNPs, presumably indicating a single QTL.
Identifying plausible candidates
We searched for genes within genomic regions of 30 kb up and downstream from each of 687 SNPs from linear index GWAS and the 23 SNPlead. If there were multiple significant SNPs within a 60 kb window only the most significant SNP was taken forward. The closest gene was chosen as a likely candidate. In one exception (SNPlead 4 at OAR6_37.5 Mb), we expanded the 60 kb range as the nearest gene (LCORL) was 78 kb away (Additional file 1: Figure S1a). This identified 71 SNPs in or close to potential candidate genes (Table 6). Table 6 lists these genes in genome position order.
Table 6.
List of plausible candidate genes
| Group | Lead SNP | OAR | POS | Gene code | Gene name | Comments |
|---|---|---|---|---|---|---|
| Group1 | 1st | 16 | 31882270 | GHR | Growth hormone receptor precursor | Lead SNP |
| Group1 | 1st | 8 | 73201627 | UST | uronyl-2-sulfotransferase | Linear Index SNP |
| Group1 | 2nd | 14 | 34761382 | LCAT | lecithin-cholesterol acyltransferase | Lead SNP |
| Group1 | 3rd | 11 | 26445930 | SLC16A13 (TP53 a) | Solute carrier family 16 member | Lead SNP |
| Group1 | 3rd | 13 | 700413 | PLCB1 | Phosphoinositide phospholipase C | Linear Index SNP |
| Group1 | 3rd | 5 | 28332019 | SNX24 | Sorting nexin-24 | Linear Index SNP |
| Group1 | 3rd | 6 | 40133729 | PACRGL | PARK2 Co-Regulated-Like | Linear Index SNP |
| Group1 | 3rd | 6 | 44672729 | PI4K2B | phosphatidylinositol 4-kinase type 2 beta | Linear Index SNP |
| Group1 | 4 th | 6 | 43309694 | PPARGC1A | Peroxisome proliferator-activated receptor gamma coactivator 1-alpha | Linear Index SNP |
| Group1 | 4 th | 11 | 26415211 | ALOX12 | 12-lipoxygenase Fragment | Linear Index SNP |
| Group1 | 4 th | 11 | 28366019 | STX8 | Syntaxin 8 | Linear Index SNP |
| Group1 | 4 th | 1 | 171579973 | MYH15 | myosin, heavy chain 15 | Linear Index SNP |
| Group1 | 4 th | 6 | 13255764 | ALPK1 | alpha-kinase 1 | Linear Index SNP |
| Group1 | 4 th | 6 | 19164907 | TBCK | TBC1 domain containing kinase | Linear Index SNP |
| Group1 | 4 th | 6 | 23695577 | PPP3CA | protein phosphatase 3, Catalytic Subunit, Alpha Isozyme | Linear Index SNP |
| Group1 | 4 th | 6 | 26074029 | RAP1GDS1 | Rap1 GTPase-GDP dissociation stimulator 1 | Linear Index SNP |
| Group1 | 4 th | 6 | 29441012 | BMPR1B | bone morphogenetic protein receptor, type IB | Linear Index SNP |
| Group1 | 4 th | 6 | 36811936 | MEPE | Matrix Extracellular Phosphoglycoprotein | Linear Index SNP |
| Group1 | 4 th | 6 | 37237578 | NCAPG | non-SMC condensin I complex, subunit G | Linear Index SNP |
| Group1 | 4 th | 6 | 37530647 | LCORL | Ligand Dependent Nuclear Receptor Corepressor-Like | Lead SNP |
| Group1 | 4 th | 6 | 55607047 | ARAP2 | ArfGAP with RhoGAP domain, ankyrin repeat and PH domain 2 | Linear Index SNP |
| Group1 | 4 t | 6 | 67191744 | FRYL | FRY-like | Linear Index SNP |
| Group1 | 4th | 9 | 36164331 | PLAG1 | pleiomorphic adenoma gene 1 | Linear Index SNP |
| Group2 | 5th | 26 | 13991962 | ACSL1 | acyl-CoA synthetase long-chain family member 1 | Lead SNP |
| Group2 | 6th | 11 | 13223903 | ACACA | acetyl-CoA carboxylase alpha | Linear Index SNP |
| Group2 | 6th | 11 | 13272203 | Lead SNP | ||
| Group2 | 6th | 11 | 13472077 | SYNRG | synergin, gamma | Linear Index SNP |
| Group2 | 7th | 11 | 49936709 | FASN | Fatty acid synthase Fragment | Lead SNP |
| Group2 | 7th | 13 | 71732382 | SGK2 | serum/glucocorticoid regulated kinase 2 | Linear Index SNP |
| Group2 | 7th | 24 | 33535204 | MLXIPL | MLX interacting protein-like | Linear Index SNP |
| Group2 | 7th | 5 | 4503837 | ISYNA1 | Inositol-3-phosphate synthase 1 | Linear Index SNP |
| Group2 | 8th | 6 | 15245427 | SNORA70 | small nucleolar RNA, H/ACA box 70 | Lead SNP |
| Group2 | 8th | 6 | 15303638 | ELOVL6 | ELOVL fatty acid elongase 6 | Linear Index SNP |
| Group2 | 8th | 6 | 97914579 | AGPAT9 | 1-acylglycerol-3-phosphate O-acyltransferase 9 | Linear Index SNP |
| Group3 | 9th | 19 | 57102703 | MRPS25 | 28S ribosomal protein S25, mitochondrial | Lead SNP |
| Group3 | 9th | 3 | 178861487 | MB | Myoglobin | Linear Index SNP |
| Group3 | 10th | 1 | 31018467 | PRKAA2 | protein kinase, AMP-activated, alpha 2 catalytic subunit | Linear Index SNP |
| Group3 | 10th | 2 | 212089089 | ERBB4 | v-erb-b2 avian erythroblastic leukemia viral oncogene homolog 4 | Linear Index SNP |
| Group3 | 10th | 2 | 219569259 | PLCD4 | 1-phosphatidylinositol-4,5-bisphosphate phosphodiesterase delta-4 | Lead SNP |
| Group3 | 10th | 2 | 219741728 | CYP27A1 | cytochrome P450, family 27, subfamily A, polypeptide 1 | Linear Index SNP |
| Group3 | 11th | 23 | 5077077 | NETO1 | neuropilin (NRP) and tolloid (TLL)-like 1 | Linear Index SNP |
| Group3 | 11th | 3 | 178935942 | APOL6 | apolipoprotein L, 6 | Lead SNP |
| Group3 | 12th | 11 | 19757132 | PROCA1 | Protein PROCA1 | Linear Index SNP |
| Group3 | 12th | 21 | 42744428 | CAPN1 | Calpain-1 catalytic subunit | Linear Index SNP |
| Group3 | 12th | 3 | 193152752 | ABCC9 | ATP-binding cassette, sub-family C (CFTR/MRP), member 9 | Linear Index SNP |
| Group3 | 12th | 5 | 93437720 | CAST | Calpastatin | Lead SNP |
| Group3 | 13th | 18 | 63919438 | WARS | Tryptophanyl-tRNA synthetase, cytoplasmic | Linear Index SNP |
| Group3 | 13th | 18 | 64095685 | BEGAIN | brain-enriched guanylate kinase-associated | Linear Index SNP |
| Group3 | 13th | 18 | 64349803 | DLK1 | delta-like 1 homolog | Linear Index SNP |
| Group3 | 13th | 18 | 64452243 | MEG3_2 | maternally expressed 3 | Linear Index SNP |
| Group3 | 13th | 18 | 64496663 | MEG8_2 | maternally expressed 8 | Lead SNP |
| Group3 | 13th | 18 | 66755669 | MARK3 | MAP/microtubule affinity-regulating kinase 3 | Linear Index SNP |
| Group4 | 14th | 8 | 25030751 | (LAMA4) | laminin, alpha 4 | Lead SNP |
| Group4 | 15th | 18 | 6026853 | MEF2A | Myocyte-specific enhancer factor 2A | Linear Index SNP |
| Group4 | 15th | 1 | 373512 | FARP2 | FERM, RhoGEF and pleckstrin domain protein 2 | Linear Index SNP |
| Group4 | 15th | 22 | 20348430 | PKD2L1 (SCD b) | polycystic kidney disease 2-like 1 | Lead SNP |
| Group4 | 16th | 12 | 49339905 | B3GALT6 | UDP-Gal-betaGal beta 1,3-galactosyltransferase polypeptide 6 | Linear Index SNP |
| Group4 | 16th | 12 | 49639530 | SAMD11 | sterile alpha motif domain containing 11 | Lead SNP |
| Group4 | 16th | 17 | 63396022 | MYO1H | myosin IH | Linear Index SNP |
| Group4 | 16th | 12 | 49270130 | GLTPD1 | glycolipid transfer protein domain containing 1 | Linear Index SNP |
| Group5 | 17th | 14 | 54580893 | GYS1 | Glycogen synthase, muscle | Lead SNP |
| Group5 | 17th | 4 | 54562436 | PPP1R3A | protein phosphatase 1, regulatory (inhibitor) subunit 3A | Linear Index SNP |
| Group5 | 18th | 3 | 218656000 | PNPLA3 | patatin-like phospholipase domain containing 3 | Lead SNP |
| Group5 | 19th | 21 | 39759701 | FADS2 | Fatty acid desaturase 2 | Lead SNP |
| Group5 | 20th | 19 | 30808702 | 5S_rRNA | RNA, 5S ribosomal | Lead SNP |
| Group5 | 21th | 20 | 44129579 | SMIM13 | small integral membrane protein 13 | Lead SNP |
| Group5 | 21th | 20 | 44237093 | ELOVL2 | ELOVL fatty acid elongase 2 | Linear Index SNP |
| Group5 | 22th | 21 | 14965281 | Lead SNP | ||
| Group5 | 23th | 15 | 47513135 | U1 | RNA, variant U1 | Lead SNP |
| Group5 | 23th | 25 | 29372500 | USP54 | ubiquitin specific peptidase 54 | Linear Index SNP |
a TP53 and b SCD genes which were mapped near this region could be the plausible candidates
In Group 1, 23 SNPs (including 4 SNPlead) were annotated to possible candidate genes (Fig. 6a and Table 6). The function of GHR makes this gene a plausible member of a group affecting mature size and exogenous administration of growth hormone leads to increased growth and decreased fatness which is the phenotype of SNPlead 1 near the GHR gene. However, in general, the 23 genes in this group do not share an obvious biological function although 4 (GHR, LCORL, LCAT, PLAG1) genes have been associated with a similar phenotype in other species as discussed below. NCAPG (non-SMC condensing I complex, subunit G) is closely linked to LCORL, so there may be only one QTL in this region [9, 20, 21]. Not surprisingly, the effects of SNPs near LCORL and NCAPG are highly correlated. The SNPs tagging LCORL, SLC16A13, GHR, FRYL, and BMPR1B were clustered together as one group within Group 1 (Fig. 6a) and the effects of those SNPs were highly correlated (r > 0.6).
Fig. 6.
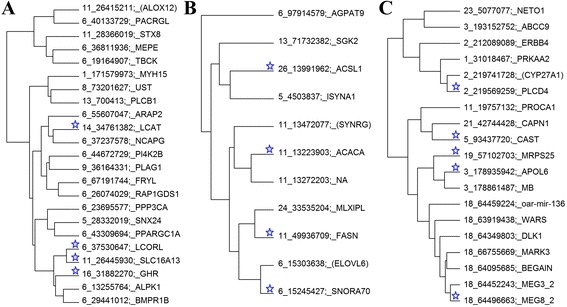
Dendrogram drawn based on correlation matrix between the effects of the lead SNPs and their linear index SNPs within each group: a Group 1 SNPs (chromosome and position in base pair) along with their annotated gene names; b Group 2 SNPs; and c Group 3 SNPs. Lead SNPs within each group are highlighted with blue stars; Genes (in brackets) are the alternative most likely putative candidates within the regions
The 4 SNPlead in Group 2 were expanded with 7 additional SNPs from the linear index GWAS and re-clustered within the group (Fig. 6b). The 11 SNPs tag only 8 different chromosomal regions and in 7 of these there is a gene directly involved in FA synthesis or fat synthesis (FASN, MLXIPL, EVOLV6, ACACA, SYNRG, ACSL1, ISYNA1, SGK2, and AGPAT9) (Fig. 6b). Although the closest gene to SNPlead 6 is SNORA70, the analysis of the linear index derived from SNPlead 3, identified a significant SNP only 60 kb away whose nearest gene is ELOVL6, which is a far more plausible candidate. ACSL1, ACACA (said to be the rate limiting step), FASN and EVOLV6 code for enzymes used in fatty acid synthesis and the SNPs near them all have an allele that increases the proportion of C10 to C16 saturated FAs (Table 5). Usually FA synthesis does not proceed to chains longer than C16. It is therefore understandable that the allele that increases C10 to C16 FAs tends to increase total fatness (Table 5). AGPAT9 encodes an enzyme used in triglyceride synthesis. The MLXIPL protein activates carbohydrate response element motifs in the promoters of triglyceride synthesis genes. GO and KEGG analysis in STRING (functional protein association network program) [22] confirms this functional similarity between the genes near group 2 SNPs (Additional file 2: Figure S2). For example, according to KEGG and GO terms, 2 proteins (FASN and ACACA) were involved together in FA biosynthesis (Bonferroni P = 3.8 × 10⁻⁴), 5 proteins (FASN, ACACA, ACSL1 (or FACL2), AGPAT9, and ISYNA1) in metabolic pathways (Bonferroni P = 7.6 × 10⁻³), and 4 proteins (FASN, ELOVL6, ACSL1, and ISYNA1) in lipid biosynthesis process (Bonferroni P = 3.8 × 10⁻²).
Group 3 (Fig. 6c) consisted of 19 SNPs including 5 SNPlead that were assigned in this group previously. We called Group 3 SNPs “meat colour” SNPs because this is the most consistent feature of the group. The allele that made the meat redder and darker also tended to increase myoglobin and iron content, decrease pH and increase muscling. However, in other respects the SNPs in group 3 differ in their phenotypic effects. The 9th and 10th SNPlead decrease shear force while the 12th and 13th SNPlead increase it. Considering the differences in phenotype and in the function of the candidate genes, there may be no single physiological process that is common to all SNPs in group 3.
One group of SNPs were found within OAR 18 63.3-65.6 Mb near MEG3 (or GTL2), MEG8, DLK1, oar-mir-136 (or PEG11), BEGAIN, and WARS (Fig. 7). This SNP increases muscling and shear force which is the phenotype of the callipyge mutation which maps to the same region [15, 16]. The callipyge mutation is not known to occur in Australian sheep but the Carwell mutation has a similar, but less dramatic phenotype, and maps to the same region [16, 23] so it is likely that the SNPlead 13 is tagging the Carwell mutation. The SNPlead 12 tags CAST and the linear index derived from this SNP was significant for a SNP tagging CAPN1. Both CAST and CAPN1 have also been linked to tenderness in cattle [24–26]. The effects of the SNPlead 12 (tagging CAST) and 13 (tagging Carwell) were highly correlated (Fig. 5). Although these genes do not have similar functions, both decrease muscle protein turnover which may help to explain why they both increase muscling and decrease tenderness. The SNPlead 11 (OAR3_17.8 Mb) was mapped near the genes APOL6 (apolipoprotein L6) and MB (myoglobin) and was strongly associated with meat myoglobin content and also FA composition.
Fig. 7.
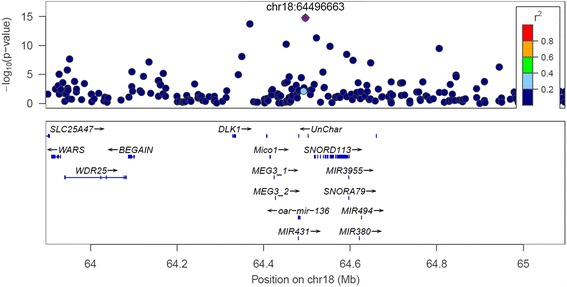
The –log10 (P-values) of SNP effects from the multi-trait test results for OAR18_64.5 Mb, where not all genes in this region are shown: The lead SNP is shown by a purple diamond in each plot (labelled with chromosome and position, Mb) and the LD between this variant and all others is colour coded
Group 4 and 5 consist of a total of 18 SNPs which do not cluster tightly and do not show any obvious common mechanism although individual candidate genes do have a function closely related to the phenotypic effects of the SNP tagging them. The SNPlead 17 at OAR14_54.5 Mb of Group 5 has a strong association with muscle glycogen content but not with ICDH activity (Table 5) and mapped within the region of the gene GYS1 (glycogen synthase). The SNPlead 19 (OAR21_39.7 Mb) and 18 (OAR3_21.8 Mb) mapped near genes FADS2 (a component of a lipid metabolic pathway that catalyzes biosynthesis of highly unsaturated FA) and PNPLA3 (which is involved in both triacylglycerol lipase and acylglycerol O-acyltransferase activities), respectively. In this study, these SNPs were strongly associated with poly-unsaturated FA concentration. Similarly, the linear index of the 21th SNPlead (OAR20_44.1 Mb) was associated with a SNP only 100 kb from the SNPlead and close to the gene ELOVL2 (Table 6). This SNPlead had a strong positive effect (t = 6.8) on docosapentaenoic acid (DHA or FA_C22_6n3), but not with eicosapentaenoic acid (EPA or FA_C20_5n3) (Table 5). ELOVL2 adds 2 carbons to polyunsaturated long chain FAs so it is a logical candidate for the effect of both SNPs. The same pattern of effects of a SNP in ELOVL2 was observed in the human GOLDN study [19]. Furthermore, SCD (delta-9 desaturase), which is involved in fatty acid biosynthesis, primarily the synthesis of oleic acid (FA_C18_1n-9) by desaturation of stearic acid (FA_C18_0), was located just in 45 kb away from the 15th SNPlead (OAR22_20.3 Mb) (Additional file 1: Figure S1b). So, SCD may be a plausible candidate gene for this region. We investigated further if there were any significant SNPs near or within SCD, which are in LD with the SNPlead OAR22_20.3 Mb. There were 3 significant SNPs (P < 3.1 × 10⁻⁴), located 8.5 kb-22.5 kb upstream to the SCD gene and all 3 were in LD (r2 = 0.16-0.67) with this SNPlead (Additional file 1: Figure S1b).
Do these candidate genes affect similar phenotypes in other species?
Comparison with cattle
Of the genes in Table 6 (i.e. near 23 SNPlead or SNPs highly significantly associated with linear indices derived from the SNPlead), 3 (LCAT, FADS and PLAG1) were also highly significant and had similar effects in a multi-trait analysis of beef cattle [27]. Of the other genes found by [27], in this study we found 6 SNPs (P < 10−3) within the region of gene LEPR, 1 SNP (P = 1.5 × 10⁻³) within HMGA2, 1 SNP (P = 4.1 × 10⁻⁵) within PLIN3, and 1 SNP (P = 8.8 × 10⁻⁶) within PACRG. Saatchi et al. [9] also found QTL regions harbouring genes associated with growth including PLAG1, LCORL, NCAPG, and HMGA2 in their GWAS in 18,000 animals from 10 US beef cattle breeds.
Comparison with human GWAS
We also investigated the overlap of our QTL with genes associated with height, BMI, waist to hip ratio, and obesity in humans, which are well documented and have been validated in multiple studies. We selected the BMI and BMI-related gene lists reported in 3 recent human meta-analyses [2, 27–29]. In total, 229 unique genes from these 3 studies (96 [2], 58 [27], and 78 [28, 29] genes) were tested. 184 of these genes could be mapped to positions on the sheep reference genome (OAR 3.1; [30]). We detected 137 SNPs that were significant (P < 10−3) in our meta-analysis and that mapped to 55 of the 184 human genes (Additional file 3: Table S1). In 1,000 permutations of the data we did not observe a case with these many SNPs and genes overlapping between the human and sheep results. These 55 genes included PPARGC1A (identified from the 4 th SNPlead linear index) and PLCD4 (tagged by the 10th SNPlead), and the two genes identified by the linear index of the 10th SNPlead, CYP27A1 and ERBB4. PLCD4, CYP27A1 and ERBB4 map near each other so it is uncertain how many causal mutations are involved (Additional file 2: Table S1). We also detected 9 SNPs with P values from 8 × 10⁻⁴ to 9.7 × 10⁻¹⁸ near the gene FTL (ferritin light polypeptide), which is known to be strongly associated with human obesity and carriers of the risk allele reported to have increased appetite [31]. The position of FTL gene in ovine genome was partially overlapped with GYS1 gene.
We also evaluated the overlap between the sheep GWAS results described above and GWAS for human height. Out of 697 SNPs annotated to 604 genes associated with human height [6], 494 genes mapped to the sheep reference genome and 287 SNPs which were significant (P < 10−3) in our meta-analysis mapped to 118 of these 494 human genes. Again in 1,000 permutations we did not observe a case with this much overlap between sheep and human lists. Out of these 287 SNPs, 73 SNPs at P < 10−5 were mapped within or near 11 genes which was presented in Additional file 3: Table S1. These 11 genes [6] included LCORL (tagged by the 4 th SNPlead of group 1), GHR (tagged by the 1st SNPlead of group 1), and MARK3 (tagged by SNP associated linear index of the 13th SNPlead of group 3). Gene TP53 from [6] (Additional file 3: Table S1) was located on OAR11 at 26.9 Mb, which is close to gene SLC16A11 that was near the 3rd SNPlead in group 1, so TP53 might be the plausible candidate gene in this region.
Discussion
Multi-trait analysis increases power
We have demonstrated that for a wide range of carcass and fat composition traits, a multi-trait GWAS strategy (combining single-trait GWAS in a meta-analysis) detected and validated more QTL than simple single-trait GWAS. The FDR was low for the majority of traits studied (Table 2 and Fig. 2). The Q-Q plot deviated from expectation at very low values of –log10 (P value) for the multi-trait analysis but, since we fitted a breed and a polygenic effect in the model, this deviation is not likely due to uncontrolled population structure. This type of deviation from expectation is observed if many loci cause genetic variation for a particular trait [18]. The increase in power from the multi-trait analysis was possibly due to the fact that all traits measure aspects of muscle and fat growth and thus share some underlying biological mechanisms.
Candidate genes
The gene closest to the most significant SNP is not necessarily the gene responsible for the effect on phenotype. However, in some cases the candidate genes in Tables 4 and 6 are likely to be correct based on two sources of evidence. In some cases the known function of the candidate gene fits the observed phenotype very well. For instance, the gene glycogen synthase is a good candidate for affecting muscle glycogen concentration. In other cases, the same gene has been reported to affect the same trait in another species. For instance, LCAT affects mature size in cattle even though a causal relationship is not apparent from a metabolic biochemsitry perspective [17]. Both types of evidence support some candidates such as CAST, CAPN1, and GHR. However, in some cases we identified more than one closely linked genes as candidates. The causal gene could be any one of these or, in some cases, multiple causal variants may exist in the same region. For instance, the effects of SNPlead 11 involve both myoglobin content and FA composition which suggest that both MB and APOL6 play a role.
Do detailed phenotypes help to identify the causal gene?
In some cases they do. For instance, the group 2 genes have a large effect on FA composition and a small effect on fatness. Without the FA data, their effect on fatness would have been overlooked. Similarly, GYS1 has a large effect on muscle glycogen and pH and a smaller effect on other traits. These cases might be described as measuring a phenotype which is close to the primary action of the gene. For instance, GYS1 codes for the enzyme that synthesises glycogen. By contrast, traits such as body weight are far removed from the direct action of any one gene. When a gene codes for an enzyme it is easier to specify a phenotype close to the primary action of the gene (e.g. the amount of the product) than in many other cases.
Do QTL with similar patterns of effects across traits tag genes in the same pathway?
We used two methods to identify SNPs with a similar pattern of associations across traits–clustering the lead SNPs and using a linear index designed for one SNP to find others with similar effects. The genes that cluster together in group 2 belong to the fat synthesis pathway but the candidate genes in other groups do not share an obvious pathway or mechanism. Using the linear index derived from one SNPlead did, in some cases, find other genes in the same pathway. For instance, the linear index that best predicts the CAST genotype shows a significant effect of the genotype at CAPN1 and the index based on GYS1 found PPP1R3A. In other cases the clusters do not seem to belong to a common pathway. It seems likely that “mature size” can be affected by many pathways. Nevertheless, the pattern of effects across traits of SNPlead 3 and 4 are so similar that there must be some biological connection. The SNPlead 4 is close to LCORL/NCAPG (also found in human height studies) while SNPlead 3 is SLC16A11/ALOX12/TP53. SLC16A11 is a monocarboxylate transporter and it does not seem a good candidate for affecting mature size. ALOX12 is arachidonate 12 lipoxygenase, which oxidizes arachidonic acid to a spectrum of bio-active lipid mediators.
Genes related to fat synthesis occurred in groups other than group 2, possibly because FA traits are over represented in our 56 traits. For instance, in group 5 are PNPLA3, FADS2 and EVOVL2. When all 71 candidate genes in Table 6 are considered, 25 have a direct involvement in lipid metabolism. Even when the 8 genes in group 2 and these 3 genes named above are removed there are still 14 ‘lipid’ genes, many of which are involved in intra-cellular signalling using lipids, particularly the PI3K pathway. PI3K hydrolyses PIP3 to IP3 (Inositol 1,4,5-triphosphate) and DAG (1,2-Diacylglycerol), which are second messengers. The PI3K pathway connects extracellular signals, such as GPCR and typosine kinase receptors, to key molecules such as AKT and mTOR which integrate signals related to energy and nutrient status, and which in turn regulate many activities such as cell growth and cycling, apoptosis and glucose metabolism [32]. For instance, PLCD4 (also found in human height studies) and PLCB1 are phospholipases that cleave PIP2 (Phosphatidylinositol-4,5-Bisphosphate) into the second messengers IP3 and DAG (http://www.sabiosciences.com/iapp/ip3.html). ISYNA1 is IP3 synthase 1. PROCA1 also has phospholipase activity. PI4K2B generates PIP4, a starting point for other PI messengers. The linear index derived from PLCD4 was significant for a SNP close to PRKAA2 that is a part of AMP kinase, which is important for energy homeostasis (Low ATP causes AMPK to decrease the activity of ACACA and GYS1, causing reduced FA synthesis and glycogen synthesis, respectively. ACACA is close to SNPlead 6 and GYS to SNPlead 17. ACACA is the rate limiting step for lipogenesis de nova.). AMPK connects to the PI3K pathway via Akt, which integrates many signals and in turn affects cell proliferation or apoptosis, and glucose metabolism. GHR and ErbB have numerous connections to the PI3K pathway. LCAT is a lecithin-cholesterol acyl transferase and APOL6 is an apolipoprotein that transports cholesterol. SGK2 is a kinase activated by signals that activate PI3K.
There are also a number of candidate genes associated with the cytoskeleton – FRYL, MYO1H, MYO15. MYO15 was also found to affect growth traits in cattle. FARP2 binds to both phospholipids and cytoskeleton and regulates integrin signalling and cell adhesion. ARAP2 is a PIP3 dependent Arf GAP which regulates focal adhesion. The gene closest to SNPlead 14 is laminin alpha 4 (LAMA4) which codes for a major protein in the basement membrane involved in cell adhesion and signalling and is related to the PI3K pathway. TBCK is thought to play a role in actin cytoskeleton organization, cell growth and proliferation via the mTOR pathway. AMPK, AKT and mTOR are critical controllers of energy use and protein synthesis.
Thus a hypothesis can be formed that the collection of 56 traits that we have analysed is controlled, in part, by cytokine signals (e.g. GHR) mediated by intra-cellular signalling pathways, especially PI3K, that control energy homeostasis, insulin sensitivity [33] and cell growth through effectors such as enzymes (e.g. GYS) and cell cytoskeleton changes. The gross effect of these pathways is that substrates get directed to different products (e.g. glycogen or FA) and eventually the balance of cell types (muscle fibre types or muscle vs fat) is affected.
Signalling systems within the cell are complex and inter-connected so it probably does not make sense to think of a linear pathway with all genes in the pathway having a similar phenotypic effect. Rather each gene has a unique position in a large network and therefore a unique pattern of pleiotropic effects. Nevertheless, the similarity of phenotypes of SNPs in group1 suggests that they must share some common parts of the network. The hypothesis put forward here is that this involves signalling, often via PI3K, to AMPK, AKT and mTOR.
Application to sheep breeding
Sheep breeders are keen to improve the genetic merit of their sheep for carcass and meat quality traits. The pattern of effects of each QTL studied here indicates that some would be more useful for selection than others. Some QTL have an allele with desirable effects on more than one trait and appear to be good targets for selection. For instance, the QTL on OAR 2 (mapped near PLCD4) has an allele that increases tenderness, improves meat colour (i.e. increased redness of meat), increases myoglobin, glycogen, and unsaturated (omega-3 and -6) fatty acids and decreases saturated fatty acids, which is a highly valuable pattern. Selection for this allele would be beneficial in sheep intended for most markets.
Conclusion
All traits appear to be highly polygenic with dozens to hundreds of SNPs (P < 10−5) across the genome independently associated with each trait. The FDR was lower in the multi-trait analysis than in single trait analyses, showing that it had increased power to detect significant associations with this group of traits implying that many SNPs are associated with more than one trait. The detailed phenotyping of 56 related traits helped to identify convincing candidate genes in cases where the phenotype was closely related to the primary action of the gene (e.g. FA synthesis genes). Cluster analysis arranged the significant SNPs into 5 groups so that SNPs within a group had a similar pattern of phenotypic effects. The genes near group 2 SNPs, which are associated with fatness and fat composition, are predominantly genes involved in FA and fat synthesis. By contrast, the genes near SNPs in group 1, which affect mature size, do not share a clear mechanism. However, these genes are also found in cattle and humans associated with size and fatness traits so it is unlikely that most of them are false associations. Rather it indicates our lack of understanding of the many processes that control mature size. Across the 5 groups there are many genes involved in lipid metabolism. These may act directly on measures of fatness but it seems likely that some of them are involved in signaling pathways within the cell. There was considerable overlap in the genes identified in our study and those reported to affect height and fatness in humans, and body composition in cattle. The incorporation of the identified causal mutations into genomic selection strategies could improve their accuracy and robustness, while allowing targeted selection to achieve more rapid genetic improvement.
Methods
Genotype data
This study utilised the Ovine Infinium® HD SNP BeadChip, comprising 603,350 (HD) SNPs (Illumina Inc., San Diego, CA, USA) and the Illumina 50k Ovine SNP chip (Illumina Inc., San Diego, CA, USA), comprising 54,241 (50k) SNPs. All SNP were mapped to the OAR 3.1 build of the ovine genome sequence assembled by the SNPchiMp v.3 [34]. The genotypes for each SNP of both 50k and HD SNP chips were encoded in the Illumina A/B format and then genotypes were reduced to 0, 1, and 2 copies of the B allele.
Stringent quality control procedures were applied to the SNP data. SNP were excluded if the call rate per SNP (this is the proportion of SNP genotypes that have a GC (Illumina GenCall) score above 0.6) was less than 95 % or minor allele frequency were less than 0.01 or an extreme departure from Hardy-Weinberg equilibrium (P < 10−5) occurred. Furthermore, if the average call rate per individual was less than 90 %, those animals were removed from the SNP data. Further details on quality control can be found in Daetwyler et al. [35]. The final set of our 50k SNPs consisted 38,942 SNPs and the sporadic missing genotypes of 10,613 animals were filled using the BEAGLE 4 program pedigree option [36].
After all the quality control tests were applied, 510,174 SNPs of the HD SNP chip remained on 1,735 animals and the sporadic missing genotypes were filled using FImpute [37]. Out of 10,613 animals with 50k and 1,735 HD genotypes, 1,682 animals were genotyped for both SNP arrays. The correlation between real 50k and HD genotypes for the 38,942 50 k-SNPs of these 1,682 animals was 0.9988.
The imputation of the 50k to HD was done using Fimpute [37]. All 1,735 HD genotypes were used as a reference set to impute from the 50k genotypes within each breed. Cross-validation within the 1,735 HD genotypes revealed an average accuracy of imputation (correlation of imputed empirical non-50k genotypes) of 0.9871. Most sires of phenotyped animals were genotyped at HD density. Thus, imputation accuracy in this study can be expected to be high as well. In total, 10,613 animals had real or imputed HD genotypes for 510,174 SNPs and a phenotypic records for at least one trait.
Phenotype data and traits
The 10,613 animals (from 9 sheep breeds or populations including MER, PD, BL, SUF, WS, TEX, CORR, COOP, and MIX; Fig. 1) used in this study were sourced from the information nucleus flock of Cooperative Research Centre for Sheep Industry Innovation (Sheep CRC) and the SheepGENOMICS (SG) project [38, 39]. In total, 56 traits were measured (carcass weight, fatness, muscling, tenderness, meat colour, pH level, and fatty acid profile) and trait definitions, number of records for each trait, raw means and standard deviations based on the genotyped animals are given in Table 1. The pedigree file included 27,618 animals (including 1,236 sires and 9,638 dams) over 8 generations. A complete description of the design, methods and analyses of carcass and meat quality assessments is given by Mortimer et al. [4, 40]. Not all sheep were measured for all traits.
Single-trait genome-wide association studies
Model used for GWAS
Mixed models fitting fixed and random effects simultaneously were used for estimating heritabilities and associations with SNP. The estimates of heritability were calculated based on pedigrees for all animals that have genotype and phenotype data. The same model was used for GWAS, except that each SNP (SNPi, i = 1, 2, 3, …, 510,174) was added to the model, one at a time, and tested for an association with the trait. The analysis was performed using the ASReml software [41] based on the following mixed model:
where y is the vector of observed phenotypic values of the animals, 1n is an nx1 vector of 1’s (n = number of animals with phenotypes), μ is the overall mean, X, Z1, Z2, and Z3 are all design matrices relating observations to the corresponding fixed and random effects, b is a vector of fixed effects (described below), a is a vector of polygenic additive genetic effects sampled from the distribution N ~ (0, Aσa2), where σa2 is additive genetic variance and A is the additive relationship matrix constructed from the pedigree of the animals and their ancestors, q, d, s.f, and e are the vectors of random effects of breed (including Merino strains), dam (permanent environment), sire by flock interaction, and residual error, respectively. Q is a matrix with breed and strain proportions calculated from pedigree (q ~ N (0, Qσq2) [42]; si is a vector of the genotype of each animal at the ith SNP, si is fitted as covariates. The maternal group and/or sire by flock interaction were significant (P < 0.05) to be included in the model for carcass weights, fatness, and muscling traits, whereas it was not significant for tenderness, IMF, meat colour, pH level, and fatty acid traits.
All models included dataset (or project) origin (Sheep CRC and SG), management group, flock, date of observation, birth year, sex, birth type, and rear type as fixed effects. All fixed effects were fitted as nested within a dataset. Flock, date of observation and birth year were combined in one contemporary group. Also, birth type and rear type were grouped together. Also, the laboratory effect was fitted as a fixed effect, and it was significant (P < 0.05) only for shear force and FA traits. Carcass traits, excluding HCWT, DMLION and IMF, were corrected for HCWT, and saturated FA traits were corrected for IMF. Age of dam and its square and age at observation were fitted as covariates. Age of dam ranged between 1 and 9 years. The age at observation varied from 134 to 705 days.
Significance of SNP effect
SNP were tested for a significant association with particular traits at different probability thresholds (Table 2). Following Bolormaa et al. [43], the false discovery rate (FDR) was estimated as where P is the P-value tested (e.g. 0.00001), A is the number of SNP that were significant at the P -value tested and T is the total number of SNP tested.
Validation of SNP effects
In order to validate statistically significant SNP effects in an independent population, the animals with phenotype and genotype data for each trait were split into five sets by allocating all of the offspring of randomly selected sires to one of the five datasets. Then one of the 5 divisions was randomly used as a validation population and the other 4 divisions as the reference population. Only one 4:1 division of the data was used per trait. In this way no animal used for validation had paternal half sibs in the reference population. The GWAS for 4 traits, which are amongst the traits with the highest number of significant associations, were performed in the reference population (Table 3). For SNPs with a significant effect in reference population, the analysis was repeated in the validation population. We counted the number of times that the estimated SNP effect was in the same direction in the validation population.
Multi-trait analysis to detect pleiotropy
Multi-trait significance test
Multi-trait, meta-analysis, following the procedure in Bolormaa et al. [17] were performed based on SNP effects estimated from 56 individual single-trait GWAS. The multi-trait χ2 statistic was calculated as: multi-trait χ2=, where ti is a 56 × 1 vector of the signed t-values of SNPi effects for the 56 traits, ti’ is a transpose of vector ti (1 × 56), and V−1 is an inverse of the 56 × 56 correlation matrix where the correlation is calculated over the 510,174 estimated SNP effects (signed t-values) of the two traits. The power of QTL detection was investigated by comparing FDR [43] calculated in the multi-trait test with FDR [43] calculated in the single-trait GWAS (Table 3).
Use of linear indices in multi-trait validation
A linear index of 56 traits that had the maximum correlation with genotypes for significant SNP was used for multi-trait validation. The linear index on individual animals could only be calculated for animals with all traits measured. Not all animals were measured for all traits, so missing values were filled in by a prediction using a multiple regression approach as described by Bolormaa et al. [44]. Using this approach, the actual effects (not signed t values) of 510,174 SNPs for 56 traits that were estimated based on all animals were used in order to have the same units as the phenotype values. Before the missing phenotypes were predicted, the raw phenotypes for each trait were corrected for fixed effects using the following model: corrected phenotype = phenotype − fixed effects. Please note that missing phenotypes were not predicted for single trait GWAS and the multi-trait significance test above.
As a validation, after filling missing values, all data was split into discovery and validation populations using same approach described in the single-trait GWAS section. Then the individual trait GWAS and the multi-trait significance test on signed t-values described in the previous sections were performed using only the discovery population (only one 4:1 division of the total data was used per trait). Only the most significant SNPs (P < 10−5) within a 1 Mb window (to avoid testing a large number of closely linked SNPs) from the multi-trait analysis in the discovery set were validated in an independent set of animals. After this, a linear index (yI) of 56 traits that had maximum correlation in the discovery population with each selected (significant) SNP was calculated using the following formula [43]: yI = b ' C− 1y, where b’ is the transpose of a vector of the estimated effects of the SNP (not t values) on the 56 traits (1 × 56) that was estimated from only the discovery population, C−1 is an inverse of the 56 × 56 (co) variance matrix among the 56 traits calculated from the estimated SNP effects of 510,174 SNPs only in the reference population, and y is a 56 × 1 vector of the phenotype values for 56 traits for each animal in the validation sample. The association between each linear index (yI) and each SNP (only significant SNPs in every 1 Mb window from GWAS in discovery population) was then tested in the validation population. The yI was treated as a new trait (dependent variable). The association was assessed by a regression analysis (GWAS) using the following model: yI ~ mean + SNPi + animal + error, where animal and error were fitted as random effects and SNPi were fitted as a covariate one at a time (other fixed effects were removed from the trait measurements before forming the linear index). In order to see whether the SNPs validated in the validation population have the same direction of effects (positive or negative) as SNPs in the discovery population, we also calculated linear index and performed linear index GWAS by using the phenotypes of the discovery population instead of the phenotypes of the validation population. Then the directions of SNP effects for the linear index in both reference and validation populations were checked and the proportion of SNPs whose effects were in the same direction in the reference population was calculated.
Conditional analyses accounting for 23 lead SNPs
The 23 SNPlead were selected as follows: On each chromosome the most significant SNP (P < 10−5), based on the multi-trait analysis, was selected. Up to three SNPs on the same chromosome were selected only if they were at least 4 Mb apart and represented two or three different QTL (showing clearly differentiated peaks on Manhattan plot from the multi-trait analysis).
The regression analyses (GWAS) were repeated and, additionally, the 23 SNPlead were fitted simultaneously in the model. The statistical model used was the same as in single-trait GWAS with an addition of the 23 SNPlead, which were fitted simultaneously as covariate effects. Then a multi-trait chi-squared statistic was calculated for each SNP to test the effects of the SNP across traits after fitting the 23 SNPlead.
Cluster analysis to find QTL with a similar pattern of effects across traits
The SNP effects estimated from single-trait GWAS based on all animals were used to investigate the relationships between SNPs. For each pair of SNPs among the 23 SNPlead, the correlation of their effects across the 56 traits was calculated. Highly positive or negative correlations indicate 2 SNPs with the same pattern of effects across traits. Then this correlation matrix was used to do the hierarchical clustering of the 23 SNPlead leading to 5 groups or clusters as shown in the dendrogram drawn using the heatmap function of the R program [45].
Searching for more QTL in the same pathway using linear indices of SNPlead
For each of the 23 SNPlead, we searched for additional SNPs in the 5 groups defined by the cluster analysis. To do this we used the linear index that showed the highest association with the corresponding SNPlead genotype, as previously defined for validation of the multi-trait analysis. The linear index of traits that had a maximum correlation with the genotypes for each of 23 SNPlead was calculated based on all data. A new GWAS was performed for each of 23 linear indexes (yI) treating it as a new trait (dependent variable). To avoid identifying QTL already represented by the 23 lead SNPs, the 23 SNPlead were also fitted simultaneously in the model. In this way, we could discover new QTL which are associated with one of the linear indices corresponding to the 23 SNPlead. The following model was used: ~ mean + fixed effects + SNPi + leadSNP1 + leadSNP2 + … + leadSNP23 + animal + error, where animal and error were fitted as random effects and the ith SNP (SNPi, i = 1, 2, 3, …, 510174) and 23 SNPlead were fitted simultaneously as covariate effects.
The SNPs that have significant associations (P < 5 × 10⁻⁷) with at least one of the indexes based on SNPlead were selected for assigning into 5 groups. These additional significant SNPs were assigned to the same group as the SNPlead with whose linear index they had the most significant association.
Identifying plausible candidates
The genes that occur within 30 kb of the SNPs in this expanded list of significant SNPs were identified using UCSC Genome Bioinformatics (http://genome.ucsc.edu/) and Ensembl (www.ensembl.org/biomart/). If there were more than one gene within 2 Mb, then only one gene was retained within the 2 Mb regions by selecting the nearest to the SNP or the particular gene has concomitant relationship with SNP effects associated for traits studied. GO and KEGG analysis in STRING (Search Tool for the Retrieval of Interacting Genes/Proteins) network program [22] was used to identify functional similarity between the genes near group 2 SNPs.
Do these candidate genes affect similar phenotypes in other species?
30 kb upstream and downstream of 184 genes associated with fatness in humans were examined in the multi-trait sheep GWAS and found to contain 137 significant SNPs (P < 10−3) in 55 genes associated with fatness in humans. To test if this degree of overlap could be due to chance we randomly selected 184 genes and performed the same analysis. This was done 1,000 times to establish the distribution of the number of significant SNPs and genes under the null hypothesis that the genes that are significantly associated with fatness in humans are no more likely to contain significant SNPs in sheep than expected by chance. To test the results for genes associated with human height, a similar test was performed using 494 randomly selected genes.
Availability of supporting data
The data sets supporting the results of this article are available in the additional files (Additional files 4, 5, 6, and 7).
Ethics approval and consent to participate
Animal Care and Use Committee approval was not obtained for this study because no new animals were handled in this experiment. The experiment was performed on trait records and DNA samples that had been collected previously.
Acknowledgements
The authors gratefully acknowledge funding from the Cooperative Research Centre for Sheep Industry Innovation, Meat and Livestock Australia, and Australian Wool Innovation Ltd. The authors would like to extend their gratitude to A Swan and D Brown (Animal Genetics and Breeding Unit, Armidale, NSW 2351, Australia) for preparing pedigrees and giving advice on appropriate models; to K Gore (University of New England, Armidale, NSW, 2351, Australia) for preparing and cleaning genotype data; to K Geenty, and the many staff involved at the Sheep CRC and SG sites across Australia.
Additional files
Multiple plots of the –log10 (P-values) of SNP effects from the multi-trait test results for lead SNP OAR6_37.5 Mb (a) and OAR22_20.3 Mb (b): The lead SNP is shown by a purple diamond in each plot (labelled with chromosome and position, Mb) and the LD between this variant and all others is colour coded. (TIFF 322 kb)
Network graphic showing the interactions between Group 2 gene encoding proteins: Stronger associations are represented by ticker lines [22]. (TIFF 281 kb)
A list of the overlapped candidate genes in QTL regions from our sheep study with genes associated with body mass index and height in human. (XLSX 15 kb)
The signed t-values of SNP effects (1 to 150,000 in “chromosome: position” order) for the 56 traits used in multi-trait, meta-analysis. (GZ 30545 kb)
The signed t-values of SNP effects (150,001 to 300,000 in “chromosome: position” order) for the 56 traits used in multi-trait, meta-analysis. (GZ 30615 kb)
The signed t-values of SNP effects (300,001 to 450,000 in “chromosome: position” order) for the 56 traits used in multi-trait, meta-analysis. (GZ 30638 kb)
The signed t-values of SNP effects (450,001 to 510,174 in “chromosome: position” order) for the 56 traits used in multi-trait, meta-analysis. (GZ 12388 kb)
Footnotes
Competing interests
The authors declare that they have no competing interests.
Authors’ contributions
SB performed all analysis. SB, HDD, and MEG conceived the study. SB, HDD, BJH, and MEG wrote the manuscript. SB, HDD, MEG, JHJW, BJH, and DP contributed to the study design. All authors have read and approved the final manuscript.
Contributor Information
Sunduimijid Bolormaa, Email: bolormaa.sunduimijid@ecodev.vic.gov.au.
Ben J. Hayes, Email: ben.hayes@ecodev.vic.gov.au
Julius H.J. van der Werf, Email: jvanderw@une.edu.au
David Pethick, Email: d.pethick@murdoch.edu.au.
Michael E. Goddard, Email: mike.goddard@ecodev.vic.gov.au
Hans D. Daetwyler, Email: hans.daetwyler@ecodev.vic.gov.au
References
- 1.Hemani G, Yang J, Vinkhuyzen A, Powell JE, Willemsen G, Hottenga JJ, Abdellaoui A, Mangino M, Valdes AM, Medland SE, et al. Inference of the genetic architecture underlying BMI and height with the use of 20,240 sibling pairs. Am J Hum Genet. 2013;93:865–875. doi: 10.1016/j.ajhg.2013.10.005. [DOI] [PMC free article] [PubMed] [Google Scholar]
- 2.Locke AE, Kahali B, Berndt SI, Justice AE, Pers TH, Day FR, et al. Genetic studies of body mass index yield new insights for obesity biology. Nature. 2015;518:197–206. doi: 10.1038/nature14177. [DOI] [PMC free article] [PubMed] [Google Scholar]
- 3.Robinson DL, Oddy VH. Genetic parameters for feed efficiency, fatness, muscle area and feeding behaviour of feedlot finished beef cattle. Livest Prod Sci. 2004;90:255–270. doi: 10.1016/j.livprodsci.2004.06.011. [DOI] [Google Scholar]
- 4.Mortimer SI, van der Werf JHJ, Jacob RH, Hopkins DL, Pannier L, Pearce KL, et al. Genetic parameters for meat quality traits of Australian lamb meat. Meat Sci. 2014;96:1016–1024. doi: 10.1016/j.meatsci.2013.09.007. [DOI] [PubMed] [Google Scholar]
- 5.Bolormaa S, Pryce JE, Kemper K, Savin K, Hayes BJ, Barendse W, et al. Accuracy of prediction of genomic breeding values for residual feed intake, carcass and meat quality traits in Bos taurus, Bos indicus and composite beef cattle. J Anim Sci. 2013;91:3088–3104. doi: 10.2527/jas.2012-5827. [DOI] [PubMed] [Google Scholar]
- 6.Wood AR, Esko T, Yang J, Vedantam S, Pers TH, Gustafsson S, et al. Defining the role of common variation in the genomic and biological architecture of adult human height. Nat Genet. 2014;46:1173–1186. doi: 10.1038/ng.3097. [DOI] [PMC free article] [PubMed] [Google Scholar]
- 7.Pryce JE, Hayes BJ, Bolormaa S, Goddard ME. Polymorphic Regions Affecting Human Height Also Control Stature in Cattle. Genetics. 2011;3:981–984. doi: 10.1534/genetics.110.123943. [DOI] [PMC free article] [PubMed] [Google Scholar]
- 8.Metzger J, Schrimpf R, Philipp U, Distl O. Expression Levels of LCORL Are Associated with Body Size in Horses. PLoS One. 2013;8 doi: 10.1371/journal.pone.0056497. [DOI] [PMC free article] [PubMed] [Google Scholar]
- 9.Saatchi M, Schnabel RD, Taylor JF, Garrick DJ. Large-effect pleiotropic or closely linked QTL segregate within and across ten US cattle breeds. BMC Genomics. 2014;15:442. doi: 10.1186/1471-2164-15-442. [DOI] [PMC free article] [PubMed] [Google Scholar]
- 10.Kelman KR, Pannier L, Pethick DW, Gardner GE. Selection for lean meat yield in lambs reduces indicators of oxidative metabolism in the longissimus muscle. Meat Sci. 2014;96:1058–1067. doi: 10.1016/j.meatsci.2013.08.017. [DOI] [PubMed] [Google Scholar]
- 11.Andrés AI, Cava R, Mayoral AI, Tejeda JF, Morcuende D, Ruiz J. Oxidative stability and fatty acid composition of pig muscles as affected by rearing system, crossbreeding and metabolic type of muscle fibre. Meat Sci. 2001;59:39–47. doi: 10.1016/S0309-1740(01)00050-X. [DOI] [PubMed] [Google Scholar]
- 12.MacIntosch BR, Gardiner PF, McComas AJ. Skeletal Muscle Form and Function. Champaign: HumanKinetics; 2006. [Google Scholar]
- 13.Tellam RL, Cockett NE, Vuocolo T, Bidwell CA. Genes Contributing to Genetic Variation of Muscling in Sheep. Front Genet. 2012;3:164. doi: 10.3389/fgene.2012.00164. [DOI] [PMC free article] [PubMed] [Google Scholar]
- 14.Calnan HB, Jacob RH, Pethick DW, Gardner GE. Factors affecting the colour of lamb meat from the longissimus muscle during display: The influence of muscle weight and muscle oxidative capacity. Meat Sci. 2014;96:1049–1057. doi: 10.1016/j.meatsci.2013.08.032. [DOI] [PubMed] [Google Scholar]
- 15.Jackson SP, Blanton JR. Review: The Callipyge Gene in Sheep. The Profesional Animal Scientist. 2001;17:68–74. doi: 10.15232/S1080-7446(15)31600-4. [DOI] [Google Scholar]
- 16.Cockett NE, Smit MA, Bidwell CA, Segers K, Hadfield TL, Snowder GD, et al. The callipyge mutation and other genes that affect muscle hypertrophy in sheep. Genet Sel Evol. 2005;37(1):S65–S81. doi: 10.1186/1297-9686-37-S1-S65. [DOI] [PMC free article] [PubMed] [Google Scholar]
- 17.Bolormaa S, Pryce JE, Reverter A, Zhang Y, Barendse W, Kemper K, Tier B, Savin K, Hayes BJ, Goddard ME: A Multi-Trait, Meta-analysis for Detecting Pleiotropic Polymorphisms for Stature, Fatness and Reproduction in Beef Cattle PLoS Genet 2014, 10:e1004198. doi:10.11861004110.1001371/journal.pgen.1004198 [DOI] [PMC free article] [PubMed]
- 18.Yang J, Weedon MN, Purcell S, Lettre G, Estrada K, Willer CJ, et al. Genomic inflation factors under polygenic inheritance. Eur J Hum Genet. 2011;19:807–812. doi: 10.1038/ejhg.2011.39. [DOI] [PMC free article] [PubMed] [Google Scholar]
- 19.Tanaka T, Shen J, Abecasis GR, Kisialiou A, Ordovas JM, Guralnik JM, et al. Genome-Wide Association Study of Plasma Polyunsaturated Fatty Acids in the InCHIANTI Study. PLoS Genet. 2009;5 doi: 10.1371/journal.pgen.1000338. [DOI] [PMC free article] [PubMed] [Google Scholar]
- 20.Setoguchi K, Furuta M, Hirano T, Nagao T, Watanabe T, Sugimoto Y, et al. Cross-breed comparisons identified a critical 591-kb region for bovine carcass weight QTL (CW-2) on chromosome 6 and the Ile-442-Met substitution in NCAPG as a positional candidate. BMC Genet. 2009;10:43. doi: 10.1186/1471-2156-10-43. [DOI] [PMC free article] [PubMed] [Google Scholar]
- 21.Tetens J, Widmann P, Kühn C, Thaller G. A genome-wide association study indicates LCORL/NCAPG as a candidate locus for withers height in German Warmblood horses. Anim Genet. 2013;44:467–471. doi: 10.1111/age.12031. [DOI] [PubMed] [Google Scholar]
- 22.Franceschini A, Szklarczyk D, Frankild S, Kuhn M, Simonovic M, Roth A, et al. STRING v9.1: protein-protein interaction networks, with increased coverage and integration. Nucleic Acids Res. 2013;41:D808–D815. doi: 10.1093/nar/gks1094. [DOI] [PMC free article] [PubMed] [Google Scholar]
- 23.Nicoll GB, Burkin HR, Broad TE, Jopson NB, Greer GJ, Bain WE, et al. Genetic linkage of microsatellite markers to the Carwell locus for rib-eye muscling in sheep. Proceedings of the 6th World Congress of Genetics Applied to Livestock Production. 1998;26:529. [Google Scholar]
- 24.Karim L, Takeda H, Lin L, Druet T, Arias JAC, Baurain D, et al. Variants modulating the expression of a chromosome domain encompassing PLAG1 influence bovine stature. Nat Genet. 2011;43:405–413. doi: 10.1038/ng.814. [DOI] [PubMed] [Google Scholar]
- 25.Barendse W, Harrison BE, Hawken RJ, Ferguson DM, Thompson JM, Thomas MB, et al. Epistasis between calpain 1 and its inhibitor calpastatin within breeds of cattle. Genetics. 2007;176:2601–2610. doi: 10.1534/genetics.107.074328. [DOI] [PMC free article] [PubMed] [Google Scholar]
- 26.White SN, Casas E, Wheeler TL, Shackelford SD, Koohmaraie M, Riley DG, et al. A new single nucleotide polymorphism in CAPN1 extends the current tenderness marker test to include cattle of Bos indicus, Bos taurus, and crossbred descent. J Anim Sci. 2005;83:2001–2008. doi: 10.2527/2005.8392001x. [DOI] [PubMed] [Google Scholar]
- 27.Shungin D, Winkler TW, Croteau-Chonka DC, Ferreira T, Locke AE, Magi R, et al. New genetic loci link adipose and insulin biology to body fat distribution. Nature. 2015;518:187–196. doi: 10.1038/nature14132. [DOI] [PMC free article] [PubMed] [Google Scholar]
- 28.Rankinen T, Zuberi A, Chagnon YC, Weisnagel SJ, Argyropoulos G, et al. The human obesity gene map: the 2005 update. Obesity. 2006;14:529–644. doi: 10.1038/oby.2006.71. [DOI] [PubMed] [Google Scholar]
- 29.Scuteri A, Sanna S, Chen W-M, Uda M, Albai G, et al. Genome-Wide Association Scan Shows Genetic Variants in the FTO Gene Are Associated with Obesity-Related Traits. PLoS Genet. 2007;3:e115. doi: 10.1371/journal.pgen.0030115. [DOI] [PMC free article] [PubMed] [Google Scholar]
- 30.Jiang Y, Xie M, Chen W, Talbot R, Maddox JF, Faraut T, et al. The sheep genome illuminates biology of the rumen and lipid metabolism. Science. 2014;344:1168–1173. doi: 10.1126/science.1252806. [DOI] [PMC free article] [PubMed] [Google Scholar]
- 31.Gulati P, Avezov E, Ma M, Antrobus R, Lehner P, O’Rahilly S, et al. Fat mass and obesity-related (FTO) shuttles between the nucleus and cytoplasm. Biosci Rep. 2014;34 doi: 10.1042/BSR20140111. [DOI] [PMC free article] [PubMed] [Google Scholar]
- 32.Cantley LC. The Phosphoinositide 3-Kinase Pathway. Science. 2002;296:1655–1657. doi: 10.1126/science.296.5573.1655. [DOI] [PubMed] [Google Scholar]
- 33.Pal A, Barber TM DP, Van de Bunt M, Rudge SA, Zhang Q, Lachlan KL, et al. PTEN Mutations as a Cause of Constitutive Insulin Sensitivity and Obesity. N Engl J Med. 2012;367:1002–1011. doi: 10.1056/NEJMoa1113966. [DOI] [PMC free article] [PubMed] [Google Scholar]
- 34.Nicolazzi NL, Caprera A, Nazzicari N, Cozzi P, Strozzi F, Lawley C, et al. SNPchiMp v.3: integrating and standardizing single nucleotide polymorphism data for livestock species. BMC Genomics. 2015;16:283. doi: 10.1186/s12864-015-1497-1. [DOI] [PMC free article] [PubMed] [Google Scholar]
- 35.Daetwyler HD, Hickey JM, Henshall J, Dominik S, Gredler B, Van der Werf JHJ, et al. Accuracy of estimated genomic breeding values for wool and meat traits in a multi-breed sheep population. Anim Prod Sci. 2010;50:1004–1010. doi: 10.1071/AN10096. [DOI] [Google Scholar]
- 36.Browning BL, Browning SR. Improving the accuracy and efficiency of identity by descent detection in population data. Genetics. 2013;194:459–471. doi: 10.1534/genetics.113.150029. [DOI] [PMC free article] [PubMed] [Google Scholar]
- 37.Sargolzaei M, Chesnais J, Schenkel F. A new approach for efficient genotype imputation using information from relatives. BMC Genomics. 2014;15:478. doi: 10.1186/1471-2164-15-478. [DOI] [PMC free article] [PubMed] [Google Scholar]
- 38.van der Werf JHJ, Kinghorn BP, Banks RG. Design and role of an information nucleus in sheep breeding programs. Anim Prod Sci. 2010;50:998–1003. doi: 10.1071/AN10151. [DOI] [Google Scholar]
- 39.White JD, Allingham PG, Gorman CM, Emery DL, Hynd P, Owens J, et al. Design and phenotyping procedures for recording wool, skin, parasite resistance, growth, carcass yield and quality traits of the SheepGENOMICS mapping flock. Anim Prod Sci. 2012;52:157–171. doi: 10.1071/AN11085. [DOI] [Google Scholar]
- 40.Mortimer SI, van der Werf JJHJ, Jacob RH, Pethick DW, Pearce KL, Warner RD, et al. Preliminary estimates of genetic parameters for carcass and meat quality traits in Australian sheep. Anim Prod Sci. 2010;50:1135–1144. doi: 10.1071/AN10126. [DOI] [Google Scholar]
- 41.Gilmour AR, Gogel BJ, Cullis BR, Thompson R. ASReml User Guide Release 3.0 VSN Hemel Hempstead: International Ltd. 2009. [Google Scholar]
- 42.Swan AA, Brown DJ, van der Werf JHJ: Genetic variation within and between sub-populations of the Australian Merino breed. Anim Prod Sci 2014:Accepted.
- 43.Bolormaa S, Hayes BJ, Savin K, Hawkin R, Barendse W, Arthur P, et al. Genome wide association studies for feedlot and growth traits in cattle. J Anim Sci. 2011;89:1684–1697. doi: 10.2527/jas.2010-3079. [DOI] [PubMed] [Google Scholar]
- 44.Bolormaa S, Pryce JE, Hayes BJ, Goddard ME. Multivariate analysis of a genome-wide association study in dairy cattle. J Dairy Sci. 2010;93:3818–3833. doi: 10.3168/jds.2009-2980. [DOI] [PubMed] [Google Scholar]
- 45.The R Core Team: R . A Language and Environment for Statistical Computing. Version 3.0.1. 2013. [Google Scholar]