

Abstract
An analysis and expansion of our resource for classifying, predicting, and designing RNA structures, RAG (RNA-As-Graphs), is presented, with the goal of understanding features of RNA-like and non-RNA-like motifs and exploiting this information for RNA design. RAG was first reported in 2004 for cataloguing RNA secondary structure motifs using graph representations. In 2011, the RAG resource was updated with the increased availability of RNA structures and improved by utilities for analyzing RNA structures, including substructuring and search tools. We also classified RNA structures as graphs up to 10 vertices (~ 200 nucleotides) as three classes: existing, RNA-like, and non-RNA-like using clustering approaches. Here, we focus on the tree graphs and evaluate the newly founded RNAs since 2011, which also support our refined predictions of RNA-like motifs. We expand the RAG resource for large tree graphs up to 13 vertices (~ 260 nucleotides), thereby cataloguing more than 10 times as many secondary structures. We apply clustering algorithms based on features of RNA secondary structures translated from known tertiary structures to suggest which large RNA motifs can be considered “RNA-like”. The results by the Partitioning Around Medoids (PAM) approach, in particular, reveal good accuracy, with small error for the largest cases. The RAG update here up to 13 vertices offers a useful graph-based tool for exploring RNA motifs and suggesting large RNA motifs for design.
Keywords: RNA secondary structure, RNA atlas, RNA motifs, RNA design, Prediction of RNA-like motifs
Graphical abstract
Segments of RAG Extension: Enumerated graphs of RNA secondary structures with labeling of those found in Nature(red).
Introduction
It is now well appreciated that RNA molecules have essential roles in the regulation of gene expression and signal recognition1–4 besides their widely known roles in protein synthesis by mRNA, tRNA, and rRNA. The functionalities of RNAs are made possible by large variations of secondary and tertiary motifs. Unlike proteins, where structural genomics initiatives have been advancing for decades5,6, systematic connections between RNA structures and their biological roles remain largely unclear. Thus, improvements in the connection between RNA’s structure and its functionality can help advance our understanding of RNAs as well as the design of new RNAs.
The secondary structure of RNA, less complex than its tertiary structure, is already a good starting point for a structural/functional analysis. Secondary structures, in particular, are amenable to mathematical analysis by graph theory. Graph theory is a well-established field of mathematics, which has been used extensively in a variety of economic, social, engineering, biological, and medical contexts to describe and analyze complex networks7–10. Shareability networks have been used recently, for example, to analyze cab sharing in New York City and promote a 40% reduction in traffic and pollution due to simple sharing of cabs11. We utilize graph theory here to analyze RNA secondary structures: we transform RNA secondary structures into graph vertices and edges to express RNAs as coarse-grained objects, thereby forgoing a detailed atomic-level representation. Applying graph theory to compare the 2D graphical representations has already shown to be useful in some projects12–14.
In 2004, we developed and launched the RNA-As-Graph (RAG) web resource (http://www.biomath.nyu.edu/rag/home). This framework catalogs all possible RNA 2D topologies up to 10 vertices and classifies them as existing or hypothetical, with the latter divided into RNA-like (“non-existing but RNA-like”) and non-RNA-like (“non-existing and not RNA-like”)15, by clustering features at RNA secondary structures as tree and dual graphs by means of graph theory. The graphical information extracted is in the form of the adjacency and Laplacian matrices, which describe graph connections, and the clustering is performed by their vertex number and eigenvalue spectrum (See Materials and Methods).
The many applications of RAG, as reviewed recently16–18, include the prediction of RNA-like topologies19–22, prediction of non-coding RNA23,24, computational modeling of the in vitro selection process for RNA design25–27, analysis of large viral RNA28,29, analysis and design of riboswitches30,31, graph partitioning to explore RNA modularity16,17,32, and prediction of 3D RNA topologies33,34.
Many new RNA databases have been developed since 2004. For example, RNA family database (Rfam)35 displays consensus secondary structures for 1,372 families of RNA36, and the RNA Strand database catalogs 4,666 secondary structures determined by comparative sequence analysis, NMR data, and X-Ray crystallography37. This growth allowed us to extend RAG and propose an improved classification in 2011. In addition, we implemented various improvements to the RAG web resource such as expanded search tools and a user-friendly interface. The 2011 update was still limited to tree graphs up to 10 vertices corresponding to about 200 nucleotides of RNA sequences.
In this work, we upgrade the RAG database with new prediction results for RNA-like topologies for large tree graphs up to 13 vertices (~260 nucleotides) in length, using an auxiliary graph computation program named nauty and Traces38. This makes RAG’s coverage more than 10 fold greater. We then catalogue new existing RNAs from the PDB database, as of Aug 2014, for all secondary structures translated from solved experimental structures. Finally, a new prediction for RNA-like motifs is described based on the Partitioning Around Medoids (PAM) clustering approach39.
This paper is organized as follows. We begin by brief review of the conversion process from RNA secondary structures to RAG 2D graph representations. Next, the new graph enumeration scheme that allowed this significant RAG expansion is introduced, and the extraction of characteristic information from these secondary graphs is detailed. We then discuss how to choose the proper clustering method. Our main achievements consist of the two parts: high accuracy of predicted RNA-like features for the newly found RNAs, and our extended RAG for larger topologies based on the current dataset. In Discussion, we elaborate upon the significance of those findings, and mention the future prospects of clustering for RNAs.
Materials and Methods
RNA secondary structure data
In our previous works, we used several RNA secondary structure repositories: Rfam40, Pseudobase++41, RNA Strand42, Protein Databank (PDB)43, and Nucleic Acid Database44,45, for cataloging secondary structures that are either fully or partially evaluated by experiment. Here, to analyze the accuracy and efficiency of our RAG clustering strategy for predicting RNA-like motifs, RNA secondary structures were exclusively collected from PDB with untangling of multiple chains, so that the structures we classify are all experimentally validated. We also include pseudoknot structures, which are translated into non-pseudoknot structures for a representation as tree graphs by removal of extra base pairings composing the pseudoknots. Note that dual graphs, as we have described separately15,46, can be used to model pseudoknotted RNA fully. A simple modification of tree graphs to model pseudoknots was also recently presented and applied for prediction of tertiary structures18.
RNA tree graph representation
The conversion process from detailed RNA secondary structures to tree graph representations was detailed in our previous works15,19. Briefly, RAG considers nucleotide bulges, hairpin loops, internal loops, junctions and the 3′ and 5′ ends as vertices, and RNA stems as edges (see Figure 1).
Figure 1. Conversion from a secondary RNA structure to a planar tree graph.

(a) 16S ribosomal RNA (PDB ID 3J12, chain A) with its tree graph. (b) 80S ribosomal RNA (PDB ID 3IZD, chain A) with its tree graph.
Enumeration of RNA graphs
To classify all existing graph motifs including the experimentally found and those not yet solved experimentally, we generate all possible tree graphs with a given number of vertices. Graph theory offers enumeration methods for describing all possible graphs47. Previously, we had used the counting polynomial of Harary-Prins and the figures of Graph Theory47, but this scheme for tree graphs was manual; the polynomial gives the number of the graphs but no information about the shape, or topology, of the graphs.
An alternative is the integration of nauty and Traces38, two programs focused on canonical labeling and automorphism group computations. These programs can exhaustively produce all desired tree graphs. The completeness of the graph generation is verified by two requirements: the number of generated graphs should match the result of the counting polynomial of Harary-Prins, and there should be no isomorphic graphs, which is confirmed by NetworkX48. Thus, we ensure that all the non-isomorphic graphs are generated. This effective combination allows us to extend RAG significantly by adding 235, 551 and 1,301 tree graphs for 11, 12 and 13 vertices, respectively.
Topological descriptors of RNA graphs: Laplacian spectra
To order all the graphs by their features, we use the second eigenvalue λ2 of the Laplacian matrix, a matrix which describes graph connections. The other eiganvalues are associated with a spectral decomposition associated with the graph, useful for many applications, e.g., graph partitioning by the second eigenvector32.
To define the Laplacian matrix, we define the n × n adjacency matrix for an n-node graph where the non-diagonal entries aij are 1 if there is an edge between vertex i and j, and 0 otherwise.
The Laplacian matrix (L) is defined by L = D − A, where D is the diagonal matrix whose diagonal elements aii specify the degree of connectivity of vertex i. Thus, for example, a straight-line shaped graph with 3 vertices has graph ID 3_1 in the RAG terminology, and corresponding D, A, and L matrices as follows:
Note that the spectrum of the Laplacian matrix is independent of the labeling of graph vertices because a change in labeling can be accomplished by the elementary operations on the matrices and the elementary operations do not alter their eigenvalues. Thus, if the spectra of the Laplacian matrices of two graphs are different, the graphs are also different. Although identical spectra can be associated with different graph topologies, this situation is rare38.
The pattern of a graph’s connectivity is related to its eigenvalue spectrum (spectral graph theory)49. The second smallest eigenvalue, λ2, for example, is called the algebraic connectivity and measures the graph’s compactness: a linear chain has a smaller second eigenvalue than a branched structure50. Thus, the RNAs are analyzed by means of their graph invariants, which are eigenvalues here.
Labeling the tree graphs with IDs
We label all tree graphs of the same vertex number by increasing λ2. Thus, for example, ID 6_1 indicates that the graph has 6 nodes and the smallest λ2 among all 6-node graphs; ID 6_3 indicates the 6-node graph with the third lowest λ2, and so on.
Deduction of characteristic information from the Laplacian spectra
To derive essential topological features of an RNA graph so we can compare and visualize, in 2D or 3D, the graphs with varying number of nodes, we compress the number of descriptors from the Laplacian spectrum, which is composed of n eigenvalues for a graph of n vertices, to two variables α and β: the slope α and the intercept β are calculated by applying the linear least-square regression to the set of planar points (1, λ2), (2, λ3), …, (n − 1, λn). The first eigenvalue λ1 is omitted because its value is always zero. Thus, α measures the average spacing between positive eigenvalues and the intercept β represents the second smallest eigenvalue calibrated by α. This type of reduction mechanism is commonly used in clustering analysis. One example is in the field of drug design, known as quantitative structure-activity relationships (QSAR)51, where various chemical compounds are described by a few ‘topological descriptors’.
Here we observe that α decreases with n, and therefore, we assume that nα forms a quantity independent of n. We thus derive a set of two descriptors, (nα, β), and use this quantity as a component to perform clustering of RNA-like and non-RNA-like motifs based on the existing RNA databases. In addition, considering the relationship of the eigenequation for powers k = 0, 1, 2, …,
where xi is an eigenvector corresponding to λi, enhances the accuracy of clustering effectively15 by allowing us to add more parameters. We define αk and βk in the same manner from the powers of the eigenvalues . Thus, a point in a 2k dimensional space is obtained for each secondary structure. Our previous work15 showed some advantage of the k=2 space over other values, so this value is consistently used here too.
To make each coordinate’s contribution equal for the predictions, these values are normalized based on the average of their absolute values. That is, if we let xm = (mth coordinate), e.g., x1 = nα1, the normalized coordinates are
Note that, although we chose ( ) for the numerator, this could be the mean of any xm.
Finally, the metric multidimensional scaling (MDS) is performed to map these 4 dimensional points to the same number of 2 dimensional points keeping the Euclidean distances among the original points as much as possible52.
Clustering and Validation Procedure
Overall, our goal is to predict which of the hypothetical tree graphs are RNA-like. To do so, the data points generated from the tree graphs are clustered into 2 categories: RNA-like and non-RNA-like. Two very different clustering approaches can be considered: k-nearest neighbor (k-NN)53,54 and partitioning around medoids (PAM)39. The former use training data while the latter does not.
The k-NN algorithm classifies a point based on k closest training data points: A point is classified by a majority vote of its neighbors, with the point being assigned to the class most common among its k nearest neighbors53,54. However, due to the lack of existing motifs for higher vertices, we use all existing motifs and the same number of randomly selected non-existing motifs as a training set. Because of this randomness, we employed 10 trials by varying the set of random non-existing data.
Once a training set is given, cross-validation is one of several approaches for estimating how well the model might perform on future data. One effective cross-validation method is called leave-one-out cross validation (LOOCV)55. As its name suggests, LOOCV leaves one data item from the training set and performs a clustering to this single isolated data point by the training set which now lacks that item. This process is repeated for each data item, and the reliability of the prediction is measured by comparison to confirmed RNA-like and non-RNA-like motifs.
PAM, on the other hand, requires no training set. PAM partitions all data (existing and hypothetical graph features) in an ‘ab initio’ manner to predict two groups (RNA-like and non-RNA-like) that are maximally separated39. Thus, PAM clusters the data into these two groups, each with its center or medoid, by minimizing the distances within groups and maximizing the distance between groups.
The fact that the PAM requires no training set makes the validation fairly straightforward. We simply perform PAM clustering on the current dataset and calculate the accuracy naturally by
We further check and confirm actual existing RNAs predicted as either RNA-like or non-RNA-like graphs (i.e., that we get not just the right number but the right graphs).
Program Implementation
As mentioned, the 2D tree graphs are generated by the combination of nauty and Traces38 and NetworkX48. The code for converting RNA 2D full topology to a tree graph, which was described in the section RNA tree graph representation, was automated in our previous work19 and is used here too. The MDS is done by the implementation of the function cmdscale from the multivariable analysis library package of R56. The k-NN and PAM clustering are performed by The C clustering library20. All other parts are coded by the first author using Python. The entire calculation process takes less than 2 hours on Intel® Core™ i5-4258U.
Results
Association of secondary structures to new RNAs
The process of converting an RNA 2D full topology to a tree graph, which was described in the section RNA tree graph representation, is automated in RAG19. This allowed us to exhaustively inspect the current RNA structures and assign a secondary graph motif to each. Taking RNA structures from Protein Data Bank (PDB) yielded Figure 2. Many new topologies were identified, even from the RNAs that had been identified before our last work, because our current procedure for excision of pseudoknots and separation of multiple chains allows the conversion of the RNA structures that could not be handled previously as tree graphs.
Figure 2. List of newly found motifs and their associated secondary structures of RAG graphs.


For up through 10-vertex graphs, 9 new motifs have been found since our last update.
Clustering assessment by the current status
Early in our RAG project, the two clustering methods, Partitioning Around Medoids (PAM)39 and k-nearest neighbor (k-NN)53,54 were used for predicting novel RNA topologies based on clustering. Because k-NN considers randomized data for its prediction, we consider it now to be less reliable than PAM.
Indeed, by the procedure described above (Clustering and Validation Procedure), we obtain 77.27% accuracy from PAM (Figure 3 and Table 1) compared to poorer results by k-NN (see Supplemental Material).
Figure 3. Plot of PAM clustering result.

(A) Enumerated RNA 2D motifs up to 10 vertices (upper) and 13 vertices (lower): the x- and y-axis are the variables reduced by the MDS as described in Deduction of characteristic information from the Laplacian spectra. Red indicate existing RNAs. (B) PAM classification as RNA-like and non-RNA-like up to 10 vertices (upper) and 13 vertices (lower): the two medoids, or centers, of PAM are indicated by X. Most existing RNAs (65 of 84 existing RNAs) are confirmed as the RNA-like group (red) but 19 are classified as non-RNA-like (green). Hypothetical RNAs are further divided and predicted into RNA-like (blue) and non-RNA-like (black) by the PAM clustering approach.
Table 1. Statistics from PAM. Existing and hypothetical RNA tree motifs, each divided into RNA-like and non-RNA-like by the PAM clustering approach (see Figure 1 and Figure 3).
For the 2286 motifs up to 13 vertices, 65 are predicted correctly as RNA-like but 19 are false positives.
| Vertex | Known | Predicted | Total | ||||
|---|---|---|---|---|---|---|---|
|
| |||||||
| Existing | Hypothetical | Existing | Hypothetical | ||||
| RNA-like (correct class) | Non-RNA-like (misclassification) | RNA-like | Non-RNA-like | ||||
| 3 | 1 | 0 | 1 | 0 | 0 | 0 | 1 |
| 4 | 2 | 0 | 2 | 0 | 0 | 0 | 2 |
| 5 | 3 | 0 | 2 | 1 | 0 | 0 | 3 |
| 6 | 6 | 0 | 4 | 2 | 0 | 0 | 6 |
| 7 | 9 | 2 | 6 | 3 | 2 | 0 | 11 |
| 8 | 16 | 7 | 13 | 3 | 4 | 3 | 23 |
| 9 | 15 | 32 | 12 | 3 | 21 | 11 | 47 |
| 10 | 14 | 92 | 11 | 3 | 60 | 32 | 106 |
| 11 | 8 | 227 | 5 | 3 | 156 | 71 | 235 |
| 12 | 4 | 547 | 4 | 0 | 391 | 156 | 551 |
| 13 | 6 | 1295 | 5 | 1 | 934 | 361 | 1301 |
| Total | 84 | 2202 | 65 | 19 | 1568 | 634 | 2286 |
High accuracy of RAG prediction on the newly found RNAs
The PAM clustering method classifies the motifs associated with the newly found RNAs as in Table 2, as shown in Figure 3 Many of the newly found RNAs were categorized as RNA-like by the RAG clustering strategy. Notably, although three motifs were misclassified as non-RNA-like, they all have only one existing RNA; the motifs that have multiple existing RNAs were all correctly classified as RNA-like.
Table 2. Newly found RNA motifs and their prediction classes.
For motifs less than or equal to 10 vertices, motifs include updates since our 2011 RAG version. For motifs larger than 10 vertices, motifs are new. Many of the newly found graph motifs are classified as RNA-like. A few of them are misclassified as non-RNA-like, but those motifs only have a single RNA each. For example, there are 4 RNAs found for ID 9_4, which are RNA-like, but only 1 for ID 9_46, which is non-RNA-like. The larger RNA motifs more than 11 vertices include only new data. Although there are some misclassified data for 11 vertices, the other results for 12 and 13 nodes are very good. Only one RNA graph, 11_24, has 2 RNAs, and it is properly predicted as RNA-like.
| Graph ID | Label | RNA (PDB ID) |
|---|---|---|
| 8_15 | RNA-like | Ribonuclease P RNA (1NBS_A), 18S ribosomal RNA (3J16_K) |
| 9_2 | RNA-like | Group I Intron (1GID_A,1GID_B,1HR2_B) |
| 9_4 | RNA-like | 80S ribosomal RNA (3IZD_A) |
| 9_19 | RNA-like | Signal Recognition Particle (1L9A_B,1MFQ_A,2GO5_A,2J37_A) |
| 9_46 | non-RNA-like | Ribonuclease P Bacterial A-type (2A2E_A) |
| 10_4 | RNA-like | M-Box Riboswitch Aptamer Domain (2QBZ_X) |
| 10_19 | RNA-like | Glycine Riboswitch (3P49_A) |
| 10_45 | non-RNA-like | Adenosylcobalamin Riboswitch (4GMA_Z) |
|
| ||
| 11_1 | RNA-like | 23S ribosomal RNA (3J5S_A) |
|
| ||
| 11_24 | RNA-like | M-box riboswitch (3PDR_A,3PDR_X) |
|
| ||
| 11_56 | RNA-like | Ribonuclease P (1U9S_A) |
|
| ||
| 11_89 | non-RNA-like | Transfer-messenger RNA (3IYQ_A) |
|
| ||
| 11_138 | RNA-like | Group 1 Intron (3BO4_B) |
|
| ||
| 11_177 | RNA-like | Ribonuclease P (1NBS_B) |
|
| ||
| 11_207 | non-RNA-like | RNase P (3DHS_A) |
|
| ||
| 11_216 | non-RNA-like | Group I intron with a tyrosyl-tRNA synthase (2RKJ_C) |
|
| ||
| 12_150 | RNA-like | tetrahymena ribozyme (1GRZ_A) |
|
| ||
| 12_286 | RNA-like | 80S ribosomal RNA (3ZEX_E) |
|
| ||
| 12_387 | RNA-like | Group I intron (3IIN_B) |
|
| ||
| 12_392 | RNA-like | Group I intron (3BO2_BCDE) |
|
| ||
| 13_140 | RNA-like | Adenosylcobalamin riboswitch (4GXY_A) |
|
| ||
| 13_181 | RNA-like | tetrahymena ribozyme (1GRZ_B) |
|
| ||
| 13_1021 | RNA-like | Group I intron (1U6B_CDB) |
|
| ||
| 13_1047 | RNA-like | Group I intron (3BO3_CDB) |
|
| ||
| 13_1154 | non-RNA-like | Group I intron-product complex (1Y0Q_A) |
|
| ||
| 13_1213 | RNA-like | 28S ribosomal RNA (3J16_J) |
The RNAs that are misclassified are the following: RNA component of bacterial ribonuclease P (PDB ID 2A2E, chain A)57; adenosylcobalamin riboswitch (PDB ID 4GMA, chain Z)58; tmRNA-SmpB ribonucleoprotein complex (PDB ID 3IYR, chain A)59.
Drastically extended RAG for larger topologies and its accuracy based on the current dataset
The number of vertices for RNAs is not limited to 10 because nauty and Traces can generate secondary graphs with more vertices. By integrating this software with our program, all tree graphs through 13 vertices were exhaustively created, which allows the enumeration of much larger sets of topological descriptors. Thus, RAG has extended its coverage by more than 10 fold; RAG in 2011 catalogued 199 secondary graph motifs, but now the count is 2,286, with 2,087 graph motifs added. Since the graph motifs with varying numbers of nodes are clustered together in RAG, we can make RNA-like predictions for larger topologies regardless of the lack of larger existing motifs. Such predictions can be evaluated based on the RNAs archived from the PDB, which includes new RNAs in addition to the others that we could not represent in 2011. The result is shown as Table 1. The result for 11 vertices is somewhat poor, but there is only one misclassified data for 13 vertices, and there is no error for 12 nodes. There is only one graph, RAG ID 11_24, with multiple existing RNAs, and it is predicted properly as RNA-like. Table 1 also shows the statistics for higher vertices, and Figure 4 visualizes the counts of existing RNA-like and existing misclassified non-RNA-like in Table 1.
Figure 4. Numbers of existing RNA-like and existing non-RNA-like vs number of vertices.

This pictorial view of the statistics obtained in Table 1 and Table 2 reveals that there are more existing RNA-like (properly predicted) topologies than existing misclassified non-RNA-like (incorrectly predicted) topologies for every number of vertices.
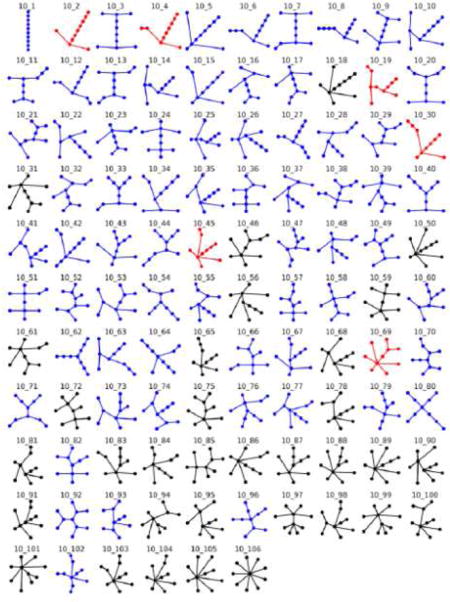
Finally, a complete catalog of our RAG data was provided. Because of space limitations, only a subset is shown in Figure 5 for 10-vertex graphs. The full catalog can be found in the Supplemental Material and on our RAG website (http://www.biomath.nyu.edu/rag/home)
Figure 5. Illustrative subset of the RAG catalogue.

We classify all enumerated graph motifs as existing, RNA-like and non-RNA-like motifs. Existing motifs are colored in red, RNA-like in blue and non-RNA-like in black. The complete version is available in Supplemental Material or http://www.biomath.nyu.edu/rag/home.
Discussion
We have extensively updated our RAG database based on the newly discovered RNA structures using our computer program by deploying the exhaustively enumerated RAG motifs represented as tree graphs. Our clustering results show two significant gains: the RAG clustering strategy yields near 80% accuracy for predicting existing-RNA topologies, and no motif with multiple existing RNA structures is misclassified. Thus, estimating features of RNA-like structures according to their topological representation may be a powerful strategy for RNA design. The predicted RNA-like candidates are good design candidates, as already suggested. 15,16,19
In our previous work15, we used a build-up approach to predict and identify sequences that fold onto ten candidate dual graph motifs. Among those ten candidate motifs, five have since been experimentally determined.16,19 To design RNA sequences that fold onto the targeted RNA-like topologies, we have used graph partitioning algorithms based on Laplacian eigenvectors32. We recently suggested a gap cut approach which partitions a graph into two graphs by the largest gap of the sorted second Laplacian eigenvector μ2; we have illustrated how to use this gap cut partitioning to describe basic modules of RNAs and propose their hierarchical assembly32.
Figure 6 sketches a design application for RNA-like graphs. Here we aim to design a large RNA-like graph, RAG ID 11_205. The gap cut suggests partitioning the graph 11_205 into two substructures, an existing 5_3 corresponding to tRNA (PDB ID: 2DU3) and an RNA-like 7_4 graph. The latter graph is further partitioned into two identical existing graphs 4_2 corresponding to the hammerhead riboyzme (PDB ID: 1RMN). The assembly of these existing sequences provides a starting candidate sequence for the large RNA corresponding to the target RNA-like graph 11_205. Of course, computational refinement by 2D structure prediction programs, not to speak of thermodynamic and experimental verifications, are needed for confirmation. Yet this systematic design protocol for novel RNA-like topologies could help expand the structural and functional repertoire of RNAs.
Figure 6. Design application for RNA-like topologies (example target: RAG ID 11_205).

The design procedures using graph partitioning and build-up approaches are shown. In the first row, graph 11_205 (with random vertex numbering), corresponding Laplacian matrix, eigenvalues (λ2 in red), and the second eigenvector (μ2) are shown. The largest gap of the sorted elements of μ2 (vertices 1 and 3) is marked in red. In the second row, two subgraphs (existing graph 5_3 and RNA-like graph 7_4) and gap cut analysis of RNA-like graph 7_4 are shown. The third row shows the assembly procedure: the build-up of three existing modules at the assembly points suggested by gap partitioning produce a candidate RNA with the targeted graph 11_205.
Although the RAG classification and prediction described here exhibited good accuracy for predicting existing RNA topologies, many improvements can be envisioned. In addition to eigenvalues, Laplacian eigenvectors could also be useful for graph descriptors. The second eigenvector was shown to be useful for graph partitioning for the discovery of RNA modularity32. This kind of approach reveals a connection between RNAs’ higher order structures and their properties. A challenge for the future is to integrate other descriptors and other methods with the current strategy to improve the results.
Conclusion
Focusing on tree graphs, our refined RAG classification method was shown to predict well RNA-like and non-RNA-like topologies of secondary structures with near 80% accuracy. We have also expanded the database significantly to larger topologies, adding 10 times as many topologies since the last update. Our analysis suggests that a topology prediction approach can be productive and reinforces the idea that the properties of RNAs can be analyzed to a first approximation by means of their secondary structures.
Supplementary Material
Highlights.
RNA-As-Graphs (RAG) resources updated and expanded
Motifs for larger RNA structures (up to about 260 nucleotides) are classified, with known RNAs indicated
RNA-like motifs for non-existing RNAs are predicted using a clustering approach
Prediction accuracy of clustering approach is good (~77%)
The combined approach can suggests new RNA motif candidates for design
Acknowledgments
This work is supported by the National Science Foundation (DMS-0201160, CCF-0727001) and the National Institute of Health (GM100469, GM081410). Naoto Baba also would like to thank Professor Irle at Nagoya University for his support. We also thank Cigdem S. Bayrak for her assistance.
Footnotes
Publisher's Disclaimer: This is a PDF file of an unedited manuscript that has been accepted for publication. As a service to our customers we are providing this early version of the manuscript. The manuscript will undergo copyediting, typesetting, and review of the resulting proof before it is published in its final citable form. Please note that during the production process errors may be discovered which could affect the content, and all legal disclaimers that apply to the journal pertain.
References
- 1.Eddy SR. Non-coding RNA genes and the modern RNA world. Nat Rev Genet. 2001;2:919–929. doi: 10.1038/35103511. [DOI] [PubMed] [Google Scholar]
- 2.Nudler E. Flipping Riboswitches. Cell. 2006;126:19–22. doi: 10.1016/j.cell.2006.06.024. [DOI] [PubMed] [Google Scholar]
- 3.Breaker RR. Riboswitches and the RNA World. Cold Spring Harb Perspect Biol. 2010;4(2):a003566. doi: 10.1101/cshperspect.a003566. [DOI] [PMC free article] [PubMed] [Google Scholar]
- 4.Gribaldo S, Brochier-Armanet C. The origin and evolution of Archaea: a state of the art. Philos Trans R Soc Lond B Biol Sci. 2006;361:1007–1022. doi: 10.1098/rstb.2006.1841. [DOI] [PMC free article] [PubMed] [Google Scholar]
- 5.Burley SK, et al. Structural genomics: beyond the Human Genome Project. Nature Genet. 1999;23:151–157. doi: 10.1038/13783. [DOI] [PubMed] [Google Scholar]
- 6.Chance MR, et al. Structural genomics: A pipeline for providing structures for the biologist. Protein Sci. 2002;11:723–738. doi: 10.1110/ps.4570102. [DOI] [PMC free article] [PubMed] [Google Scholar]
- 7.Bray D. Molecular Networks: The Top-Down View. Science. 2003;301:1864–1865. doi: 10.1126/science.1089118. [DOI] [PubMed] [Google Scholar]
- 8.Kalir S, Alon U. Using a Quantitative Blueprint to Reprogram the Dynamics of the Flagella Gene Network. Cell. 2004;117:713–720. doi: 10.1016/j.cell.2004.05.010. [DOI] [PubMed] [Google Scholar]
- 9.Barabási AL, Bonabeau E. Scale-Free Networks. Sci Am. 2003;288:60–69. doi: 10.1038/scientificamerican0503-60. [DOI] [PubMed] [Google Scholar]
- 10.Yook SH, Jeong H, Barabási AL. Modeling the Internet’s large-scale topology. Proc Natl Acad Sci USA. 2002;99:13382–13386. doi: 10.1073/pnas.172501399. [DOI] [PMC free article] [PubMed] [Google Scholar]
- 11.Santi P, et al. Quantifying the benefits of vehicle pooling with shareability networks. Proc Natl Acad Sci USA. 2014;111:13290–13294. doi: 10.1073/pnas.1403657111. [DOI] [PMC free article] [PubMed] [Google Scholar]
- 12.Le SY, Nussinov R, Maizel JV. Tree graphs of RNA secondary structures and their comparisons. Comput Biomed Res. 1989;22:461–473. doi: 10.1016/0010-4809(89)90039-6. [DOI] [PubMed] [Google Scholar]
- 13.Benedetti G, Morosetti S. A graph-topological approach to recognition of pattern and similarity in RNA secondary structures. Biophys Chem. 1996;59:179–184. doi: 10.1016/0301-4622(95)00119-0. [DOI] [PubMed] [Google Scholar]
- 14.Fontana W, Konings DAM, Stadler PF, Schuster P. Statistics of RNA Secondary Structures. Biopolymers. 1993;33:1389–1404. doi: 10.1002/bip.360330909. [DOI] [PubMed] [Google Scholar]
- 15.Kim N, Shiffeldrim N, Gan HH, Schlick T. Candidates for Novel RNA Topologies. J Mol Biol. 2004;341:1129–1144. doi: 10.1016/j.jmb.2004.06.054. [DOI] [PubMed] [Google Scholar]
- 16.Kim N, Fuhr N, Schlick T. Graph Applications to RNA Structure and Function. In: Russell R, editor. Biophysics of RNA folding. Vol. 3. Springer Verlag; 2013. pp. 23–51. Chapter 3. Biophysics for the Life Sciences. [Google Scholar]
- 17.Kim N, Petingi L, Schlick T. Network Theory Tools for RNA Modeling. WSEAS Transaction on Math. 2013;12:941–955. [PMC free article] [PubMed] [Google Scholar]
- 18.Kim N, Zahran M, Schlick T. Computational Prediction of Riboswitch Tertiary Structures Including Pseudoknots by RAGTOP: A Hierarchical Graph Sampling Approach. Methods Enzymol. 2015;553:115–135. doi: 10.1016/bs.mie.2014.10.054. [DOI] [PubMed] [Google Scholar]
- 19.Izzo JA, Kim N, Elmetwaly S, Schlick T. RAG: An update to the RNA-As-Graphs resource. BMC Bioinformatics. 2011;12:219. doi: 10.1186/1471-2105-12-219. [DOI] [PMC free article] [PubMed] [Google Scholar]
- 20.de Hoon M, Imoto S, Miyano S. Inst of Medical Sci Human Genome Cent. Univ. of Tokyo; Tokyo: 2005. The C clustering library. [Google Scholar]
- 21.Haynes T, Knisley D, Seier E, Zou Y. A quantitative analysis of secondary RNA structure using domination based parameters on trees. BMC Bioinformatics. 2006;7:108. doi: 10.1186/1471-2105-7-108. [DOI] [PMC free article] [PubMed] [Google Scholar]
- 22.Koessler DR, Knisley DJ, Knisley J, Haynes T. A Predictive Model for Secondary RNA Structure Using Graph Theory and a Neural Network. BMC Bioinformatics. 2010;11(Suppl6):S21. doi: 10.1186/1471-2105-11-S6-S21. [DOI] [PMC free article] [PubMed] [Google Scholar]
- 23.Hamada M, Tsuda K, Kudo T, Kin T, Asai K. Mining frequent stem patterns from unaligned RNA sequences. Bioinformatics. 2006;22:2480–2487. doi: 10.1093/bioinformatics/btl431. [DOI] [PubMed] [Google Scholar]
- 24.Laserson U, Gan HH, Schlick T. Predicting candidate genomic sequences that correspond to synthetic functional RNA motifs. Nucleic Acids Res. 2005;33:6057–6069. doi: 10.1093/nar/gki911. [DOI] [PMC free article] [PubMed] [Google Scholar]
- 25.Kim N, Shin JS, Elmetwaly S, Gan HH, Schlick T. RAGPools: RNA-As-Graph-Pools—a web server for assisting the design of structured RNA pools for in vitro selection. Bioinformatics. 2007;23:2959–2960. doi: 10.1093/bioinformatics/btm439. [DOI] [PubMed] [Google Scholar]
- 26.Kim N, Izzo JA, Elmetwaly S, Gan HH, Schlick T. Computational generation and screening of RNA motifs in large nucleotide sequence pools. Nucleic Acids Res. 2010;38:e139. doi: 10.1093/nar/gkq282. [DOI] [PMC free article] [PubMed] [Google Scholar]
- 27.Kim N, Gan HH, Schlick T. A computational proposal for designing structured RNA pools for in vitro selection of RNAs. RNA. 2007;13:478–492. doi: 10.1261/rna.374907. [DOI] [PMC free article] [PubMed] [Google Scholar]
- 28.Gopal A, Zhou ZH, Knobler CM. Visualizing large RNA molecules in solution. RNA. 2012;18:284–299. doi: 10.1261/rna.027557.111. [DOI] [PMC free article] [PubMed] [Google Scholar]
- 29.Bakhtin Y, Heitsch CE. Large Deviations for Random Trees and the Branching of RNA Secondary Structures. Bulletin of Mathematical Biology. 2009;71:84–106. doi: 10.1007/s11538-008-9353-y. [DOI] [PMC free article] [PubMed] [Google Scholar]
- 30.Quarta G, Kim N, Izzo JA, Schlick T. Analysis of Riboswitch Structure and Function by an Energy Landscape Framework. J Mol Biol. 2009;393:993–1003. doi: 10.1016/j.jmb.2009.08.062. [DOI] [PMC free article] [PubMed] [Google Scholar]
- 31.Quarta G, Sin K, Schlick T. Dynamic Energy Landscapes of Riboswitches Help Interpret Conformational Rearrangements and Function. PLoS Comput Biol. 2012;8:e1002368. doi: 10.1371/journal.pcbi.1002368. [DOI] [PMC free article] [PubMed] [Google Scholar]
- 32.Kim N, Zheng Z, Elmetwaly S, Schlick T. RNA Graph Partitioning for the Discovery of RNA Modularity: A Novel Application of Graph Partition Algorithm to Biology. PLoS One. 2014;9:e106074. doi: 10.1371/journal.pone.0106074. [DOI] [PMC free article] [PubMed] [Google Scholar]
- 33.Kim N, Laing C, Elmetwaly S, Jung S, Curuksu J, Schlick T. Graph-based sampling for approximating global helical topologies of RNA. Proc Natl Acad Sci USA. 2013;111:4079–4084. doi: 10.1073/pnas.1318893111. [DOI] [PMC free article] [PubMed] [Google Scholar]
- 34.Laing C, Jung S, Kim N, Elmetwaly S, Zahran M, Schlick T. Predicting Helical Topologies in RNA Junctions as Tree Graphs. PLoS One. 2013;8:e71947. doi: 10.1371/journal.pone.0071947. [DOI] [PMC free article] [PubMed] [Google Scholar]
- 35.Gardner PP, et al. Rfam: updates to the RNA families database. Nucleic Acids Res. 2009;37(Suppl 1):D136–D140. doi: 10.1093/nar/gkn766. [DOI] [PMC free article] [PubMed] [Google Scholar]
- 36.Jones SG, Bateman A, Marshall M, Khanna A, Eddy SR. Rfam: an RNA family database. Nucleic Acids Res. 2003;31:439–441. doi: 10.1093/nar/gkg006. [DOI] [PMC free article] [PubMed] [Google Scholar]
- 37.Andronescu M, Bereg V, Hoos HH, Condon A. RNA STRAND: The RNA Secondary Structure and Statistical Analysis Database. BMC Bioinformatics. 2008;9:340. doi: 10.1186/1471-2105-9-340. [DOI] [PMC free article] [PubMed] [Google Scholar]
- 38.McKay BD, Piperno A. Practical Graph Isomorphism, II. J Symbolic Computation. 2013;60:94–112. [Google Scholar]
- 39.Kaufman L, Rousseeuw PJ. Finding groups in data an introduction to cluster analysis. Hoboken, NJ: Wiley-Interscience; 1990. [Google Scholar]
- 40.Nawrocki EP, Burge SW, Bateman A, Daub J, Eberhardt RY, Eddy SR, Floden EW, Gardner PP, Jones TA, Tate J, Finn RD. Rfam 12.0: updates to the RNA families database. Nucleic Acids Res. 2015;43(Database issue):D130–7. doi: 10.1093/nar/gku1063. [DOI] [PMC free article] [PubMed] [Google Scholar]
- 41.van Batenburg FHD, Gultyaev AP, Pleij CWA, Ng J, Oliehoek J. PseudoBase: a database with RNA pseudoknots. Nucleic Acids Res. 2000;28:201–204. doi: 10.1093/nar/28.1.201. [DOI] [PMC free article] [PubMed] [Google Scholar]
- 42.Andronescu M, Bereg V, Hoos HH, Condon A. RNA STRAND: the RNA secondary structure and statistical analysis database. BMC Bioinformatics. 2008;13(9):340. doi: 10.1186/1471-2105-9-340. [DOI] [PMC free article] [PubMed] [Google Scholar]
- 43.Berman HM, et al. The Protein Data Bank. Nucleic Acids Res. 2000;28:235–242. doi: 10.1093/nar/28.1.235. [DOI] [PMC free article] [PubMed] [Google Scholar]
- 44.Berman HM, et al. The Nucleic Acid Database: A Comprehensive Relational Database of Three-Dimensional Structures of Nucleic Acids. Biophys J. 1992;63:751–759. doi: 10.1016/S0006-3495(92)81649-1. [DOI] [PMC free article] [PubMed] [Google Scholar]
- 45.Narayanan BC, et al. The Nucleic Acid Database: new features and capabilities. Nucleic Acids Res. 2013;42:D114–D122. doi: 10.1093/nar/gkt980. [DOI] [PMC free article] [PubMed] [Google Scholar]
- 46.Petingi L, Kim N, Schlick T. Identifying and analyzing RNA pseudoknots based on graph-theoretical properties of dual graphs: a partitioning approach. 2015 In preparation. [Google Scholar]
- 47.Harary F. Graph theory. Reading, Mass: Perseus Books; 1999. [Google Scholar]
- 48.Hagberg AA, Schult DA, Swart PJ. Exploring network structure, dynamics, and function using NetworkX. Proceedings of the 7th Python in Science Conference (SciPy2008).2008. [Google Scholar]
- 49.Brouwer AE, Haemers WH. Spectra of graphs. New York, NY: Springer; 2012. [Google Scholar]
- 50.Chung F. Spectral graph theory. Providence, R.I: Published for the Conference Board of the mathematical sciences by the American Mathematical Society; 1997. [Google Scholar]
- 51.Schlick T. Molecular modeling and simulation an interdisciplinary guide. New York: Springer; 2002. [Google Scholar]
- 52.Borg I, Groenen PJF. Modern multidimensional scaling theory and applications. 2. New York: Springer; 2005. [Google Scholar]
- 53.Ripley BD. Pattern recognition and neural networks. Cambridge: Cambridge University Press; 1996. [Google Scholar]
- 54.Venables WN, Ripley BD. Modern applied statistics with S. 4. New York: Springer; 2002. [Google Scholar]
- 55.Torgo L. Data mining with R: Learning with case studies. Boca Raton: Chapman & Hall/CRC; 2011. [Google Scholar]
- 56.R Development Core Team. R: A Language and Environment for Statistical Computing. Vienna, Austria: the R Foundation for Statistical Computing; 2011. [Google Scholar]
- 57.Larios AT, Swinger KK, Krasilnikov AS, Pan T, Mondragon A. Crystal structure of the RNA component of bacterial ribonuclease P. Nature. 2005;437:584–587. doi: 10.1038/nature04074. [DOI] [PubMed] [Google Scholar]
- 58.Johnson JE, Reyes FE, Polaski JT, Batey RT. B12 cofactors directly stabilize an mRNA regulatory switch. Nature. 2012;492:133–137. doi: 10.1038/nature11607. [DOI] [PMC free article] [PubMed] [Google Scholar]
- 59.Weis F, et al. tmRNA-SmpB: a journey to the centre of the bacterial ribosome. EMBO J. 2010;29:3810–3818. doi: 10.1038/emboj.2010.252. [DOI] [PMC free article] [PubMed] [Google Scholar]
Associated Data
This section collects any data citations, data availability statements, or supplementary materials included in this article.