

Abstract
Background
Heterotopic ossification on the enthesis, which develops after subsequent inflammation, is one of the most distinctive features in ankylosing spondylitis (AS). Prostaglandin E2 (PGE-2) serves as a key mediator of inflammation and bone remodeling in AS. Celastrol, a well-known Chinese medicinal herb isolated from Tripterygium wilfordii, is widely used in treating inflammatory diseases, including AS. It has been proven that it can inhibit lipopolysac-charide-induced expression of various inflammation mediators, such as PGE-2. However, the mechanism by which celastrol inhibits inflammation-induced bone forming in AS is unclear.
Objective
To investigate whether celastrol could inhibit isolated AS fibroblast osteogenesis induced by PGE-2.
Methods
Hip synovial tissues were obtained from six AS patients undergoing total hip replacement in our hospital. Fibroblasts were isolated, primarily cultured, and then treated with PGE-2 for osteogenic induction. Different doses of celastrol and indometacin were added to observe their effects on osteogenic differentiation. Cell proliferation, osteogenic markers, alizarin red staining as well as the activity of alkaline phosphatase were examined in our study.
Results
Celastrol significantly inhibits cell proliferation of isolated AS fibroblasts and in vitro osteogenic differentiation compared with control groups in a time- and dose-dependent manner.
Conclusion
Our results demonstrated that celastrol could inhibit isolated AS fibroblast proliferation and in vitro osteogenic differentiation. The interaction of PI3K/AKT signaling and Wnt protein may be involved in the process. Further studies should be performed in vivo and animal models to identify the potential effect of celastrol on the bone metabolism of AS patients.
Keywords: ankylosing spondylitis, celastrol, osteogenesis, fibroblasts, proliferation, prostaglandin E2
Introduction
Ankylosing spondylitis (AS), an inflammatory and immune disease that mainly affects axial joints,1 is characterized by a strong correlation between chronic inflammation and abnormal new bone formation.2 However, it is not entirely understood.
As an important mediator of inflammation, prostaglandin E2 (PGE-2) modulates the anabolic/catabolic process, which occurs in the bone forming and absorption,3 and is the most abundant among prostaglandins in osteoblasts.4 PGE-2 promotes bone remodeling through inducing osteoblast cell differentiation5,6 and is widely involved in the heterotopic ossification.7,8 Moreover, PGE-2 plays a more essential role in the development of heterotopic ossification than other prostaglandins in the rabbit model.9 PGE-2 could exert antiapoptotic effects on bone marrow stem cells, leading to an increase in the number of cells and subsequent osteoblastic cell differentiation.10 Beside this, PGE-2 is commonly used for osteogenic induction via upregulation of bone morphogenetic protein 2 (BMP-2),11 which has the ability to induce osteoblastic precursor cell differentiation and in vitro osteogenesis.12,13
To date, the possibility of PGE-2 involvement in the pathophysiogenesis and AS progression has been investigated.14 Genome-wide association studies on AS recently reported that gene prostaglandin E receptor 4, one of the four genes that encode the PGE-2 receptors (EP1–EP4),15 was associated with AS.16 Indeed, EP4-knockout mice exhibited a marked reduction in bone resorption, causing impaired formation of osteoclasts, matrix metalloproteinase MMP-2 and MMP-13.17,18 Furthermore, PGE-2 downregulated Wnt/β-catenin inhibitors, including dickkopf-1 and sclerostin, which have been proven to be two crucial negative regulated factors in AS bone forming,19,20 through AKT/PI3K and Wnt signaling cross-interactions.21 Nonsteroidal anti-inflammatory drugs (NSAIDs) were frequently used for patients with AS to inhibit heterotopic ossification over the years, which supports the possibility that prostaglandins were local mediators of inflammation and bone remodeling involved in this process.22–24
Although NSAIDs are generally used for AS patients, common side effects associated with the long-term use of NSAIDs include gastrointestinal and cardiovascular toxicities.25,26 Searching for new drugs with low side effects to target AS inflammation and new bone formation are thus urgent tasks.
As complementary and alternative medications, traditional Chinese medicine not only has a long history of therapeutic use but also is acceptable and tolerated by patients.27 In People’s Republic of China, Tripterygium wilfordii, which is a medicinal herb, has been used in the treatment of inflammatory and rheumatic diseases for thousands of years. T. wilfordii is reported to improve physical activity and relieve symptoms in patients with rheumatoid arthritis (RA)28 and AS.29 Celastrol, one of the active compounds present in T. wilfordii, has been identified to have strong anti-inflammatory activity30,31 and reduce the severity of clinical arthritis.32,33 Previous reports demonstrated that celastrol strongly suppressed lipopolysaccharide-induced expression of PGE-2 at low concentrations,34 via the downregulation of COX-1 and -2 activation.35 This provided a theoretical basis for understanding the inhibitory effects of celastrol against PGE-2-induced osteogenesis.
So far, most studies related to celastrol in inflammatory disease were mainly focused on RA.36 However, the effects of celastrol on AS bone forming have not been documented before. Therefore, our study was carried out to investigate the effect of celastrol on the proliferation and osteogenesis of isolated AS fibroblasts induced by PGE-2 for the first time. To elucidate the mechanisms, we examined the inhibitory role of celastrol on isolated AS fibroblast proliferation and in vitro osteogenic differentiation by using different modern techniques.
Materials and methods
Isolation and culture of hip synovial fibroblasts
Six AS patients with hip joint involved received total hip replacement in our hospital. In this study, patients were referred to a rheumatologist if they were: 1) age ≤45 years, 2) symptoms duration ≥3 months, and 3) asymmetrical arthritis pain plus more than one spondyloarthritis (SpA) feature (Table 1). All the surgical procedures and experiments were approved by the Ethics Committee, Southern Medical University, People’s Republic of China. All patients signed the informed consent. Briefly, the hip capsule synovium tissues were excised from the hip synovial tissue. Synovium was minced and digested with 3 mg/mL collagenase (type I; Sigma-aldrich, Shanghai, China) in sterile phosphate-buffered saline (PBS) for 2.5 hours at 37°C. The isolated tissues were passed through a 70 mm cell strainer (Becton Dickinson, Franklin Lakes, NJ, USA) to form a single-cell suspension. The released cells were washed with PBS, centrifuged at 300× g for 5 minutes, and subsequently resuspended in Dulbecco’s Modified Eagle’s Medium (Thermo Fisher Scientific, Waltham, MA, USA), a medium containing 10% fetal bovine serum, and supplemented with 100 U/mL penicillin, 100 mg/mL streptomycin, and 2 mM l-glutamine (all of them from Thermo Fisher Scientific). The isolated cells were incubated at 37°C under 5% CO2 to form colonies. The old culture medium was removed and PBS was used to wash the cells one to two times. Then trypsin–EDTA (1 mL/25 cm2) was added to wash the bottom of the culture dish. Then trypsin–EDTA was removed and the culture dish was put into the 37°C cell incubator for 2–3 minutes. Trypsin was inhibited by adding a medium containing 10% FBS. Fresh medium was added and cells were transferred into a new culture dish with normal conditions. The cultured medium with PGE-2 was changed every 2 days throughout the experiments. Flow cytometry was used for fibroblast sorting and identification marked by CD90 and CD106 as previously described.37,38
Table 1.
Basic clinical data for AS patients
| Patient number | 1 | 2 | 3 | 4 | 5 | 6 |
|---|---|---|---|---|---|---|
| Diagnosis | AS | AS | AS | AS | AS | AS |
| Age, in years | 43 | 39 | 35 | 41 | 37 | 26 |
| Sex (male or female) | M | F | M | M | M | M |
| BMI | 20.2 | 21.3 | 20.7 | 21.9 | 19.7 | 18.5 |
| HLA-B27 | + | + | + | + | + | + |
| BASDAI | 4.1 | 3.7 | 4.5 | 5.6 | 5.5 | 4.9 |
| NSAIDs used | Yes | Yes | Yes | Yes | Yes | Yes |
| DMARDs used | MTX + SSZ | MTX + SSZ | MTX + SSZ | MTX + SSZ | MTX + SSZ | MTX + SSZ |
| Corticosteroids used | No | No | No | No | No | No |
| TNF-blockade used | No | No | No | No | No | No |
| mSASS scores | 42 | 33 | 39 | 48 | 55 | 22 |
| New York grading | IV | IV | IV | IV | IV | IV |
Note: + is HLA-B27 positive and − is HLA-B27 negative.
Abbreviations: AS, ankylosing spondylitis; BASDAI, Bath Ankylosing Spondylitis Disease Activity Index; DMARDs, Disease Modifying Antirheumatic Drugs; mSASS, modified Stoke Ankylosing Spondylitis Spinal Score; NY, New York; MTX, methotrexate; NSAIDs, nonsteroidal anti-inflammatory drugs; SSZ, sulfasalazine; TNF, tumor necrosis factor.
Cultured fibroblasts were stimulated with PGE-2 (Sigma) at concentrations of 10−7 M as previously described39 and then incubated in 3 mL of Dulbecco’s Modified Eagle’s Medium supplemented with antibiotics and fungizone. PGE-2 was added for proliferation and osteogenesis in the whole cell culture process. The medium was changed every 2 days throughout the experiments.
Preparation of celastrol and indometacin
A stock solution of celastrol (20 mg in 0.6 mL of dimethyl sulfoxide [DMSO]) was prepared and stored as small aliquots at −20°C until used (Sigma-Aldrich Co., St Louis, MO, USA). Different doses of celastrol (0.5, 1.0, and 2.0 μM) used in vitro in this study were based on that used in a previous study.34 Celastrol stock was diluted in PBS, and PBS–DMSO (1.2%) served as its negative control. Indometacin (1.0 μM) was selected as a positive control. DMSO, 1.0 μM of nonselective NSAIDs–indometacin, and the indicated concentrations of celastrol (0.5, 1.0, and 2.0 μM) were added on day 12.
Proliferation assay
Cells were seeded in 24-well plates at a density of 1×10⁵ cells/well. Cell proliferation was investigated using an MTS assay on days 12, 14, 17, and 20, respectively. In brief, cells were added to 500 μL of MTS solution and incubated for 4 hours. After that, cells were washed with PBS and added to 500 μL of DMSO to remove the MTS solution. The optical density was measured at 570 nm using a Sunrise absorbance reader (Tecan Group Ltd., Shanghai, People’s Republic of China).
Alkaline phosphatase activity
Alkaline phosphatase (ALP) activity was examined according to a published protocol.13 Culture medium was aspirated from AS fibroblasts that were incubated in plates. The plates were rinsed with 150 mM NaCl and 1 mL of reaction buffer containing 0.25 M 2-methyl-2-amino propanol and 1 mM magnesium chloride. An amount of 2.5 mg/mL of p-nitrophenyl phosphate (Sigma) at pH 10.3 was added to each well at 37°C, respectively. The reaction was stopped after 30 minutes by adding 0.5 mL of 0.3 M Na3PO4 at pH 12.3. ALP activity was assessed by measuring the absorbance of light at 410 nm and comparing the experimental samples with standard solutions of p-nitrophenol and a blank group. ALP was normalized for protein concentration using BCA Protein Assay Reagent (Pierce, Rockford, IL, USA), compared with the standard protein, and measured by spectrophotometry at 562 nm.
RNA isolation and quantitative real-time PCR
Total RNA was isolated from the cells by using Trizol (Invitrogen, Carlsbad, CA, USA). cDNA was synthesized from 4 μg of total RNA using 200 U of reverse transcriptase (Invitrogen) according to the manufacturer’s instructions. The gene expression was normalized to glyceraldehyde-3-phosphate dehydrogenase (GAPDH) as a housekeeping gene. The sequences of forward and reverse primers used were as follows: BMP-2, 5′-CAGCTTCCACCATGAAGAAT-3′ (F), and 5′-CCAACCTGGTGTCCAAAAGT-3′ (R); runt-related transcription factor 2 (Runx-2), 5′-CTCCCTGAACTCTGCACCAA-3′ (F), and 5′-GTTCTGAAGCACCTGAAATGCG-3′ (R); collagen type I alpha 1, 5′-CCTGGATGCCATCAAAGTCT-3′ (F), and 5′-ACTGCAACTGGAATCCATCG-3′ (R); osteocalcin, 5′-ATGAGAGCCCTCACACTCCT-3′ (F), and 5′-CTTGGACACAAAGGCTGCAC-3′ (R); and GAPDH, 5′-CCATGGAGAAGGCTGGGG-3′ (F), and 5′-CAAAGTTGTCATGGATGACC-3′ (R).
Alizarin red staining
For Alizarin red staining, the cells were fixed for 1 hour using 70% ethanol at 4°C. After washing with distilled water for three times, Alizarin red solution (40 mM) was added for 10 minutes. Cells were rinsed with distilled water and subsequently washed with PBS. The stained cells were observed under an inverted microscope. Photomicrographs were obtained by using a charge-coupled device camera. Thereafter, Alizarin red was eluted with 10% cetylpyridinium chloride, and the optical density value was read at 510 nm for quantified analysis of ossification activity.
Western blot analysis
Whole cells were lysed using RIPA buffer (10 mM Tris-HCl, pH 7.4, 0.15 M NaCl, 0.5% sodium dodecyl sulfate, 1% NP-40, 1% Na-deoxycholate, 1 mM EDTA, 1 mM phenylmethanesulfonyl fluoride, 1 μg/mL of pepstatin, and 1 μg/mL of leupeptin). Secretory protein was extracted by precipitation with trichloroacetic acid. Western blot analysis was performed with anti-PGE-2, anti-AKT, anti-PI3K, anti-GSK-3β, anti-β-catenin, anti-DKK-1, anti-SOST, or anti-β-actin antibodies (all from Abcam, Cambridge, UK).
Statistical analysis
Data in each group were shown as the mean ± standard deviation calculated from the results of the six samples. Statistical significance was assessed by one-way analysis of variance, and multiple comparison tests were employed by Scheffe’s method. A P-value of <0.05 was considered significant.
Results
Effect of celastrol on proliferation of isolated AS fibroblasts
Hip synovial fibroblasts were successfully primary cultured (Figure 1). In order to investigate the potential effect of celastrol on proliferation of isolated AS fibroblasts, we conducted various concentrations of celastrol, indometacin 1.0 μM, normal and DMSO control, and cell viability was determined using MTS assay. Treatment with 2.0 μM celastrol most greatly decreased cell viability, in comparison with other controls (Figures 2 and 3). To further explore the effect of celastrol on cells, we monitored cell proliferation on day 14 using EdU incorporation assay (Figure 4). It was also shown that treatment with 2.0 μM celastrol greatly decreased cell viability, and cells treated with 2.0 μM celastrol led to a significant percentage reduction of EdU-positive AS fibroblasts. An amount of 1.0 μM celastrol exhibited stronger ability to suppress AS fibroblast proliferation compared with 1.0 μM indometacin determined by MTS and EdU analysis (Figures 2–4). The treatment with 1.0 μM indometacin showed slightly more decreased cell viability as well as percentage reduction of EdU-positive AS fibroblasts and was not statistically significant as compared with that in 0.5 μM celastrol (Figures 2–4).
Figure 1.

Fibroblasts were successfully cultured and subcultured regularly by changing the culture medium.
Notes: (A) Fibroblasts were isolated from the hip synovium tissue. (B) third generation of cultured fibroblasts. Scale bar is 100 μm and magnification is 1010. (C) and (D) indicates CD90-FITC-positive cells and self control, respectively. The line is the gate that contains wanted CD90-FITC-positive cells. R2 is the classification of CD90-FITC-positive cells. (E) and (F) indicates CD 106-negative and CD90-positive cells, respectively.
Figure 2.
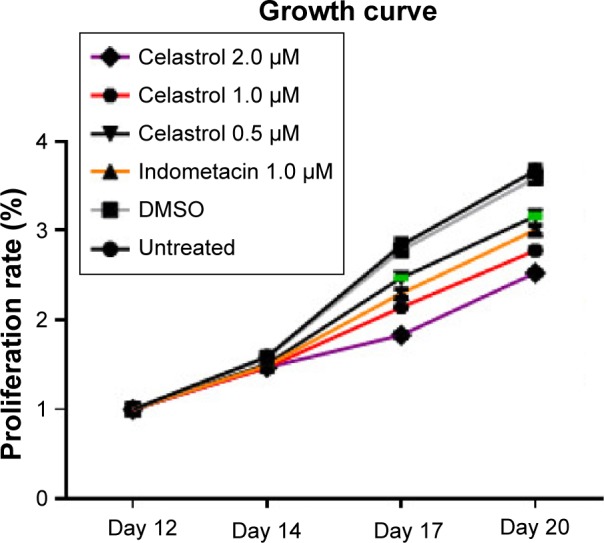
Cell proliferation growth curve treated by various doses of Celastrol, 1.0 μM Indometacin as well as negative controls.
Note: This experiment was repeated six times.
Abbreviation: DMSO, dimethyl sulfoxide.
Figure 3.
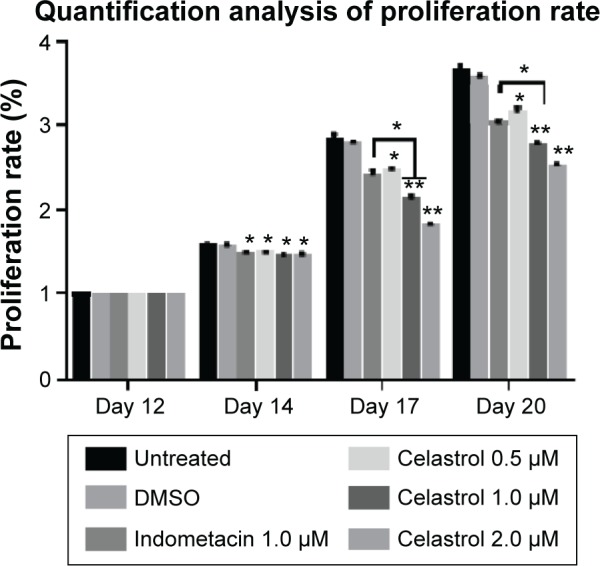
Celastrol inhibits cell proliferation by an MTS assay.
Notes: The results of the MTS assay indicated that celastrol inhibits fibroblast proliferation in a time- and dose-dependent manner. This experiment was repeated six times. Values are shown as mean ± standard deviation. The error bars represent the standard deviation of the mean. *P<0.05, **P<0.01 versus normal control group. OD Value (%) = (mean OD value at different time + mean OD value at baseline) ×100% (the same sample).
Abbreviations: DMSO, dimethyl sulfoxide; OD, optical density.
Figure 4.

Cell proliferation is measured by performing an EdU incorporation assay on day 14.
Notes: Positive DAPI staining was in blue in the nucleus, showing the numbers of cells as the control. Red fluorescence revealed the number of EdU-positive cells (all ×100). Histogram indicates the positive rates of EdU-positive cells (*P<0.05). *P<0.05, **P<0.01 versus normal control group. The scale bar is 50 μm.
Abbreviation: DMSO, dimethyl sulfoxide.
Effect of celastrol on PGE-2-induced osteogenesis in isolated AS fibroblasts
We performed several assays to assess the effect of celastrol on the osteogenesis of AS fibroblasts.
ALP activity
The results demonstrated that large, medium, and small doses of celastrol as well as indometacin had significant inhibitory effects on the ALP activity of PGE-2-induced AS fibroblasts at 2, 3, and 4 weeks (Figure 5). The ALP activity was inhibited by celastrol in a dose-dependent manner. As shown in Figure 5, its activity decreased gradually when stimulated with increasing doses of celastrol. Similarly, data obtained from the medium dose of celastrol and indometacin had a similar effect on the ALP activity.
Figure 5.
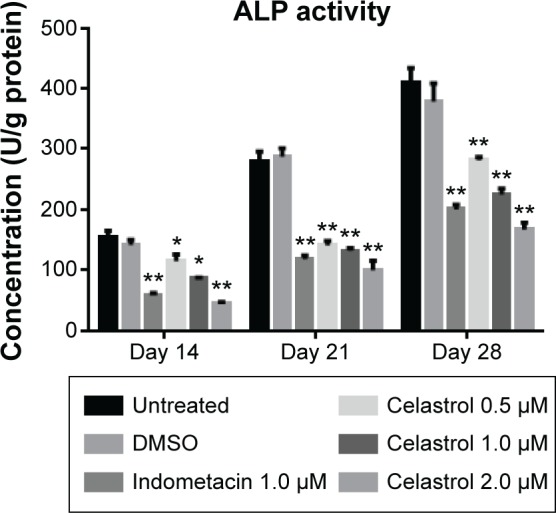
Effect of different doses of celastrol on ALP activity in isolated ankylosing spondylitis fibroblasts compared with indometacin and negative control.
Notes: ALP activity was shown as a specific activity (unit/g protein). The concentration of ALP in each chamber was plotted as the mean ± standard deviation in six replicated experiments. *P<0.05, **P<0.01 versus normal control group. Data from indometacin (1.0 μM) and different doses of celastrol as well as negative controls were compared at the same time duration and evaluated by one-way analysis of variance. Multiple comparisons were performed by Scheffe’s method.
Abbreviations: DMSO, dimethyl sulfoxide; ALP, alkaline phosphatase.
Alizarin red staining
The results demonstrated that large, medium, and small doses of celastrol as well as indometacin had a significant inhibitory effect on the alizarin red staining activity of PGE-2-induced AS fibroblasts on days 14, 21, and 28. Mineralization had the largest decline in 2.0 μM celastrol. The medium dose of celastrol and indometacin had a similar effect on the ARS activity. Celastrol 2.0 μM exhibited stronger inhibition effects of mineralization than indometacin 1.0 μM (Figure 6).
Figure 6.

Effect of different doses of celastrol on Alizarin red staining in isolated ankylosing spondylitis fibroblasts compared with indometacin and negative control.
Notes: Dimethyl sulfoxide (DMSO), 1.0 μM of nonselective nonsteroidal anti-inflammatory drugs–indometacin, and the indicated concentrations of celastrol (0.5, 1.0, and 2.0 μM) were added on day 12. Representative images of Alizarin red staining were demonstrated on days 14, 21, and 28. The area of mineral deposit in each well was calculated by randomly choosing from four microscopic fields. The Alizarin red was eluted with 10% cetylpyridinium chloride, and the OD value was read at 510 nm for quantification. Each bar represents the mean ± standard deviation in six replicated experiments. Data from cultured fibroblasts treated with different drugs were compared at the same time duration and evaluated by one-way analysis of variance. *P<0.05, **P<0.01 versus control group. The scale bar is 100 μm.
Abbreviation: OD, optical density.
Real-time PCR
The mRNA expressions of BMP-2, type I collagen, Runx-2, and osteocalcin were involved in PGE-2-induced AS fibroblasts. Therefore, to investigate whether celastrol could inhibit PGE-2-induced AS fibroblasts, mRNA levels of BMP-2, type I collagen, Runx-2, and osteocalcin were assessed by real-time PCR on days 14, 21, and 28. Treatment with 1.0 μM celastrol suppressed mRNA and protein expression in a time-dependent manner (Figure 7). The results indicated that the group with 1.0 μM celastrol had a significantly higher mRNA expression of BMP-2, type I collagen, Runx-2, and osteocalcin than the normal group. Especially, celastrol treatment significantly reduced the expression of BMP-2 on days 21 and 28 (**P<0.01). These findings indicated that the medium dose of celastrol had a significant inhibitory effect on mRNA expressions of BMP-2, type I collagen, Runx-2, and osteocalcin in PGE-2-induced AS fibroblasts compared with the normal group (*P<0.05).
Figure 7.

An amount of 1.0 μM celastrol inhibits mRNA expressions of osteogenic genes in prostaglandin E2-induced ankylosing spondylitis fibroblasts compared with untreated control.
Notes: The mRNA expressions of bone morphogenetic protein 2 (BMP-2), type I collagen, Runx-2, and osteocalcin were detected by real-time PCR on days 14, 21, and 28. The relative expression level was calculated from the threshold cycle (Ct) value of each PCR product and normalized with that of GAPDH by using a comparative Ct method. *P<0.05, **P<0.01.
Effect of celastrol on PGE-2, Wnt, and AKT/PI3K signaling cross-interactions by Western blot analysis
In order to explore the potential mechanism of celastrol on osteogenesis in isolated AS fibroblasts, we performed Western blot analysis to examine the expression of related proteins pretreated with a medium dose of celastrol. The untreated bands were used as controls. The intensity of the bands was quantified by densitometric analysis and normalized against the appropriate controls. The average results from six independent experiments are shown in Figure 8 and Table S1. Accordingly, we found the expression of PGE-2, AKT, and PI3K reduced substantially. The expression of GSK-3β increased significantly, whereas the level of β-catenin decreased with time. On the other hand, the expression of DKK-1 and sclerostin, Wnt signaling inhibitors, elevated gradually.
Figure 8.
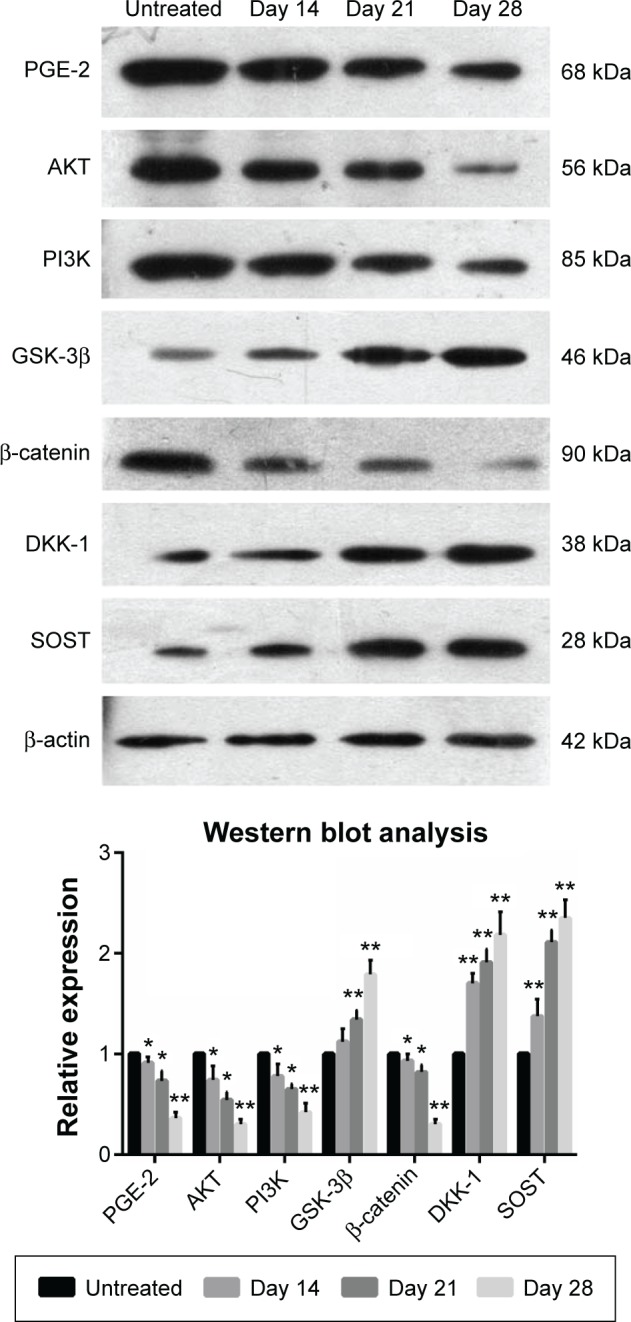
Celastrol (1.0 μM) impacts the expression of related proteins in isolated fibroblasts.
Notes: Cultured fibroblasts were pretreated with 1.0 μM celastrol. The protein levels were detected by Western blot analysis. The bands of Western blot analysis were digitally detected and normalized with that of β-actin. Each bar represents the mean ± standard deviation in six replicated experiments. Data were evaluated by one-way analysis of variance, and multiple comparisons were performed by Scheffe’s method. *P<0.05, **P<0.01 versus normal control group.
Abbreviation: PGE-2, prostaglandin E2.
Discussion
In terms of AS, inflammation is frequently on the sacroiliac joints,40 anterior and posterior vertebral corners of the spine,41 and hip joints42 where syndesmophytes develop. Previous studies have proposed a positive association between vertebral corner inflammation of baseline magnetic resonance imaging and subsequent development of new syndesmophytes,43–45 which supports a hypothesis that inflammation is implicated in new bone formation of patients with AS. In recent years, the inflammation biomarkers related to AS bone turnover have been mostly focused on tumor necrosis factor-α. Nevertheless, interventions targeting tumor necrosis factor-α were not expected to obtain favorable prognosis on AS radiographic progression.46,47 To date, NSAIDs acted as the most effective drugs to prevent structural damage in AS patients22–24 by inhibiting COX-1 and -2 to reduce the production of PGE-2. This fact indicated that PGE-2 may play a crucial role in the interplay between inflammation and new bone formation in AS.
This study was aimed to investigate the underlying mechanism by which celastrol exerts its activity on AS fibroblast proliferation and osteogenesis, thus finding new potential ways for the treatment of AS.
Celastrol is one of the remedial ingredients isolated from the root of the Thunder God Vine, also named “Lei Gong Teng” in Chinese. The Thunder God Vine is a perennial vine of Celastraceae family (bittersweet), which has been widely used in People’s Republic of China for the treatment of autoimmune and inflammatory diseases for centuries.48 The plant is poisonous, but its root pulp contains several therapeutically active compounds. Moreover, celastrol is the most widely studied and promising compound isolated from the Thunder God Vine.28 Celastrol contains electrophilic sites within the rings of quinone methide structure and it can react with the nucleophilic thiol groups of cysteine residues and form covalent Michael adducts.49 Its inhibitory effects against COX-1, COX-2, and PGE-2 have been identified,33,34 which are similar with NSAIDs. The difference is that celastrol is also endowed with cytotoxic-like function and could exhibit anticancer effects.49–51
In the present study, results showed that celastrol effectively inhibited proliferation and bone formation of PGE-2-induced AS fibroblasts. Notably, to elucidate the potential mechanism of antibone forming action of celastrol, we found that cross-interactions of Wnt, BMP-2, and AKT/PI3K signaling pathways were involved in this process.
We selected AS fibroblasts as target cells. In addition to mesenchymal stem cells, fibroblast are another category with osteogenic potentials, especially in pathological conditions.52 Fibroblasts are the most common cells in connective tissues around joints. Fibroblasts and osteoblasts all originate from mesenchymal stem cells with overlapping phenotypes and similar differentiation pathways, which enables possible mutual biological transformation.53 Fibroblasts could also provide surroundings for calcium deposition and bone formation by producing extracellular matrix vesicles and type I collagen, which plays a crucial role in trauma repair and ectopic ossification in certain pathophysiologic processes.54,55 In addition, fibroblasts also express osteogenic markers Runx-2 and osteocalcin (OCN). It has been reported that NIH3T3 cells (a fibroblast cell line derived from mouse) could express osteogenic markers and develop mineralization deposits in vitro induced by dexamethasone and 1,25(OH)2D3.56 Human derived ligament fibroblasts could also develop osteogenic differentiation in conditioned medium.57 Previous studies also identified that activities of fibroblast proliferation and collagen synthesis could be enhanced by inflammatory mediators in vitro, which develop bone formation, proliferation of the connective tissues, or fibrosis.58,59 An early immunohistochemistry analysis by Ono et al60 found four cell types are present in the ossified ligament tissues: chondrocytes, chondrocyte-like cells, fibroblast-like cells, and fibroblasts. According to the distribution of cells, the authors believed that chondrocytes are derived from fibroblasts. In addition, chondrocyte-like cells and fibroblast-like cells are the same cell types, both originating from fibroblasts.56 Other experimental and animal studies have also proved that fibroblasts have osteogenic potential in certain conditions.61,62 All these findings suggest fibroblasts in AS may convert to osteoblast-like type cells and express osteogenic makers under certain conditions.
Fibroblasts isolated from AS patients were significantly affected by PGE-2-induced expression of osteogenic phenotype. The results of our study highlighted a marked reduction in cell proliferation and distinctive attenuation of osteogenic activity of celastrol-treated AS fibroblasts compared to negative controls in a time- and dose-dependent manner. In addition, a medium dose of celastrol exhibited similar effects in both ARS staining and ALP activity, as indometacin. As mentioned above, we hypothesized that this protection against abnormal new bone formation may be mediated via the cross-interactions of PGE-2 and different signaling pathways, such as Wnt, BMP-2, and AKT/PI3K. The Wnt pathway and PGE-2 have mutual cross-interactions. Especially, canonical Wnt proteins promoted PI3K/Akt activity, resulting in GSK-3β phosphorylation and the growth of free β-catenin levels.63 On the other hand, PGE-2 activated the trimetric G-protein by binding to its EP2 receptor. The Gβγ subunits activated PI3-kinase which in turn activated Akt. After that, Akt phosphorylated GSK-3β leading to inhibiting its phosphorylation of β-catenin.64 All in all, the PI3K-Akt signaling pathway is involved in PGE-2-induced osteogenic differentiation. Besides, PGE-2 exerted its anabolic effects to induce BMP-2 and COX-2 via activating osteoblastic EP2 and EP4 receptors.65 BMP-2 in turn induced COX-2 expression, resulting in accelerating the production of PGE-2.66
Previous studies widely reported the effect of celastrol on osteoclasts in RA models. Nanjundaiah et al67 found celastrol could inhibit inflammation-induced osteoclasto-genesis in arthritic rats via stimulating RANKL production and increasing RANKL/OPG ratio. Moreover, Gan et al68 observed that celastrol not only directly suppressed the formation and function of osteoclasts, but also reduced the RANKL-induced expression of osteoclastic genes and transcriptional factors. In our study, celastrol inhibited fibroblast proliferation and osteogenesis, which implicated that celastrol performed “complete inhibition” of osteoblasts, fibroblasts, and osteoclasts. This was why celastrol impaired their further activities and functions.
AS damages bone in the same way as RA in the initial stage of the disease. Nevertheless, some cases are followed by abnormal bone formation, which is probably linked with the subtle modulation via inflammation and bone metabolism on the different stages of disease. Although the underlying mechanism has not been clearly delineated, we hypothesize that it is associated with the attenuation of PGE-2. Our results supported this proposition. A low dose of exogenous PGE-2 (<0.5 mg) stimulated bone apposition. Instead, high doses caused bone resorption, which is expected to be identified in a further study.
In our study, several limitations should be taken into account. First, we only took in vitro AS fibroblasts as study samples. Therefore, animal models or other in vivo models should be performed to substantiate these results. Second, we only demonstrated the role of celastrol on PGE-2 and downstream proteins of PGE-2. Despite all this, other inflammation markers related to bone metabolism are worthy of further in-depth study. Last, we only obtained tissues from AS patients due to ethical reasons. Additional tissue samples from healthy controls, RA, OA patients, and so on would be helpful to identify whether the findings are specific to AS.
In conclusion, our study provided a novel insight regarding the inhibitory effect of celastrol on the proliferation of AS fibroblasts and PEG-2-induced osteogenesis. We demonstrated for the first time that celastrol inhibited PGE-2-induced osteogenic differentiation in AS fibroblasts. Meanwhile, celastrol could also reduce the number of fibroblasts in a time- and dose-dependent manner. These results revealed that celastrol inhibits further differentiation of fibroblasts into osteogenic phenotype. In future studies, application of celastrol might be a promising approach in the treatment of new bone formation in AS by performing pharmacokinetic and toxicological analyses in animals and humans as well as randomized control studies.
Supplementary material
Table S1.
Raw Data Of Western Blot Analysis Results with 1.0 μM celastrol compared with untreated group
| Integral optical density | Sample | 1 | 2 | 3 | 4 | 5 | 6 | Mean ± standard deviation | Student’s t-test | Mean | Standard deviation |
|---|---|---|---|---|---|---|---|---|---|---|---|
| PGE-2 | Untreated | 77,962.000 | 121,535.000 | 154,375.000 | 172,965.000 | 209,880.000 | 259,912.000 | 166,104.833 | 64,274.925 | ||
| 2w | 80,463.000 | 108,513.393 | 137,790.179 | 152,916.071 | 183,369.643 | 230,414.286 | 148,911.095 | 53,454.639 | |||
| 3w | 50,277.000 | 102,007.143 | 97,456.429 | 142,857.000 | 138,725.000 | 184,820.000 | 119,357.095 | 46,401.450 | |||
| 4w | 19,529.339 | 46,443.388 | 58,524.380 | 68,235.124 | 79,473.967 | 99,511.983 | 61,953.030 | 27,601.439 | |||
| AKT | Untreated | 75,130.000 | 121,535.000 | 154,467.000 | 173,849.000 | 271,412.000 | 300,198.000 | 182,765.167 | 87,021.237 | ||
| 2w | 73,375.000 | 89,588.000 | 95,846.000 | 138,928.000 | 161,910.000 | 208,731.000 | 128,063.000 | 51,536.457 | |||
| 3w | 35,984.000 | 67,491.765 | 98,782.000 | 88,292.000 | 113,370.588 | 176,478.000 | 96,733.059 | 47,448.950 | |||
| 4w | 16,084.074 | 40,302.222 | 51,192.593 | 60,956.667 | 70,521.852 | 88,330.000 | 54,564.568 | 25,024.513 | |||
| PI3K | Untreated | 100,313.000 | 125,077.000 | 156,274.000 | 175,708.000 | 211,910.000 | 281,901.000 | 175,197.167 | 65,133.028 | ||
| 2w | 55,197.391 | 103,168.696 | 131,959.130 | 147,187.826 | 176,207.826 | 221,958.261 | 139,279.855 | 57,774.388 | |||
| 3w | 59,597.924 | 89,402.076 | 103,023.529 | 115,707.958 | 134,275.433 | 169,376.471 | 111,897.232 | 37,786.666 | |||
| 4w | 23,267.000 | 55,707.500 | 69,714.500 | 82,346.500 | 96,014.500 | 120,000.000 | 74,508.333 | 33,453.162 | |||
| GSK-3β | Untreated | 73,265.000 | 125,363.000 | 156,274.000 | 180,334.000 | 212,244.000 | 306,148.000 | 175,604.667 | 79,721.611 | ||
| 2w | 95,143.179 | 146,213.078 | 141,615.558 | 198,020.000 | 241,396.843 | 326,957.159 | 191,557.636 | 83,312.457 | |||
| 3w | 108,984.286 | 168,448.571 | 192,251.429 | 226,865.714 | 276,860.000 | 403,350.000 | 229,460.000 | 102,090.639 | |||
| 4w | 148,190.987 | 210,502.146 | 283,343.348 | 303,182.403 | 343,927.039 | 550,534.335 | 306,613.376 | 138,403.780 | |||
| β-catenin | Untreated | 81,591.000 | 127,190.000 | 158,698.000 | 183,174.000 | 212,998.000 | 281,072.000 | 174,120.500 | 69,331.209 | ||
| 2w | 82,537.963 | 111,828.704 | 140,525.000 | 157,359.259 | 187,846.296 | 286,344.444 | 161,073.611 | 71,328.128 | |||
| 3w | 74,752.381 | 102,926.984 | 119,524.603 | 153,410.317 | 158,575.397 | 218,142.063 | 137,888.624 | 50,309.480 | |||
| 4w | 15,518.519 | 38,137.037 | 50,235.185 | 60,865.926 | 69,654.074 | 86,392.222 | 534,67.160 | 24,845.021 | |||
| DKK-1 | Untreated | 83,856.000 | 127,417.000 | 159,792.000 | 185,990.000 | 213,286.000 | 299,094.000 | 178,239.167 | 74,465.589 | ||
| 2w | 158,499.200 | 211,062.400 | 260,292.800 | 299,499.200 | 354,587.200 | 508,168.000 | 298,684.800 | 123,136.173 | |||
| 3w | 17,6312.281 | 234,470.175 | 285,489.474 | 328,710.526 | 406,571.930 | 574,935.088 | 334,414.912 | 141,752.052 | |||
| 4w | 217,241.379 | 270,662.562 | 322,753.695 | 366,940.887 | 454,352.217 | 626,766.010 | 376,452.791 | 147,131.875 | |||
| SOST | Untreated | 913,43.000 | 129,557.000 | 159,792.000 | 186,066.000 | 213,286.000 | 351,542.000 | 188,597.667 | 90,488.470 | ||
| 2w | 153,626.362 | 178,861.656 | 200,989.924 | 254,365.468 | 282,563.998 | 420,596.405 | 248,500.635 | 96,870.683 | |||
| 3w | 204,862.000 | 270,450.000 | 325,814.000 | 375,354.000 | 463,492.000 | 683,864.000 | 387,306.000 | 170,068.344 | |||
| 4w | 231,531.429 | 313,048.571 | 368,368.571 | 413,237.143 | 514,397.143 | 721,402.857 | 426,997.619 | 172,702.782 | |||
| β-actin | Untreated | 86,493.000 | 124,619.000 | 148,869.000 | 171,025.000 | 202,315.000 | 296,635.000 | 171,659.333 | 72,862.317 | ||
| 2w | 86,493.000 | 123,294.000 | 148,208.000 | 169,948.000 | 202,173.000 | 296,319.000 | 171,072.500 | 72,958.144 | |||
| 3w | 85,229.000 | 121,535.000 | 147,596.000 | 169,017.000 | 199,805.000 | 294189.000 | 169,561.833 | 72,591.980 | |||
| 4w | 85,659.000 | 122,272.000 | 148,145.000 | 169,266.000 | 200,881.000 | 294,312.000 | 170,089.167 | 72,493.597 | |||
| PGE-2/β-actin | Untreated | 0.901 | 0.975 | 1.037 | 1.011 | 1.037 | 0.876 | 0.97±0.07 | 0.973 | 0.070 | |
| 2w | 0.930 | 0.880 | 0.930 | 0.900 | 0.907 | 0.778 | 0.89±0.06 | 0.015 | 0.887 | 0.057 | |
| 3w | 0.590 | 0.839 | 0.660 | 0.845 | 0.694 | 0.628 | 0.71±0.11 | 0.015 | 0.710 | 0.108 | |
| 4w | 0.228 | 0.380 | 0.395 | 0.403 | 0.396 | 0.338 | 0.36±0.07 | 0.000 | 0.357 | 0.067 | |
| AKT/β-actin | Untreated | 0.869 | 0.975 | 1.038 | 1.017 | 1.342 | 1.012 | 1.04±0.16 | 1.042 | 0.159 | |
| 2w | 0.848 | 0.727 | 0.647 | 0.817 | 0.801 | 0.704 | 0.76±0.08 | 0.011 | 0.757 | 0.077 | |
| 3w | 0.422 | 0.555 | 0.669 | 0.522 | 0.567 | 0.600 | 0.56±0.08 | 0.025 | 0.556 | 0.082 | |
| 4w | 0.188 | 0.330 | 0.346 | 0.360 | 0.351 | 0.300 | 0.31±0.06 | 0.000 | 0.312 | 0.065 | |
| PI3K/β-actin | Untreated | 1.160 | 1.004 | 1.050 | 1.027 | 1.047 | 0.950 | 1.04±0.07 | 1.040 | 0.069 | |
| 2w | 0.638 | 0.837 | 0.890 | 0.866 | 0.872 | 0.749 | 0.81±0.1 | 0.011 | 0.809 | 0.097 | |
| 3w | 0.699 | 0.736 | 0.698 | 0.685 | 0.672 | 0.576 | 0.68±0.05 | 0.024 | 0.678 | 0.054 | |
| 4w | 0.272 | 0.456 | 0.471 | 0.486 | 0.478 | 0.408 | 0.43±0.08 | 0.001 | 0.428 | 0.082 | |
| GSK-3β/β-actin | Untreated | 0.847 | 1.006 | 1.050 | 1.054 | 1.049 | 1.032 | 1.01±0.08 | 1.006 | 0.080 | |
| 2w | 1.100 | 1.186 | 0.956 | 1.165 | 1.194 | 1.103 | 1.12±0.09 | 0.070 | 1.117 | 0.089 | |
| 3w | 1.279 | 1.386 | 1.303 | 1.342 | 1.386 | 1.371 | 1.34±0.05 | 0.000 | 1.344 | 0.045 | |
| 4w | 1.730 | 1.722 | 1.913 | 1.791 | 1.712 | 1.871 | 1.79±0.08 | 0.000 | 1.790 | 0.085 | |
| β-catenin/β-actin | Untreated | 0.943 | 1.021 | 1.066 | 1.071 | 1.053 | 0.948 | 1.02±0.06 | 1.017 | 0.058 | |
| 2w | 0.954 | 0.907 | 0.948 | 0.926 | 0.929 | 0.966 | 0.94±0.02 | 0.047 | 0.938 | 0.022 | |
| 3w | 0.877 | 0.847 | 0.810 | 0.908 | 0.794 | 0.742 | 0.83±0.06 | 0.015 | 0.829 | 0.060 | |
| 4w | 0.181 | 0.312 | 0.339 | 0.360 | 0.347 | 0.294 | 0.31±0.07 | 0.000 | 0.305 | 0.065 | |
| DKK1/β-actin | Untreated | 0.970 | 1.022 | 1.073 | 1.088 | 1.054 | 1.008 | 1.04±0.04 | 1.036 | 0.044 | |
| 2w | 1.833 | 1.712 | 1.756 | 1.762 | 1.754 | 1.715 | 1.76±0.04 | 0.000 | 1.755 | 0.044 | |
| 3w | 2.069 | 1.929 | 1.934 | 1.945 | 2.035 | 1.954 | 1.98±0.06 | 0.000 | 1.978 | 0.059 | |
| 4w | 2.536 | 2.214 | 2.179 | 2.168 | 2.262 | 2.130 | 2.25±0.15 | 0.001 | 2.248 | 0.148 | |
| SOST/β-actin | Untreated | 1.056 | 1.040 | 1.073 | 1.088 | 1.054 | 1.185 | 1.08±0.05 | 1.083 | 0.053 | |
| 2w | 1.776 | 1.451 | 1.356 | 1.497 | 1.398 | 1.419 | 1.48±0.15 | 0.002 | 1.483 | 0.151 | |
| 3w | 2.404 | 2.225 | 2.207 | 2.221 | 2.320 | 2.325 | 2.28±0.08 | 0.000 | 2.284 | 0.078 | |
| 4w | 2.703 | 2.560 | 2.487 | 2.441 | 2.561 | 2.451 | 2.53±0.1 | 0.000 | 2.534 | 0.098 | |
| Relative PGE-2/β-actin | Untreated | 1.000 | 1.000 | 1.000 | 1.000 | 1.000 | 1.000 | 1±0 | 1.000 | 0.000 | |
| 2w | 1.032 | 0.902 | 0.897 | 0.890 | 0.874 | 0.887 | 0.91±0.06 | 0.016 | 0.914 | 0.059 | |
| 3w | 0.654 | 0.861 | 0.637 | 0.836 | 0.669 | 0.717 | 0.73±0.1 | 0.016 | 0.729 | 0.096 | |
| 4w | 0.253 | 0.389 | 0.381 | 0.399 | 0.381 | 0.386 | 0.36±0.06 | 0.000 | 0.365 | 0.055 | |
| Relative AKT/β-actin | Untreated | 1.000 | 1.000 | 1.000 | 1.000 | 1.000 | 1.000 | 1±0 | 1.000 | 0.000 | |
| 2w | 0.977 | 0.745 | 0.623 | 0.804 | 0.597 | 0.696 | 0.74±0.14 | 0.006 | 0.740 | 0.139 | |
| 3w | 0.486 | 0.569 | 0.645 | 0.514 | 0.423 | 0.593 | 0.54±0.08 | 0.036 | 0.538 | 0.080 | |
| 4w | 0.216 | 0.338 | 0.333 | 0.354 | 0.262 | 0.297 | 0.3±0.05 | 0.000 | 0.300 | 0.053 | |
| Relative PI3K/β-actin | Untreated | 1.000 | 1.000 | 1.000 | 1.000 | 1.000 | 1.000 | 1±0 | 1.000 | 0.000 | |
| 2w | 0.550 | 0.834 | 0.848 | 0.843 | 0.832 | 0.788 | 0.78±0.12 | 0.006 | 0.783 | 0.116 | |
| 3w | 0.603 | 0.733 | 0.665 | 0.666 | 0.642 | 0.606 | 0.65±0.05 | 0.021 | 0.652 | 0.048 | |
| 4w | 0.234 | 0.454 | 0.448 | 0.474 | 0.456 | 0.429 | 0.42±0.09 | 0.001 | 0.416 | 0.090 | |
| Relative GSK-3β/β-actin | Untreated | 1.000 | 1.000 | 1.000 | 1.000 | 1.000 | 1.000 | 1±0 | 1.000 | 0.000 | |
| 2w | 1.299 | 1.179 | 0.910 | 1.105 | 1.138 | 1.069 | 1.12±0.13 | 0.077 | 1.117 | 0.128 | |
| 3w | 1.510 | 1.378 | 1.241 | 1.273 | 1.321 | 1.328 | 1.34±0.09 | 0.000 | 1.342 | 0.095 | |
| 4w | 2.042 | 1.711 | 1.822 | 1.699 | 1.632 | 1.812 | 1.79±0.14 | 0.000 | 1.786 | 0.145 | |
| Relative β-catenin/β-actin | Untreated | 1.000 | 1.000 | 1.000 | 1.000 | 1.000 | 1.000 | 1±0 | 1.000 | 0.000 | |
| 2w | 1.012 | 0.889 | 0.889 | 0.865 | 0.883 | 1.020 | 0.93±0.07 | 0.049 | 0.926 | 0.070 | |
| 3w | 0.930 | 0.830 | 0.760 | 0.847 | 0.754 | 0.783 | 0.82±0.07 | 0.017 | 0.817 | 0.067 | |
| 4w | 0.192 | 0.306 | 0.318 | 0.336 | 0.329 | 0.310 | 0.3±0.05 | 0.000 | 0.298 | 0.053 | |
| Relative DKK1/β-actin | Untreated | 1.000 | 1.000 | 1.000 | 1.000 | 1.000 | 1.000 | 1±0 | 1.000 | 0.000 | |
| 2w | 1.890 | 1.674 | 1.636 | 1.621 | 1.664 | 1.701 | 1.7±0.1 | 0.000 | 1.698 | 0.098 | |
| 3w | 2.134 | 1.887 | 1.802 | 1.788 | 1.930 | 1.938 | 1.91±0.13 | 0.000 | 1.913 | 0.125 | |
| 4w | 2.616 | 2.165 | 2.030 | 1.993 | 2.145 | 2.112 | 2.18±0.23 | 0.002 | 2.177 | 0.225 | |
| Relative SOST/β-actin | Untreated | 1.000 | 1.000 | 1.000 | 1.000 | 1.000 | 1.000 | 1±0 | 1.000 | 0.000 | |
| 2w | 1.682 | 1.395 | 1.263 | 1.376 | 1.326 | 1.198 | 1.37±0.17 | 0.003 | 1.373 | 0.168 | |
| 3w | 2.276 | 2.140 | 2.057 | 2.041 | 2.200 | 1.962 | 2.11±0.12 | 0.000 | 2.113 | 0.115 | |
| 4w | 2.559 | 2.463 | 2.317 | 2.244 | 2.429 | 2.068 | 2.35±0.18 | 0.001 | 2.347 | 0.176 | |
| PGE-2 | AKT | PI3K | GSK-3β | β-catenin | DKK1 | SOST | |||||
| Untreated | 1.000 | 1.000 | 1.000 | 1.000 | 1.000 | 1.000 | 1.000 | ||||
| 2w | 0.914 | 0.740 | 0.783 | 1.117 | 0.926 | 1.698 | 1.373 | ||||
| 3w | 0.729 | 0.538 | 0.652 | 1.342 | 0.817 | 1.913 | 2.113 | ||||
| 4w | 0.365 | 0.300 | 0.416 | 1.786 | 0.298 | 2.177 | 2.347 | ||||
| Untreated | 0.000 | 0.000 | 0.000 | 0.000 | 0.000 | 0.000 | 0.000 | ||||
| 2w | 0.059 | 0.139 | 0.116 | 0.128 | 0.070 | 0.098 | 0.168 | ||||
| 3w | 0.096 | 0.080 | 0.048 | 0.095 | 0.067 | 0.125 | 0.115 | ||||
| 4w | 0.055 | 0.053 | 0.090 | 0.145 | 0.053 | 0.225 | 0.176 |
Note: The bolding indicates that P<0.05 was regarded as significant.
Abbreviations: PGE-2, prostaglandin E2; w, weeks.
Footnotes
Disclosure
The authors report no conflicts of interest in this work.
References
- 1.Braun J, Sieper J. Ankylosing spondylitis. Lancet. 2007;369:1379–1390. doi: 10.1016/S0140-6736(07)60635-7. [DOI] [PubMed] [Google Scholar]
- 2.Sieper J, Appel H, Braun J, Rudwaleit M. Critical appraisal of assessment of structural damage in ankylosing spondylitis: implications for treatment outcomes. Arthritis Rheum. 2008;58:649–656. doi: 10.1002/art.23260. [DOI] [PubMed] [Google Scholar]
- 3.Kawaguchi H, Pilbeam CC, Harrison JR, Raisz LG. The role of prostaglandins in the regulation of bone metabolism. Clin Orthop Rel Res. 1995;313:36–46. [PubMed] [Google Scholar]
- 4.Yokota K, Kusaka M, Oshima T, et al. Stimulation of prostaglandin E2 synthesis in cloned osteoblastic cells of mouse (MC3T3-E1) by epidermal growth factor. J Biol Chem. 1986;261:15410–15415. [PubMed] [Google Scholar]
- 5.Ramirez-Yanez GO, Seymour GJ, Walsh LJ, Forwood MR, Symons AL. Prostaglandin E2 enhances alveolar bone formation in the rat mandible. Bone. 2004;35:1361–1368. doi: 10.1016/j.bone.2004.08.006. [DOI] [PubMed] [Google Scholar]
- 6.Flanagan AM, Chambers TJ. Stimulation of bone nodule formation in vitro by prostaglandins E1 and E2. Endocrinology. 1992;130:443–448. doi: 10.1210/endo.130.1.1309342. [DOI] [PubMed] [Google Scholar]
- 7.Norrdin RW, Jee WSS, High WB. The role of prostaglandins in bone in vivo. Prostaglandins Leukot Essent Fatty Acids. 1990;41:139–149. doi: 10.1016/0952-3278(90)90081-u. [DOI] [PubMed] [Google Scholar]
- 8.Yang RS, Liu TK, Lin-Shiau SY. Increased bone growth by local prostaglandin E2 in rats. Calcif Tissue Int. 1993;52:57–61. doi: 10.1007/BF00675627. [DOI] [PubMed] [Google Scholar]
- 9.Bartlett CS, Rapuano BE, Lorich DG, et al. Early changes in prostaglandins precede bone formation in a rabbit model of heterotopic ossification. Bone. 2006;38:322–332. doi: 10.1016/j.bone.2005.08.016. [DOI] [PubMed] [Google Scholar]
- 10.Weinreb M, Shamir D, Machwate M, Rodan GA, Harada S, Keila S. Prostaglandin E2 (PGE2) increases the number of rat bone marrow osteogenic stromal cells (BMSC) via binding the EP4 receptor, activating sphingosine kinase and inhibiting caspase activity. Prostaglandins Leukot Essent Fatty Acids. 2006;75:81–90. doi: 10.1016/j.plefa.2006.06.004. [DOI] [PubMed] [Google Scholar]
- 11.Zhang J, Wang JH. BMP-2 mediates PGE2-induced reduction of proliferation and osteogenic differentiation of human tendon stem cells. J Orthop Res. 2012;30:47–52. doi: 10.1002/jor.21485. [DOI] [PMC free article] [PubMed] [Google Scholar]
- 12.Huang W, Carlsen B, Wulur I, et al. BMP-2 exerts differential effects on differentiation of rabbit bone marrow stromal cells grown in two-dimensional and three-dimensional systems and is required for in vitro bone formation in a PLGA scaffold. Exp Cell Res. 2004;299:325–334. doi: 10.1016/j.yexcr.2004.04.051. [DOI] [PubMed] [Google Scholar]
- 13.Ryoo HM, Lee MH, Kim YJ. Critical molecular switches involved in BMP-2-induced osteogenic differentiation of mesenchymal cells. Gene. 2006;366:51–57. doi: 10.1016/j.gene.2005.10.011. [DOI] [PubMed] [Google Scholar]
- 14.Haroon N, Kim TH, Inman RD. NSAIDs and radiographic progression in ankylosing spondylitis Bagging big game with small arms? Ann Rheum Dis. 2012;71:1593–1595. doi: 10.1136/annrheumdis-2012-201844. [DOI] [PubMed] [Google Scholar]
- 15.Evans DM, Spencer CC, Pointon JJ, et al. Australo-Anglo-American Spondyloarthritis Consortium (TASC), the Wellcome Trust Case Control Consortium 2 (WTCCC2). Interaction between ERAP1 and HLA-B27 in ankylosing spondylitis implicates peptide handling in the mechanism for HLA-B27 in disease susceptibility. Nat Genet. 2011;43:761–767. doi: 10.1038/ng.873. [DOI] [PMC free article] [PubMed] [Google Scholar]
- 16.Miyaura C, Inada M, Suzawa T, et al. Impaired bone resorption to prostaglandin E2 in prostaglandin E receptor EP4-knockout mice. J Biol Chem. 2000;275:19819–19823. doi: 10.1074/jbc.M002079200. [DOI] [PubMed] [Google Scholar]
- 17.Sakuma Y, Tanaka K, Suda M, et al. Impaired bone resorption by lipopolysaccharide in vivo in mice deficient in the prostaglandin E receptor EP4 subtype. Infect Immun. 2000;68:6819–6825. doi: 10.1128/iai.68.12.6819-6825.2000. [DOI] [PMC free article] [PubMed] [Google Scholar]
- 18.Chiowchanwisawakit P, Lambert RG, Conner-Spady B, et al. Focal fat lesions at vertebral corners on magnetic resonance imaging predict the development of new syndesmophytes in ankylosing spondylitis. Arthritis Rheum. 2011;63:2215–2225. doi: 10.1002/art.30393. [DOI] [PubMed] [Google Scholar]
- 19.Appel H, Ruiz-Heiland G, Listing J, et al. Altered skeletal expression of sclerostin and its link to radiographic progression in ankylosing spondylitis. Arthritis Rheum. 2009;60:3257–3262. doi: 10.1002/art.24888. [DOI] [PubMed] [Google Scholar]
- 20.Heiland GR, Appel H, Poddubnyy D, et al. High level of functional dickkopf-1 predicts protection from syndesmophyte formation in patients with ankylosing spondylitis. Ann Rheum Dis. 2012;71:572–574. doi: 10.1136/annrheumdis-2011-200216. [DOI] [PubMed] [Google Scholar]
- 21.Bonewald LF, Johnson ML. Osteocytes, mechanosensing and Wnt signaling. Bone. 2008;42:606–615. doi: 10.1016/j.bone.2007.12.224. [DOI] [PMC free article] [PubMed] [Google Scholar]
- 22.Boersma JW. Retardation of ossification of the lumbar vertebral column in ankylosing spondylitis by means of phenylbutazone. Scand J Rheumatol. 1976;5:60–64. [PubMed] [Google Scholar]
- 23.Wanders A, Heijde Dv, Landewe R, et al. Nonsteroidal antiinflam-matory drugs reduce radiographic progression in patients with ankylosing spondylitis: a randomized clinical trial. Arthritis Rheum. 2005;52:1756–1765. doi: 10.1002/art.21054. [DOI] [PubMed] [Google Scholar]
- 24.Kroon F, Landewé R, Dougados M, Van der Heijde D. Continuous NSAID use reverts the effects of inflammation on radiographic progression in patients with ankylosing spondylitis. Ann Rheum Dis. 2012;71:1623–1629. doi: 10.1136/annrheumdis-2012-201370. [DOI] [PubMed] [Google Scholar]
- 25.Rollason V, Samer CF, Daali Y, Desmeules JA. Prediction by pharmacogenetics of safety and efficacy of non-steroidal anti-inflammatory drugs: a review. Curr Drug Metab. 2014;15:326–343. doi: 10.2174/1389200215666140202214454. [DOI] [PubMed] [Google Scholar]
- 26.Fine M. Quantifying the impact of NSAID-associated adverse events. Am J Manag Care. 2013;19(14 Suppl):s267–s272. [PubMed] [Google Scholar]
- 27.Normile D. Asian medicine. The new face of traditional Chinese medicine. Science. 2003;299:188–190. doi: 10.1126/science.299.5604.188. [DOI] [PubMed] [Google Scholar]
- 28.Bao J, Dai SM. A Chinese herb Tripterygium wilfordii Hook F in the treatment of rheumatoid arthritis: mechanism, efficacy, and safety. Rheumatol Int. 2011;31:1123–1129. doi: 10.1007/s00296-011-1841-y. [DOI] [PubMed] [Google Scholar]
- 29.Ji Wei, Li Juan, Lin Yue, et al. Report of 12 cases of ankylosing spondylitis patients treated with Tripterygium wilfordii. Clin Rheumatol. 2010;29:1067–1072. doi: 10.1007/s10067-010-1497-0. [DOI] [PMC free article] [PubMed] [Google Scholar]
- 30.Jung HW, Chung YS, Kim YS, Park YK. Celastrol inhibits production of nitric oxide and proinflammatory cytokines through MAPK signal transduction and NF-kappaB in LPS-stimulated BV-2 microglial cells. Exp Mol Med. 2007;39:715–721. doi: 10.1038/emm.2007.78. [DOI] [PubMed] [Google Scholar]
- 31.Kannaiyan R, Shanmugam MK, Sethi G. Molecular targets of celastrol derived from Thunder of God Vine: potential role in the treatment of inflammatory disorders and cancer. Cancer Lett. 2011;303:9–20. doi: 10.1016/j.canlet.2010.10.025. [DOI] [PubMed] [Google Scholar]
- 32.Cascao R, Vidal B, Fonseca JE, Moita LF. Gambogic acid and celastrol are two powerful anti-inflammatory drugs in arthritis. Ann Rheum Dis. 2011;70:A72. [Google Scholar]
- 33.Li GQ, Liu D, Zhang Y, et al. Anti-invasive effects of celastrol in hypoxia-induced fibroblast-like synoviocyte through suppressing of HIF-1α/CXCR4 signaling pathway. Int Immunopharmacol. 2013;17(4):1028–1036. doi: 10.1016/j.intimp.2013.10.006. [DOI] [PubMed] [Google Scholar]
- 34.Kim DH, Shin EK, Kim YH, et al. Suppression of inflammatory responses by celastrol, a quinone methide triterpenoid isolated from Celastrus regelii. Eur J Clin Invest. 2009;39(9):819–827. doi: 10.1111/j.1365-2362.2009.02186.x. [DOI] [PubMed] [Google Scholar]
- 35.Tao X, Schulze-Koops H, Ma L, Cai J, Mao Y, Lipsky PE. Effects of Tripterygium wilfordii Hook. f. extracts on induction of cyclooxygenase 2 activity and prostaglandin E2 production. Arthritis Rheum. 1998;41:130–138. doi: 10.1002/1529-0131(199801)41:1<130::AID-ART16>3.0.CO;2-4. [DOI] [PubMed] [Google Scholar]
- 36.Yu H, Venkatesha SH, Moudgil KD. Microarray-based gene expression profiling reveals the mediators and pathways involved in the anti-arthritic activity of Celastrus-derived Celastrol. Int Immunopharmacol. 2012;13(4):499–506. doi: 10.1016/j.intimp.2012.05.015. [DOI] [PMC free article] [PubMed] [Google Scholar]
- 37.Sorrell JM, Caplan AI. Fibroblasts – a diverse population at the center of it all. Int Rev Cell Mol Biol. 2009;276:161–214. doi: 10.1016/S1937-6448(09)76004-6. [DOI] [PubMed] [Google Scholar]
- 38.Yang ZX, Han ZB, Ji YR, et al. CD106 identifies a subpopulation of mesenchymal stem cells with unique immunomodulatory properties. PLoS One. 2013;8:e59354. doi: 10.1371/journal.pone.0059354. [DOI] [PMC free article] [PubMed] [Google Scholar]
- 39.Weinreb M, Shamir D, Machwate M, Rodan GA, Harada S, Keila S. Prostaglandin E2 (PGE2) increases the number of rat bone marrow osteogenic stromal cells (BMSC) via binding the EP4 receptor, activating sphingosine kinase and inhibiting caspase activity. Prostaglandins Leukot Essent Fatty Acids. 2006;75:81–90. doi: 10.1016/j.plefa.2006.06.004. [DOI] [PubMed] [Google Scholar]
- 40.Wendling D, Toussirot E, Streit G, Prati C. Imaging study scores for ankylosing spondylitis. Joint Bone Spine. 2006;73:655–660. doi: 10.1016/j.jbspin.2006.03.007. [DOI] [PubMed] [Google Scholar]
- 41.Chary-Valckenaere I, d’Agostino MA, Loeuille D. Role for imaging studies in ankylosing spondylitis. Joint Bone Spine. 2011;78:138–143. doi: 10.1016/j.jbspin.2010.07.008. [DOI] [PubMed] [Google Scholar]
- 42.Vander Cruyssen B, Vastesaeger N, Collantes-Estevez E. Hip disease in ankylosing spondylitis. Curr Opin Rheumatol. 2013;25:448–454. doi: 10.1097/BOR.0b013e3283620e04. [DOI] [PubMed] [Google Scholar]
- 43.Baraliakos X, Listing J, Rudwaleit M, Sieper J, Braun J. The relationship between inflammation and new bone formation in patients with ankylosing spondylitis. Arthritis Res Ther. 2008;10:R104. doi: 10.1186/ar2496. [DOI] [PMC free article] [PubMed] [Google Scholar]
- 44.Maksymowych WP, Chiowchanwisawakit P, Clare T, Pedersen SJ, Østergaard M, Lambert RG. Inflammatory lesions of the spine on magnetic resonance imaging predict the development of new syndesmophytes in ankylosing spondylitis: evidence of a relationship between inflammation and new bone formation. Arthritis Rheum. 2009;60:93–102. doi: 10.1002/art.24132. [DOI] [PubMed] [Google Scholar]
- 45.van der Heijde D, Landewe R, Baraliakos X, et al. MRI-inflammation of the vertebral unit (VU) only marginally contributes to new syndesmophytes formation in that unit: A multi-level analyses. Ann Rheum Dis. 2008;67:130. doi: 10.1136/annrheumdis-2011-200208. [DOI] [PubMed] [Google Scholar]
- 46.van der Heijde D, Landew R, Einstein S, et al. Radiographic progression of ankylosing spondylitis after up to two years of treatment with etanercept. Arthritis Rheum. 2008;58:1324–1331. doi: 10.1002/art.23471. [DOI] [PubMed] [Google Scholar]
- 47.van der Heijde D, Landewé R, Baraliakos X, et al. Radiographic findings following two years of infliximab therapy in patients with ankylosing spondylitis. Arthritis Rheum. 2008;58:3063–3070. doi: 10.1002/art.23901. [DOI] [PubMed] [Google Scholar]
- 48.Kannaiyan R, Shanmugam MK, Sethi G. Molecular targets of celastrol derived from Thunder of God Vine: potential role in the treatment of inflammatory disorders and cancer. Cancer Lett. 2011;303:9–20. doi: 10.1016/j.canlet.2010.10.025. [DOI] [PubMed] [Google Scholar]
- 49.Salminen A, Lehtonen M, Paimela T, Kaarniranta K. Celastrol: molecular targets of Thunder God Vine. Biochem Biophys Res Commun. 2010;394:439–442. doi: 10.1016/j.bbrc.2010.03.050. [DOI] [PubMed] [Google Scholar]
- 50.Cao L, Zhang X, Cao F, et al. Inhibiting inducible miR-223 further reduces viable cells in human cancer cell lines MCF-7 and PC3 treated by celastrol. BMC Cancer. 2015;15:873. doi: 10.1186/s12885-015-1909-2. [DOI] [PMC free article] [PubMed] [Google Scholar]
- 51.Sha M, Ye J, Luan ZY, Guo T, Wang B, Hung JX. Celastrol induces cell cycle arrest by MicroRNA-21-mTOR-mediated inhibition p27 protein degradation in gastric cancer. Cancer Cell Int. 2015;15:101. doi: 10.1186/s12935-015-0256-3. [DOI] [PMC free article] [PubMed] [Google Scholar]
- 52.Lories RJ, Luyten FP. Activated fibrocytes: circulating cells that populate the arthritic synovium? Rheumatology (Oxford) 2010;49:617–618. doi: 10.1093/rheumatology/kep365. [DOI] [PubMed] [Google Scholar]
- 53.Ducy P, Schinke T, Karsenty G. The osteoblast: a sophisticated fibroblast under central surveillance. Science. 2000;289:1501–1504. doi: 10.1126/science.289.5484.1501. [DOI] [PubMed] [Google Scholar]
- 54.Hoshi K, Amizuka N, Sakou T, et al. Fibroblasts of spinal ligaments pathologically differentiate into chondrocytes induced by recombinant human bone morphogenetic protein-2: morphological examinations for ossification of spinal ligaments. Bone. 1997;21:155–162. doi: 10.1016/s8756-3282(97)00106-3. [DOI] [PubMed] [Google Scholar]
- 55.Li G, Peng H, Corsi K, Usas A, Olshanski A, Huard J. Differential effect of BMP4 on NIH/3T3 and C2C12 cells: implications for endochondral bone formation. J Bone Mineral Res. 2005;20:1611–1623. doi: 10.1359/JBMR.050513. [DOI] [PubMed] [Google Scholar]
- 56.Shui C, Scutt AM. Mouse embryo-derived NIH3T3 fibroblasts adopt an osteoblast-like phenotype when treated with 1alpha, 25-dihydroxyvitamin D(3) and dexamethasone in vitro. J Cell Physiol. 2002;193:164–172. doi: 10.1002/jcp.10157. [DOI] [PubMed] [Google Scholar]
- 57.Yu F, Cui Y, Zhou X, Han J. Osteogenic differentiation of human ligament fibroblasts induced by conditioned medium of osteoclast-like cells. BioScience Trends. 2011;5:46–51. doi: 10.5582/bst.2011.v5.2.46. [DOI] [PubMed] [Google Scholar]
- 58.Eid K, Labler L, Ertel W, Trentz O, Keel M. Systemic effects of severe trauma on the function and apoptosis of human skeletal cells. J Bone Joint Surg. 2006;88:1394–1400. doi: 10.1302/0301-620X.88B10.17139. [DOI] [PubMed] [Google Scholar]
- 59.Rutherford RB, Moalli M, Franceschi RT, Wang D, Gu K, Krebsbach PH. Bone morphogenetic protein-transduced human fibroblasts convert to osteoblasts and form bone in vivo. Tissue Eng. 2002;8:441–452. doi: 10.1089/107632702760184709. [DOI] [PubMed] [Google Scholar]
- 60.Ono K, Yonenobu K, Miyamoto S, Okada K. Pathology of ossification of the posterior longitudinal ligament and ligamentum flavum. Clin Orthop Relat Res. 1999;359:18–26. doi: 10.1097/00003086-199902000-00003. [DOI] [PubMed] [Google Scholar]
- 61.Hoshi K, Amizuka N, Sakou T, Kurokawa T, Ozawa H. Fibroblasts of spinal ligaments pathologically differentiate into chondrocytes induced by recombinant human bone morphogenetic protein-2: morphological examinations for ossification of spinal ligaments. Bone. 1997;21:155–162. doi: 10.1016/s8756-3282(97)00106-3. [DOI] [PubMed] [Google Scholar]
- 62.Reddi AH, Huggins C. Biochemical sequences in the transformation of normal fibroblasts in adolescent rats. Proc Natl Acad Sci U S A. 1972;69:1601–1605. doi: 10.1073/pnas.69.6.1601. [DOI] [PMC free article] [PubMed] [Google Scholar]
- 63.Fukumoto S, Hsieh CM, Maemura K, et al. Akt participation in the Wnt signaling pathway through Dishevelled. J Biol Chem. 2001;276:17479–17483. doi: 10.1074/jbc.C000880200. [DOI] [PubMed] [Google Scholar]
- 64.Castellone MD, Teramoto H, Williams BO, Druey KM, Gutkind JS. Prostaglandin E2 promotes colon cancer cell growth through a Gs-axin-β-catenin signaling axis. Science. 2005;310:1504–1510. doi: 10.1126/science.1116221. [DOI] [PubMed] [Google Scholar]
- 65.Graham S, Gamie Z, Polyzois I, et al. Prostaglandin EP2 and EP4 receptor agonists in bone formation and bone healing: in vivo and in vitro evidence. Expert Opin Investig Drugs. 2009;18:746–766. doi: 10.1517/13543780902893051. [DOI] [PubMed] [Google Scholar]
- 66.Chikazu D, Li X, Kawaguchi H, et al. Bone morphogenetic protein 2 induces cyclooxygenase 2 in osteoblasts via a Cbfal binding site: role in effects of bone morphogenetic protein 2 in vitro and in vivo. J Bone Miner Res. 2002;17:1430–1440. doi: 10.1359/jbmr.2002.17.8.1430. [DOI] [PubMed] [Google Scholar]
- 67.Nanjundaiah SM, Venkatesha SH, Yu H, Tong L, Stains JP, Moudqil KD. Celastrus and its bioactive celastrol protect against bone damage in autoimmune arthritis by modulating osteoimmune cross-talk. J Biol Chem. 2012;22:22216–22226. doi: 10.1074/jbc.M112.356816. [DOI] [PMC free article] [PubMed] [Google Scholar]
- 68.Gan K, Xu L, Feng X, et al. Celastrol attenuates bone erosion in collagen-induced arthritis mice and inhibits osteoclast differentiation and function in RANKL-induced RAW264.7. Int Immunopharmacol. 2015;24:239–246. doi: 10.1016/j.intimp.2014.12.012. [DOI] [PubMed] [Google Scholar]
Associated Data
This section collects any data citations, data availability statements, or supplementary materials included in this article.
Supplementary Materials
Table S1.
Raw Data Of Western Blot Analysis Results with 1.0 μM celastrol compared with untreated group
| Integral optical density | Sample | 1 | 2 | 3 | 4 | 5 | 6 | Mean ± standard deviation | Student’s t-test | Mean | Standard deviation |
|---|---|---|---|---|---|---|---|---|---|---|---|
| PGE-2 | Untreated | 77,962.000 | 121,535.000 | 154,375.000 | 172,965.000 | 209,880.000 | 259,912.000 | 166,104.833 | 64,274.925 | ||
| 2w | 80,463.000 | 108,513.393 | 137,790.179 | 152,916.071 | 183,369.643 | 230,414.286 | 148,911.095 | 53,454.639 | |||
| 3w | 50,277.000 | 102,007.143 | 97,456.429 | 142,857.000 | 138,725.000 | 184,820.000 | 119,357.095 | 46,401.450 | |||
| 4w | 19,529.339 | 46,443.388 | 58,524.380 | 68,235.124 | 79,473.967 | 99,511.983 | 61,953.030 | 27,601.439 | |||
| AKT | Untreated | 75,130.000 | 121,535.000 | 154,467.000 | 173,849.000 | 271,412.000 | 300,198.000 | 182,765.167 | 87,021.237 | ||
| 2w | 73,375.000 | 89,588.000 | 95,846.000 | 138,928.000 | 161,910.000 | 208,731.000 | 128,063.000 | 51,536.457 | |||
| 3w | 35,984.000 | 67,491.765 | 98,782.000 | 88,292.000 | 113,370.588 | 176,478.000 | 96,733.059 | 47,448.950 | |||
| 4w | 16,084.074 | 40,302.222 | 51,192.593 | 60,956.667 | 70,521.852 | 88,330.000 | 54,564.568 | 25,024.513 | |||
| PI3K | Untreated | 100,313.000 | 125,077.000 | 156,274.000 | 175,708.000 | 211,910.000 | 281,901.000 | 175,197.167 | 65,133.028 | ||
| 2w | 55,197.391 | 103,168.696 | 131,959.130 | 147,187.826 | 176,207.826 | 221,958.261 | 139,279.855 | 57,774.388 | |||
| 3w | 59,597.924 | 89,402.076 | 103,023.529 | 115,707.958 | 134,275.433 | 169,376.471 | 111,897.232 | 37,786.666 | |||
| 4w | 23,267.000 | 55,707.500 | 69,714.500 | 82,346.500 | 96,014.500 | 120,000.000 | 74,508.333 | 33,453.162 | |||
| GSK-3β | Untreated | 73,265.000 | 125,363.000 | 156,274.000 | 180,334.000 | 212,244.000 | 306,148.000 | 175,604.667 | 79,721.611 | ||
| 2w | 95,143.179 | 146,213.078 | 141,615.558 | 198,020.000 | 241,396.843 | 326,957.159 | 191,557.636 | 83,312.457 | |||
| 3w | 108,984.286 | 168,448.571 | 192,251.429 | 226,865.714 | 276,860.000 | 403,350.000 | 229,460.000 | 102,090.639 | |||
| 4w | 148,190.987 | 210,502.146 | 283,343.348 | 303,182.403 | 343,927.039 | 550,534.335 | 306,613.376 | 138,403.780 | |||
| β-catenin | Untreated | 81,591.000 | 127,190.000 | 158,698.000 | 183,174.000 | 212,998.000 | 281,072.000 | 174,120.500 | 69,331.209 | ||
| 2w | 82,537.963 | 111,828.704 | 140,525.000 | 157,359.259 | 187,846.296 | 286,344.444 | 161,073.611 | 71,328.128 | |||
| 3w | 74,752.381 | 102,926.984 | 119,524.603 | 153,410.317 | 158,575.397 | 218,142.063 | 137,888.624 | 50,309.480 | |||
| 4w | 15,518.519 | 38,137.037 | 50,235.185 | 60,865.926 | 69,654.074 | 86,392.222 | 534,67.160 | 24,845.021 | |||
| DKK-1 | Untreated | 83,856.000 | 127,417.000 | 159,792.000 | 185,990.000 | 213,286.000 | 299,094.000 | 178,239.167 | 74,465.589 | ||
| 2w | 158,499.200 | 211,062.400 | 260,292.800 | 299,499.200 | 354,587.200 | 508,168.000 | 298,684.800 | 123,136.173 | |||
| 3w | 17,6312.281 | 234,470.175 | 285,489.474 | 328,710.526 | 406,571.930 | 574,935.088 | 334,414.912 | 141,752.052 | |||
| 4w | 217,241.379 | 270,662.562 | 322,753.695 | 366,940.887 | 454,352.217 | 626,766.010 | 376,452.791 | 147,131.875 | |||
| SOST | Untreated | 913,43.000 | 129,557.000 | 159,792.000 | 186,066.000 | 213,286.000 | 351,542.000 | 188,597.667 | 90,488.470 | ||
| 2w | 153,626.362 | 178,861.656 | 200,989.924 | 254,365.468 | 282,563.998 | 420,596.405 | 248,500.635 | 96,870.683 | |||
| 3w | 204,862.000 | 270,450.000 | 325,814.000 | 375,354.000 | 463,492.000 | 683,864.000 | 387,306.000 | 170,068.344 | |||
| 4w | 231,531.429 | 313,048.571 | 368,368.571 | 413,237.143 | 514,397.143 | 721,402.857 | 426,997.619 | 172,702.782 | |||
| β-actin | Untreated | 86,493.000 | 124,619.000 | 148,869.000 | 171,025.000 | 202,315.000 | 296,635.000 | 171,659.333 | 72,862.317 | ||
| 2w | 86,493.000 | 123,294.000 | 148,208.000 | 169,948.000 | 202,173.000 | 296,319.000 | 171,072.500 | 72,958.144 | |||
| 3w | 85,229.000 | 121,535.000 | 147,596.000 | 169,017.000 | 199,805.000 | 294189.000 | 169,561.833 | 72,591.980 | |||
| 4w | 85,659.000 | 122,272.000 | 148,145.000 | 169,266.000 | 200,881.000 | 294,312.000 | 170,089.167 | 72,493.597 | |||
| PGE-2/β-actin | Untreated | 0.901 | 0.975 | 1.037 | 1.011 | 1.037 | 0.876 | 0.97±0.07 | 0.973 | 0.070 | |
| 2w | 0.930 | 0.880 | 0.930 | 0.900 | 0.907 | 0.778 | 0.89±0.06 | 0.015 | 0.887 | 0.057 | |
| 3w | 0.590 | 0.839 | 0.660 | 0.845 | 0.694 | 0.628 | 0.71±0.11 | 0.015 | 0.710 | 0.108 | |
| 4w | 0.228 | 0.380 | 0.395 | 0.403 | 0.396 | 0.338 | 0.36±0.07 | 0.000 | 0.357 | 0.067 | |
| AKT/β-actin | Untreated | 0.869 | 0.975 | 1.038 | 1.017 | 1.342 | 1.012 | 1.04±0.16 | 1.042 | 0.159 | |
| 2w | 0.848 | 0.727 | 0.647 | 0.817 | 0.801 | 0.704 | 0.76±0.08 | 0.011 | 0.757 | 0.077 | |
| 3w | 0.422 | 0.555 | 0.669 | 0.522 | 0.567 | 0.600 | 0.56±0.08 | 0.025 | 0.556 | 0.082 | |
| 4w | 0.188 | 0.330 | 0.346 | 0.360 | 0.351 | 0.300 | 0.31±0.06 | 0.000 | 0.312 | 0.065 | |
| PI3K/β-actin | Untreated | 1.160 | 1.004 | 1.050 | 1.027 | 1.047 | 0.950 | 1.04±0.07 | 1.040 | 0.069 | |
| 2w | 0.638 | 0.837 | 0.890 | 0.866 | 0.872 | 0.749 | 0.81±0.1 | 0.011 | 0.809 | 0.097 | |
| 3w | 0.699 | 0.736 | 0.698 | 0.685 | 0.672 | 0.576 | 0.68±0.05 | 0.024 | 0.678 | 0.054 | |
| 4w | 0.272 | 0.456 | 0.471 | 0.486 | 0.478 | 0.408 | 0.43±0.08 | 0.001 | 0.428 | 0.082 | |
| GSK-3β/β-actin | Untreated | 0.847 | 1.006 | 1.050 | 1.054 | 1.049 | 1.032 | 1.01±0.08 | 1.006 | 0.080 | |
| 2w | 1.100 | 1.186 | 0.956 | 1.165 | 1.194 | 1.103 | 1.12±0.09 | 0.070 | 1.117 | 0.089 | |
| 3w | 1.279 | 1.386 | 1.303 | 1.342 | 1.386 | 1.371 | 1.34±0.05 | 0.000 | 1.344 | 0.045 | |
| 4w | 1.730 | 1.722 | 1.913 | 1.791 | 1.712 | 1.871 | 1.79±0.08 | 0.000 | 1.790 | 0.085 | |
| β-catenin/β-actin | Untreated | 0.943 | 1.021 | 1.066 | 1.071 | 1.053 | 0.948 | 1.02±0.06 | 1.017 | 0.058 | |
| 2w | 0.954 | 0.907 | 0.948 | 0.926 | 0.929 | 0.966 | 0.94±0.02 | 0.047 | 0.938 | 0.022 | |
| 3w | 0.877 | 0.847 | 0.810 | 0.908 | 0.794 | 0.742 | 0.83±0.06 | 0.015 | 0.829 | 0.060 | |
| 4w | 0.181 | 0.312 | 0.339 | 0.360 | 0.347 | 0.294 | 0.31±0.07 | 0.000 | 0.305 | 0.065 | |
| DKK1/β-actin | Untreated | 0.970 | 1.022 | 1.073 | 1.088 | 1.054 | 1.008 | 1.04±0.04 | 1.036 | 0.044 | |
| 2w | 1.833 | 1.712 | 1.756 | 1.762 | 1.754 | 1.715 | 1.76±0.04 | 0.000 | 1.755 | 0.044 | |
| 3w | 2.069 | 1.929 | 1.934 | 1.945 | 2.035 | 1.954 | 1.98±0.06 | 0.000 | 1.978 | 0.059 | |
| 4w | 2.536 | 2.214 | 2.179 | 2.168 | 2.262 | 2.130 | 2.25±0.15 | 0.001 | 2.248 | 0.148 | |
| SOST/β-actin | Untreated | 1.056 | 1.040 | 1.073 | 1.088 | 1.054 | 1.185 | 1.08±0.05 | 1.083 | 0.053 | |
| 2w | 1.776 | 1.451 | 1.356 | 1.497 | 1.398 | 1.419 | 1.48±0.15 | 0.002 | 1.483 | 0.151 | |
| 3w | 2.404 | 2.225 | 2.207 | 2.221 | 2.320 | 2.325 | 2.28±0.08 | 0.000 | 2.284 | 0.078 | |
| 4w | 2.703 | 2.560 | 2.487 | 2.441 | 2.561 | 2.451 | 2.53±0.1 | 0.000 | 2.534 | 0.098 | |
| Relative PGE-2/β-actin | Untreated | 1.000 | 1.000 | 1.000 | 1.000 | 1.000 | 1.000 | 1±0 | 1.000 | 0.000 | |
| 2w | 1.032 | 0.902 | 0.897 | 0.890 | 0.874 | 0.887 | 0.91±0.06 | 0.016 | 0.914 | 0.059 | |
| 3w | 0.654 | 0.861 | 0.637 | 0.836 | 0.669 | 0.717 | 0.73±0.1 | 0.016 | 0.729 | 0.096 | |
| 4w | 0.253 | 0.389 | 0.381 | 0.399 | 0.381 | 0.386 | 0.36±0.06 | 0.000 | 0.365 | 0.055 | |
| Relative AKT/β-actin | Untreated | 1.000 | 1.000 | 1.000 | 1.000 | 1.000 | 1.000 | 1±0 | 1.000 | 0.000 | |
| 2w | 0.977 | 0.745 | 0.623 | 0.804 | 0.597 | 0.696 | 0.74±0.14 | 0.006 | 0.740 | 0.139 | |
| 3w | 0.486 | 0.569 | 0.645 | 0.514 | 0.423 | 0.593 | 0.54±0.08 | 0.036 | 0.538 | 0.080 | |
| 4w | 0.216 | 0.338 | 0.333 | 0.354 | 0.262 | 0.297 | 0.3±0.05 | 0.000 | 0.300 | 0.053 | |
| Relative PI3K/β-actin | Untreated | 1.000 | 1.000 | 1.000 | 1.000 | 1.000 | 1.000 | 1±0 | 1.000 | 0.000 | |
| 2w | 0.550 | 0.834 | 0.848 | 0.843 | 0.832 | 0.788 | 0.78±0.12 | 0.006 | 0.783 | 0.116 | |
| 3w | 0.603 | 0.733 | 0.665 | 0.666 | 0.642 | 0.606 | 0.65±0.05 | 0.021 | 0.652 | 0.048 | |
| 4w | 0.234 | 0.454 | 0.448 | 0.474 | 0.456 | 0.429 | 0.42±0.09 | 0.001 | 0.416 | 0.090 | |
| Relative GSK-3β/β-actin | Untreated | 1.000 | 1.000 | 1.000 | 1.000 | 1.000 | 1.000 | 1±0 | 1.000 | 0.000 | |
| 2w | 1.299 | 1.179 | 0.910 | 1.105 | 1.138 | 1.069 | 1.12±0.13 | 0.077 | 1.117 | 0.128 | |
| 3w | 1.510 | 1.378 | 1.241 | 1.273 | 1.321 | 1.328 | 1.34±0.09 | 0.000 | 1.342 | 0.095 | |
| 4w | 2.042 | 1.711 | 1.822 | 1.699 | 1.632 | 1.812 | 1.79±0.14 | 0.000 | 1.786 | 0.145 | |
| Relative β-catenin/β-actin | Untreated | 1.000 | 1.000 | 1.000 | 1.000 | 1.000 | 1.000 | 1±0 | 1.000 | 0.000 | |
| 2w | 1.012 | 0.889 | 0.889 | 0.865 | 0.883 | 1.020 | 0.93±0.07 | 0.049 | 0.926 | 0.070 | |
| 3w | 0.930 | 0.830 | 0.760 | 0.847 | 0.754 | 0.783 | 0.82±0.07 | 0.017 | 0.817 | 0.067 | |
| 4w | 0.192 | 0.306 | 0.318 | 0.336 | 0.329 | 0.310 | 0.3±0.05 | 0.000 | 0.298 | 0.053 | |
| Relative DKK1/β-actin | Untreated | 1.000 | 1.000 | 1.000 | 1.000 | 1.000 | 1.000 | 1±0 | 1.000 | 0.000 | |
| 2w | 1.890 | 1.674 | 1.636 | 1.621 | 1.664 | 1.701 | 1.7±0.1 | 0.000 | 1.698 | 0.098 | |
| 3w | 2.134 | 1.887 | 1.802 | 1.788 | 1.930 | 1.938 | 1.91±0.13 | 0.000 | 1.913 | 0.125 | |
| 4w | 2.616 | 2.165 | 2.030 | 1.993 | 2.145 | 2.112 | 2.18±0.23 | 0.002 | 2.177 | 0.225 | |
| Relative SOST/β-actin | Untreated | 1.000 | 1.000 | 1.000 | 1.000 | 1.000 | 1.000 | 1±0 | 1.000 | 0.000 | |
| 2w | 1.682 | 1.395 | 1.263 | 1.376 | 1.326 | 1.198 | 1.37±0.17 | 0.003 | 1.373 | 0.168 | |
| 3w | 2.276 | 2.140 | 2.057 | 2.041 | 2.200 | 1.962 | 2.11±0.12 | 0.000 | 2.113 | 0.115 | |
| 4w | 2.559 | 2.463 | 2.317 | 2.244 | 2.429 | 2.068 | 2.35±0.18 | 0.001 | 2.347 | 0.176 | |
| PGE-2 | AKT | PI3K | GSK-3β | β-catenin | DKK1 | SOST | |||||
| Untreated | 1.000 | 1.000 | 1.000 | 1.000 | 1.000 | 1.000 | 1.000 | ||||
| 2w | 0.914 | 0.740 | 0.783 | 1.117 | 0.926 | 1.698 | 1.373 | ||||
| 3w | 0.729 | 0.538 | 0.652 | 1.342 | 0.817 | 1.913 | 2.113 | ||||
| 4w | 0.365 | 0.300 | 0.416 | 1.786 | 0.298 | 2.177 | 2.347 | ||||
| Untreated | 0.000 | 0.000 | 0.000 | 0.000 | 0.000 | 0.000 | 0.000 | ||||
| 2w | 0.059 | 0.139 | 0.116 | 0.128 | 0.070 | 0.098 | 0.168 | ||||
| 3w | 0.096 | 0.080 | 0.048 | 0.095 | 0.067 | 0.125 | 0.115 | ||||
| 4w | 0.055 | 0.053 | 0.090 | 0.145 | 0.053 | 0.225 | 0.176 |
Note: The bolding indicates that P<0.05 was regarded as significant.
Abbreviations: PGE-2, prostaglandin E2; w, weeks.