

Abstract
Stroke produces a limited process of neural repair. Axonal sprouting in cortex adjacent to the infarct is part of this recovery process, but the signal that initiates axonal sprouting is not known. Growth and Differentiation Factor 10 (GDF10) is induced in peri-infarct neurons in mouse, non-human primate and human. GDF10 promotes axonal outgrowth in vitro in mouse, rat and human neurons through TGFβRI/II signaling. Using pharmacogenetic gain and loss of function studies, GDF10 produces axonal sprouting and enhanced functional recovery after stroke; knocking down GDF10 blocks axonal sprouting and reduces recovery. RNA-seq from peri-infarct cortical neurons indicates that GDF10 downregulates PTEN and upregulates PI3 kinase signaling and induces specific axonal guidance molecules. Unsupervised genome-wide association analysis of the GDF10 transcriptome shows that it is not related to neurodevelopment but may partially overlap with other CNS injury patterns. GDF10 is a stroke-induced signal for axonal sprouting and functional recovery.
Stroke is the leading cause of adult disability due to the brain’s limited capacity for repair. Stroke induces axonal sprouting and the formation of new connections in peri-infarct cortex that link premotor, motor, somatosensory and association areas1–4. In humans, good functional recovery after stroke is associated with remapping of sensorimotor function in motor, somatosensory and premotor circuits5,6 and is accompanied by increases in cortical thickness in these reorganizing areas7. In rodent and primate models of stroke, axonal sprouting and the formation of new connections occurs in motor, somatosensory and premotor areas1–4. These new connections are causally associated with functional recovery4. A better understanding of the mechanisms of axonal sprouting may allow the development of therapies to stimulate recovery after stroke. We previously used transcriptional profiling of single sprouting neurons to identify a unique gene expression profile, a post-stroke sprouting transcriptome3. The molecular networks in this transcriptome involve coordinated signaling systems from secreted growth factors and cytokines to cell surface receptors, intermediary cytoplasmic cascades, and transcriptional control molecules3. Within the post-stroke axonal sprouting transcriptome, Growth and Differentiation Factor 10 (GDF10) is one of the most highly upregulated genes during the initiation of axonal sprouting in peri-infarct cortical neurons in the aged brain.
There have been many studies of the molecules that block axonal sprouting after CNS injury, such as myelin proteins or chondroitin sulfate proteoglycans (CSPGs)8–10, but the factor(s) that are triggered by stroke to promote the initiation of a molecular growth program and axonal sprouting are unknown. As a secreted growth factor, GDF10 is a leading candidate for such a growth promoting signal after stroke. GDF10 is a divergent member of the bone morphogenetic protein (BMP)/transforming growth factor-β (TGFβ) superfamily11–14 (Supplementary Fig. 1). Compared to other GDFs, GDF10 has a unique gene structure12 and signals through TGFβ receptors (TGFβR)14,15. Though GDF10 mRNA is strongly expressed in the developing brain16,17, a role for GDF10 in the adult brain or after CNS injury has not been described.
Here, we show that GDF10 upregulation after stroke is conserved across mice, non-human primates and humans. GDF10 promotes axonal sprouting through TGFβR I and II. In vivo, GDF10 enhances axonal sprouting in peri-infarct cortex and improves motor recovery after stroke; knockdown of GDF10 blocks this axonal sprouting and behavioral recovery. RNA-seq analyses indicate that GDF10 coordinately regulates several molecular signaling systems to induce a neuronal growth state that is distinct from other developmental, CNS- injury and adult plasticity phenotypes. These mechanistic insights into GDF10 begin to advance our understanding for its potential as a therapeutic target after stroke.
Results
GDF10 expression in peri-infarct cortex after stroke
GDF10 is induced in sprouting neurons from aged rats during the initiation phase of axonal sprouting, 7 days after stroke3: 1.32× with microarray and 3× with confirmatory qPCR (p<0.0009) at 7d after stroke3. To confirm the universality of GDF10 induction, GDF10 was localized in peri-infarct tissue in mouse, non-human primate and human. There is a very low level of GDF10 present in neurons in non-stroke cortex (Fig. 1c,k,s). After stroke, GDF10 is induced in cells with markers of neurons and in brain tissue surrounding these neurons (Fig. 1, Supplementary Fig. 2a,b,d). GDF10 immunoreactivity within peri-infarct cortex is not present in cells with markers of microglia and astrocytes, but is seen in the extracellular matrix, as expected of a secreted protein in the peri-infarct cortex (Fig. 1, Supplementary Fig. 2d,e). By Western blot, GDF10 protein is significantly elevated in peri-infarct cortex (Supplementary Fig. 3). In these studies, GDF10 is induced in rodents (7 days after stroke), non-human primates (2 days) and humans (chronic period) indicating a large range of species and a broad time period for upregulation after stroke. GDF10 may serve as a paracrine signal for axonal sprouting.
Figure 1.
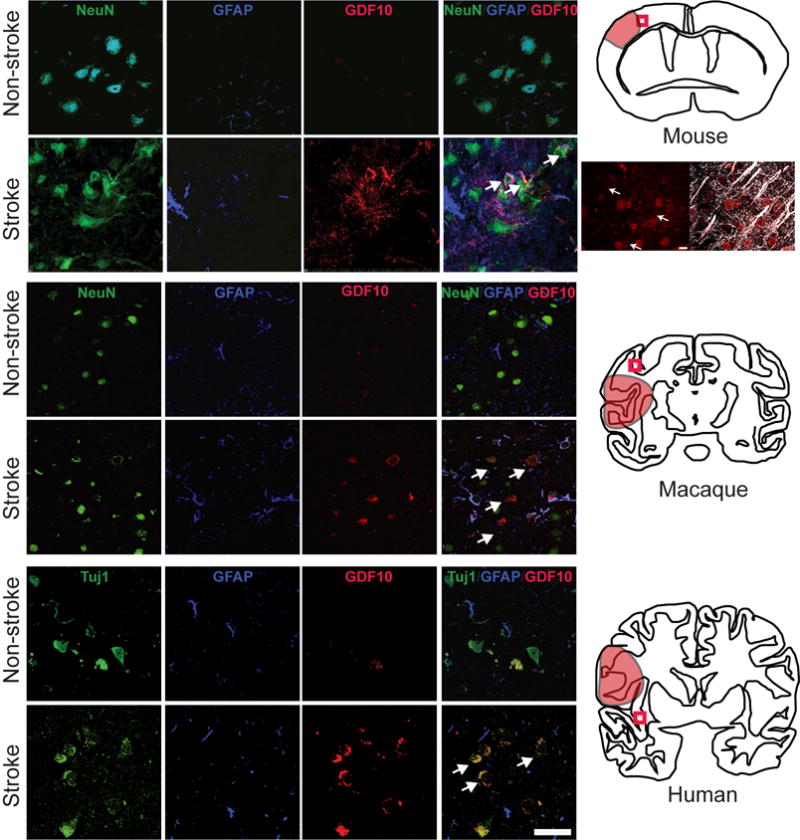
GDF10 expression in peri-infarct cortex after stroke in mice, macaques and humans. Top section shows immunohistochemical staining in peri-infarct cortex in mice 7 days after stroke (n=5). GD10 staining (red) is apparent in peri-infarct tissue, overlapping with NeuN staining (green). Arrows in bottom right panel show representative NeuN+/GDF10+ cells. Schematic at right shows location of stroke as red shaded area; box is position of photomicrographs. The panels below the mouse schematic are higher magnification of GDF10 (red) co-localizing to neurons whose dendrites are MAP2+ (white), denoted by arrows. Middle section shows immunohistochemical staining in peri-infarct cortex in non-human primate (n = 2 stroke, n = 3 control) 2 days after stroke. Same conventions as in mouse panels. Arrows in bottom right show double labeled NeuN+/GDF10+ neurons after stroke. Bottom section shows mmunohistochemical staining in human control (n = 4) and stroke (n = 7). Arrows show double labeled NeuN+/GDF10+ neurons after stroke. In this human case the stroke is chronic, or greater than 3 months after the event. Scale bar = 50 μm and applies to all photomicrographs.
GDF10 enhances axonal length of primary cortical neurons
A role for GDF10 in axonal outgrowth has not been previously established. In mouse primary cortical neurons, GDF10 produces an increase in axonal outgrowth, with the dose of 500ηg/ml producing equivalent axonal outgrowth to similar doses of the well-described axonal sprouting growth factors braid derived growth factor (BDNF) and fibroblast growth factor 2 (FGF2) (Fig. 2a). GDF10 siRNA significantly knocks down GDF10 protein levels (Supplementary Figs. 3a,c) and inhibits axonal outgrowth from cortical neurons (Fig. 2b). To understand the effects of GDF10 on other neurons, we tested the effects of this molecule on FACS-isolated adult rat retinal ganglion cells (RGCs)18. GDF10 stimulates axonal outgrowth of RGCs compared to negative control. The relative proportion of this axonal outgrowth effect is independent of treatments that separately induce axonal outgrowth, such as elevation in cAMP with forskolin (Fig. 2e). These studies show that GDF10 enhances axonal outgrowth and knockdown of GDF10 blocks axonal outgrowth in several neuronal types, with a dose effect that is similar to other growth promoting factors.
Figure 2.
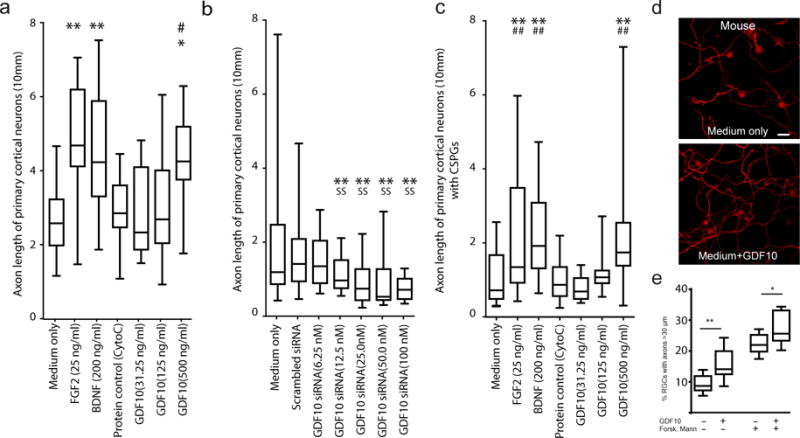
GDF10 enhances axonal outgrowth in primary neurons in vitro. (a–c) Axonal outgrowth in P4 mouse primary cortical neurons. Axon length was measured after 3 days in culture. Cyto C = cytochrome C, a protein control for the addition of growth factor, used in the in vivo studies (Fig. 4a). In (c), wells are plated with CSPG prior to cell growth. In all graphs box extends from the 25th to 75th percentiles and the line in the box is the mean. The whiskers show the minimum and maximum values. (d) P4 cortical neurons stained with SMI-312 after 2 additional days culture in medium alone or medium+GDF10 (500 ηg/ml). Scale bar = 20 μm. (e) Rat adult RGCs cultured in presence of GDF10, forskolin or mannitol. n=7 in culture medium only; n=8 the other 3 groups. Two independent cultures per condition and in each culture 4 wells repeating the condition. * = P<0.05, ** = P<0.01, compared to Medium only; ˆ = P<0.05 compared to Medium+GDF10; # = P<0.05, ## = P<0.01 compared to Scrambled+GDF10; @ = P<0.05, @@ = P<0.01 compared to Protein control Cyto C. All conditions were tested in quadruplicate, in two separate experiments. In (a) F (6, 105) = 7.220; (b) F (6, 105) = 8.384; (c) F (6, 105) = 22.44; (e) medium vs GDF10: t=2.852 df=13; fosk/mann vs fosk/man GDF10:t=2.371 df=14. Error bars are SEM. All observations are normalized to the number of NeuN positive cells in each sample (Supplementary Figure 12). Statistical testing is repeated-measures ANOVA followed by Tukey-Kramer’s post hoc test (a–c) or one tail unpaired T test (e).
Axonal outgrowth in the adult brain after stroke occurs in an environment inhibitory to axonal sprouting, with prominent induction of glial scar molecules such as CSPGs5,6. CSPGs inhibit axonal outgrowth of P4 cortical neurons in culture medium alone or with a protein control (Supplementary Fig. 3b). Significantly, GDF10 has a dose-dependent promotion of outgrowth in the presence of CSPGs (Fig. 2c).
GDF10 promotes axonal outgrowth in vitro via TGFβRs
Unlike other GDFs, GDF10 signals through TGFβRI and RII and downstream transcription factors Smad2/3, and not BMPRI/II and Smad1/515 (Supplementary Figure 1). To identify the molecular signaling systems for GDF10’s axonal outgrowth effect, neurons were treated with the TGFβRI antagonist SB431542, or TGFβRII or TGFβRIII siRNA. All siRNAs knockdown their respective protein target (Supplementary Fig. 3c,d) in this culture model system where GDF10 is expressed in neurons that have undergone the plating process (Supplementary Fig. 4). The axonal growth-promoting effect of GDF10 was significantly reduced either with blockade of TGFβRI or knockdown of TGFβRII (Fig. 3a). No statistical difference was noted between the groups treated with TGFβRIII siRNA+GDF10 and scrambled siRNA control+GDF10 (Fig. 3a). Knockdown of Smad2 or Smad3 significantly inhibited the axonal outgrowth effect of GDF10 on primary neurons. No significant difference in axonal length was noted between the groups of the scrambled siRNA+GDF10 and Smad1 or 5 siRNA treated with GDF10 (Fig. 3b). Furthermore, in vivo pharmacological blockade of TGFβRI/II using SB431542 and losartan19,20 decreases Smad2/3 signaling in the peri-infarct tissue (Supplementary Fig. 5) during the period of GDF activity after stroke. In total, these studies show that TGFβRI/II and Smad 2/3 mediate the effects of GDF10 in enhancing axonal outgrowth.
Figure 3.
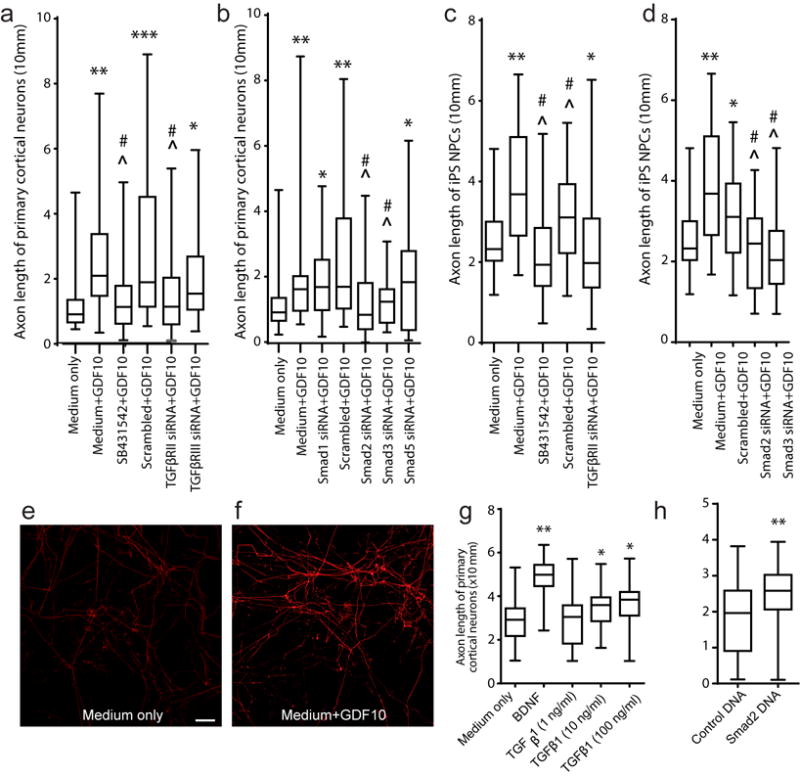
GDF10 enhances axonal outgrowth in human neurons via TGFβ signaling. (a, b) P4 mouse cortical neuron culture with TβRI/II and Smad blockade. SB431542 is a TGFβRI antagonist, added at initial plating. In all graphs, box extends from the 25th to 75th percentiles and the line in the box is the mean. The whiskers show the minimum and maximum values (c, d) human iPS-neurons cultured in the presence of GDF10, SB431542, or TβRII, Smad2 and Smad3 siRNA. Each condition is 2–4 observations in 2–3 independent experiments. (e,f) iPS-NPCs in culture with GDF10 for 2 days, stained with SMI-312 for axons. Scale bar = 20 μm. (g) TGFβ1 and smad2 enhance axonal outgrowth of P4 primary cortical neurons. Axon length with treatment of TGFβ1 at ascending concentrations. N=3 for each experiment. (h) Axonal outgrowth with transfection of Smad2 expression plasmid. Conventions as in (g). * =P<0.05, ** =P<0.01, *** = P<0.005 compared to Medium only; ˆ = P<0.05 compared to Medium+GDF10; # = P<0.05, ## = P<0.01 compared to Scrambled+GDF10; @ = P<0.05, @@ = P<0.01 compared to Protein control Cyto C. All conditions were tested in quadruplicate, in two separate experiments. In (a) F (5, 186) = 10.28; (b) F (2, 93) = 6.138; (c) F (4, 155) = 10.23; (d) F (4, 155) = 11.49; (g) F (2, 93) = 4.435; (h) t test, two-tailed t = 3.073 df = 62. Error bars are SEM. All observations are normalized to the number of NeuN positive cells in each sample (Supplementary Figure 12). Statistical testing is repeated-measures ANOVA followed by Tukey-Kramer’s post hoc test (a–d,g) or one tail unpaired T test (h).
These findings raise the question of whether TGFβ itself will promote axonal outgrowth from cortical neurons. This has been described with other primary neuronal systems21,22, as well as the opposite—that Smad2 blocks axonal sprouting23,24. Administration of TGFβ1 to cortical neurons promotes axonal outgrowth. However, the axonal outgrowth effect of TGFβ is weaker than that of GDF10, as well as BDNF, and has a ceiling effect (Fig. 3g). Smad2 was directly transfected into P4 cortical neurons to test its effect on axonal outgrowth. This produces a significant increase in axonal outgrowth compared to control plasmid transfection (Fig. 3f). These data provide independent confirmation that Smad2 downstream signaling from TGFβRI/II promotes axonal sprouting, but suggest that additional elements in GDF10 action play a role in the full axonal sprouting effect.
GDF10 stimulates axonal outgrowth of human iPS-neurons
Human and rodent cells may respond differently to TGFβ/BMP signaling25. To determine if GDF10 has axonal growth-promoting effects on human neurons, human induced pluripotent stem cell derived neurons (hiPS-neurons)26,27 were tested. GDF10 promotes significant axonal outgrowth of hiPS-neurons (Figs. 3c,e,f) and blockade of TGFβRI or knockdown of TGFβRII in the presence of GDF10 prevents GDF10-induced axonal outgrowth (Fig. 3c). Also, the growth-promoting effect of GDF10 is blocked by knockdown of Smad 2/3 (Fig. 3d). This data indicates that GDF10 has a common signaling pathway for axonal outgrowth in human and rodent neurons.
GDF10 increases axonal connections in peri-infarct cortex
A candidate signal for axonal sprouting in peri-infarct cortex after stroke would be induced at the stroke site and promote the formation of new connections. To test this hypothesis, GDF10 gain and loss of function was produced directly from the stroke through sustained release via biopolymer hydrogel, which produces release over 2–3 weeks from the stroke site3,4,28 without altering local inflammation, gliosis, neuronal or vascular structure4. As previously shown in other gene systems3,4, nucleotide-modified siRNA delivered directly into the infarct core produces protein knockdown over at least 2 weeks after stroke with GDF10 (Supplementary Fig. 3a).
Mice received a stroke in forelimb motor cortex, followed 7 days later by injection of GDF10/hydrogel or GDF10 siRNA. This 7 day period is when GDF10 is induced in peri-infarct cortex in the rodent3 (Fig. 1). Twenty-one days later the neuronal tracer biotinylated dextran amine (BDA) was microinjected into the intact forelimb motor cortex anterior to the stroke site. New connections in peri-infarct cortex can be detected after stroke within this timeframe3,4,29. The BDA-labeled connections of the forelimb motor cortex were quantitatively mapped and registered to functional cortical areas using the somatosensory body map3,4,28,29 and to the location of corticospinal neurons in motor, premotor and somatosensory areas retrogradely labeled from the spinal cord (Supplementary Fig. 6a). There is no significant difference in BDA injection location and volumes, or in infarct volumes across all experimental conditions (Supplementary Fig. 7a,b). As reported previously3,4,28,29, stroke alone modestly but significantly induces axonal sprouting in the motor cortex adjacent to the stroke site compared to normal motor system connections (Supplementary Fig. 6b). This post-stroke axonal sprouting occurs from motor cortex, posteriorly towards immediate peri-infarct motor and somatosensory areas.
Two control conditions were utilized for GDF10 protein and siRNA delivery: stroke+scrambled siRNA and stroke+protein control (cytochrome C). These produced the same pattern of connections as stroke-alone (n = 8–9 per group, Supplementary Figs. 8 and 9). Quantitative connectional mapping shows that stroke+GDF10 induces a statistically significant change in cortical connections compared to stroke alone and stroke+protein control, with a robust projection from motor cortex anteriorly to premotor and prefrontal cortex (n = 8–9 per group, Fig. 4a–c). This is a non-isotropic increase in projections, with a unique frontally-projecting axonal connection with GDF10 delivery after stroke. To further quantify the location of individual neuronal projections the number of labeled axons was counted in a linear distribution in each tangential section through the injection site, extending across the cortical hemisphere (Fig. 4c). This shows a significant increase in neuronal projections with GDF10 delivery, particularly anterior to the motor cortex. Furthermore, colocalization analysis of the pre- and post-synaptic markers VGLUT2 and Homer1 indicate that BDA-labeled sprouting neurons contain the pre-synaptic glutamatergic marker in tight association with the post-synaptic marker Homer1 (Supplementary Fig 10). siRNA knockdown of GDF10 significantly inhibits cortical axonal sprouting after stroke (Fig. 4d,e), producing a pattern of motor system axonal connections that resembles the non-stroke, normal brain (Fig 4d; Supplementary Figs 8, 13). These data show that GDF10 induces substantial axonal sprouting and synapse formation after stroke into premotor and prefrontal areas, and blocking GDF10 eliminates the normal pattern of axonal sprouting seen in stroke to produce a pattern of motor system connections that is not statistically different from that of the normal brain.
Figure 4.
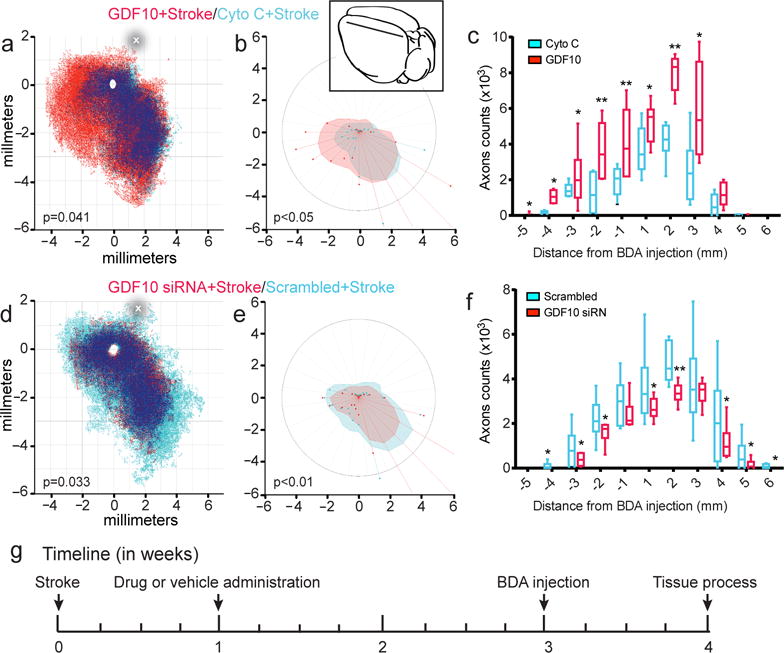
GDF10 promotes axonal connections in peri-infarct cortex after stroke. (a) Quantitative cortical mapping of connections in layers II/III of the flattened mouse cortical hemisphere ipsilateral to the forelimb motor cortex in stroke with protein control (Cyto C) (blue, n=8), GDF10+Stroke (red, n=8), and areas of dense overlap of these two conditions (dark blue). X and Y axes are distances in millimeters from the center of the BDA tracer injection (empty circle). P value is Hotellings T2. The horizontal line shows the position in which neuronal label was quantified within the ipsilateral hemisphere (c). (b) Polar plot of connections of forelimb motor cortex projections relative to the tracer injection in forelimb motor cortex as the origin. Filled polygons represent the 70th percentile of the distances of all BDA labeled connections from the injection site in each segment of the graph. Weighted polar vectors represent the median vector multiplied by the median of the normal distribution of the number of points in a given segment of the graph. P value is Watson’s nonparametric two-sample U2 test. (c) Projections from forelimb motor cortex after stroke with GDF10 delivery (red) and protein control (Cyto C) (red) taken from counts along the line in (a). * = P<0.05, **=P<0.01. Inset shows schematic mouse brain with the location of the BDA injection (black dot) and the linear quantification construct (line). In (c) and (f) box extends from the 25th to 75th percentiles and the line in the box is the mean. The whiskers show the minimum and maximum values. (d) Quantitative cortical mapping of GDF10 knockdown in stroke. Same conventions as in (a). (e) Polar plots of GDF10 siRNA and scrambled siRNA after stroke with same conventions as in (b). (f) Linear quantification of neuronal connections in treatment groups of GDF10 siRNA+Stroke and scrambled siRNA+Stroke. Same conventions as in (c)._In (c) F (1, 10) = 12.03; (f) F (1, 10) = 20.24. In (b) U2647.176, df 90939, df2 180911; (e) U2 78.616, df 38554, df2 5906. Error bars are SEM. The circle in (a) and (d) indicates the center of the stroke site.
GDF10 increases angiogenesis and gliosis after stroke
TGFβ family members stimulate astrocyte responses and modify angiogenesis and neuroinflammation30,31. To determine what tissue changes occur concomitantly to enhanced axonal outgrowth with GDF10, we analyzed markers for these processes following GDF10 delivery or knockdown in stroke at the time of increased axonal sprouting. As previously reported4, stroke alone produced increased levels of GFAP, CD31/PECAM and IBA-1, makers for astrocytes, endothelial cells and microglia/macrophages, respectively (Fig. 5). GDF10 significantly increased astrocytosis, as indicated by an increase in the area of GFAP+ processes, and in blood vessel area, as indicated by an increase in PECAM+ endothelial cell area, above that seen in stroke, with no significant effect on microglial staining (Fig. 5). GDF10 knockdown decreased vascular, astrocyte and microglial staining compared with stroke-alone. The delivery of control protein or scrambled siRNA had no effect on these processes. These data indicate that GDF10 delivery not only enhances axonal sprouting, but also induces vascular remodeling and astrocytosis. The GDF10 knockdown effect indicates that in the normal process of post-stroke tissue reorganization, GDF10 is partially responsible for post-stroke astrocyte, blood vessel and microglial changes.
Figure 5.
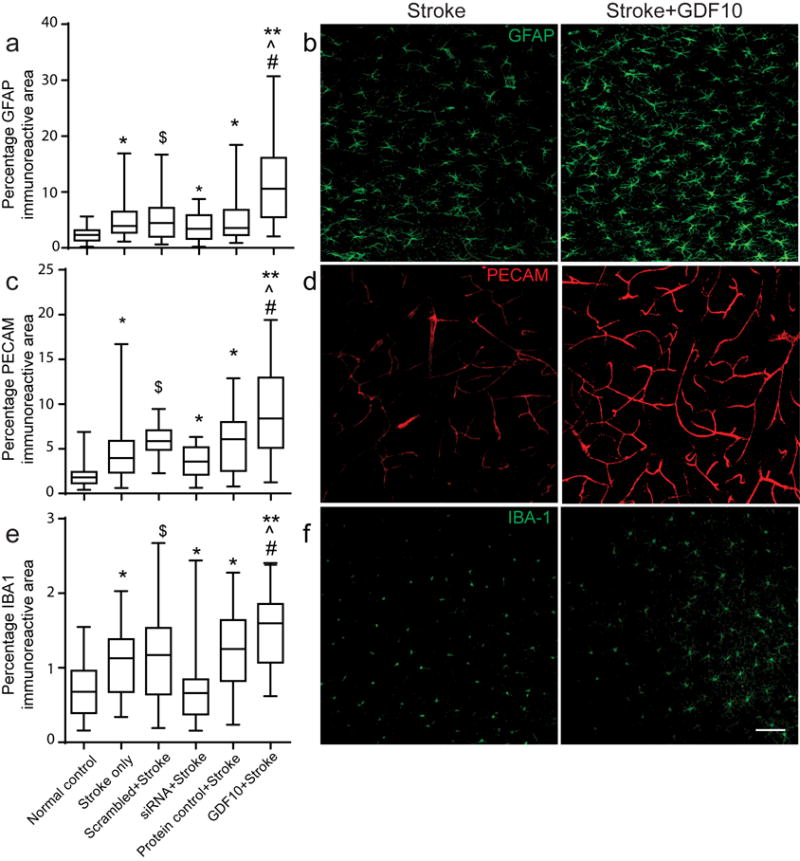
Astrocyte, endothelial and inflammatory responses in peri-infarct cortex with GDF10 after stroke. All data are 28 days after stroke. (a) GFAP immunoreactivity is increased in all stroke conditions compared to control (* = p< 0.05, ** = p<0.01 vs. control, ˆ, # = p< 0.05 vs. stroke only, stroke+protein control, respectively) and significantly decreased in GDF10 siRNA+stroke compared to the scrambled siRNA ($=p<0.05 vs scrambled siRNA+stroke). In (a,c,e) box extends from the 25th to 75th percentiles and the line in the box is the mean. The whiskers show the minimum and maximum values. (b) Photomicrographs of GFAP immunostaining in stroke and Stroke+GDF10. (c) PECAM/CD31 immunoreactivity for endothelial cells in control and gain and loss of function in GDF10 after stroke. Conventions as in (a). GDF10 induces an increase and GDF10 siRNA reduces a decrease in PECAM immunoreactive vessels in peri-infarct cortex after stroke. (d) PECAM staining in peri-infarct cortex in stroke and stroke+GDF10. (e,f) IBA-1 immunoreactivity for microglia/macrophages in peri-infarct cortex. Stroke increases the microglial staining in peri-infarct cortex. GDF10 knockdown significantly reduces ($ = p<0.05) the staining of microglia/macrophages compared to scrambled siRNA+stroke. ($ = p<0.05). However, there is a significant difference in IBA-1 immunoreactive signal between groups of GDF10+Stroke and cyto C+Stroke. Bar in (f)=50μm. See Supplementary Table 11 for sample size and ANOVA statistics.
GDF10 improves functional recovery after stroke
To determine if GDF10-induced axonal sprouting promotes functional recovery, we tested mice on forelimb motor tasks using the same forelimb motor cortex stroke in which axonal sprouting was measured. The grid walking, cylinder and pasta handing tasks measure gait, exploratory forelimb use and skilled control of thin pasta pieces4,29,32,33. GDF10 and GDF10 siRNA were delivered as in the axonal sprouting studies (Fig. 4).
Stroke produces impairments in forelimb motor control for an extended period: at least 11 weeks (pasta handling) or 15 weeks after stroke (cylinder, gridwalking) (Fig. 6). Delivery of GDF10 starting 1 week after stroke enhances recovery beginning from 3 weeks post-stroke (Fig. 6). With GDF10 delivery, mice performed at the level of non-stroke motor control by 5 weeks after the infarct. Remarkably, GDF10 siRNA produces a significant reduction in the normal process of recovery after stroke, beginning 1–3 weeks after delivery. No significant changes in motor performance were observed among animals treated with protein or siRNA delivery controls. Thus, administration of GDF10 protein improves motor recovery after stroke and knocking down GDF10 levels significantly decreases functional recovery. These behavioral data indicate that endogenous GDF10 has an important role in normal recovery after stroke and that the neuronal sprouting mapped in vivo may represent formation of neural circuits that cause behavioral improvement.
Figure 6.
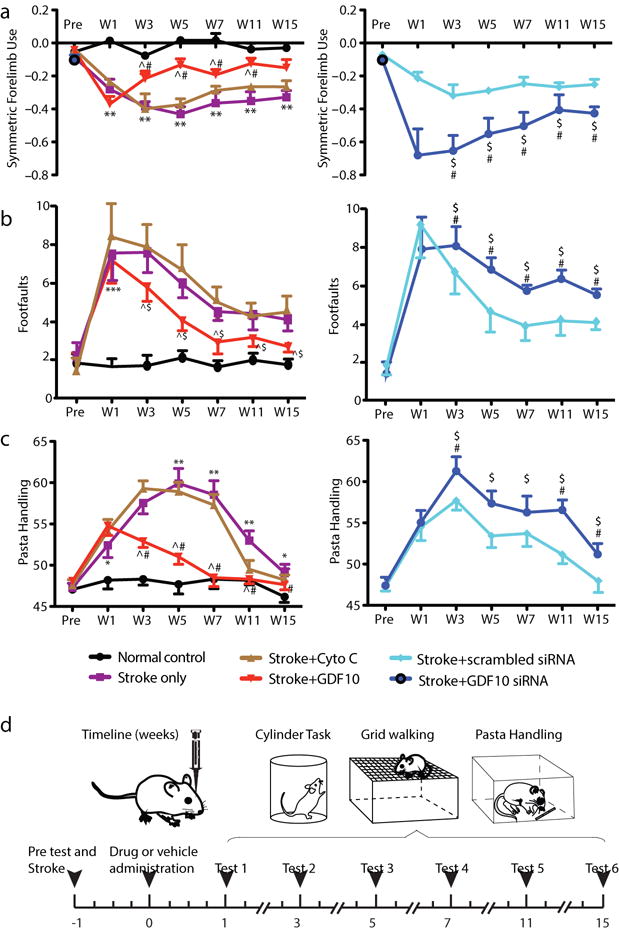
GDF10 improves behavioral recovery after stroke. (a) Cylinder test of forelimb symmetry in exploratory rearing (n=7 all conditions in behavioral testing). Y axis shows bilaterally symmetric rearing as 0.0 and percent of left (unaffected) forelimb rearing as negative values. Left graph: Stroke causes a significant increase in the number of rears with the left forelimb. GDF10 treatment produces a significant recovery compared to stroke+vehicle (# = P<0.05) and stroke+cyto C (ˆ = P<0.05). Right graph: Stroke+GDF10 siRNA impairs the normal recovery seen in stroke+vehicle (# = p<0.01) and in stroke+scrambled siRNA ($ = P<0.05). (b) Gridwalking test of forelimb function in gait. Y axis is the number of footfaults of the forelimb contralateral to the stroke (right forelimb). Left graph: Stroke+GDF10 produces a significant recovery in forelimb function compared to stroke+cyto C (ˆ = P<0.05). Right graph: Stroke+GDF10 siRNA reduces the normal process of motor recovery after stroke (** = P<0.01, compared with stroke+vehicle) and impairs the forelimb function compared with stroke+scrambled siRNA ($ = P<0.05). (c) Pasta handling task after stroke. Y axis is the Y axis is the percentage of handling time using right forepaw relative to both paws. Delivery of GDF10 results in a significant recovery in forepaw use compared to delivery of protein control cyto C (ˆ = P<0.05). Injection of GDF10 siRNA complex significantly reduces right forepaw function compared to injection of the scrambled siRNA ($ = p<0.05). In (a) F (1.958, 11.75) = 22.07; (b) F (1.869, 11.21) = 10.70; (c) F (2.101, 12.61) = 9.382. Error bars are SEM. Statistics are multiple comparisons ANOVA followed by Tukey-Kramer’s post hoc test
Systems biology of GDF10 in the CNS
To understand the molecular program induced by GDF10 during axonal sprouting and functional recovery after stroke, we FACS-isolated cortical neurons (based on NCAM) (Fig. 7a) from GDF10+stroke, stroke-alone, normal control and at age P4, a time in which cortical neurons are forming new connections during development34. The number of reads ranged from 64,602,785 to 107,291,640 and the uniquely mapped reads ranged from 43,087,682 to 85,407,243. The differentially expressed genes were analyzed after a cutoff for a false discovery rate (FDR) of <0.1.
Figure 7.
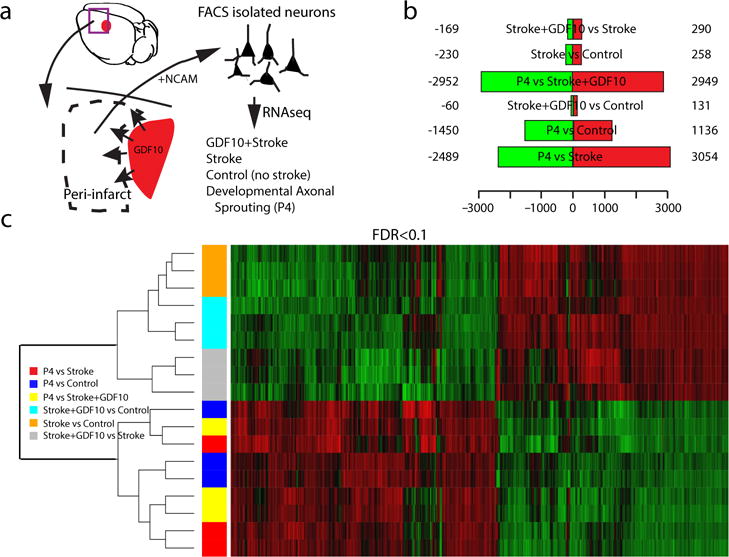
GDF stroke transcriptome. Genes differentially regulated at false discovery rate (FDR)<0.1 analyzed for relationship across stroke conditions, developmental state and molecular pathway. (a) Schematic of experimental approach of neuron isolation and deep sequencing (n=3 sample for each condition of 2 pooled brains per sample) (b). Differences in gene expression among conditions. Red is upregulated and green is downregulated greater than 1.2 fold. (c) Heat map and unsupervised clustering of transcriptomes. Green is downregulated and red is upregulated. Differentially expressed genes were identifed using the Bioconductor package EdgeR which are then considered and ranked based on adjusted p-values (FDR) of < 0.1. For hierarchical cluster analysis the distances between clusters were computed using the complete linkage clustering method (R hclust function).
The greatest difference in the transcriptomes among conditions is between adult cortical neurons, from control, stroke and stroke+GDF10, compared to the developmental age of P4 (Fig. 7b). This indicates that the biggest alteration in the neuronal transcriptome is between adult and developmental states, rather than with the presence of a stroke or with GDF10 delivery. Unsupervised cluster analysis of these transcriptomes confirms that the adult vs. neonatal gene expression changes cluster together (Fig. 7c). After this distinction, the most unique transcriptome is stroke+GDF10 vs. stroke. Thus, GDF10 delivery in stroke regulates a unique transcriptome that consists of a smaller set of genes from that seen during the initial process of axonal sprouting in neurodevelopment. An open question in the field of neural repair is if the molecular program stimulated by tissue regeneration resembles that seen in neurodevelopment, i.e. if “regeneration recapitulates development”. These results indicate that GDF10 delivery in stroke, which promotes axonal sprouting in the adult, regulates a dramatically different and smaller set of genes from that seen during the initial process of axonal sprouting in neurodevelopment and in the adult state, GDF10 induces a unique transcriptome after stroke.
Stroke+GDF10 significantly regulates specific canonical pathways in post-stroke neurons (Supplementary Table 2). Among the most highly regulated are Axonal Guidance, PTEN and PI3K signaling (Fig. 8a). PTEN canonical signaling (8 genes in class) is downregulated, and PI3K canonical signaling (12 genes in class) is upregulated with GDF10 in stroke (Supplementary Tables 3–6). Axonal guidance molecules that are differentially regulated by GDF10 in stroke include Ephrin A3, Tα1tubulin, Beta-II-tubulin, VEGFd, neuropilin 1, SOCS3 and downstream molecules in the Rho and Rac pathways (Supplementary Tables 7, 8). PTEN and SOCS3 inhibition induce axonal sprouting in multiple adult CNS systems, including optic nerve and spinal cord injury8,35. The differential control of PTEN, PI3K and SOCS3 signaling by GDF10 represents a potential mechanism of action in axonal sprouting after stroke.
Figure 8.
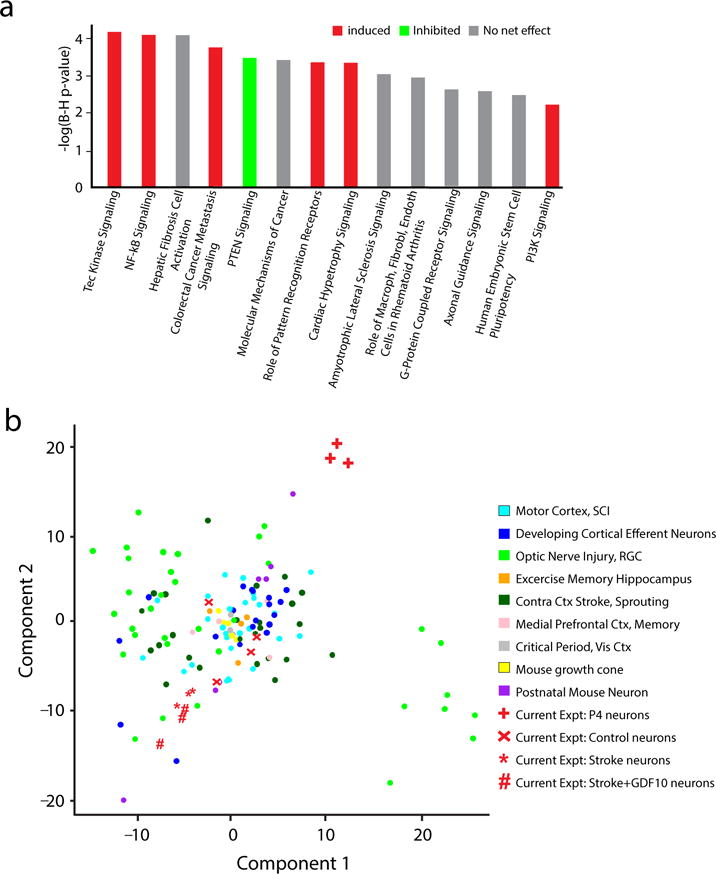
GDF10 canonical signaling pathways and genome-wide associations. (a) Top canonical pathways significantly regulated in Stroke+GDF10 vs Stroke. Y axis is inverse log of p value corrected for multiple comparisons in Benjamini-Hochberg (B–H) test. Significance is set to a B–H p<0.05 = -log(B–H p-value) of 1.3. Red is net upregulation of this genes in this pathway; green is net downregulation. Grey is mixed up or downregulation in pathway genes such that there is not net trend. (b) Genome wide associations of Stroke+GDF10 transcriptome to learning and memory, neurodevelopmental and CNS injury transcriptomes. Statistical testing was Fisher’s exact p value, Benjamini-Hochberg correction for multiple comparisons (a) and principle component analysis of 180 transcriptomes (Supplementary Figure 11).
Axonal sprouting after stroke shares similarities with the neuronal morphology changes in learning and memory paradigms, optic nerve and spinal cord regeneration and neurodevelopment36,37. We used unsupervised genome-wide association analysis to compare our data from GDF10 and stroke to transcriptomes from cortical neuronal outgrowth during development; the cortical critical period; mouse growth cones; P7 to P28 mouse neurons; motor cortex after spinal cord injury; retina after optic nerve crush; contralateral cortex after stroke; and learning and memory paradigms in hippocampus and medial prefrontal cortex (Supplementary Table 9). The data from 180 microarray or RNA-seq studies were analyzed from original array files, normalized, controlled for batch effect (Supplementary Fig. 11) and statistically compared to the present data sets for cortical neurons from stroke, stroke+GDF10, control and P4. There is a variance in statistical spread across transcriptomes, even from the same cell population in the same experiment (Fig. 8c), which likely has to do with the fact that these transcriptional profiles are mostly from specific cell types, rather than from large in vitro preparations or tissue-level sources. For example, in layer V/VI from motor cortex after spinal cord injury, transcriptomes from the same condition can vary across 30 units in statistical space; similar variance is seen with cortical efferent neurons, such as callosal neurons at P4 and in adult optic nerve injury. Within the variance in gene expression in these conditions of axonal sprouting, injury or learning and memory, stroke and stroke+GDF10 transcriptomes are separated by the largest difference from cortical P4 neurons, confirming the cluster analysis within this data set (Fig. 8c). Stroke and stroke+GDF10 transcriptomes cluster closely together with a relationship to retina 12 hours after optic nerve crush. Mouse growth cone, mouse cortical critical period and corticospinal and callosal postnatal neuronal transcriptomes cluster together but not near stroke+GDF10 or stroke-alone. These data indicate that GDF10 induces a unique transcriptional profile after stroke, more closely related to stroke alone than to the transcriptomes seen in several contexts of neuronal development, CNS injury or of learning and memory.
Discussion
Axonal sprouting in the adult occurs in a limited manner after stroke, optic nerve lesions, spinal cord injury and in models of neurodegenerative diseases8,9. After stroke, axonal sprouting has been demonstrated in mice, rats and non-human primates1–4,10,38. In humans, the initial cloning studies of GAP43, the paradigmatic neuronal growth cone marker, showed that it is induced in peri-infarct cortex after stroke39 and increases cortical thickness in regions of cortical map plasticity during recovery7. The induction of axonal sprouting in adult cortex after stroke and the formation of new patterns of connections suggests that neurons have been placed into a growth state. Much scientific study has focused on the molecular components of the injury response that block axonal sprouting, such as the glial growth inhibitors NogoA and the chondroitin sulfate proteoglycans8–10. However, there has been comparatively less research on the molecular signals for a neuronal growth program after stroke. The present data indicate that GDF10 is induced after stroke in a wide range of species, promotes axonal outgrowth in vitro in human, mouse and rat neurons, and induces axonal sprouting and functional recovery after stroke in vivo. Knockdown of endogenous GDF10 after stroke reduces axonal sprouting and recovery. GDF10 controls a unique transcriptional profile with differential regulation of PTEN, PI3K and axonal outgrowth molecules. These findings suggest that GDF10 is a post-stroke axonal sprouting signal that induces functional recovery.
Stroke normally produces a limited pattern of axonal sprouting from motor or somatosensory cortex posteriorly to areas adjacent to or caudal to the stroke2–4,28,29. GDF10 delivery induces a unique connectional pattern—substantial projections anterior from motor cortex to premotor and prefrontal areas. We localized these connections topographically using retrograde back-labeling of the corticospinal neurons to identify primary somatosensory, motor and premotor areas and with histological demonstration of the rodent whisker cortex for mouse primary somatosensory areas. This anterior projection from motor cortex to premotor cortex is causally associated with functional recovery in this model of stroke4. The magnitude of post-stroke axonal sprouting induced by GDF10 exceeds that seen with the blockade of several axonal growth inhibitory systems, such as ephrin-A54 and Nogo/NgR13. Further, knockdown of GDF10 after stroke abolishes the normal process of post-stroke axonal sprouting and reduces functional recovery. These results indicate that the normal release of stroke-induced GDF10 participates in the limited motor recovery that occurs naturally in stroke.
GDF10 signals through TGFβ receptors. In other in vitro systems, TGFβ promotes axonal outgrowth of injured neurons21,22,39,40 and blockade of TGFβRII alters neuronal polarity and leads to shorter axons42. However, activation of Smad2 signaling has also been reported to occur with myelin axonal growth inhibition, and direct activation of Smad2 reduces axonal outgrowth in some preparations22,24. These discrepant findings of both axonal sprouting and axonal growth inhibition with TGFβ may stem from non-canonical signaling or context-specific signaling. Though TGF and GDF10 both signal through TGFβRI/II12–14, we show that their signaling levels are not equivalent. These growth factors may produce non-canonical signaling outside of the Smad transcription factors, such as through the MAPK pathway40,41.
The action of TGFβRI/II signaling in axonal outgrowth may be context specific in terms of the local tissue environment and differ between local axonal sprouting in peri-infarct cortex and distant axonal sprouting from corticospinal neurons after spinal cord injury. We find that the transcriptomes for these two sprouting conditions are very different (Fig. 8b). Such context-specific signaling is a hallmark of TGFβ in its role in cancer, where it switches from inhibition of tumor growth and metastasis to promotion of endothelial to mesenchymal transition and metastasis as the local tumor environment evolves14,43.
GDF10 activates a coordinated upregulation of genes in the PI3kinase pathway, downregulation of genes in the PTEN pathway and control of specific axonal guidance molecules, including a downregulation of SOCS3. PTEN inhibition potentiates axonal sprouting in optic nerve injury and spinal cord injury, through induction of PI3kinase signaling and activation of mTOR. Inhibition of SOCS3 further promotes axonal sprouting on top of PTEN inhibition8,37,38. Detailed analysis of the GDF10 transcriptome in stroke will provide further insights into mechanisms for the GDF10 trigger for post-stroke axonal sprouting. In all, GDF10 represents a significant regulator of axonal outgrowth and functional recovery after stroke and may present a valuable target for therapeutic intervention. With such a therapy in mind, systemic delivery of TGFβ would activate its signaling systems in all tissue of the body. TGFβ promotes tissue fibrosis and has potential direct deleterious effects on kidney, liver and immune function14. A possible approach to a GDF10 or TGFβ therapeutic in stroke is either short term systemic delivery to minimize non-CNS effects or site-specific delivery, as achieved in the present approach with tissue bioengineering, to produce a GDF10 effect specifically in peri-infarct cortex.
ONLINE METHODS
Mouse model of stroke
Animal procedures were performed in accordance with the US National Institutes of Health Animal Protection Guidelines and the University of California Los Angeles Chancellor’s Animal Research Committee. Focal cortical strokes on adult C57BL/6 male mice weighing 20–25 g (2–4 months old, Charles River Laboratories) were produced by photothrombosis at surgery as previously described4,28,29. Mice were experimentally naive prior to studies. Briefly, under isoflurane anesthesia, mice were placed in a stereotactic apparatus with the skull exposed through a midline incision, cleared of connective tissue, and dried. A cold light source (KL1500 LCD; Carl Zeiss MicroImaging, Inc.) attached to a 40× objective, giving a 2-mm diameter illumination, was positioned 1.5 mm lateral from the bregma used to produce a 2-mm diameter focal stroke upon light illumination. Rose Bengal is administered (10g/l), with typically 0.2ml per 25g mouse. After 5 min, the brain was illuminated through the intact skull for 15 min. The mice were then sutured along the scalp, removed from the stereotactic frame (Model 900, David Kopf Instruments), and allowed to recover. Body temperature was maintained at 37.0 °C with a heating pad throughout the operation. Control animals received no stroke. Mice are housed in a 12:12 hour light:dark cycle at 4 mice per cage.
Non-human primate model of stroke
Non-human primate tissues are taken from a previously reported stroke neuroprotection study in which stroke animals did not receive study drug44 (control n = 3, stroke n = 2). Adult, male rhesus macaques (M. mulatta) were single-housed indoors in double cages on a 12:12-hour light/dark cycle, with lights-on from 07003to 1900 hours, and at a constant temperature of 24°C±2°C. Laboratory diet was provided bidaily (Lab Diet 5047, PMI Nutrition International, Richmond, IN, USA) and supplemented with fresh fruits and vegetables. Drinking water was provided ad libitum. The animal care program is compliant with federal and local regulations, regarding the care and use of research animals and is Association for Assessment and Accreditation of Laboratory Animal Care accredited. All experiments were approved by the Institutional Animal Care and Use Committee.
The right MCA (distal to the orbitofrontal branch) and both anterior cerebral arteries were exposed and occluded with vascular clips for 60 min. Animals were given ketamine (~10 mg per kg, intramuscular injection) and then intubated and maintained under general anesthesia using 0.8% to 1.3% isoflurane vaporized in 100% oxygen. A blood sample was taken and a venous line was placed for fluid replacement. An arterial line was established for blood pressure monitoring throughout the surgery and to maintain a mean arterial blood pressure of 60 to 80 mm Hg End-tidal CO2 and arterial blood gases were continuously monitored to titrate ventilation to achieve a goal CO2 pressure of 35 to 40 mm Hg. Postoperative analgesia consisted of intramuscular hydromorphone HCl and buprenorphine. Animals were euthanized 2 d after stroke and tissue fixed in formaldehyde.
Human stroke
The cases selected for examination in this study are a retrospective, convenience sample of autopsy cases from a clinicopathologic study of cognitively normal subjects, those with subcortical ischemic vascular dementia (SIVD) or Alzheimer’s disease (AD)45. Written informed consent for autopsy was obtained from all subjects or legal next-of-kin. From this larger database, cases selected for detailed microscopy included those with definable large artery infarcts determined by expert neuropathologic assessment of H&E stained sections. Sections from 7 of stroke and 4 control cases were evaluated (Supplementary Table 1).
Cultures of primary cortical neurons, iPS-NPCs and RGCs and Quantification of axonal outgrowth
Primary cortical neurons were prepared from postnatal day 4 CD1 mice (Charles River Laboratories)46. Briefly, mouse pups were euthanized, brains removed, and the cerebral cortex dissected, stripped of meninges, and dissociated by a combination of calcium and magnesium free HBSS containing 0.2% w/v papain suspension (Worthington Biochemical) digesting for 12 min at 37°C. The triturated cells were passed through a 70 μm strainer and counted. The cells were plated in laminin and poly-D-lysine-coated coverslips (cat. # 354086, BD Biosciences) at a density of 5×10⁴ cells per ml (in 24-well plates) in culture medium (NbActiv4, BrainBits). Experiments were carried out after 24 h of seeding. Primary neurons were incubated with drugs or vehicle in new medium for addition 48 h. For chondroitin sulfate proteoglycans (CSPG) studies, coverslips were coated with CSPG (25 μg/mL; cat. # CC117, Millipore) prior to cell plating. Human induced pluripotent stem cells (iPSCs) (Dr. William Lowry, University of California Los Angeles26,47) were plated on 12 mm polyornithine/laminin coated coverslips at 5×10⁴ per well (24-well plates) in NbActiv4 (BrainBits) containing 100 units/ml penicillin, 100 μg/ml streptomycin, fibroblast growth factor 2 (FGF2) (20 ηg/μl) and epidermal growth factor (EGF) (20 ηg/μl) (Invitrogen). iPSCs were cultured for 7 days with every other daily media change. For neural differentiation, media was supplemented with brain-derived neurotrophic factor (BDNF) (20 ng/μl) and (neurotrophin 3) NT3 (20 ηg/μl) (R&D Systems) and changed every other day for 21 days27. Experiments were carried out on day 22. This iPS line has been extensively characterized. Expression profiles were compared with NPCs derived under standard conditions from hESCs and hiPSCs grown on murine feeder cells. Clustering and Pearson analysis49 demonstrate that this iPS-NPCs is highly similar to other iPS-NPCs and ES-NPCS derived under standard conditions (Pearson: 0.926–0.959) and by immunostaining are relatively homogenous49. With simple growth factor withdrawal for three weeks, most of these iPS-NPCs develop into neurons expressing Tuj1 or MAP250. BDNF and NT3 treatment were used to promote further neuronal differentiation27. This approach generates neurons with markers of maturity by transcript profiling, immunohistochemical staining and action potential generation (Fig. 1, ref 27).
TβRI antagonist SB431542 (Sigma), TβRII siRNA and GDF10 siRNA were applied to cultures during GDF10 incubation for 2 days before fixation and axonal staining. TβRII, Smad2, Smad3 and GDF10 siRNA protein knockdown was evaluated with Western blotting (Supplementary Fig. 3c,d). Axons of primary cortical neurons and iPS-NPCs were stained with anti-SMI-312 monoclonal antibody51. 16 images were taken from each coverslips at 40× objective lens using unbiased sampling (Stereoinvestigator, MBF Biosciences). At least 2 coverslips and 32 images for each condition were analyzed. Axonal length was quantified (NeuriteTracer). Total axonal length per image was calculated for each treatment and normalized for total neuronal cell number in each culture plate (stained for NeuN). Rat RGCs cultures were prepared from dissociated retinas of mature Fisher rats18. In brief, rats were anesthetized with a mixture of Ketamine-Xylazine, the superior colliculi were exposed bilaterally, and retinal ganglion cells (RGCs) were retrogradely labeled by injecting Fluorogold (FG, Fluorochrome) into the superior colliculi. After allowing 7 days for retrograde transport of the dye to RGCs, rats were terminally anesthetized and retinas were rapidly dissected, enzymatically dissociated with gentle trituration, and, the dissociated retinal after removing larger tissue fragments, cells were cultured in defined, serum-free medium for 3 days. All conditions were tested in quadruplicate, in two separate experiments. Results were quantified as the percentage of FG-labeled cells, i.e., RGCs, extending an axon ≥ 2 cell diameter (approx. 30 μm) averaged across the 4 wells in each experiment and the two experiments. The observer was blinded to the treatment conditions in each well of the culture plate.
Pharmacological blockade of TGF-β in-vivo
Animals received photothrombotic stroke and were treated with two different TGFβ antagonists, SB431542 (R&D Systems) and Losartan (Sigma) at 10mg/kg and 100mg/kg based on published I.P. dosages19,20. Each animal (n=3 per group) received daily IP injections for 5 treatment days after stroke. Brains were post-fixed for 4 hours in 4% paraformaldehyde, cryosectioned at 40μm, and immunostained with pSmad2/3 (1:200; Cell Signaling 8828S). 100× photomicrographs were taken in 4 peri-infarct fields per section, and 2 sections per animal were analyzed. Image analysis to quantify pSmad puncta of 0.45 μm was performed by Imaris Imaging Ver 8.1.2 (Bitplane, Inc).
GDF10 protein, GDF10 siRNA administration and BDA injection
GDF10 protein was delivered from the stroke cavity with a hyaluronan plus heparin sulfate hydrogel (Extracel-HP, Glycosan BioSystems) injected 7 d after stroke (A-P, 0.0 mm; M-L, 1.5 mm; D-V, 1.0 mm). This biopolymer hydrogel releases both small and large molecules over a 3 week period from the infarct core3,4,29. Six microliters of hydrogel impregnated with recombinant GDF10 (1.33 mg/ml, n = 8) (cat. no. 1543-BP-025/CF, R&D Systems), or protein control cytochrome C (Cyto C) (1.33 mg/ml, n = 8) (C2506-50MG, Sigma) was implanted into the stroke core. Three GDF10 siRNA duplex (cat. nos. MSS236596, MSS236597, MSS236598; Invitrogen) and negative control samples (12935-200, Invitrogen) were used to determine protein knockdown in vitro using day 4 postnatal mouse cortical primary neurons. The combination of MSS236597 and MSS236598 siRNA produced the greatest knockdown in GDF10 protein expression (Supplementary Fig. 3c). This GDF10 siRNA (n = 8) or scrambled control siRNA (n = 8) duplex with RNAiMAX (cat. no. 13778-075, Invitrogen) (6 μl) was introduced at 150 nM directly into the stroke cavity (A/P, 0.0 mm; M/L, 1.5 mm; D/V, 1.0 mm) 7 d after stroke. At day 21 after stroke or 14 d after GDF10 protein, GDF10 siRNA or Cyto C injection, each mouse received an injection of 300 nl of 10% BDA (Sigma) into the forelimb motor cortex (A/P, 1.5 mm; M/L, 1.75 mm; D/V, 0.75 mm)4. At 28 d after stroke, mice were perfused with paraformaldehyde and the cortex removed, flattened and sliced to 40 μm tangentially3,4,28,29.
Quantitative cortical mapping of axonal sprouting
Axonal sprouting was quantified by digitally marking each BDA positive process in the cortex with a digitizing microscope system (Leica Microsystems, Ludl Electronic Products) and analysis program (Stereoinvestigator, MBF Biosciences). A BDA-labeled process was plotted irrespective of its cellular position as an axon shaft, pre-terminal or terminal axon field. This allowed each tangential map of axonal connections to contain an unbiased picture of the entire projection zone and trajectory of projections from forelimb motor cortex in each case. BDA-positive processes were marked in x,y coordinates relative to the center of the injection site by an observer blind to the treatment conditions. This process generates an x,y plot of the location of all labeled axons in each brain section. The x,y axonal plots of each brain from each experimental group were registered to the injection site and co- registered with functionally relevant anatomical regions, produced by the staining of the mouse somatosensory body map in cytochrome oxidase and the retrograde labeling of the corticospinal neurons (Supplementary Fig. 6a) to generate a composite axonal map for each treatment condition. Custom software3,4 produces quantitative connectional maps that consist of pixels, with the number of axons in each pixel mapped in register with anatomical brain structures. Polar plots were constructed with the x,y position of each BDA-labeled element plotted in relation to the tracer injection in forelimb motor cortex as the origin. This polar mapping shows both location and direction of axonal label. Surface maps and polar maps analyzed for statistically significant differences in connectional profiles between treatment groups (see below). In a separate quantification method, the number of axons within the ipso-hemisphere was counted a linear construct from the center of the injection site through the ipsilateral cortical hemisphere.
Stroke infarct volume was calculated by multiplying lesion area by the thickness of each section plus the distance between sections and then added with these measurements from each section through the tangential flattened cortical tissue. BDA injection volume was measured by calculating the average injection core volume for each treatment group. The average BDA injection area in each section, determined by outlining the limit of extracellular tracer deposition, was multiplied by the sum of the thickness of the section and then summed for all sections in the series. Anterior–posterior and medial–lateral BDA injection location was analyzed by measuring the distance from the center of the injection site to the rostral edge of the tissue and the midline of the cortex, respectively. The size and location of each BDA injection and stroke size did not vary significantly across individuals or by treatment condition (Supplementary Fig. 7).
Immunohistochemistry
Fluorescence immunohistochemistry with floating frozen sections was performed as described3,4. Primary antibodies are given in Supplementary Table 10. In all experiments, no-primary and no-secondary antibody controls were run in parallel. There was no specific staining with these controls. For the quantification of GFAP, PECAM and IBA1 immunoreactive areas, 3 fields (650μm × 450μm) within peri-infarct cortex were precisely taken from 3 independent tangential sections of each animal using a 20× objective with confocal microscopy (Nikon C2). The parameters for scanning were kept constant across treatment conditions. Single images were analyzed using ImageJ macro and batch processing (NIH). Average percentage of the fluorescent staining area per image was calculated for each condition. Paraffin-embedded non-human primate and human brain sections (5μm thickness) were de-paraffinized and then stained52 as with mouse tissue sections. All peri-infarct GDF10 photomicrographs (Supplementary Fig. 2a–e) were acquired at constant confocal parameters (60×, 0.3μm step size). For synapse colocalization studies, 100× confocal stacks were acquired through 10μm of tissue. 3D analysis on Imaris Imaging software (Bitplane, Version 8.1.1) was performed by: 1) creating a surface for BDA positive neurons 2) colocalizing presynaptic VGLUT2 within BDA surface 3) excluding postsynaptic Homer1 in BDA positive cells and 4) colocalizing presynaptic and postsynaptic datasets to <0.80μm.
Behavioral Assessment
Mice (7 per group) were tested once on the grid-walking, cylinder and pasta eating tasks 1 week before surgery to establish baseline performance levels. Animals were tested during the first three hours of their dark cycle. Tests were done at week 1, 3, 5, 7, 11 and 15 after stroke. Treatments were administered as for the axonal sprouting studies: GDF10+stroke, Protein control (Cyto C)+stroke, GDF10 siRNA+stroke and Stroke-only. Assessment on the grid-walking, cylinder and pasta eating tasks were performed as previously described4,29,3,33. Behaviors were scored by observers who were masked to the treatment group of the animals.
FACS
Male C57BL/6 mice age 4 months were anesthetized with isoflurane, decapitated, and cortical tissue removed from underlying white matter. Peri-infarct cortex (for stroke groups) or homologous sensorimotor cortex (for non-stroke groups) was dissected using a double tissue punch method: a ring of cortical tissue 750 μm wide was isolated between two concentric circular tissue punches (3.0 mm and 1.5 mm in diameter) to exclude necrotic stroke core. P4 sensorimotor cortex was isolated using only one 1.5mm tissue punch. Cortical tissue was enzymatically digested and triturated based on a published protocol46. Briefly, cortical tissue was equilibrated for 8 min and digested for 30 min at 30°C and 190 rpm in 6 mL papain solution (12 mg per ml). Complete Hibernate buffer (Brainbits) was used to maintain neural metabolites and pH during tissue dissection and digestion. Glutamate antagonists kynurenic acid and AP5 were added to minimize excitotoxicity53. Tissue was triturated into 6 mL suspension and loaded onto density gradient column (4 ml of 12.4% OptiPrep in Hibernate), and centrifuged for 15 min at 900 g at 22°C. The bottom 5 ml was collected and washed 2× at 400 g for 5 min before antibody staining. Two cortices were pooled for each of the 12 FACS samples. 6 animals per group (stroke alone, stroke + 7 d GDF10, Adult WT, P4 WT) were coupled into 3 samples each for a total of 12 samples across the 4 experimental groups for FACS analysis.
Prior to flow cytometry, all cell suspensions were stained for neuronal marker NCAM (Mouse; NCAM-1/CD56 Allophycocyanin MAb, 10uL antibody per 106 cells, FAB7820A R&D Systems) for 20 minutes at 25 °C, and washed twice with HABG. Samples were maintained on ice during FACS isolation. APC sort gates were set using positive and negative controls prior to neuron sorting. Neurons were collected via FACS (FACsARIA, Becton Dickinson, UCLA FACS Core) directly into 400 μl lysis buffer for RNA isolation. Total RNA was extracted using RNA-Microprep kit (Zymo-Research) and eluted into 7 μl ddH2O. RNA quality was verified (RIN>7) on an Agilent Bioanalyzer.
Spinal Cord Injections
Layer V corticospinal motor neurons were labeled by stereotaxic injection of cholera toxin B subunit (CTB), a retrograde neuronal tracer, into the cervical enlargement at C5 of 5 month-old CD1 mice. Surgeries were performed on a stereotaxic apparatus (David Kopf) interfaced with a microinfusion syringe pump (Harvard Instruments). Animals were anesthetized with general isoflurane in oxygen-enriched air. Single vertebra laminectomy at C5 revealed the cord, and 500 nL of CTB tracer (6.67 μg per μl, List Biological Labs) was injected into the right dorsal corticospinal tract (dCST)54. CTB infusion progressed at 0.2 mL per min through a glass micropipette connected by special adapters and high pressure tubing to a 10 mL Hamilton syringe. All animals were given analgesic prior to suture wound closure. Ten days after tracer delivery, animals were anesthetized with pentobartital and transcardially perfused with 4% PFA. Brain and spinal cord were isolated and prepared via tangential and coronal cryosectioning, respectively. Tissue preparation and stereological cortical mapping were performed as previously described4. Cervical cord was cryosectioned at 40μm and for dCST injection site verification by CTB immunofluorescence (Goat anti-CTB 1:10,000, List Biological Labs).
RNA-seq and Bioinformatics of other neuronal transcriptomes
Total RNA from FACS-isolated cells from each condition (n = 6) was pooled in 2 brains per sample. Total RNA was amplified and converted into double-stranded DNA, which after fragmentation is typically between 200 and 300 bp (Ovation RNA-seq System v2, Nugen, San Carlos, CA) that was further processed with the Ovation UltraLow kit (Nugen). RNA libraries were prepared using a NuGen Ovation Ultra Low Mass kit for paired-end 2 × 69 RNA-sequencing (HiSeq2000, UCLA ICNN core). After library preparation (Encore NGS Library System I, Nugen) amplified double-stranded cDNA was fragmented into 300 bp (Covaris-S2, Woburn, MA). DNA fragments (200 ng) were end-repaired to generate blunt ends with 5′- phosphates and 3′- hydroxyls and adapters ligated. The purified cDNA library products were evaluated using the Agilent Bioanalyzer (Santa Rosa, CA) and diluted to 10 nm for cluster generation in situ on the HiSeq paired-end flow cell using the CBot automated cluster generation system. Three samples at a time, all samples were multiplexed into single pools and run in 9 lanes total of Paired-End 2 × 100 bp flow cells in HiSeq 2000 (Illumina, San Diego, CA).
Six Libraries for RNA-seq were prepared using the NuGEN Ovation UltraLow library preparation protocol (NuGEN Technologies, Inc.) and sequenced using an Illumina HiSeq 2500 sequencer across 10 lanes of 100bp-paired-end sequencing, corresponding to 3 samples per HiSeq 2500 lane. After demultiplexing, we obtained between 50 and 79 million reads per sample. Quality control was performed on base qualities and nucleotide composition of sequences. Alignment to the M. musculus (mm10) refSeq (refFlat) reference gene annotation was performed using the STAR spliced read aligner55 with default parameters. Additional QC was performed after the alignment to examine: the level of mismatch rate, mapping rate to the whole genome, repeats, chromosomes, key transcriptomic regions (exons, introns, UTRs, genes), insert sizes, AT/GC dropout, transcript coverage and GC bias. One control sample failed QC and was excluded from analysis. Between 67 and 85% of the reads mapped uniquely to the mouse genome. Total counts of read-fragments aligned to candidate gene regions were derived using HTSeq program (www.huber.embl.de/users/anders/HTSeq/doc/overview.html) and used as a basis for the quantification of gene expression. Only uniquely mapped reads were used for subsequent analyses. Across the samples >25% of the annotated genes have been detected by at least 50 reads. Following alignment and read quantification, we performed quality control using a variety of indices, including sample clustering, consistency of replicates, and average gene coverage.
Differential expression analysis was performed using the EdgeR Bioconductor package56, and differentially expressed genes were selected based on False Discovery Rate (FDR Benjamini Hochberg-adjusted p values) estimated at < 0.1 (or 10% FDR). Three samples from stroke, stroke+GDF10, P4 and 2 samples from control were compared. Clustering and overlap analyses were performed using Bioconductor packages within the statistical environment R (www.r-project.org/).
Genes that were differentially expressed false discovery rate (FDR) < 10% were submitted to Cluster 3.0 for hierarchical clustering analysis (Euclidian distance, centroid linkage clustering) and visualized using Java TreeView. Differentially expressed genes were further analyzed by molecular pathway analysis and canonical signaling systems (IPA, Redwood City, CA). Briefly, for IPA analyses the genes regulated in each specific category, filtered to only include genes ≤10% FDR, where compared to all genes known to be involved in a given molecular pathway or canonical signaling system in a large curated database of molecular interactions. Fisher’s exact p value was calculated by IPA to determine a statistically different relationship of a data set in the control, stroke+/−GDF10, and P4 cortical transcriptomes to chance representation of these genes. For the upstream analysis there are 4 values that go into the Fisher’s exact p-value calculation with Benjamini Hochberg correction for multiple comparisons.
For genome-wide association testing, individual data from cell, SRA or Excel files was obtained for each experiment (Supplementary Table 9). The gene symbol was located for each probe and average expression computed for duplicated genes. The data were combined with RNA-seq data from this study and variance stabilization transformation normalization was applied.
Statistical analysis
Animal number in in vivo quantitative cortical mapping studies utilizes spatial correlation statistics, so sample size was estimated from previous publications with similar mechanistic studies3,4,28,29. Sample size in in behavioral studies was assessed by power analysis using a significance level of α=0.05 with 80% power to detect differences in ANOVA. This experimental design has been validated by other groups conducting similar behavioral4 or tissue outcomes experiments3,4,28,29. No animals were excluded from analyses. Mice were randomly allocated to treatment condition and all results were analyzed with the investigator blinded to treatment condition.
For quantitative connectional maps, three statistical analysis paradigms were used. First, scatter plots were analyzed using Hotelling’s T2 test for spatial correlation. For data with a common covariance matrix, such as the map of axonal position in tangential cortical sections, Hotelling’s T2 method tests the hypothesis of multivariate mean equality: that the means for the set outcome variable (axonal location for each individual, averaged by experimental condition) are equivalent across groups. The T statistic is the analog of Student’s two-group t-statistic for testing equality of group means for a single outcome variable. P-values were computed without Gaussian assumptions by means of a bootstrap 250 μm was applied around the injection site to account for the uniformity of the injection site itself and immediately adjacent BDA labeling across groups, regardless of sprouting pattern. Second, polar statistics tested for differences in distribution of axonal projection patterns across treatment groups. For each treatment condition, the x, y coordinate of every BDA-positive process was converted to an equivalent polar coordinate (r,) relative to the injection site as center3,4. The location of each process was transferred to common polar space and a mean projection vector was computed for each treatment group. Differences in mean projection vectors between groups were analyzed using Watson’s nonparametric two-sample U2 test3,4. Third, axon numbers in the linear construct across ipsilateral cortex were analyzed using one-way analysis of variance (ANOVA) with post hoc Tukey-Kramer test. In addition, differences between two means were assessed by unpaired two-tailed Student’s t test. Differences among multiple means were assessed by one-way ANOVA followed by Tukey-Kramer’s post hoc tests. Data from behavioral experiments were analyzed by two-way repeated-measures ANOVA followed by Tukey-Kramer’s post hoc test. All statistical analyses were performed with GraphPad Prism version 6 (GraphPad Software) or StatPlus version 5 (AnalystSoft) except those specifically noted above. Data are shown as mean ± standard error of the mean.
Supplementary Material
Acknowledgments
This research was supported by US National Institutes of Health grants NS085019 and NS086431, American Heart Association grant 09SDG2310180, Richard Merkin Foundation for Neural Repair at UCLA, the Dr. Miriam and Sheldon G. Adelson Medical Research Foundation and the Edwin W. and Catherine Davis Foundation. We thank Dr. William Lowry (UCLA) for human iPS-neural precursor cells and the NINDS Informatics Center for Neurogenetics and Neurogenomics (P30 NS062691) at UCLA for deep sequencing, alignment and RNA-seq analysis.
Footnotes
AUTHOR CONTRIBUTIONS
S.T.C, S.L. and E.H.N conceived the project. S.T.C., S.L., and E.H.N designed the experiments. S.L. performed most of the experiments. E.H.N. performed immunohistochemical characterization of GDF10 expression, FACS, RNA isolation, synapse analyses, and in vivo TGFβ blockade experiments. Y.Y. and L.I.B. performed rat neuronal experiments. S.T. and H.V.V. performed human tissue preparation. FRB and M.P.S-P. performed primate stroke experiments. R.K. and C.G. performed RNA-seq and bioinformatics experiments. S.T.C., E.H.N. and S.L. wrote the manuscript.
COMPETING FINANCIAL INTERESTS
The authors declare no competing financial interests.
References
- 1.Dancause N, Barbay S, Frost SB, Plautz EJ, Chen D, Zoubina EV, Stowe AM, Nudo RJ. Extensive cortical rewiring after brain injury. J Neurosci. 2005 Nov 2;25(44):10167–79. doi: 10.1523/JNEUROSCI.3256-05.2005. [DOI] [PMC free article] [PubMed] [Google Scholar]
- 2.Brown CE, Aminoltejari K, Erb H, Winship IR, Murphy TH. In vivo voltage-sensitive dye imaging in adult mice reveals that somatosensory maps lost to stroke are replaced over weeks by new structural and functional circuits with prolonged modes of activation within both the peri-infarct zone and distant sites. J Neurosci. 2009;29:1719–34. doi: 10.1523/JNEUROSCI.4249-08.2009. [DOI] [PMC free article] [PubMed] [Google Scholar]
- 3.Li S, Overman JJ, Katsman D, Kozlov SV, Donnelly CJ, Twiss JL, et al. An age-related sprouting transcriptome provides molecular control of axonal sprouting after stroke. Nat Neurosci. 2010;13:1496–504. doi: 10.1038/nn.2674. [DOI] [PMC free article] [PubMed] [Google Scholar]
- 4.Overman JJ, Clarkson AN, Wanner IB, Overman WT, Eckstein I, Maguire JL, et al. A role for ephrin-A5 in axonal sprouting, recovery, and activity-dependent plast icity after stroke. Proc Natl Acad Sci U S A. 2012;33:1–22. doi: 10.1073/pnas.1204386109. [DOI] [PMC free article] [PubMed] [Google Scholar]
- 5.Favre I, Zeffiro TA, Detante O, Krainik A, Hommel M, Jaillard A. Upper limb recovery after stroke is associated with ipsilesional primary motor cortical activity: a meta-analysis. Stroke. 2014;45:1077–83. doi: 10.1161/STROKEAHA.113.003168. [DOI] [PubMed] [Google Scholar]
- 6.Kantak SS, Stinear JW, Buch ER, Cohen LG. Rewiring the brain: potential role of the premotor cortex in motor control, learning, and recovery of function following brain injury. Neurorehabil Neural Repair. 2012;6:282–92. doi: 10.1177/1545968311420845. [DOI] [PMC free article] [PubMed] [Google Scholar]
- 7.Schaechter JD, Moore CI, Connell BD, Rosen BR, Dijkhuizen RM. Structural and functional plasticity in the somatosensory cortex of chronic stroke patients. Brain. 2006;129:2722–33. doi: 10.1093/brain/awl214. [DOI] [PubMed] [Google Scholar]
- 8.Liu K, Tedeschi A, Park KK, He Z. Neuronal intrinsic mechanisms of axon regeneration. Annu Rev Neurosci. 2011;34:131–52. doi: 10.1146/annurev-neuro-061010-113723. [DOI] [PubMed] [Google Scholar]
- 9.Soleman S, Filippov MA, Dityatev A, Fawcett JW. Targeting the neural extracellular matrix in neurological disorders. Neuroscience. 2013;253:194–213. doi: 10.1016/j.neuroscience.2013.08.050. [DOI] [PubMed] [Google Scholar]
- 10.Wahl AS, Omlor W, Rubio JC, Chen JL, Zheng H, Schroter A, et al. Neuronal repair. Asynchronous therapy restores motor control by rewiring of the rat corticospinal tract after stroke. Science. 2014;344:1250–5. doi: 10.1126/science.1253050. [DOI] [PubMed] [Google Scholar]
- 11.Cunningham NS, Jenkins NA, Gilbert DJ, Copeland NG, Reddi AH, Lee SJ. Growth/differentiation factor-10: a new member of the transforming growth factor-beta superfamily related to bone morphogenetic protein-3. Growth Factors. 1995;12:99–109. doi: 10.3109/08977199509028956. [DOI] [PubMed] [Google Scholar]
- 12.Katoh Y, Katoh M. Comparative integromics on BMP/GDF family. Int J Mol Med. 2006;17:951–5. [PubMed] [Google Scholar]
- 13.Carreira AC, Lojudice FH, Halcsik E, Navarro RD, Sogayar MC, Granjeiro JM. Bone morphogenetic proteins: facts, challenges, and future perspectives. J Dent Res. 2014;93:335–45. doi: 10.1177/0022034513518561. [DOI] [PubMed] [Google Scholar]
- 14.Akhurst RJ, Hata A. Targeting the TGFβ signalling pathway in disease. Nat Rev Drug Discov. 2012;11:790–811. doi: 10.1038/nrd3810. [DOI] [PMC free article] [PubMed] [Google Scholar]
- 15.Upadhyay G, Yin Y, Yuan H, Li X, Derynck R, Glazer RI. Stem cell antigen-1 enhances tumorigenicity by disruption of growth differentiation factor-10 (GDF10)-dependent TGF-beta signaling. Proc Natl Acad Sci U S A. 2011;108:7820–5. doi: 10.1073/pnas.1103441108. [DOI] [PMC free article] [PubMed] [Google Scholar]
- 16.Soderstrom S, Ebendal T. Localized expression of BMP and GDF mRNA in the rodent brain. J Neurosci Res. 1999;56:482–92. doi: 10.1002/(SICI)1097-4547(19990601)56:5<482::AID-JNR4>3.0.CO;2-V. [DOI] [PubMed] [Google Scholar]
- 17.Zhao R, Lawler AM, Lee SJ. Characterization of GDF-10 expression patterns and null mice. Dev Biol. 1999;212:68–79. doi: 10.1006/dbio.1999.9326. [DOI] [PubMed] [Google Scholar]
- 18.Yin Y, Cui Q, Li Y, Irwin N, Fischer D, Harvey AR, et al. Macrophage-derived factors stimulate optic nerve regeneration. J Neurosci. 2003;23:2284–93. doi: 10.1523/JNEUROSCI.23-06-02284.2003. [DOI] [PMC free article] [PubMed] [Google Scholar]
- 19.Bar-Klein G, Cacheaux LP, Kamintsky L, Prager O, Weissberg I, Schoknecht K, Cheng P, et al. Losartan prevents acquired epilepsy via TGF-b signaling suppression. Ann Neuol. 2014;75:864–875. doi: 10.1002/ana.24147. [DOI] [PMC free article] [PubMed] [Google Scholar]
- 20.Waghabi MC, de Souza EM, de Oliveira GM, Keramidas M, Feige J-J, Arau′jo-Jorge TC, Bailly S. Pharmacological inhibition of Transforming Growth Factor β signaling decreases infection and prevents heart damage in acute Chagas’ Disease. Antimicrobial Agents Chemo. 2009;53:4694–4701. doi: 10.1128/AAC.00580-09. [DOI] [PMC free article] [PubMed] [Google Scholar]
- 21.Ishihara A, Saito H, Abe K. Transforming growth factor-beta 1 and -beta 2 promote neurite sprouting and elongation of cultured rat hippocampal neurons. Brain Res. 1994;639:21–5. doi: 10.1016/0006-8993(94)91759-0. [DOI] [PubMed] [Google Scholar]
- 22.Knöferle J, Ramljak S, Koch JC, Tönges L, Asif AR, Michel U, Wouters FS, Heermann S, Krieglstein K, Zerr I, Bähr M, Lingor P. TGF-beta 1 enhances neurite outgrowth via regulation of proteasome function and EFABP. Neurobiol Dis. 2010 Jun;38(3):395–404. doi: 10.1016/j.nbd.2010.02.011. [DOI] [PubMed] [Google Scholar]
- 23.Hannila SS, Siddiq MM, Carmel JB, Hou J, Chaudhry N, Bradley PM, et al. Secretory leukocyte protease inhibitor reverses inhibition by CNS myelin, promotes regeneration in the optic nerve, and suppresses expression of the transforming growth factor-beta signaling protein Smad2. J Neurosci. 2013;33:5138–51. doi: 10.1523/JNEUROSCI.5321-12.2013. [DOI] [PMC free article] [PubMed] [Google Scholar]
- 24.Stegmuller J, Huynh MA, Yuan Z, Konishi Y, Bonni A. TGFbeta-Smad2 signaling regulates the Cdh1-APC/SnoN pathway of axonal morphogenesis. J Neurosci. 2008;28:1961–9. doi: 10.1523/JNEUROSCI.3061-07.2008. [DOI] [PMC free article] [PubMed] [Google Scholar]
- 25.Vallier L, Pedersen RA. Human embryonic stem cells: an in vitro model to study mechanisms controlling pluripotency in early mammalian development. Stem Cell Rev. 2005;1:119–30. doi: 10.1385/SCR:1:2:119. [DOI] [PubMed] [Google Scholar]
- 26.Chin MH, Pellegrini M, Plath K, Lowry WE. Molecular analyses of human induced pluripotent stem cells and embryonic stem cells. Cell Stem Cell. 2010 Aug 6;7(2):263–9. doi: 10.1016/j.stem.2010.06.019. [DOI] [PMC free article] [PubMed] [Google Scholar]
- 27.Pasca SP, Portmann T, Voineagu I, Yazawa M, Shcheglovitov A, Pasca AM, et al. Using iPSC-derived neurons to uncover cellular phenotypes associated with Timothy syndrome. Nat Med. 2011;17:1657–62. doi: 10.1038/nm.2576. [DOI] [PMC free article] [PubMed] [Google Scholar]
- 28.Clarkson AN, Lopez-Valdes HE, Overman JJ, Charles AC, Brennan KC, Thomas Carmichael S. Multimodal examination of structural and functional remapping in the mouse photothrombotic stroke model. J Cereb Blood Flow Metab. 2013;33:716–23. doi: 10.1038/jcbfm.2013.7. [DOI] [PMC free article] [PubMed] [Google Scholar]
- 29.Clarkson AN, Overman JJ, Zhong S, Mueller R, Lynch G, Carmichael ST. AMPA receptor-induced local brain-derived neurotrophic factor signaling mediates motor recovery after stroke. J Neurosci. 2011;31:3766–75. doi: 10.1523/JNEUROSCI.5780-10.2011. [DOI] [PMC free article] [PubMed] [Google Scholar]
- 30.Smith GM, Strunz C. Growth factor and cytokine regulation of chondroitin sulfate proteoglycans by astrocytes. Glia. 2005;52:209–18. doi: 10.1002/glia.20236. [DOI] [PubMed] [Google Scholar]
- 31.Wang J, Wang Y, Wang Y, Ma Y, Lan Y, Yang X. Transforming growth factor β-regulated microRNA-29a promotes angiogenesis through targeting the phosphatase and tensin homolog in endothelium. J Biol Chem. 2013 Apr 12;288(15):10418–26. doi: 10.1074/jbc.M112.444463. [DOI] [PMC free article] [PubMed] [Google Scholar]
- 32.Tennant KA, Asay AL, Allred RP, Ozburn AR, Kleim JA, Jones TA. The vermicelli and capellini handling tests: simple quantitative measures of dexterous forepaw function in rats and mice. J Vis Exp. 2010 Jul 21;(41) doi: 10.3791/2076. pii: 2076. [DOI] [PMC free article] [PubMed] [Google Scholar]
- 33.Clarkson AN, Huang BS, Macisaac SE, Mody I, Carmichael ST. Reducing excessive GABA-mediated tonic inhibition promotes functional recovery after stroke. Nature. 2010;468:305–9. doi: 10.1038/nature09511. [DOI] [PMC free article] [PubMed] [Google Scholar]
- 34.Dye CA, El Shawa H, Huffman KJ. A lifespan analysis of intraneocortical connections and gene expression in the mouse I. Cereb Cortex. 2011;21:1311–30. doi: 10.1093/cercor/bhq212. [DOI] [PMC free article] [PubMed] [Google Scholar]
- 35.Sun F, Park KK, Belin S, Wang D, Lu T, Chen G, Zhang K, Yeung C, Feng G, Yankner BA, He Z. Sustained axon regeneration induced by co-deletion of PTEN and SOCS3. Nature. 2011;480:372–5. doi: 10.1038/nature10594. [DOI] [PMC free article] [PubMed] [Google Scholar]
- 36.Carmichael ST. Translating the frontiers of brain repair to treatments: starting not to break the rules. Neurobiol Dis. 2010;37:237–42. doi: 10.1016/j.nbd.2009.09.005. [DOI] [PMC free article] [PubMed] [Google Scholar]
- 37.Liu K, Tedeschi A, Park KK, He Z. Neuronal intrinsic mechanisms of axon regeneration. Annu Rev Neurosci. 2011;34:131–52. doi: 10.1146/annurev-neuro-061010-113723. [DOI] [PubMed] [Google Scholar]
- 38.Zai L, Ferrari C, Subbaiah S, Havton LA, Coppola G, Strittmatter S, et al. Inosine alters gene expression and axonal projections in neurons contralateral to a cortical infarct and improves skilled use of the impaired limb. J Neurosci. 2009;29:8187–97. doi: 10.1523/JNEUROSCI.0414-09.2009. [DOI] [PMC free article] [PubMed] [Google Scholar]
- 39.Ng SC, de la Monte SM, Conboy GL, Karns LR, Fishman MC. Cloning of human GAP-43: growth association and ischemic resurgence. Neuron. 1988;1:133–9. doi: 10.1016/0896-6273(88)90197-3. [DOI] [PubMed] [Google Scholar]
- 40.Abe K, Chu PJ, Ishihara A, Saito H. Transforming growth factor-beta 1 promotes re-elongation of injured axons of cultured rat hippocampal neurons. Brain Res. 1996;723:206–9. doi: 10.1016/0006-8993(96)00253-3. [DOI] [PubMed] [Google Scholar]
- 41.Walshe TE, Leach LL, D’Amore PA. TGF-beta signaling is required for maintenance of retinal ganglion cell differentiation and survival. Neuroscience. 2011;189:123–31. doi: 10.1016/j.neuroscience.2011.05.020. [DOI] [PMC free article] [PubMed] [Google Scholar]
- 42.Yi JJ, Barnes AP, Hand R, Polleux F, Ehlers MD. TGF-beta signaling specifies axons during brain development. Cell. 2010;142:144–57. doi: 10.1016/j.cell.2010.06.010. [DOI] [PMC free article] [PubMed] [Google Scholar]
- 43.Lenferink AE, Cantin C, Nantel A, Wang E, Durocher Y, Banville M, et al. Transcriptome profiling of a TGF-beta-induced epithelial-to-mesenchymal transition reveals extracellular clusterin as a target for therapeutic antibodies. Oncogene. 2010;29:831–44. doi: 10.1038/onc.2009.399. [DOI] [PubMed] [Google Scholar]
- 44.Bahjat FR, Williams-Karnesky RL, Kohama SG, West GA, Doyle KP, Spector MD, Hobbs TR, Stenzel-Poore MP. Proof of concept: pharmacological preconditioning with a Toll-like receptor agonist protects against cerebrovascular injury in a primate model of stroke. J Cereb Blood Flow Metab. 2011;3:1229–42. doi: 10.1038/jcbfm.2011.6. [DOI] [PMC free article] [PubMed] [Google Scholar]
- 45.Soontornniyomkij V, Lynch MD, Mermash S, Pomakian J, Badkoobehi H, Clare R, Vinters HV. Cerebral microinfarcts associated with severe cerebral beta-amyloid angiopathy. Brain Pathol. 2010 Mar;20(2):459–67. doi: 10.1111/j.1750-3639.2009.00322.x. [DOI] [PMC free article] [PubMed] [Google Scholar]
- 46.Brewer GJ, Torricelli JR. Isolation and culture of adult neurons and neurospheres. Nature protocols. 2007;2:1490–1498. doi: 10.1038/nprot.2007.207. [DOI] [PubMed] [Google Scholar]
- 47.Karumbayaram, et al. From skin biopsy to neurons through a pluripotent intermediate under Good Manufacturing Practice protocols. Stem Cells Transl Med. 2012;1:36–43. doi: 10.5966/sctm.2011-0001. [DOI] [PMC free article] [PubMed] [Google Scholar]
- 48.Xu SY, Wu YM, Ji Z, Gao XY, Pan SY. A modified technique for culturing primary fetal rat cortical neurons. J Biomed Biotechnol. 2012;803930 doi: 10.1155/2012/803930. [DOI] [PMC free article] [PubMed] [Google Scholar]
- 49.Patterson, et al. Defining the nature of human pluripotent stem cell progeny. Cell Res. 2012;22:178–93. doi: 10.1038/cr.2011.133. [DOI] [PMC free article] [PubMed] [Google Scholar]
- 50.Patterson, et al. let-7 miRNAs can act through notch to regulate human gliogenesis. Stem Cell Reports. 2014;3:758–73. doi: 10.1016/j.stemcr.2014.08.015. 2012. [DOI] [PMC free article] [PubMed] [Google Scholar]
- 51.Andres RH, et al. Human neural stem cells enhance structural plasticity and axonal transport in the ischaemic brain. Brain. 2011;134:1777–1789. doi: 10.1093/brain/awr094. [DOI] [PMC free article] [PubMed] [Google Scholar]
- 52.Soontornniyomkij V, Lynch MD, Mermash S, Pomakian J, Badkoobehi H, Clare R, Vinters HV. Cerebral microinfarcts associated with severe cerebral beta-amyloid angiopathy. Brain Pathol. 2010 Mar;20(2):459–67. doi: 10.1111/j.1750-3639.2009.00322.x. [DOI] [PMC free article] [PubMed] [Google Scholar]
- 53.Ozdinler PH, Macklis JD. IGF-I specifically enhances axon outgrowth of corticospinal motor neurons. Nat Neurosci. 2006 Nov;9(11):1371–81. doi: 10.1038/nn1789. [DOI] [PubMed] [Google Scholar]
- 54.Paxinos G, Watson C. The Mouse Brain in Stereotaxic Coordinates. 2nd. Academic; San Diego: 2001. [Google Scholar]
- 55.Dobin A, Davis CA, Schlesinger F, Drenkow J, Zaleski C, Jha S, Batut P, Chaisson M, Gingeras TR. STAR: ultrafast universal RNA-seq aligner. Bioinformatics. 2013;29:15–21. doi: 10.1093/bioinformatics/bts635. [DOI] [PMC free article] [PubMed] [Google Scholar]
- 56.Robinson MD, McCarthy DJ, Smyth GK. edgeR: a Bioconductor package for differential expression analysis of digital gene expression data. Bioinformatics. 2010;26:139–40. doi: 10.1093/bioinformatics/btp616. [DOI] [PMC free article] [PubMed] [Google Scholar]
Associated Data
This section collects any data citations, data availability statements, or supplementary materials included in this article.