

Abstract
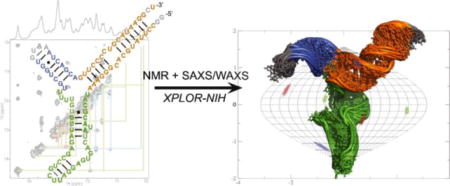
NMR and SAXS/WAXS are highly complementary approaches for the analysis of RNA structure in solution. Here we describe an efficient NMR-SAXS/WAXS approach for structural investigation of multi-helical RNAs. We illustrate this approach by determining the overall fold of a 92-nucleotide 3-helix junction from the U4/U6 di-snRNA. The U4/U6 di-snRNA is conserved in eukaryotes and is part of the U4/U6.U5 tri-snRNP, a large ribonucleoprotein complex that comprises a major subunit of the assembled spliceosome. Helical orientations can be determined by X-ray scattering data alone, but the addition of NMR RDC restraints improves the structure models. RDCs were measured in 2 different external alignment media and also by magnetic susceptibility anisotropy. The resulting alignment tensors are collinear, which is a previously noted problem for nucleic acids. Including WAXS data in the calculations produces models with significantly better fits to the scattering data. In solution, the U4/U6 di-snRNA forms a 3-helix junction with a planar Y-shaped structure and has no detectable tertiary interactions. Single molecule FRET data support the observed topology. A comparison with the recently determined cryo-EM structure of the U4/U6.U5 tri-snRNP illustrates how proteins scaffold the RNA and dramatically alter the geometry of the U4/U6 3-helix junction.
Graphical abstract
INTRODUCTION
Nearly two decades have passed since the first high-resolution view of an RNA structure over 100 nucleotides (nts) [1]. Since this time, great progress has been made in structure determination of RNAs and RNA-protein complexes (RNPs). However, RNA-containing structures are still under-represented in the RCSB Protein Data Bank [2], with currently less than 3% of entries containing RNA. Given the biological significance of RNA and its complexes, and the weak predictive power of ab initio modeling of RNA tertiary structure, it is important to continue to develop efficient methods for deriving accurate structure models from experimental data. It is also important to understand structural intermediates in RNA folding pathways, how helical junction topology determines the conformational space of RNA folding [3], and how protein binding influences RNA folding to stabilize biologically relevant conformations.
Remarkable advancements have been made in biomolecular structure determination over the past few years. Solution NMR can now be used to determine RNA structure models over 100 nts [4–6], with the largest RNA NMR structure currently at 155 nts [5]. Small angle X-ray scattering (SAXS), although an intrinsically low-resolution method, has become a valuable tool for analyzing molecular structure in solution. The SAXS region of X-ray scattering, defined as momentum transfer (q) between 0 and 0.3 Å−1, provides sufficient information for resolving molecular features on the order of 20 Å, such as the width of the A-form helix, and provides useful information on overall molecular size and shape [7–10]. Wide angle X-ray scattering (WAXS), where q > 0.3 Å−1, contains even finer structural information such as nucleic acid helical groove width [7] and in favorable cases can even resolve the spacing of phosphate groups between base pairs [11]. Additionally, significant advances have been made in computational modeling of RNA structure, including the validation and improvement of high resolution models [12], generation of models from chemical mapping [13], and de novo structure prediction approaches [14]. Until recently, X-ray crystallography and nuclear magnetic resonance (NMR) spectroscopy were the only experimental methods capable of elucidating molecular structures at the atomic level. However, cryo-electron microscopy (cryoEM) has made striking advances towards atomic resolution, with two recent structures reported at near-atomic, sub-3 Å resolution [15, 16], although many cryoEM structures still depend upon the fitting of models derived from X-ray crystallography and/or NMR. Hybrid methods are also starting to emerge, such as combining cryoEM and cryo-electron tomography with NMR [17, 18] and NMR-SAXS [4, 6, 9, 10, 19, 20].
We previously described a method for determining the overall structures of large RNAs from sparse NMR and SAXS data, and applied this approach to a 111 nucleotide U2-U6 spliceosomal RNA complex [6]. Our previous method involved generation of 2500 all-atom models using the MC-Sym pipeline [21], which were then filtered and sorted based on goodness of fit (χ2 agreement) to the individual SAXS and RDC data sets. The models that showed the best agreement to both data sets were then subsequently refined using the Xplor-NIH structure determination program [22] in order to jointly optimize the agreement with SAXS and NMR data. Wang and coworkers have described a different approach, in which initial RNA models consistent with secondary structure and SAXS data are generated using the G2G program [23]. The Wang group used this approach to determine the structure of the HIV RRE RNA from SAXS/WAXS data alone [7]. The joint use of NMR and SAXS/WAXS restraints in RNA structure determination has yet to be systematically explored.
Residual dipolar couplings (RDCs) can, in principle, provide the long-range restraints needed to precisely determine interhelical orientations. However, RDCs have four-fold degenerate solutions and are fit equally well with 180° rotations around the three principal axes of the alignment tensor [24]. In the case of a multi-helical RNA with N helices, the degeneracy of the RDC can be satisfied by 4N−1 conformations [19]. A potential solution to this problem is to measure RDCs in two or more different alignment media that result in different alignment tensors [24]. However, in practice this has not been achieved because alignment media tend to sterically and electrostatically align nucleic acids with their longest helical axis along the z-component of the alignment tensor [25]. Although very few RNAs have been analyzed in this way, Pardi and coworkers showed that the 6 most commonly used alignment media resulted in very similar alignment tensors for tRNAVal [25], and thus do not solve the RDC degeneracy problem. For a model RNA (TAR), analysis of the alignment tensors from a variety of alignment media showed that RDCs measured in negatively charged stretched gels appeared significantly different from those measured in Pf1 phage (R2 = 0.65)[26].
As an alternative to external alignment media, magnetic alignment of RNA can be achieved via the intrinsic magnetic susceptibility anisotropy (MSA) of the RNA nucleobases, which imparts a small degree of alignment at high magnetic fields [27]. Magnetic alignment of RNA has been investigated for few RNAs, and in the case of tRNAVal, the magnetic alignment tensor was indeed found to be different from those produced by external alignment media [25]. However, magnetic alignment did not completely alleviate the aforementioned 4-fold degeneracy as the z component of the magnetic alignment tensor was rotated by ~90 degrees, resulting in a tensor with an overall similar (collinear) orientation to those of external alignment media. Therefore, the intrinsic MSA RDCs only eliminated 2 out of 4 degenerate solutions for tRNAVal [25].
The U4/U6 di-snRNA secondary structure is conserved in eukaryotes [28–31]. Formation of the U4/U6 di-snRNA is one of the first steps in assembly of the U4/U6.U5 tri-snRNP [32], the largest pre-assembled spliceosome complex. The tri-snRNP subsequently joins the U1 and U2 small nuclear ribonucleoprotein particles (snRNPs), along with the nineteen nineteen complex (NTC) and nineteen related complex (NTC) to form the assembled spliceosome [33]. The U4/U6 di-snRNA is then unwound by the helicase Brr2 during spliceosome active site formation (activation) [34–38], resulting in U4 release and incorporation of U6 into the catalytic center [39]. The spliceosome catalyzes pre-mRNA splicing using RNA-mediated metal ion catalysis in a manner identical to group II self-splicing intron catalysis [40, 41]. Since the spliceosomal RNAs form extensive interactions with many spliceosomal proteins [32, 39], it is unlikely that the structures of free spliceosomal RNAs will resemble their protein-bound conformations. However, a comparison of the free and protein-bound spliceosomal RNA structures provides unique insights into the degree to which proteins remodel and regulate RNA structures and the conformational dynamics that are likely required during RNP assembly.
Here we determine the overall conformation of a 92 nt U4/U6 di-snRNA using NMR-SAXS/WAXS calculated using the Xplor-NIH program [22, 42]. The impact of SAXS, WAXS, and sparse NMR restraints (NOEs and RDCs) on the structure models is evaluated. The overall structure of the RNA is well defined by SAXS/WAXS data alone, but further benefits from NMR data. A comparison of the free U4/U6 di-snRNA conformation with the recently determined tri-snRNP structure [32] illustrates how extensive RNA-protein interactions remodel the RNA fold and stabilize coaxial stacking of helices.
RESULTS
The S. cerevisiae U4 and U6 snRNAs are 160 and 112 nt, respectively (Figure 1A). In order to facilitate structural analysis of the di-snRNA helical junction, we created a 92 nt linked U4-U6 RNA construct that spans the entire base-paired region between U4 and U6 (Figure 1B). NMR data indicate that the RNA is well-folded in a single major conformation (Figures 1C and 2). The individual helical domains were investigated by 2D NOESY in order to facilitate assignment of base-paired imino resonances of the larger RNA construct (Supplemental Figure S1). The NOEs observed for the individual helical domains are apparent as sub-spectra of the 2D NOESY data of the intact RNA (Supplemental Figure S1), suggesting a lack of tertiary interactions between helices in the intact RNA. Nearly all base-paired imino proton and nitrogen resonances could be assigned by 2D NOESY and 1H-15N HSQC-TROSY (Figures 1C and 2). In addition, five adenine H2 resonances with disperse chemical shifts could be readily assigned via intense NOE cross-peaks to uracil imino resonances, owing to the short 2.7 Å distance between these protons when in a Watson-Crick base pair (Supplemental Figure S2). Additionally, the upfield chemical shift of the A75 H2 proton further confirms its assignment, owing to the unique chemical shift associated with the first A in the sequence 5′-UAA-3′ that occurs when this motif is Watson-Crick base-paired [43].
Figure 1.
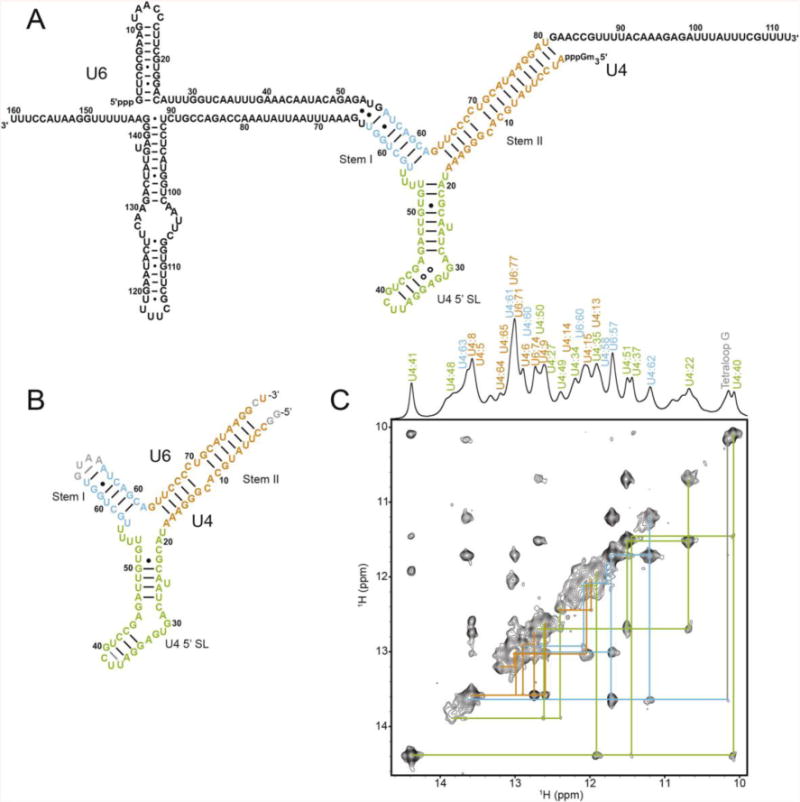
Secondary structure of U4/U6. A. Proposed secondary structure diagram of the S. cerevisiae U4/U6 di-snRNA. B. NMR construct of U4/U6. Numbering corresponds to the yeast numbering in (A). Only the base pairs that could be experimentally determined by NMR are shown as lines for Watson-Crick pairs and dots for wobble pairs. C. 2D NOESY with NOE walk color coded to match (B).
Figure 2.
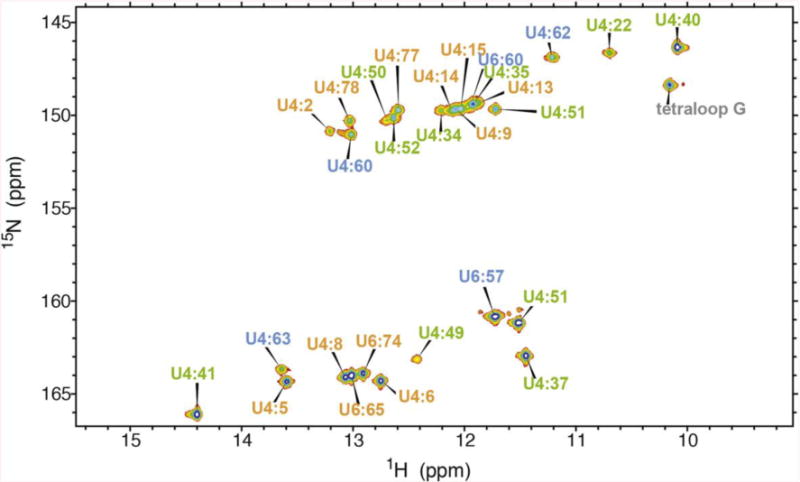
2D 1H-15N HSQC-TROSY spectrum of the U4/U6 imino correlations. Assignments are indicated and color coded to match Figure 1.
Residual dipolar couplings (RDCs) were measured in 2 different external alignment media, Pf1 phage [44] and negatively charged stretched polyacrylamide gels [45], and also by magnetic susceptibility anisotropy [27]. 29 total RDCs were measured from the resolved (non-overlapped) imino (1H-15N) and adenine (1H-13C) correlations. The degree of alignment from MSA is small and hence the magnitudes of the measured RDCs are on the order of a few Hz. Such small dipolar couplings can be difficult to accurately measure for large molecular weight (MW) complexes with broad linewidths. In order to accurately measure small dipolar couplings in a high MW RNA, we used the ARTSY method [46], which quantitatively measures the dipolar coupling by measuring differences in TROSY peak intensities recorded with different dephasing delays. Thus, ARTSY overcomes many of the problems associated with measuring dipolar couplings in high MW systems. Plotting the measured RDCs against each other produces no apparent correlation (Supplemental Figure S3). However, analysis of the scalar product of the tensors [47] shows that they are indeed highly correlated as the magnitudes of the scalar products are above 0.9 for most calculated structures (data not shown).
Structures were calculated using X-ray scattering data, including both SAXS and WAXS data. Sparse NMR restraints included 29 RDCs, 47 experimentally determined inter-residue NOEs derived from the imino resonances (Figures 1C and Supplemental Figure S2). Non-experimentally derived restraints were employed to maintain idealized A-form helical geometry in the Watson-Crick paired regions where experimentally determined NOEs indicated that base-pairs are indeed formed (Table 1). The use of idealized A-form helical geometries in fitting both RDC and SAXS data has been previously validated [7, 20, 48]. Additionally, non-experimental restraints were used for the tetraloop [49, 50] and kink-turn structures [51]. The 10 lowest energy structures (out of 100 calculated) are shown in Figure 3. The overall rmsd of the structure models is 2.4 Å (Table 1). The molecule forms a mostly planar Y-shaped 3-helix junction (Figure 3).
Table 1.
NMR and refinement statistics for U4/U6
| U4/U6 10 lowest energy structures | |
|---|---|
| NMR distance and dihedral constraints | |
| Distance restraints | |
| Total NOE | 685 |
| Intra-residue | 640 |
| Inter-residue (experimental) | 47 |
| Sequential (|i-j| = 1) | 33 |
| Non-sequential (|i-j| > 1) | 12 |
| Hydrogen bonds | 191 |
| P-P distance | 99 |
| Total dihedral angle restraints | 615 |
| RDCs (experimental) | 29 |
| Structure statistics | |
| RMSD (dev) | |
| Distance constraints (Å) | 0.05±0.01 |
| Hydrogen bond constraints (Å) | 0.06±0.01 |
| Dihedral angle constraints (°) | 2.2±0.3 |
| Deviations from idealized geometry | |
| Bond lengths (Å) | 0.006±0.000 |
| Bond angles (°) | 0.79±0.02 |
| Impropers (°) | 0.54±0.03 |
| Average pairwise r.m.s.d.a (Å) | |
| All RNA heavy | 2.41 |
Pairwise r.m.s.d. was calculated among 10 lowest energy out of 100 refined structures.
Figure 3.
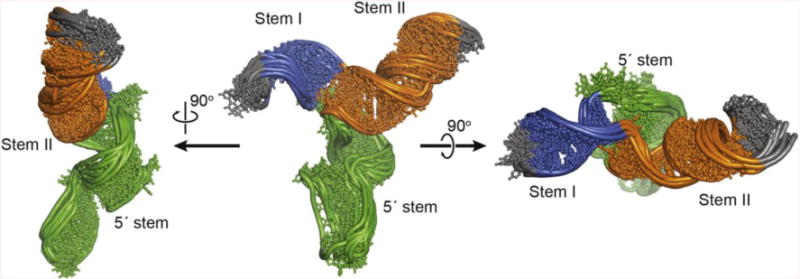
NMR-SAXS/WAXS structure of U4/U6. The ensemble of the 10 lowest energy structures (out of 100 calculated) are shown.
The agreement between the SAXS/WAXS data and the predicted scattering from the structure models is excellent (χ2 = 0.089 (Figure 4A). Inclusion of WAXS data significantly improves the agreement between the models and the scattering data. When structures are refined against only data from the SAXS region (defined as 0 < q < 0.3 Å−1), the agreement is worse over the SAXS region (χ2 = 0.13) and significantly worse over the full scattering curve (χ2 = 0.31)(Supplemental Figure S4). When structure models are calculated using only the RDC and SAXS data (no WAXS), there are large deviations between the models and the experimental data in the region q = 0.35–0.45 Å−1. The high residuals in this region are therefore a direct consequence of truncating the SAXS data to q < 0.30. The region q = 0.35–0.45 Å−1 corresponds to interatomic distances on the order of 14–18 Å, and visual inspection of the structure models show that both the short Stem I and 5′ stem-loop helices are less well-ordered and more proximal when WAXS data are omitted from the calculations (Figure 5). When RDCs are the only source of long-range restraints and no SAXS/WAXS data are used in the calculation, the resulting agreement is very poor (χ2 = 18.6) (Supplemental Figure S4). The impact of the various restraints on the structure models is shown visually in Figure 5. When compared to structure calculations lacking RDC/SAXS/WAXS data, it appears that inclusion of RDCs in the absence of SAXS/WAXS data increases both the overall model rmsd (Figure 5) and lowers the agreement between the structure models and experimental SAXS/WAXS data (Supplemental Figure S4, compare bottom panels). This is likely due to the over-fitting inherent to structure calculations with sparse data, where the apparent decrease in model agreement simply reflects a reduction in over-fitting of sparse experimental restraints. While inclusion of RDC restraints does not improve the agreement between the structure models and experimental SAXS/WAXS data (compare Figure 4 and Supplemental Figure S4 top left panel), we do not expect it to, as the contribution of RDC restraints to the overall shape of the molecule are negligible when compared to the contribution of SAXS/WAXS.
Figure 4.
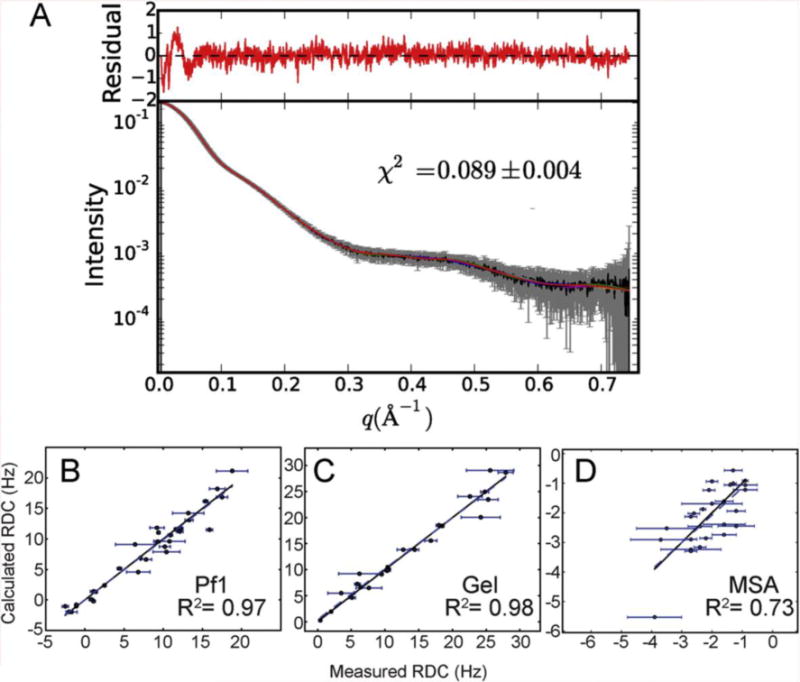
Agreement between structure models and the experimental SAXS/WAXS and RDC data. A) Experimental SAXS/WAXS data (gray) were merged from 10 individual 0.5 second exposures and are plotted with error bars. Back calculated SAXS/WAXS data from the models are shown as colored lines. Residuals are plotted above, in red. B–D) Agreement between measured and predicted RDC for Pf1 phage (B), negatively charged stretched polyacrylamide gels (C) and magnetic susceptibility anisotropy (D).
Figure 5.
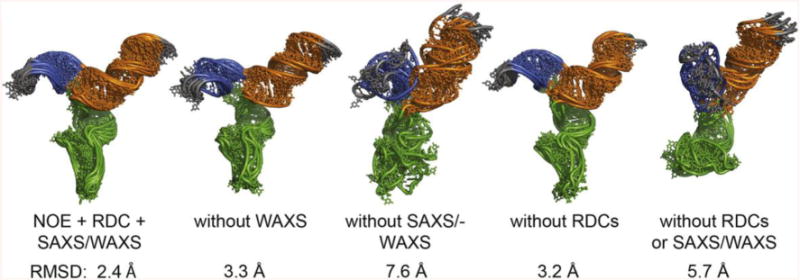
Impact of SAXS, WAXS and NMR restraints on structure models. The lowest 5 energy models out of 48 calculated are shown. RMSDs for the ensembles are indicated.
The agreements between measured and predicted RDCs are also excellent (Figure 4B–D). Furthermore, the multiple sets of RDCs allow the calculation of R-factors (Table 2). Standard jack-knife validation methods are problematic with sparse data, so we chose to randomly remove only 20% of the RDCs and recalculate 48 structures with all other restraints unchanged (Table 2). The SVD fits to the lowest energy structure with the excluded RDCs show good correlations (Supplemental Figure S5). We also used the ‘structural noise Monte-Carlo’ method in PALES [52] to estimate the propagation of RDC experimental errors in the orientation of the alignment tensor axes. The results for the NH RDCs in the 3 media using 1000 SVD calculations with an amplitude of Gaussian random NH structural variation in a cone matched to the experimental error of the RDCs is shown in Supplemental Figure S6. Note that due to the high rhombicity of the Pf1 tensor (0.66), the directions of two approximately equal components Szz and Syy appear occasionally permuted, which is an artifact of the |Szz| > |Syy| convention. The magnitude and rhombicity of the alignment tensors and the RDC agreement with the NMR structures are included in Table 2 and the structure statistical quality indicators are reported in Table 1.
Table 2.
Agreement of the U4/U6 NMR Structures with Experimental RDCs
| RDC (medium/count) | RDC Cross Validationa | ||||
|---|---|---|---|---|---|
| Rb (std. dev.)/Pearson’s Rd | Rinfinityb (std. dev.) | Rfreec/Pearson’s Rc | Dab (std. dev.) [Hz] | Rhob (std. dev.) | |
|
1DNH (Pf1/24) 1DCH (Pf1/8)f |
3.1 (0.5)/97.9% | 7.4 (0.9) | 17.4/72.2% 10.8/87.1%e |
−19.5 (0.6) | 0.66 (0.01) |
| 1DNH (SAG/24) | 0.6 (0.1)/98.2% | 1.6 (0.2) | 14.6/0.1% 4.6/99.1%e |
−45.1 (1.6) | 0.49 (0.02) |
|
1DNH (MSA/22) 1DCH (MSA/4)f |
7.0 (0.8)/70.4% | 15.7 (1.9) | 24.9/26.6% 2.1/99.9%e |
4.6 (0.1) | 0.52 (0.03) |
The 10 NMR structures deposited in PDB were used for the analysis (except for Rfree)
R-factor, Rinfinity (in percent), the magnitude (Da) and Rho(mbicity) of the alignment tensors are defined as in XPLOR-NIH [67].
Rfree defines how well ~20% of the RDCs fit the lowest energy structure (out of 48) recalculated with the respective set of RDCs excluded from the experimental restraints.
SVD fitted to the lowest energy structure (out of 100).
We note that the orientations of the 3 helices appear to be relatively fixed with respect to each other, despite a lack of coaxial stacking. Thus the sparse NMR and SAXS/WAXS data do not provide evidence for large-scale interhelical dynamics. However, it is possible that dynamic motions are averaged out during the ~200–500 milliseconds of data acquisition required for the NMR and X-ray scattering experiments. In an effort to detect alternate conformations or dynamics that may be occurring in only a small subset of U4/U6 molecules, we used single molecule Förster Resonance Energy Transfer (smFRET). We prepared U4 RNAs for smFRET by ligating two RNA fragments together to create a single RNA spanning U4 nt 1–83. This U4 fragment also contained a 3′ biotin for surface immobilization and a Cy3 FRET donor fluorophore located at either U5 or U38. These U4 RNAs were then annealed to U6 fragments (nt 49–88) containing Cy5 FRET acceptor fluorophores located at either U54 or U74. By combining U4 and U6 RNAs labeled at different positions, we were able to prepare different di-RNAs for reporting on stem I/stem II, stem I/U4 5′ stem-loop, or stem II/U4 5′ stemloop dynamics (Figure 6 A,D,G). We could not detect any transitions on the 0.1–100s timescale between different FRET states for any of these di-RNAs (Figure 6 B,E,H). Furthermore, histograms of calculated FRET efficiencies for each di-RNA showed narrow distributions consistent with a single predominant conformation (Figure 6 C,F,I). While we cannot exclude either exceedingly rare transitions or the presence of very unstable structures, the smFRET data are consistent with a predominant U4/U6 di-RNA conformation in which stem I, stem II, and the U4 5′ stem-loop remain relatively fixed in their orientation.
Figure 6.
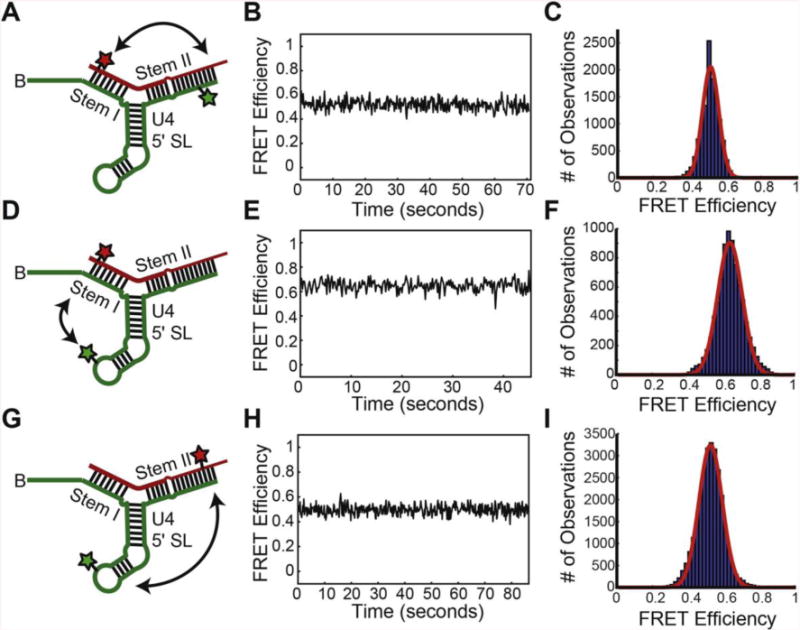
smFRET data from U4/U6 di-RNAs containing fluorophores in either U4/U6 stem I, U4/U6 stem II, or the U4 5′ stemloop. (A) Diagram of a U4/U6 di-RNA for reporting on dynamics between U4/U6 stem I and U4/U6 stem II (double-headed arrow). The U4 RNA (green) contains a Cy3 FRET-donor fluorophore (green star) and a biotin tether for surface immobilization (“B”). The U6 RNA (red) contains a Cy5 FRET-acceptor fluorophore. (B) FRET efficiency (EFRET) trajectory for a single molecule the di-RNA shown in (A). (C) Histogram of EFRET calculated from N = 76 molecules of the di-RNA shown in (A). (D) Diagram of a U4/U6 di-RNA for reporting on dynamics between U4/U6 stem I and the U4 5′ stemloop (double-headed arrow). (E) EFRET trajectory for a single molecule the di-RNA shown in (D). (F) Histogram of EFRET calculated from N = 84 molecules of the di-RNA shown in (D). (G) Diagram of a U4/U6 di-RNA for reporting on dynamics between U4/U6 stem II and the U4 5′ stemloop (double-headed arrow). (H) EFRET trajectory for a single molecule the di-RNA shown in (G). (I) Histogram of EFRET calculated from N = 98 molecules of the di-RNA shown in (G). Red lines in panels C,F, and I represent the fitting results of each histogram to single exponential Gaussian functions.
We observe FRET efficiencies of 0.52 (Stem I-Stem II, Figure 6A–C), 0.64 (Stem I- U4 5′SL, Figure 6D–F) and 0.53 (Stem II-U4 5′SL). It is difficult to quantitatively interpret FRET efficiencies in terms of distances, in part because the fluorophores are connected to the RNA via 10 atom (~14 Å) flexible linkers. Assuming a Förster radius of R0 = 60 Å [53], a FRET efficiency of 0.52 for Stem I-Stem II, for example, should correspond to a distance of approximately 59 Å. The measured Stem I-Stem II interhelical distance corresponding to the approximate sites of fluorophore attachment in our structures is approximately 67 Å (this distance is approximate because the NMR-SAXS/WAXS structures have a tetraloop at the position corresponding to the Stem I fluorophore). Therefore, we note that distance values obtained by FRET efficiencies and the structures are in reasonable agreement but that precise distance calculations are hampered due to measurement uncertainties.
DISCUSSION
The NMR-SAXS/WAXS approach described here can be used to determine the overall orientation of helical junctions with a precision (rmsd) of < 3 Å. However, the nts at the interface of the junction are not well determined by this approach. More precise structural information on single stranded regions that may form potential tertiary interactions requires additional NMR data and more expensive labeling strategies such as 2H [5] or selective 13C,15N labeling [54]. NMR-SAXS/WAXS is an efficient and cost-effective strategy for determining the overall fold of an RNA and may inform the decision as to whether more extensive NMR measurements should be pursued. In this study, the agreement between the NMR data for the individual helices and the intact RNA suggest that stable tertiary interactions are unlikely to form across the junction, a conclusion that is corroborated by the structure models and the smFRET experiments. Our data show that the overall fold of the U4/U6 RNA is fairly well determined by SAXS/WAXS data (3.2 Å rmsd) when the base pairs are restrained to A-form geometry. In this example, the base pairing has been confirmed by experimental NMR data (NOEs), but this information may also be inferred from secondary structure predictions with approximately 73% accuracy depending upon the RNA length and sequence [55]. We show that addition of sparse RDC data lowers the rmsd of the ensembles from 3.2 to 2. 4 Å (Figure 5). The inclusion of sparse RDCs clearly makes a useful contribution to the global accuracy of the orientations of bonds and secondary structure elements.
Often, the topology of an RNA 3-helix junction can be predicted based on the number of nts in the strands that connect the helices, where helices with no intervening nts are often observed to coaxially stack [56]. The topology of the U4/U6 3-helix junction is not easily predicted, as the strands connecting the helices are nearly equivalent [56]. Moreover, the exact base pairing of the terminal base pairs at the ends of the helices adjacent to the central 3-helix junction cannot be readily determined from the NMR data, because the imino protons at the helical termini rapidly exchange with water and are not observed. The observed Y-shaped conformation is very similar to helices 20, 21 and 22 in 16S rRNA, which form a Y-shaped 3-helix junction in isolation but fold into a coaxially stacked conformation upon binding the S15 protein [57].
The combined NMR-SAXS/WAXS and smFRET data show that the 3-helix junction is not coaxially stacked and adopts a single conformation with no detectable helical reorientations or alternate conformations occurring on the ms to second timescale. The lack of observeable interhelical dynamics in free U4/U6 RNA was also recently reported by Hardin et al. [58]. However, Hardin et al. detected the presence of multiple but non-interconverting FRET states, which were attributed to different conformations of the 5′ stem-loop. In contrast, our smFRET histograms show single Gaussian distributions. Potentially, this discrepancy may be related to differences in RNA construct design and fluorophore location. Using fluorophores tethered at the very ends of the helices, Hardin et al. measured a Stem I-Stem II FRET efficiency of 0.2 and concluded that Stem I and II span a distance of approximately 76 Å and are coaxially stacked. Although our structure models show that Stems I and II are not coaxially stacked, the maximum distance spanned by these helices in our structures is 79 Å, which is in excellent agreement with the FRET efficiency observed by Hardin et al. Thus it is difficult to infer coaxial stacking of multi-helical RNAs from smFRET data alone, as different helical configurations can span very similar distances.
The structures determined here facilitate a comparison of the free U4/U6 conformation with other complexes to reveal how the RNA structure can be remodeled by extensive protein interactions. Cryo-electron microscopy was recently used to determine the structure of the yeast U4/U6.U5 tri-snRNP [32], providing a view of the U4/U6 di-snRNA and the interaction between its core base pairing region and the proteins Snu13, Prp3, Prp4 and Prp31. A comparison of this structure with free U4/U6 (Figure 7) reveals that U4/U6 stems I and II form a coaxial stack and extensively interact with the protein Prp3. Other significant differences in interhelical angles also likely arise from extensive protein interactions. For example, the angle between the 5′ stem-loop and Stem II decreases from approximately 120° in the free RNA to approximately 60° in tri-snRNP. Additionally, the pitch of U4/U6 Stem II is offset by a full half turn, as is the 5′ stem-loop. These differences can be potentially explained by remodeling of the di-snRNA by the proteins: Snu13, Prp3 and Prp31 all bind at or near to the three-helix junction in U4/U6. The U4/U6 proteins are thought to assemble onto RNA sequentially, where binding of Snu13 and Prp31 to the K-turn motif in free U4 [51, 59–62] allows protein-protein mediated recruitment of Prp3 and Prp4, which are then poised to interact with structural elements present only after annealing of U4 with U6 [32, 61, 63]. In the tri-snRNP structure, Prp3 contacts U4/U6 stem II and appears to contain an alpha helix that reaches across the stem I-stem II junction (Figure 7). Therefore, the Prp3 binding site on U4/U6 does not exist until after U4 and U6 anneal and the stem I and II helices are formed. The initial binding of Snu13 and Prp31 to the U4 5′ stem-loop serves to recruit Prp3 and Prp4, which remodel the U4/U6 interhelix junction by stabilizing the bound form of the RNA, including the coaxial stacking of stems I and II.
Figure 7.
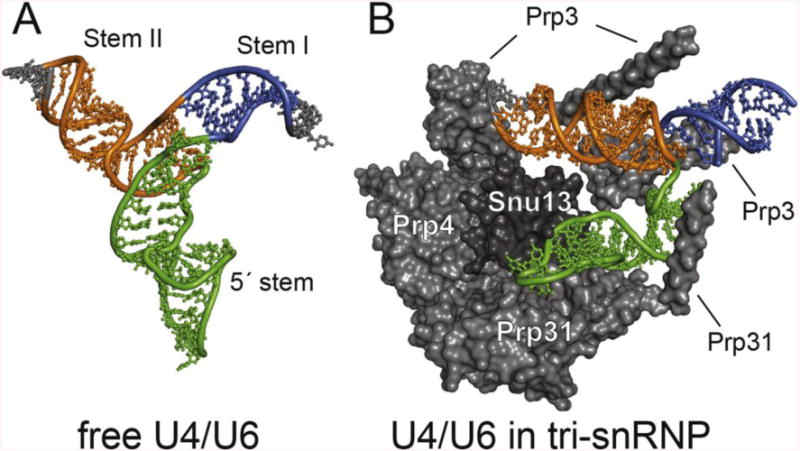
Structural comparison of U4/U6 in the presence and absence of spliceosomal proteins. A) NMR/SAXS structure of free U4/U6. B) Cryo-EM structure of U4/U6 in the yeast tri-snRNP. Associated protein cofactors in tri-snRNP promote a conformation that is not favored in the free RNA, consistent with their essential role in driving RNA structural rearrangements during spliceosome assembly and disassembly.
In conclusion, we have shown that SAXS/WAXS data alone are sufficient to define the overall fold of the U4/U6 RNA 3 helix junction. In this case, the agreement between the SAXS/WAXS data and the structures models is excellent. However, in some cases, weighted ensembles of conformers may be needed to obtain optimal agreement to WAXS data [7, 42]. The addition of sparse NMR data further improves the structures and importantly, the mutual agreement between RDCs and SAXS/WAXS data provides strong cross-validation of the structure models. Finally, we also note that the NMR data provide experimental validation of base-pairing interactions, which are important restraints that cannot always be accurately predicted in the absence of experimental data.
MATERIALS AND METHODS
RNA synthesis and sample preparation
RNA samples were produced via in vitro transcription using His6-tagged T7 RNA polymerase [64] in 40 mM TrisCl pH 8.0, 1 mM spermidine, 0.01% Triton X-100, 38 mM MgCl2, 5 mM DTT, 5.9 mM ATP, 5.4 mM CTP, 7.1 mM GTP, and 7.6 mM UTP. 13C-15N labeled samples were synthesized using 13C-15N labeled nts (Cambridge Isotope Laboratories). The U4–U6 92 nt RNA was transcribed from a modified pUC19 plasmid containing the T7 polymerase promoter sequence, two G nts for efficient transcription, S. cerevisiae snRNA U4 nts 3–63, a GUAA linker, S. cerevisiae snRNA U6 nts 56–80 with an A79C mutation to stabilize the U4/U6-Stem II helix, then a BsaI restriction site to allow for run-off transcription. RNAs were purified from abortive transcripts and linearized plasmid using an 8% 29:1 acrylamide:bis-acrylamide denaturing gel containing 8 M urea, 89 mM Tris borate, 2 mM EDTA. RNA was visualized by UV shadowing and extracted from the gel by passive diffusion into 0.3 M sodium acetate pH 5.2. Samples were further purified by DEAE anion exchange using low salt-buffer (20 mM Tris pH 7.6, 0.1 mM EDTA, 20 mM NaCl) to load and wash the RNA and a high-salt buffer (20 mM Tris pH 7.6, 0.1 mM EDTA, 1.5 M NaCl) to elute RNA. Samples were ethanol precipitated and resuspended in water. RNA was then diluted to <20 μM in 310 mM KCl, 11.25 mM KPO4 pH 7.0, 5 mM EDTA and refolded by heating to 90°C for 5 minutes then snap cooling on ice. Samples were concentrated in 3 kDa-cutoff spin concentrators and dialyzed for 24 hours into 20 mM potassium phosphate pH 7.0, 20 mM KCl (NMR samples) or 50 mM Tris pH 7.0, 150 mM KCl (SAXS samples).
SAXS data collection and analysis
SAXS data were obtained at the Advanced Photon Source, Sector 12 at Argonne National Laboratory. Measurements were carried out in 50 mM Tris, pH 7.0, 150 mM KCl as previously described [6, 65].
NMR data collection and analysis
All NMR data were collected on Bruker Avance or Varian NMR spectrometers equipped with cryogenic single z-axis gradient HCN probes at the National Magnetic Resonance Facility at Madison. Resonances were assigned using 1H-1H 2D NOESY with a mixing time of 100 ms and 1H-15N 2D TROSY-HSQC experiments. Isotropic NH and CH couplings were acquired on Bruker and Varian spectrometers equipped with cryogenic probes in symmetrical 5mm Shigemi microtubes at 25°C on 300 μl samples containing 0.6mM 15N-GU labeled and 0.7 mM 13C-A labeled U4–U6, in 20 mM potassium phosphate pH 7.0, 20 mM KCl with 0.15% NaN3 and 7% 2H2O. The samples were used to measure 1DNH and 1DCH residual dipolar couplings (RDCs) by magnetic field alignment at 900, 800, 750, 600 and 500 MHz, by adding 5 mg/ml Pf1 filamentous bacteriophage, or by hydrating a negatively charged stretched (from 5.4 to 4.2 mm) acrylamide gel (SAG).[45] 1DNH and 1DCH couplings were measured from 2D ARTSY[46] spectra. Data were processed using NMRPipe package [66].
Structure calculations
A single starting coordinate file was generated with MC-Sym as previously described [6] and all structure calculations were performed with Xplor-NIH [22, 42, 67, 68]. The initial annealing temperature was set at 3000 K. Force constants for restraints were set as follows: SAXS/WAXS, 400 kcal/mol; NOEs and H-bonds were ramped from 2 to 50 kcal/mol/Å2; dihedrals were set at 200 kcal/mol/rad2 and RDCs were ramped from 0.02 to 5 kcal/mol/rad2. Non-experimentally derived distance restraints for the U4 kink-turn region (nts 28–35 and 42–46 of U4) were modified from restraints for the NMR structure of the human U4 k-turn (PDB 2XEB) [51]. Restraints for the UUCG tetraloop (nts 37–40 of U4) were obtained from the NMR structure of the P1 helix (PDB 1HLX) [49], and restraints for the GUAA tetraloop between U4 nucleotide 63 and U6 nucleotide 56 was modified from the structure of a GCAA tetraloop [50]. Structures were calculated with radius of gyration, NOEs, inferred hydrogen bonds and dihedral restraints for A-form helical regions, RNA database orientational restraints, base pair planarity restraints, inter phosphorus distance restraints (global and local), SAXS, and RDC constraints. PyMol (Delano Scientific, LLC) and VMD-XPLOR [69] were used to analyze the structures. The Xplor-NIH python script used to calculate the structures is available upon request.
Preparation of Fluorophore-Labeled RNAs for smFRET
RNAs (Supplemental Table 1) were purchased from IDT containing amino allyl modified nucleotides at the positions indicated. RNAs (5 nmol) were fluorescently labeled with mono-reactive NHS ester Cy3 or Cy5 dyes (40 nmol, GE) by overnight incubation at room temperature in labeling buffer (33% DMSO v/v, 100mM sodium bicarbonate pH 8.5). Excess dye was removed using an Illustra microspin G-25 column (GE) prior to gel purification using 12% denaturing polyacrylamide.
Ligation of U4 RNAs for smFRET Experiments
U4 RNAs encompassing nt 1–83 were prepared by splinted ligation of U4_1 and U4_2 (Supplemental Table 1) containing the appropriate aminoallyl derivatives. Prior to ligation, U4_1 (60 pmol) was phosphorylated with T4 polynucleotide kinase (20U, NEB) for 30 mins at 37°C. U4_2 (120 pmol) and a DNA splint (5′ CAC AAT CTC GGA CGA ATC CTC ACT GAT ATG CGT ATT TCC CGT GCA TAA GGA T – 3′, 100 pmol) were then added and the oligos annealed by heating to 95°C for 5 mins followed by slow cooling to 25°C over 30 min. Following annealing, ligation was carried out by addition of T4 RNA ligase II (10 U, NEB) and incubation at 37°C for 30 min. Ligation products were purified by 12% denaturing polyacrylamide gel electrophoresis (PAGE).
Heat annealing of U4 and U6 RNAs
U4/U6 di-snRNAs were prepared by heat annealing U6 (3 μM) and U4 (200 nM) RNAs in annealing buffer (50mM Tris pH 7.4, 400 mM NaCl) at 95°C for 5 min followed by slow cooling to room temperature over 30 min.
Single-molecule FRET data collection and analysis
Quartz slides were first passivated with a mixture of polyethylene glycol (PEG) and biotin-derivatized PEG as previously described [70]. Streptavidin (Prozyme) was then added to the slide, incubated, and unbound proteins removed by copious washing with PBS. Heat annealed U4/U6 RNAs were then diluted to 25pM in annealing buffer, flowed onto the slide, and immobilized. Unbound RNAs were then removed by washing with imaging buffer containing an oxygen scavenging system [71] (50 mM Tris pH 7.4, 400 mM NaCl, 450 μg/μl glucose, 40 U/mL glucose oxidase, 1500 U/mL catalase, and 3 mM Trolox).
Molecules were imaged using a home-built prism-based TIRF microscope [70] using 532 nm and 640 nm lasers for excitation. Images (200 ms exposure) were collected for ~3 minutes by first imaging Cy5 fluorophores with the 640 nm laser, followed by observation of FRET with the 532 nm laser, and ending with imaging of the Cy5 fluorophores with the 640 nm laser. Data were recorded from both the Cy3 and Cy5 emission channels simultaneously on an EM-CCD camera (Andor) using a DualView apparatus (Photometrics) and a 630dcxr dichroic mirror (Chroma).
Well-resolved single-molecules were selected in the red channel (>630 nm) and mapped onto the corresponding molecule in the green channel (<630 nm) using a mathematical mapping function generated for each experiment using fluorescent beads that fluoresce in both channels as fiducial markers. Donor (Cy3) and acceptor (Cy5) intensities were obtained for each frame by integrating the spot intensity in each channel using custom software (Imscroll, [72]) in MatLab (MathWorks). Background subtraction was carried out using Imscroll and photobleaching and blinking were removed with vbFRET [73]. EFRET values for each frame were calculated as IA/(IA+ ID), where IA is the intensity of the acceptor at a particular frame and ID is the intensity of the donor at a particular frame. EFRET histograms were generated by binning the EFRET values for many individual molecules.
Supplementary Material
Research Highlights.
A method is described for modeling RNA structures from NMR-SAXS/WAXS data
Inclusion of WAXS data significantly improves agreement with experimental data
Application to a 92-nt U4/U6 3-helix junction RNA is illustrated
Acknowledgments
We thank the Advanced Photon Source (APS) staff for technical support, Charles Schwieters for technical assistance with structure calculations, Ad Bax for helpful comments, and Kiyoshi Nagai for model coordinates of the U4/U6.U5 tri-snRNP. This study made use of the National Magnetic Resonance Facility at Madison, which is supported by NIH grants P41 GM103399 (NIGMS) and P41GM66326 (NIGMS). Additional equipment was purchased with funds from the University of Wisconsin, the NIH (RR02781, RR08438), the NSF (DMB-8415048, OIA-9977486, BIR-9214394), and the USDA. This work was supported by the NIH (NIGMS) grant GM065166 to S.E.B and R00 GM086471 and R01 GM112735 to AAH. AAH and MLR were also supported by the Arnold and Mabel Beckman Foundation, the Shaw Scientist Program of the Greater Milwaukee Foundation, and startup funding from U. Wisconsin-Madison, WARF, and the Department of Biochemistry. MLR is supported by the Molecular Biophysics Training Program (T32-GM08293).
Footnotes
Publisher's Disclaimer: This is a PDF file of an unedited manuscript that has been accepted for publication. As a service to our customers we are providing this early version of the manuscript. The manuscript will undergo copyediting, typesetting, and review of the resulting proof before it is published in its final citable form. Please note that during the production process errors may be discovered which could affect the content, and all legal disclaimers that apply to the journal pertain.
Accession Numbers
Atomic coordinates have been deposited in the Protein Data Bank (PDB ID code 2n7m) and the NMR data in the BioMagResBank (BMRB access code 25811).
References
- 1.Cate JH, Gooding AR, Podell E, Zhou K, Golden BL, Kundrot CE, et al. Crystal structure of a group I ribozyme domain: principles of RNA packing. Science. 1996;273:1678–85. doi: 10.1126/science.273.5282.1678. [DOI] [PubMed] [Google Scholar]
- 2.Rose PW, Prlic A, Bi C, Bluhm WF, Christie CH, Dutta S, et al. The RCSB Protein Data Bank: views of structural biology for basic and applied research and education. Nucleic Acids Res. 2015;43:D345–56. doi: 10.1093/nar/gku1214. [DOI] [PMC free article] [PubMed] [Google Scholar]
- 3.Mustoe AM, Brooks CL, 3rd, Al-Hashimi HM. Topological constraints are major determinants of tRNA tertiary structure and dynamics and provide basis for tertiary folding cooperativity. Nucleic Acids Res. 2014;42:11792–804. doi: 10.1093/nar/gku807. [DOI] [PMC free article] [PubMed] [Google Scholar]
- 4.Zuo X, Wang J, Yu P, Eyler D, Xu H, Starich MR, et al. Solution structure of the cap-independent translational enhancer and ribosome-binding element in the 3′ UTR of turnip crinkle virus. Proc Natl Acad Sci U S A. 2010;107:1385–90. doi: 10.1073/pnas.0908140107. [DOI] [PMC free article] [PubMed] [Google Scholar]
- 5.Keane SC, Heng X, Lu K, Kharytonchyk S, Ramakrishnan V, Carter G, et al. RNA structure. Structure of the HIV-1 RNA packaging signal. Science. 2015;348:917–21. doi: 10.1126/science.aaa9266. [DOI] [PMC free article] [PubMed] [Google Scholar]
- 6.Burke JE, Sashital DG, Zuo X, Wang YX, Butcher SE. Structure of the yeast U2/U6 snRNA complex. RNA. 2012;18:673–83. doi: 10.1261/rna.031138.111. [DOI] [PMC free article] [PubMed] [Google Scholar]
- 7.Fang X, Wang J, O’Carroll IP, Mitchell M, Zuo X, Wang Y, et al. An unusual topological structure of the HIV-1 Rev response element. Cell. 2013;155:594–605. doi: 10.1016/j.cell.2013.10.008. [DOI] [PMC free article] [PubMed] [Google Scholar]
- 8.Fang X, Stagno JR, Bhandari YR, Zuo X, Wang YX. Small-angle X-ray scattering: a bridge between RNA secondary structures and three-dimensional topological structures. Curr Opin Struct Biol. 2015;30:147–60. doi: 10.1016/j.sbi.2015.02.010. [DOI] [PMC free article] [PubMed] [Google Scholar]
- 9.Grishaev A, Tugarinov V, Kay LE, Trewhella J, Bax A. Refined solution structure of the 82-kDa enzyme malate synthase G from joint NMR and synchrotron SAXS restraints. Journal of biomolecular NMR. 2008;40:95–106. doi: 10.1007/s10858-007-9211-5. [DOI] [PubMed] [Google Scholar]
- 10.Zuo X, Wang J, Foster TR, Schwieters CD, Tiede DM, Butcher SE, et al. Global molecular structure and interfaces: refining an RNA:RNA complex structure using solution X-ray scattering data. J Am Chem Soc. 2008;130:3292–3. doi: 10.1021/ja7114508. [DOI] [PubMed] [Google Scholar]
- 11.Zuo X, Cui G, Merz KM, Jr, Zhang L, Lewis FD, Tiede DM. X-ray diffraction “fingerprinting” of DNA structure in solution for quantitative evaluation of molecular dynamics simulation. Proc Natl Acad Sci U S A. 2006;103:3534–9. doi: 10.1073/pnas.0600022103. [DOI] [PMC free article] [PubMed] [Google Scholar]
- 12.Jain S, Richardson DC, Richardson JS. Computational Methods for RNA Structure Validation and Improvement. Methods Enzymol. 2015;558:181–212. doi: 10.1016/bs.mie.2015.01.007. [DOI] [PubMed] [Google Scholar]
- 13.Cheng CY, Chou FC, Kladwang W, Tian S, Cordero P, Das R. Consistent global structures of complex RNA states through multidimensional chemical mapping. Elife. 2015;4:e07600. doi: 10.7554/eLife.07600. [DOI] [PMC free article] [PubMed] [Google Scholar]
- 14.Cruz JA, Blanchet MF, Boniecki M, Bujnicki JM, Chen SJ, Cao S, et al. RNA-Puzzles: a CASP-like evaluation of RNA three-dimensional structure prediction. RNA. 2012;18:610–25. doi: 10.1261/rna.031054.111. [DOI] [PMC free article] [PubMed] [Google Scholar]
- 15.Fischer N, Neumann P, Konevega AL, Bock LV, Ficner R, Rodnina MV, et al. Structure of the E. coli ribosome-EF-Tu complex at <3 A resolution by Cs-corrected cryo-EM. Nature. 2015;520:567–70. doi: 10.1038/nature14275. [DOI] [PubMed] [Google Scholar]
- 16.Bartesaghi A, Merk A, Banerjee S, Matthies D, Wu X, Milne JL, et al. 2.2 A resolution cryo-EM structure of beta-galactosidase in complex with a cell-permeant inhibitor. Science. 2015;348:1147–51. doi: 10.1126/science.aab1576. [DOI] [PMC free article] [PubMed] [Google Scholar]
- 17.Gong Z, Schwieters CD, Tang C. Conjoined use of EM and NMR in RNA structure refinement. PLoS One. 2015;10:e0120445. doi: 10.1371/journal.pone.0120445. [DOI] [PMC free article] [PubMed] [Google Scholar]
- 18.Miyazaki Y, Irobalieva RN, Tolbert BS, Smalls-Mantey A, Iyalla K, Loeliger K, et al. Structure of a conserved retroviral RNA packaging element by NMR spectroscopy and cryo-electron tomography. J Mol Biol. 2010;404:751–72. doi: 10.1016/j.jmb.2010.09.009. [DOI] [PMC free article] [PubMed] [Google Scholar]
- 19.Grishaev A, Ying J, Canny MD, Pardi A, Bax A. Solution structure of tRNAVal from refinement of homology model against residual dipolar coupling and SAXS data. Journal of biomolecular NMR. 2008;42:99–109. doi: 10.1007/s10858-008-9267-x. [DOI] [PMC free article] [PubMed] [Google Scholar]
- 20.Wang YX, Zuo X, Wang J, Yu P, Butcher SE. Rapid global structure determination of large RNA and RNA complexes using NMR and small-angle X-ray scattering. Methods. 2010;52:180–91. doi: 10.1016/j.ymeth.2010.06.009. [DOI] [PMC free article] [PubMed] [Google Scholar]
- 21.Parisien M, Major F. The MC-Fold and MC-Sym pipeline infers RNA structure from sequence data. Nature. 2008;452:51–5. doi: 10.1038/nature06684. [DOI] [PubMed] [Google Scholar]
- 22.Schwieters CD, Kuszewski JJ, Clore GM. Using Xplor-NIH for NMR molecular structure determination. Prog Nucl Mag Res Sp. 2006;48:47–62. doi: 10.1016/s1090-7807(02)00014-9. [DOI] [PubMed] [Google Scholar]
- 23.Wang J, Zuo X, Yu P, Xu H, Starich MR, Tiede DM, et al. A method for helical RNA global structure determination in solution using small-angle x-ray scattering and NMR measurements. J Mol Biol. 2009;393:717–34. doi: 10.1016/j.jmb.2009.08.001. [DOI] [PMC free article] [PubMed] [Google Scholar]
- 24.Al-Hashimi HM, Valafar H, Terrell M, Zartler ER, Eidsness MK, Prestegard JH. Variation of molecular alignment as a means of resolving orientational ambiguities in protein structures from dipolar couplings. J Magn Reson. 2000;143:402–6. doi: 10.1006/jmre.2000.2049. [DOI] [PubMed] [Google Scholar]
- 25.Latham MP, Hanson P, Brown DJ, Pardi A. Comparison of alignment tensors generated for native tRNA(Val) using magnetic fields and liquid crystalline media. Journal of biomolecular NMR. 2008;40:83–94. doi: 10.1007/s10858-007-9212-4. [DOI] [PMC free article] [PubMed] [Google Scholar]
- 26.Bardaro MF, Jr, Varani G. Independent alignment of RNA for dynamic studies using residual dipolar couplings. Journal of biomolecular NMR. 2012;54:69–80. doi: 10.1007/s10858-012-9655-0. [DOI] [PubMed] [Google Scholar]
- 27.Ying J, Grishaev A, Latham MP, Pardi A, Bax A. Magnetic field induced residual dipolar couplings of imino groups in nucleic acids from measurements at a single magnetic field. Journal of biomolecular NMR. 2007;39:91–6. doi: 10.1007/s10858-007-9181-7. [DOI] [PubMed] [Google Scholar]
- 28.Rinke J, Appel B, Digweed M, Luhrmann R. Localization of a base-paired interaction between small nuclear RNAs U4 and U6 in intact U4/U6 ribonucleoprotein particles by psoralen cross-linking. J Mol Biol. 1985;185:721–31. doi: 10.1016/0022-2836(85)90057-9. [DOI] [PubMed] [Google Scholar]
- 29.Hashimoto C, Steitz JA. U4 and U6 RNAs coexist in a single small nuclear ribonucleoprotein particle. Nucleic Acids Res. 1984;12:3283–93. doi: 10.1093/nar/12.7.3283. [DOI] [PMC free article] [PubMed] [Google Scholar]
- 30.Zucker-Aprison E, Thomas JD, Blumenthal T. C. elegans snRNAs: a model for U4/U6 base pairing. Nucleic Acids Res. 1988;16:7188. doi: 10.1093/nar/16.14.7188. [DOI] [PMC free article] [PubMed] [Google Scholar]
- 31.Brow DA, Guthrie C. Spliceosomal RNA U6 is remarkably conserved from yeast to mammals. Nature. 1988;334:213–8. doi: 10.1038/334213a0. [DOI] [PubMed] [Google Scholar]
- 32.Nguyen TH, Galej WP, Bai XC, Savva CG, Newman AJ, Scheres SH, et al. The architecture of the spliceosomal U4/U6.U5 tri-snRNP. Nature. 2015;523:47–52. doi: 10.1038/nature14548. [DOI] [PMC free article] [PubMed] [Google Scholar]
- 33.Fabrizio P, Dannenberg J, Dube P, Kastner B, Stark H, Urlaub H, et al. The evolutionarily conserved core design of the catalytic activation step of the yeast spliceosome. Mol Cell. 2009;36:593–608. doi: 10.1016/j.molcel.2009.09.040. [DOI] [PubMed] [Google Scholar]
- 34.Maeder C, Kutach AK, Guthrie C. ATP-dependent unwinding of U4/U6 snRNAs by the Brr2 helicase requires the C terminus of Prp8. Nat Struct Mol Biol. 2009;16:42–8. doi: 10.1038/nsmb.1535. [DOI] [PMC free article] [PubMed] [Google Scholar]
- 35.Mozaffari-Jovin S, Santos KF, Hsiao HH, Will CL, Urlaub H, Wahl MC, et al. The Prp8 RNase H-like domain inhibits Brr2-mediated U4/U6 snRNA unwinding by blocking Brr2 loading onto the U4 snRNA. Genes Dev. 2012;26:2422–34. doi: 10.1101/gad.200949.112. [DOI] [PMC free article] [PubMed] [Google Scholar]
- 36.Mozaffari-Jovin S, Wandersleben T, Santos KF, Will CL, Luhrmann R, Wahl MC. Inhibition of RNA helicase Brr2 by the C-terminal tail of the spliceosomal protein Prp8. Science. 2013;341:80–4. doi: 10.1126/science.1237515. [DOI] [PubMed] [Google Scholar]
- 37.Raghunathan PL, Guthrie C. RNA unwinding in U4/U6 snRNPs requires ATP hydrolysis and the DEIH-box splicing factor Brr2. Curr Biol. 1998;8:847–55. doi: 10.1016/s0960-9822(07)00345-4. [DOI] [PubMed] [Google Scholar]
- 38.Zhang L, Li X, Hill RC, Qiu Y, Zhang W, Hansen KC, et al. Brr2 plays a role in spliceosomal activation in addition to U4/U6 unwinding. Nucleic Acids Res. 2015;43:3286–97. doi: 10.1093/nar/gkv062. [DOI] [PMC free article] [PubMed] [Google Scholar]
- 39.Hang J, Wan R, Yan C, Shi Y. Structural basis of pre-mRNA splicing. Science. 2015 doi: 10.1126/science.aac8159. [DOI] [PubMed] [Google Scholar]
- 40.Keating KS, Toor N, Perlman PS, Pyle AM. A structural analysis of the group II intron active site and implications for the spliceosome. RNA. 2010;16:1–9. doi: 10.1261/rna.1791310. [DOI] [PMC free article] [PubMed] [Google Scholar]
- 41.Fica SM, Mefford MA, Piccirilli JA, Staley JP. Evidence for a group II intron-like catalytic triplex in the spliceosome. Nat Struct Mol Biol. 2014;21:464–71. doi: 10.1038/nsmb.2815. [DOI] [PMC free article] [PubMed] [Google Scholar]
- 42.Schwieters CD, Clore GM. Using small angle solution scattering data in Xplor-NIH structure calculations. Prog Nucl Magn Reson Spectrosc. 2014;80:1–11. doi: 10.1016/j.pnmrs.2014.03.001. [DOI] [PMC free article] [PubMed] [Google Scholar]
- 43.Lu K, Heng X, Garyu L, Monti S, Garcia EL, Kharytonchyk S, et al. NMR detection of structures in the HIV-1 5′-leader RNA that regulate genome packaging. Science. 2011;334:242–5. doi: 10.1126/science.1210460. [DOI] [PMC free article] [PubMed] [Google Scholar]
- 44.Hansen MR, Mueller L, Pardi A. Tunable alignment of macromolecules by filamentous phage yields dipolar coupling interactions. Nat Struct Biol. 1998;5:1065–74. doi: 10.1038/4176. [DOI] [PubMed] [Google Scholar]
- 45.Ulmer TS, Ramirez BE, Delaglio F, Bax A. Evaluation of backbone proton positions and dynamics in a small protein by liquid crystal NMR spectroscopy. J Am Chem Soc. 2003;125:9179–91. doi: 10.1021/ja0350684. [DOI] [PubMed] [Google Scholar]
- 46.Ying J, Wang J, Grishaev A, Yu P, Wang YX, Bax A. Measurement of (1)H-(15)N and (1)H-(13)C residual dipolar couplings in nucleic acids from TROSY intensities. Journal of biomolecular NMR. 2011;51:89–103. doi: 10.1007/s10858-011-9544-y. [DOI] [PMC free article] [PubMed] [Google Scholar]
- 47.Sass J, Cordier F, Hoffmann A, Cousin A, Omichinski JG, Lowen H, et al. Purple membrane induced alignment of biological macromolecules in the magnetic field. Journal of the American Chemical Society. 1999;121:2047–55. [Google Scholar]
- 48.Musselman C, Pitt SW, Gulati K, Foster LL, Andricioaei I, Al-Hashimi HM. Impact of static and dynamic A-form heterogeneity on the determination of RNA global structural dynamics using NMR residual dipolar couplings. Journal of biomolecular NMR. 2006;36:235–49. doi: 10.1007/s10858-006-9087-9. [DOI] [PubMed] [Google Scholar]
- 49.Allain FH, Varani G. Structure of the P1 helix from group I self-splicing introns. J Mol Biol. 1995;250:333–53. doi: 10.1006/jmbi.1995.0381. [DOI] [PubMed] [Google Scholar]
- 50.Jucker FM, Heus HA, Yip PF, Moors EH, Pardi A. A network of heterogeneous hydrogen bonds in GNRA tetraloops. J Mol Biol. 1996;264:968–80. doi: 10.1006/jmbi.1996.0690. [DOI] [PubMed] [Google Scholar]
- 51.Falb M, Amata I, Gabel F, Simon B, Carlomagno T. Structure of the K-turn U4 RNA: a combined NMR and SANS study. Nucleic Acids Res. 2010;38:6274–85. doi: 10.1093/nar/gkq380. [DOI] [PMC free article] [PubMed] [Google Scholar]
- 52.Zweckstetter M, Bax A. Evaluation of uncertainty in alignment tensors obtained from dipolar couplings. Journal of biomolecular NMR. 2002;23:127–37. doi: 10.1023/a:1016316415261. [DOI] [PubMed] [Google Scholar]
- 53.Murphy MC, Rasnik I, Cheng W, Lohman TM, Ha T. Probing single-stranded DNA conformational flexibility using fluorescence spectroscopy. Biophys J. 2004;86:2530–7. doi: 10.1016/S0006-3495(04)74308-8. [DOI] [PMC free article] [PubMed] [Google Scholar]
- 54.Liu Y, Holmstrom E, Zhang J, Yu P, Wang J, Dyba MA, et al. Synthesis and applications of RNAs with position-selective labelling and mosaic composition. Nature. 2015;522:368–72. doi: 10.1038/nature14352. [DOI] [PMC free article] [PubMed] [Google Scholar]
- 55.Mathews DH, Turner DH. Prediction of RNA secondary structure by free energy minimization. Curr Opin Struct Biol. 2006;16:270–8. doi: 10.1016/j.sbi.2006.05.010. [DOI] [PubMed] [Google Scholar]
- 56.Lescoute A, Westhof E. Topology of three-way junctions in folded RNAs. RNA. 2006;12:83–93. doi: 10.1261/rna.2208106. [DOI] [PMC free article] [PubMed] [Google Scholar]
- 57.Batey RT, Williamson JR. Effects of polyvalent cations on the folding of an rRNA three-way junction and binding of ribosomal protein S15. RNA. 1998;4:984–97. doi: 10.1017/s1355838298980426. [DOI] [PMC free article] [PubMed] [Google Scholar]
- 58.Hardin JW, Warnasooriya C, Kondo Y, Nagai K, Rueda D. Assembly and dynamics of the U4/U6 di-snRNP by single-molecule FRET. Nucleic Acids Res. 2015 doi: 10.1093/nar/gkv1011. [DOI] [PMC free article] [PubMed] [Google Scholar]
- 59.Liu S, Ghalei H, Luhrmann R, Wahl MC. Structural basis for the dual U4 and U4atac snRNA-binding specificity of spliceosomal protein hPrp31. RNA. 2011;17:1655–63. doi: 10.1261/rna.2690611. [DOI] [PMC free article] [PubMed] [Google Scholar]
- 60.Mougin A, Gottschalk A, Fabrizio P, Luhrmann R, Branlant C. Direct probing of RNA structure and RNA-protein interactions in purified HeLa cell’s and yeast spliceosomal U4/U6.U5 tri-snRNP particles. J Mol Biol. 2002;317:631–49. doi: 10.1006/jmbi.2002.5451. [DOI] [PubMed] [Google Scholar]
- 61.Nottrott S, Urlaub H, Luhrmann R. Hierarchical, clustered protein interactions with U4/U6 snRNA: a biochemical role for U4/U6 proteins. EMBO J. 2002;21:5527–38. doi: 10.1093/emboj/cdf544. [DOI] [PMC free article] [PubMed] [Google Scholar]
- 62.Vidovic I, Nottrott S, Hartmuth K, Luhrmann R, Ficner R. Crystal structure of the spliceosomal 15.5kD protein bound to a U4 snRNA fragment. Mol Cell. 2000;6:1331–42. doi: 10.1016/s1097-2765(00)00131-3. [DOI] [PubMed] [Google Scholar]
- 63.Liu S, Mozaffari-Jovin S, Wollenhaupt J, Santos KF, Theuser M, Dunin-Horkawicz S, et al. A composite double-/single-stranded RNA-binding region in protein Prp3 supports tri-snRNP stability and splicing. Elife. 2015;4 doi: 10.7554/eLife.07320. [DOI] [PMC free article] [PubMed] [Google Scholar]
- 64.Milligan JF, Uhlenbeck OC. Synthesis of small RNAs using T7 RNA polymerase. Methods Enzymol. 1989;180:51–62. doi: 10.1016/0076-6879(89)80091-6. [DOI] [PubMed] [Google Scholar]
- 65.Burke JE, Butcher SE. Nucleic acid structure characterization by small angle X-ray scattering (SAXS) Curr Protoc Nucleic Acid Chem. 2012:18. doi: 10.1002/0471142700.nc0718s51. Chapter 7:Unit7. [DOI] [PMC free article] [PubMed] [Google Scholar]
- 66.Delaglio F, Grzesiek S, Vuister GW, Zhu G, Pfeifer J, Bax A. NMRPipe: a multidimensional spectral processing system based on UNIX pipes. Journal of biomolecular NMR. 1995;6:277–93. doi: 10.1007/BF00197809. [DOI] [PubMed] [Google Scholar]
- 67.Schwieters CD, Kuszewski JJ, Tjandra N, Clore GM. The Xplor-NIH NMR molecular structure determination package. J Magn Reson. 2003;160:65–73. doi: 10.1016/s1090-7807(02)00014-9. [DOI] [PubMed] [Google Scholar]
- 68.Tian Y, Schwieters CD, Opella SJ, Marassi FM. A practical implicit solvent potential for NMR structure calculation. J Magn Reson. 2014;243:54–64. doi: 10.1016/j.jmr.2014.03.011. [DOI] [PMC free article] [PubMed] [Google Scholar]
- 69.Schwieters CD, Clore GM. The VMD-XPLOR visualization package for NMR structure refinement. J Magn Reson. 2001;149:239–44. doi: 10.1006/jmre.2001.2300. [DOI] [PubMed] [Google Scholar]
- 70.Roy R, Hohng S, Ha T. A practical guide to single-molecule FRET. Nat Methods. 2008;5:507–16. doi: 10.1038/nmeth.1208. [DOI] [PMC free article] [PubMed] [Google Scholar]
- 71.Aitken CE, Marshall RA, Puglisi JD. An oxygen scavenging system for improvement of dye stability in single-molecule fluorescence experiments. Biophys J. 2008;94:1826–35. doi: 10.1529/biophysj.107.117689. [DOI] [PMC free article] [PubMed] [Google Scholar]
- 72.Friedman LJ, Chung J, Gelles J. Viewing dynamic assembly of molecular complexes by multi-wavelength single-molecule fluorescence. Biophys J. 2006;91:1023–31. doi: 10.1529/biophysj.106.084004. [DOI] [PMC free article] [PubMed] [Google Scholar]
- 73.Bronson JE, Fei J, Hofman JM, Gonzalez RL, Jr, Wiggins CH. Learning rates and states from biophysical time series: a Bayesian approach to model selection and single-molecule FRET data. Biophys J. 2009;97:3196–205. doi: 10.1016/j.bpj.2009.09.031. [DOI] [PMC free article] [PubMed] [Google Scholar]
Associated Data
This section collects any data citations, data availability statements, or supplementary materials included in this article.