Abstract
Purpose
It has been tacitly assumed that overall extraocular muscle (EOM) volume is conserved during contraction and relaxation, yet this assumption has been untested up to now. We used high-resolution magnetic resonance imaging (MRI) to determine if total EOM volume changes during relaxation and contraction.
Methods
Surface coil MRI in quasi-coronal planes was obtained in target-controlled, maximal secondary gaze positions in 30 orbits of 15 normal subjects at 312-μm resolution. Ductions were quantified by changes in globe-optic nerve positions. Cross-sections of EOM were manually outlined in contiguous image planes so that volumes could be calculated by multiplying summed cross sections by the 2-mm slice thickness. Three-dimensional reconstruction allowed measurement of the lengths of terminal, unresolvable EOM segments, providing estimates of terminal EOM volumes to be summed with measured midorbital volumes to obtain total EOM volumes.
Results
Duction range averaged 44.3 ± 4.8° from relaxation to contraction. There was a significant increase in total volume in each rectus EOM from relaxation to contraction: superior rectus (SR) 92 ± 36 mm3 (+18%, P < 10−11); inferior rectus (IR) 51 ± 18 mm3 (+9%, P < 10−11); medial rectus (MR) 78 ± 36 mm3 (+11%, P < 10−5); and lateral rectus (LR) 47 ± 45 mm3 (+7%, P = 0.005). Because volume changes for SR and MR exceed IR and LR, total rectus EOM volume increases in supraduction 41 ± 42 mm3 (+3.7%) and adduction 32 ± 63 mm3 (+2.3%).
Conclusions
Total EOM volume is not conserved but instead increases with contraction and decreased with relaxation. Contractile volume increases may be secondary to increased actin-myosin lattice spacing, so that density decreases. This effect is opposite that of possible hemodynamic changes.
Keywords: extra-ocular muscles, magnetic resonance imaging
Magnetic resonance imaging (MRI) has been used to quantify passive (hypertrophy versus atrophy)1–4 and active (contraction versus relaxation)5–9 properties of extraocular muscles (EOMs) based on anatomic measures. On magnetic resonance imaging, a contracting EOM exhibits an increase in maximum cross-sectional area, a shift of the plane of maximum cross-sectional area posteriorly, and an increase in posterior muscle volume.2,5,9 These morphologic changes have up to now been assumed to be caused by shifting volume within the EOM belly rather than an overall increase in total EOM volume. On the other hand, increases or decreases in total EOM volume are thought to reflect long-term structural changes such as hypertrophy or atrophy.3,4 Implicit within this analysis, however, is the assumption that total EOM volume is normally conserved, so actual increases or decreases in volume must reflect long-term alterations from the baseline state. Thus, EOM volume measurements obtained without techniques to standardize gaze positions have been used to help define pathologic conditions such as hypertrophy and enlargement in dysthyroid orbitopathy10,11 and superior oblique (SO) atrophy in SO palsy.12–15
Until now, the assumption of conservation of EOM volume has not been directly tested because technical limitations in MRI techniques prevented high-resolution imaging of the entire EOM belly. For gaze-controlled MRI, images for each gaze position typically must be acquired within 3 minutes, before subject fatigue created by maintaining that gaze position introduces motion artifacts that degrade resolution.16 However, improved MRI techniques now allow high-resolution imaging of the entire length of each EOM within that time constraint without requiring administration of intravenous contrast.17 Moreover, a recent MRI study correlating changes in posterior EOM volume with vertical ductions found highly significant correlations between duction and changes in EOM volume spanning large regions, up to 22 mm of the midorbital longitudinal extent of each vertical rectus EOM.18 Inclusion of such a large central segment of the EOM belly leaves unmeasured only relatively small volumes at the origin and insertion. The strong correlation with duction of a measure including most of the EOM volume is at least suggestive that total EOM volume might increase with contraction and decrease with relaxation. This study was undertaken to determine whether total EOM volume is conserved or instead changes during contraction and relaxation. Volume change would have significant structural and functional implications for understanding EOM biomechanics.
Methods
Using advertisements, 15 normal adult volunteers were recruited and screened by an ophthalmologist (JLD) to verify normal ocular motility, vision, anatomy, and stereoacuity. According to a protocol approved by the Institutional Review Board for Protection of Human Subjects at the University of California, Los Angeles, and conforming to the tenets of the Declaration of Helsinki, all subjects gave written informed consent prior to participation in research procedures.
A scanner (1.5-T Signa; General Electric, Milwaukee, WI, USA) was used to perform MRI with techniques described in detail elsewhere, including foam head stabilization, fixation targets to control gaze position, and a dual-phased surface coil array (Medical Advances, Milwaukee, WI, USA) to improve signal-to-noise ratio.3,5,9,17 Employing 1.5-T magnetic field strength avoids imaging artifacts problematic for the orbit when imaging with stronger fields. Initially, lower resolution scout images, either axial or sagittal, were used to guide subsequent imaging. High-resolution images were obtained using T2 fast spin echo sequences whose details have been previously published.17 For each orbit and imaging plane employed, MRI acquisition parameters were identical for all gaze positions, compensating for the quantitative effects of any possible small dimensional errors on interpretation of gaze-related changes in EOMs. For analysis, quasi-coronal images perpendicular to the long axis of the orbit were obtained at 2-mm intervals using an 8-cm field of view (256 × 256 matrix, 312-μm pixel resolution). There were two special modifications to the published MRI protocol: imaging was only analyzed in maximal supraduction, infraduction, abduction, or adduction by the fixating eye; and a larger extent of each orbit, 19 to 24 images planes (38–48 mm), was selected to completely image the entire anteroposterior extent of each analyzed EOM.
We used ImageJ (http://imagej.nih.gov/ij/; provided in the public domain by the National Institutes of Health, Bethesda, MD, USA) and a computing environment (MATLAB; MathWorks, Inc., Natick, MA, USA) to quantify the digital images. The angles of ocular duction were calculated in degrees by the movement of the globe/optic nerve junction using techniques described in detail elsewhere.3,5,9,16
Quantitative analysis of MRI was performed only in images free of significant motion artifacts that might blur the margins of EOM contours. Two different techniques were employed to calculate the total EOM volume for each gaze position. The first technique directly measured the EOM volume for all but the terminal portions of the EOM belly. Bellies were manually outlined and cropped in each image slice as far posteriorly and anteriorly as the EOM could be distinguished from surrounding orbital connective tissue and the globe, then saved individually as tagged image file format files. Custom software (MathWorks, Inc.) enumerated the pixels in each EOM cross-section, converted these into calibrated areas (mm2), summed them in all image planes that included an identifiable EOM cross section, and finally converted the summed areas into volumes (mm3) by multiplying by the 2-mm slice thickness.
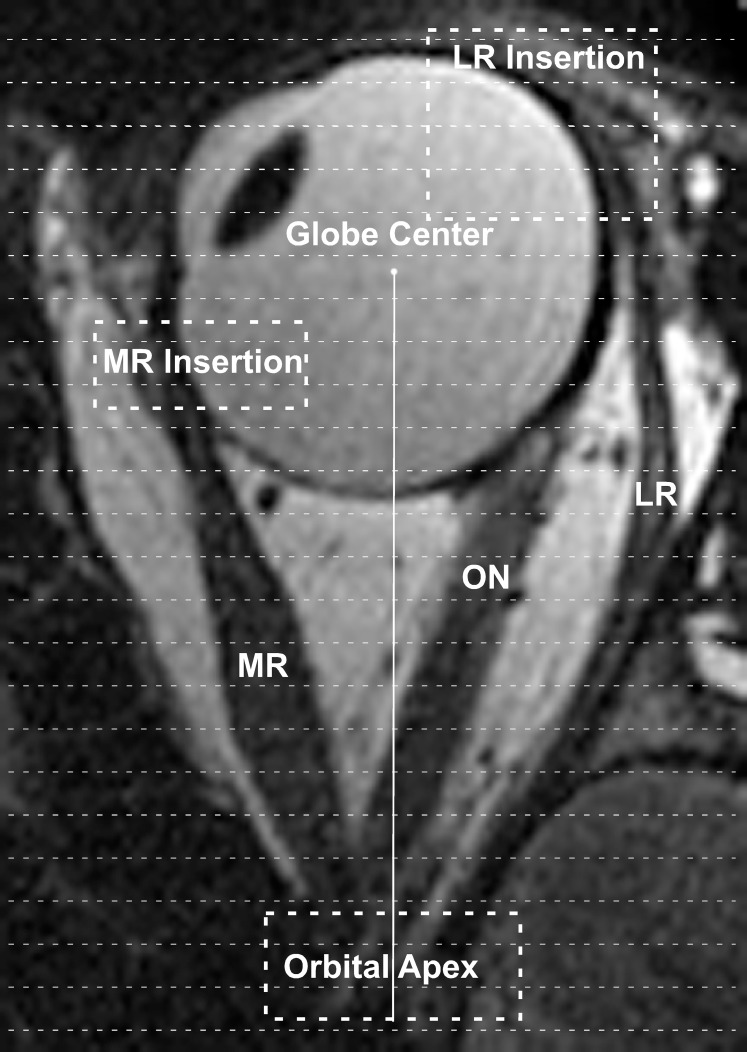
The second technique added an estimate of the unmeasured terminal EOM volumes posteriorly, near the orbital apex, and anteriorly, near the EOM insertion, where it was impossible to reliably distinguish the EOM cross sections from surrounding tissues (Fig. 1). Using previously described methods, the position of each measured EOM cross section was calculated relative to globe center using a three-dimensional rotation matrix and extraorbital anatomic landmarks.16 Then, the anteroposterior distance from globe center to orbital apex was directly measured using ImageJ from either the axial or sagittal scout images. The difference between the measured distance to the orbital apex in longitudinal scans and the anteroposterior location of the most posterior measured EOM cross section represented the length of unmeasured posterior EOM belly. This unmeasured length was divided by 2 mm to estimate the number of additional MRI slices required to completely encompass the apical portion of the EOM. Finally, to estimate the volume contained within this apical segment, the most posterior measured EOM cross-sectional area was carried posteriorly as the cross-sectional area of each of the unmeasured image planes. For example, if the above analysis revealed that a 4-mm length of the posterior EOM belly was not directly measured, the volume of the unmeasured 4-mm posterior segment was estimated by multiplying the most posterior measured cross-sectional area by the 2-mm slice thickness, then by two again to account for the two additional MRI slices required to completely encompass the terminal 4-mm segment.
Figure 1.
Axial magnetic resonance image of the left eye in adduction. The terminal cross-sectional areas of the MR and LR near the orbital apex and insertions onto the globe (enclosed dashed rectangles) could not be directly measured on coronal imaging. Volumes within these regions were estimated by dividing the segments of unresolvable cross sections into 2-mm slices (thin dashed lines). The number of slices required to span the terminal segments was multiplied by the terminal measured cross-sectional areas and then by the 2-mm slice thickness. ON, optic nerve.
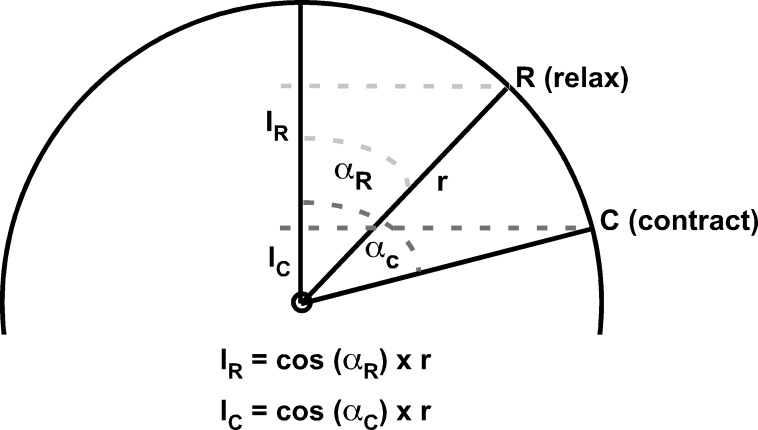
A similar technique was used to estimate the anteroposterior length of the unmeasured anterior segment of the EOM. To calculate the anteroposterior distance from globe center to EOM insertion, we assumed a corneal diameter of 12 mm and standard locations for the superior rectus (SR) insertion 7.0 mm posterior to the limbus, inferior rectus (IR) insertion 6.6 mm posterior to the limbus, medial rectus (MR) insertion 5.5 mm posterior to the limbus, and lateral rectus (LR) insertion 6.9 mm posterior to the limbus.19,20 Using measured globe diameters and angles of duction (Fig. 2), the cord distance between the EOM insertion and most anterior measured EOM cross section was calculated, then divided into 2-mm segments to estimate the number of additional MRI slices required to completely encompass the anterior portion of the EOM belly (Fig. 1). Then, to estimate the volume contained within this anterior EOM segment, the most anterior measured EOM cross-sectional area was carried forward as the cross-sectional area for the unmeasured image planes. For example, if the above analysis revealed that a 6-mm length of anterior EOM was not directly measured, the volume of the unmeasured anterior portion was estimated by multiplying the most anterior measured cross-sectional area by the 2-mm slice thickness, then again by three to account for the three additional MRI slices required to completely encompass the anterior extent of the EOM.
Figure 2.
Geometric calculations for the anteroposterior chord locations of EOM insertions. Using measured globe diameters and duction angles, the position of the EOM's insertion (point I) anterior to the globe center was calculated assuming a spherical globe and standard corneal diameters and EOM insertion distances posterior to the limbus. During relaxation (insertion rotates to point R), the distance from the insertion anterior to globe center (IR) exceeds the distance during contraction (IC, insertion rotates to point C). αR, angle displacement from straight-ahead gaze during relaxation; αC, angle displacement from straight-ahead gaze during contraction; r, radius of globe; I, insertion in straight-ahead gaze; R, insertion during relaxation; C, insertion during contraction.
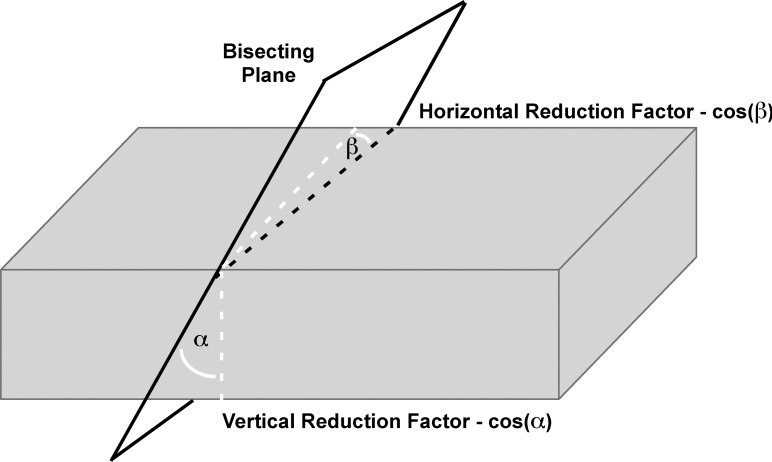
Volume measurements were then corrected for the obliquity of cross sections relative to the long axis of the EOM (Fig. 3).21 Such obliquity results from the generally oblique trajectory of each EOM relative to the long axis of the orbit, as well as from EOM path curvature. The change in position of the EOM area centroid (equivalent to the center of mass) was plotted throughout the anteroposterior extent of the orbit. Changes in the horizontal and vertical coordinates of the bracketing area centroids in consecutive planes were used to compute the horizontal and vertical angular offsets from true orthogonal for each image plane. Measured EOM cross-sectional areas were then multiplied by the cosines of these angles to yield a final total volume corrected for EOM path relative to the image planes.
Figure 3.
Correction for imaging planes nonorthogonal to EOM paths. Because image plane obliquity (dashed white lines) increases measured cross-sectional area, reductions proportional to the cosines of the oblique vertical angle α and horizontal angle β were applied to reduce measured area.
Total EOM volume was then calculated as the sum of the corrected measured EOM volume and the estimated unmeasured anterior and posterior terminal EOM volumes. Statistical comparisons were made using paired t-tests for both the measured and total EOM volumes between maximal relaxation (duction away from the EOM) and maximal contraction (duction toward the EOM), with a 0.05 level chosen for statistical significance.
Results
Subject ages ranged from 18 to 27 years (average 21.1 ± 2.1, SD). Nine subjects (18 orbits) completed only vertical ductions; three subjects (six orbits) completed only horizontal ductions; and three subjects (six orbits) completed both horizontal and vertical ductions. The average maximal change in duction from relaxation to contraction was 44.3 ± 4.8° (supraduction 22.0 ± 3.4°, infraduction 21.2 ± 4.2°, abduction 19.4 ± 3.9°, and adduction 27.3 ± 3.3°). Measured and total EOM volumes are summarized in Table 1. Each EOM showed highly significantly greater measured volumes and total volumes during contraction than during relaxation.
Table 1.
Change in Volume Between Relaxation and Contraction
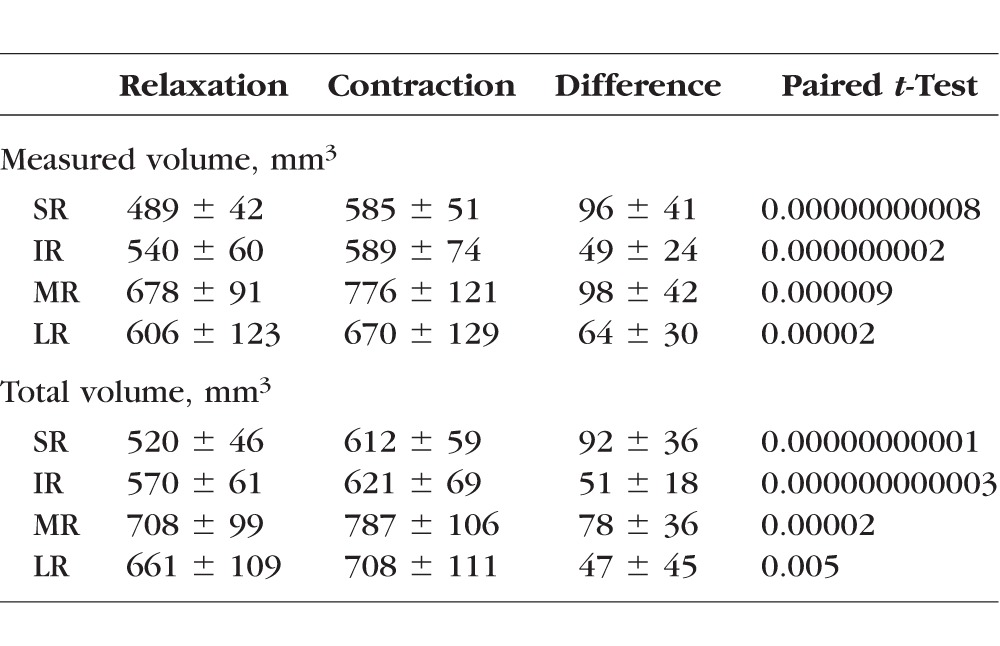
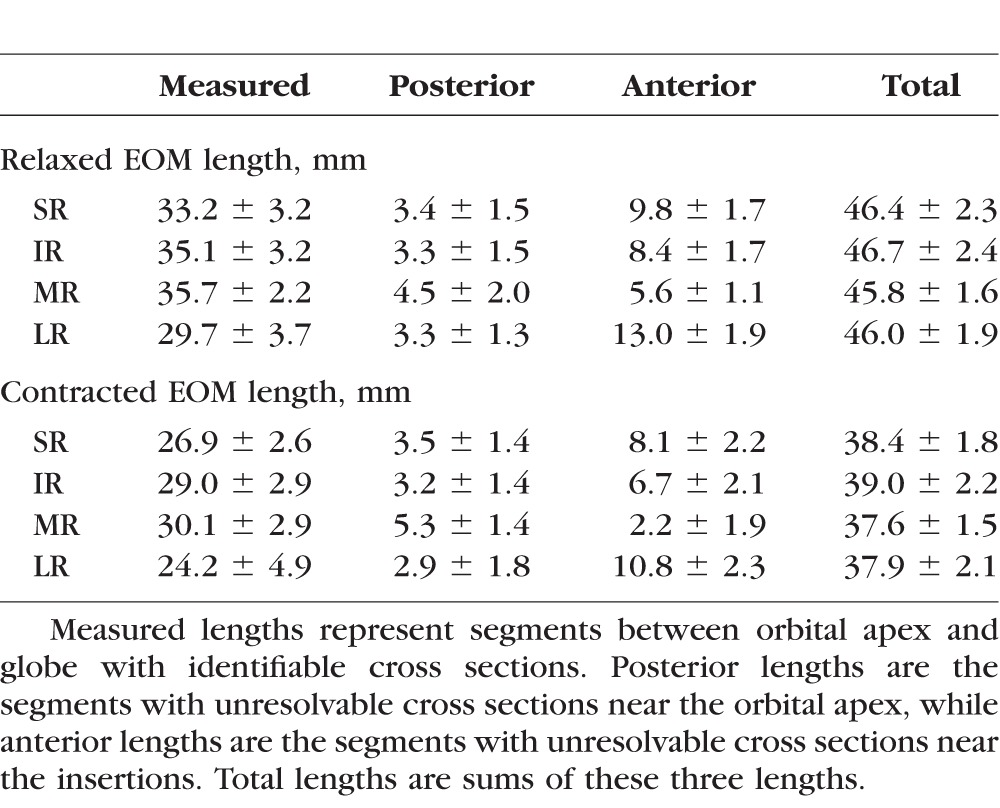
Table 2 summarizes the lengths of measured and unmeasured segments of EOMs. For each rectus EOM, the length of the posterior unresolvable segment near the orbital apex was similar between contracted and relaxed states, resulting in nearly identical numbers of 2-mm cross sections added to calculate the estimated posterior volume. Relaxed EOMs, however, had longer segments of anterior, unmeasured cross sections than did contracted EOMs because of the longer relaxed path lengths arc more widely around the globe. Because the anterior unresolvable segment was longer in the relaxed state, one or two additional 2-mm cross sections were typically needed to calculate the estimated anterior volume for the relaxed state compared with the contracted state. The extraocular muscle belly tapers into a smaller cross section and becomes tendinous approaching its insertion, so multiplying those additional anterior cross sections by the most anterior resolvable cross-sectional area probably caused a slightly greater overestimation of anterior volume during relaxation than contraction.
Table 2.
Anteroposterior Lengths of EOMs
Discussion
This study reports the novel and surprising finding that EOM volume is not conserved during gaze changes, but instead increases during contraction and decreases during relaxation. The difference in volume was greatest for the SR (+18% with contraction), intermediate for the MR (+11%) and IR (+9%), and least for the LR (+7%). Because the volume changes are greater for SR than antagonist IR, and greater for MR than antagonist LR, the total volume of all EOMs in the entire orbit increased with supraduction by 41 ± 42 mm3 (+3.7%) and with adduction by 32 ± 63 mm3 (+2.3%).
There are two plausible explanations for the contractile increase in total EOM volume: increased blood volume within contracting EOMs or changes in internal structures with corresponding decreased EOM density. While there is evidence that repetitive active contraction of large skeletal muscles increases arterial blood flow to the contracting muscle,22 static changes in globe position have not been shown to produce similar hemodynamic changes within EOMs. Instead, the arterial blood flow to EOMs in alert mammals appears steady at a higher rate than skeletal muscle regardless of gaze position.23 The increased tension created by contraction should be associated with higher intramuscular pressure that would reduce venous blood volume and thus decrease the total volume, opposite the EOM volume changes observed here. However, more studies are required to determine the actual contribution of possible blood volume changes in human EOMs during contraction.
Rather than a hemodynamic effect, the more likely explanation is that either the myofibril density decreases or the tertiary structure of interacting actin and myosin filaments changes during contraction to increase EOM volume while simultaneously decreasing EOM density. Changes in actin and myosin filaments have been described in frog sartorius muscle using x-ray diffraction.24 During induced rigor, the myosin helix develops increased filament spacing to give an average 34% decrease in muscle density.24 Unlike most inert, nonbiologic materials, the tertiary structures of many proteins change dramatically in response to changes in their surrounding microenvironments and are not constrained to occupy the same volume in the activated versus deactivated states. Thus, the overall mass of the protein may be conserved, but the volume and density might increase or decrease depending on changes to the tertiary structure. Lest the reader intuitively recoil from this concept, recall that ice floats on liquid water because the density of water decreases when it becomes crystalline ice; this is due to the spacing of the lattice structure of the ice crystal. Increased spacing between EOM fibers during contraction seems improbable, since there is no plausible reason for fluid or other material to be forced between contracting fibers, or to remain there under the presumably increased pressure of fiber contraction.
Unfortunately, even with high-resolution MRI encompassing the entire anteroposterior extent of the orbit, it was not possible to define EOM cross sections throughout the entire anteroposterior extent of each EOM. Estimates were required to completely calculate the total volumes. Even with the errors inherent in any estimation, however, it is not plausible that the large differences in total EOM volumes could have been caused by estimation errors because the estimates only involved the small terminal segments of the EOMs, and the estimates were made deliberately conservative by carrying posteriorly to the end of each EOM the most extreme cross-sectional measurement that was reliable. Histologic examination in our laboratory demonstrates that actual cross sections taper gradually to the origin. Notwithstanding this, the unmeasured volumes at the orbital apex and near the EOM insertions simply were insufficient to account for the significant differences in total volumes observed during EOM contraction and relaxation.
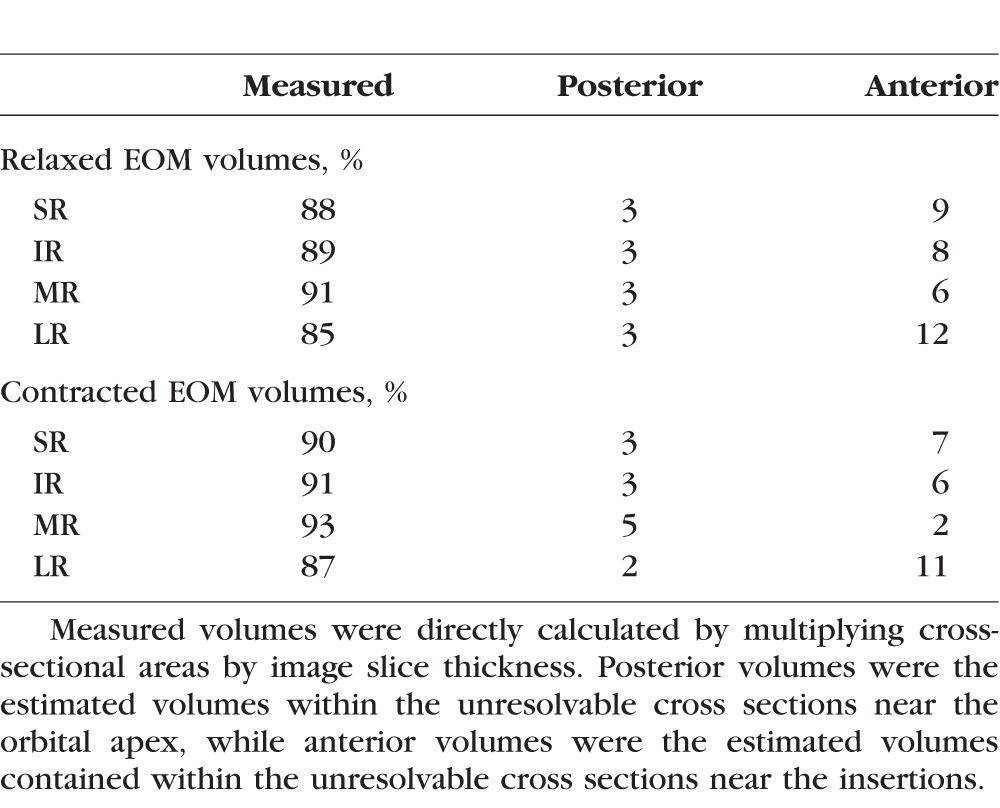
Table 3 summarizes the relative contributions of the measured, estimated posterior, and estimated anterior volumes to the total volumes. Except for the LR, almost 90% of the total volumes were directly measured in both the relaxed and contracted states. In addition, the fusiform shapes of the EOMs place the bulk of the EOM volumes within the midorbit, with a rapid taper of EOM cross sections posterior and especially anteriorly, where the EOMs transition into thin, noncontractile tendons prior to inserting onto the globe. Our method of estimating the unmeasured volumes by carrying forward the most anterior and most posterior measured cross-sectional areas should systematically overestimate the anterior and posterior volumes in direct proportion to the lengths of the unmeasured segments. Thus, this method would preferentially add volume to relaxed EOMs, with longer unmeasured anterior segments, compared with contracted EOMs, especially for the LR that has the longest path around the globe. This overestimation of anterior volume may partially account for the smaller contractile increase in total volume found for LR, although the average angle of abduction was also smaller than the other ductions, so less LR contraction might have contributed as well.
Table 3.
Percent Measured Versus Estimated Volumes
Because total EOM volume varies with contractile state, control of gaze position becomes critical when imaging is performed to evaluate EOM hypertrophy or atrophy. While the effects of gaze position on EOM maximum cross-sectional area and posterior partial volume have been well documented,5–9 the present novel finding of changes in total volume with duction suggests the findings of prior MRI studies that measured total EOM volumes without controlling gaze should be interpreted with caution. For example, a study reporting on the effects of local anesthetic injection into the LR to treat esotropia (ET) found a 6% increase in total LR volume after injection.4 Gaze was not controlled, however, and varied up to 16° between MRI scanning sessions.4 In addition, the authors found a direct correlation between the reduction of ET and increased LR volume, a correlation that might at least be partially explained by imaging the orbit postinjection with the eye in a less adducted position. Without control of gaze direction, changes in total EOM volume cannot be used to accurately estimate EOM hypertrophy or atrophy.
On the other hand, once gaze is controlled within the imaging protocol, these results suggest that the volumes in the terminal portions of the EOMs, near the orbital apex and insertion, can be neglected when calculating total EOM volume. The posterior volumes exhibit virtually no change between contraction and relaxation, while the anterior volumes are primarily composed of the thin tendinous portions that do not contain much volume. For the current study, similar changes were found for directly measured midorbital volumes compared with final total volumes that included corrections for nonorthogonal image planes and estimated terminal volumes, suggesting that those additional analyses may not be necessary for many clinical applications.
In conclusion, total EOM volume actually increases during contraction and decreases during relaxation. The volume changes are opposite those predicted from hemodynamic considerations and may be caused by changes within the actin-myosin lattice spacing so that, as EOM volume increases, density decreases. Because EOM volume is not conserved during gaze changes, control of gaze is important when inferring EOM hypertrophy or atrophy from structural imaging.
Acknowledgments
Supported by National Eye Institute Grant EY08313 and by an unrestricted grant from Research to Prevent Blindness (New York, NY, USA); Joseph L. Demer is Arthur L. Rosenbaum Professor of Pediatric Ophthalmology. The authors alone are responsible for the content and writing of the paper.
Disclosure: R.A. Clark, None; J.L. Demer, None
References
- 1. Demer JL,, Miller JM. Magnetic resonance imaging of the functional anatomy of the superior oblique muscle. Invest Ophthalmol Vis Sci. 1995; 36: 906–913. [PubMed] [Google Scholar]
- 2. Miller JM. Functional anatomy of normal human rectus muscles. Vision Res. 1989; 29: 223–240. [DOI] [PubMed] [Google Scholar]
- 3. Clark RA,, Demer JL. Enhanced vertical rectus contractility by magnetic resonance imaging in superior oblique palsy. Arch Ophthalmol. 2011; 129: 904–908. [DOI] [PMC free article] [PubMed] [Google Scholar]
- 4. Scott AB,, Miller JM,, Shieh KR. Bupivicaine injection of the lateral rectus muscle to treat esotropia. J AAPOS. 2009; 13: 119–122. [DOI] [PubMed] [Google Scholar]
- 5. Clark RA,, Demer JL. Functional morphometry of horizontal rectus extraocular muscles during ocular duction. Invest Ophthalmol Vis Sci. 2012; 53: 7375–7379. [DOI] [PMC free article] [PubMed] [Google Scholar]
- 6. Miller JM. Functional anatomy of normal human rectus muscles. Vision Res. 189; 29: 223–240. [DOI] [PubMed] [Google Scholar]
- 7. Jiang L,, Demer JL. Magnetic resonance imaging of the functional anatomy of the inferior rectus muscle in superior oblique muscle palsy. Ophthalmology. 2008; 115: 2079–2086. [DOI] [PMC free article] [PubMed] [Google Scholar]
- 8. Kono R,, Demer JL. Magnetic resonance imaging of the functional anatomy of the inferior oblique muscle in superior oblique palsy. Ophthalmology. 2003; 110: 1219–1229. [DOI] [PubMed] [Google Scholar]
- 9. Demer JL,, Clark RA. Magnetic resonance imaging demonstrates compartmental muscle mechanisms of human vertical fusional vergence. J Neurophysiol. 2015; 113: 2150–2163. [DOI] [PMC free article] [PubMed] [Google Scholar]
- 10. Feldon SE,, Weiner JM. Clinical significance of extraocular muscle volumes in Graves' ophthalmopathy. Arch Ophthalmol. 1982; 100: 1266–1269. [DOI] [PubMed] [Google Scholar]
- 11. Firbank MJ,, Coulthard A. Evaluation of a technique for estimation of extraocular muscle volume using 2D MRI. Br J Radiol. 2000; 73: 1282–1289. [DOI] [PubMed] [Google Scholar]
- 12. Demer JL,, Miller JM,, Koo EY,, Rosenbaum AL. Quantitative magnetic resonance morphometry of extraocular muscles: a new diagnostic tool in paralytic strabismus. J Pediatr Ophthalmol Strabismus. 1994; 31: 177–188. [DOI] [PubMed] [Google Scholar]
- 13. Demer JL,, Miller MJ,, Koo EY,, Rosenbaum AL,, Bateman JB. True versus masquerading superior oblique palsies: muscle mechanisms revealed by magnetic resonance imaging. : Lennerstrand G, Update on Strabismus and Pediatric Ophthalmology. Boca Raton FL: CRC Press; 1995: 303–306. [Google Scholar]
- 14. Miller JM,, Demer JL. Biomechanical analysis of strabismus. Binocul Vis Eye Muscle Surg Q. 1992; 7: 233–248. [Google Scholar]
- 15. Demer JL,, Ortube MC,, Engle EC,, Thacker N. High-resolution magnetic resonance imaging demonstrates abnormalities of motor nerves and extraocular muscles in patients with neuropathic strabismus. J AAPOS. 2006; 10: 135–142. [DOI] [PMC free article] [PubMed] [Google Scholar]
- 16. Clark RA,, Miller JM,, Demer JL. Three-dimensional location of human rectus pulleys by path inflections in secondary gaze positions. Invest Ophthalmol Vis Sci. 2000; 41: 3787–3797. [PubMed] [Google Scholar]
- 17. Demer JL,, Dusyanth A. T2-weighted fast spin-echo magnetic resonance imaging of extraocular muscles. J AAPOS. 2011; 15: 17–23. [DOI] [PMC free article] [PubMed] [Google Scholar]
- 18. Clark RA,, Demer JL. Functional morphometry demonstrates extraocular muscle compartmental contraction during vertical gaze changes. J Neurophysiol. 2016; 115: 370–378. [DOI] [PMC free article] [PubMed] [Google Scholar]
- 19. Apt L. An anatomical reevaluation of rectus muscle insertions. Trans Am Ophthalmol Soc. 1980; 78: 365–375. [PMC free article] [PubMed] [Google Scholar]
- 20. Apt L,, Call NB. An anatomical reevaluation of rectus muscle insertions. Ophthalmic Surg. 1982; 13: 108–112. [PubMed] [Google Scholar]
- 21. Lorbach C,, Hirn U,, Kritzinger J,, Bauer W. Automated 3D measurement of fiber cross section morphology in handsheets. Nord Pulp Pap Res J. 2012; 27: 264–269. [Google Scholar]
- 22. Boushel R,, Langberg H,, Green S,, Skovgaard D,, Bulow J,, Kjaer M. Blood flow and oxygenation in peritendinous tissue and calf muscle during dynamic exercise in humans. J Physiol. 2000; 524: 305–313. [DOI] [PMC free article] [PubMed] [Google Scholar]
- 23. Wooten GF,, Reis DJ. Blood flow in extraocular muscle of cat. Arch Neurol. 1972; 26: 350–352. [DOI] [PubMed] [Google Scholar]
- 24. Huxley HE,, Brown W. The low-angle x-ray diagram of vertebrate striated muscle and its behavior during contraction and rigor. J Mol Biol. 1967; 30: 383–434. [DOI] [PubMed] [Google Scholar]


