Abstract
Objectives
CoNS are the most common cause of neonatal late-onset sepsis. Information on the vancomycin pharmacokinetics/pharmacodynamics against CoNS is limited. The aim of this study was to characterize vancomycin pharmacokinetic/pharmacodynamic relationships for CoNS and investigate neonatal optimal dosage regimens.
Methods
A hollow fibre and a novel rabbit model of neonatal central line-associated bloodstream CoNS infections were developed. The results were then bridged to neonates by use of population pharmacokinetic techniques and Monte Carlo simulations.
Results
There was a dose-dependent reduction in the total bacterial population and C-reactive protein levels. The AUC/MIC and Cmax/MIC ratios were strongly linked with total and mutant resistant cell kill. Maximal amplification of resistance was observed in vitro at an fAUC/MIC of 200 mg · h/L. Simulations predicted that neonates <29 weeks post-menstrual age are underdosed with standard regimens with respect to older age groups.
Conclusions
The AUC/MIC and Cmax/MIC ratios are the pharmacodynamic indices that best explain total and resistant cell kill in CoNS infection. This suggests that less-fractionated regimens are appropriate for clinical use and continuous infusions may be associated with increased risk of emergence of antimicrobial resistance. This study has provided the pharmacodynamic evidence to inform an optimized neonatal dosage regimen to take into a randomized controlled trial.
Introduction
Sepsis in neonates is an important cause of global morbidity, prolonged hospital stay and mortality.1–3 CoNS is a leading cause of neonatal sepsis and accounts for 30%–54% of all cases of late-onset sepsis.4–6 The vast majority of CoNS are resistant to methicillin and glycopeptides are the antimicrobial agents of choice.7 Central line-associated bloodstream infections (CLABSIs) are the most common risk factor for CoNS sepsis.8 Relatively little is known about the pharmacokinetics (PK) and pharmacodynamics (PD) of vancomycin for the treatment of CoNS in neonates.
The treatment of CoNS infections in neonates is problematic and differs considerably from adults. In the latter, CoNS are usually readily treatable with glycopeptide therapy and removal of a central catheter or other indwelling device. In this circumstance, there are few if any adverse sequelae. In contrast, in neonates the removal of a central line is often not possible because of clinical instability and/or difficulty re-establishing venous access.9 The persistent inflammatory state may have an adverse impact on the developing brain, which is not directly related to CoNS.10,11 Hence, it is important to find ways to optimally treat CoNS to eradicate the organisms and minimize inflammation.
Here, we explore the PK/PD of vancomycin for CoNS infections using both a hollow fibre (HF) infection model (HFIM) and a novel rabbit model of neonatal CLABSI. Staphylococcus epidermidis and Staphylococcus capitis were used as the challenge strains. We considered the antibacterial effect of vancomycin, the emergence of drug resistance and reductions in circulating concentrations of C-reactive protein (CRP) as PD endpoints. We bridged these experimental results to neonates to identify regimens for further study in clinical trials.
Materials and methods
Organisms, susceptibility studies and mutational frequency
CoNS were used for all experiments. Five clinical strains were recovered from two different neonatal ICUs in the UK: three strains of S. epidermidis (122648, 122761 and 121164) and two strains of S. capitis (122828 and 062012) (courtesy of Dr Timothy Neal, Liverpool Women's Hospital). Isolates were identified using MALDI-TOF MS and stored at −80°C. The MICs for the five strains were determined using CLSI and EUCAST microbroth dilution methodologies on 10 separate occasions.12,13 The mutational frequency of a less susceptible population was calculated as the ratio of the number of colonies that grew on vancomycin-containing Mueller–Hinton (MH) agar plates at a concentration of 4 mg/L divided by the number of colonies that grew on drug-free agar.14
Bioanalytical methodology
Estimates of vancomycin concentrations in rabbit plasma and MH broth from the HFIM were performed on a UPLC/MS-MS consisting of an Agilent 6420 Triple Quadrupole (Agilent Technologies, Berkshire, UK) in electrospray positive-ion mode and an Agilent 1290 series instrument (Agilent Technologies, Berkshire, UK). The coefficient of variation for vancomycin was ≤12.9% over the concentration range 0.05–50 mg/L. The limit of detection was 0.05 mg/L for plasma and 0.1 mg/L for broth; the intra- and interday variation was ≤8.3%.
In vitro model of neonatal bloodstream infection in an HF system
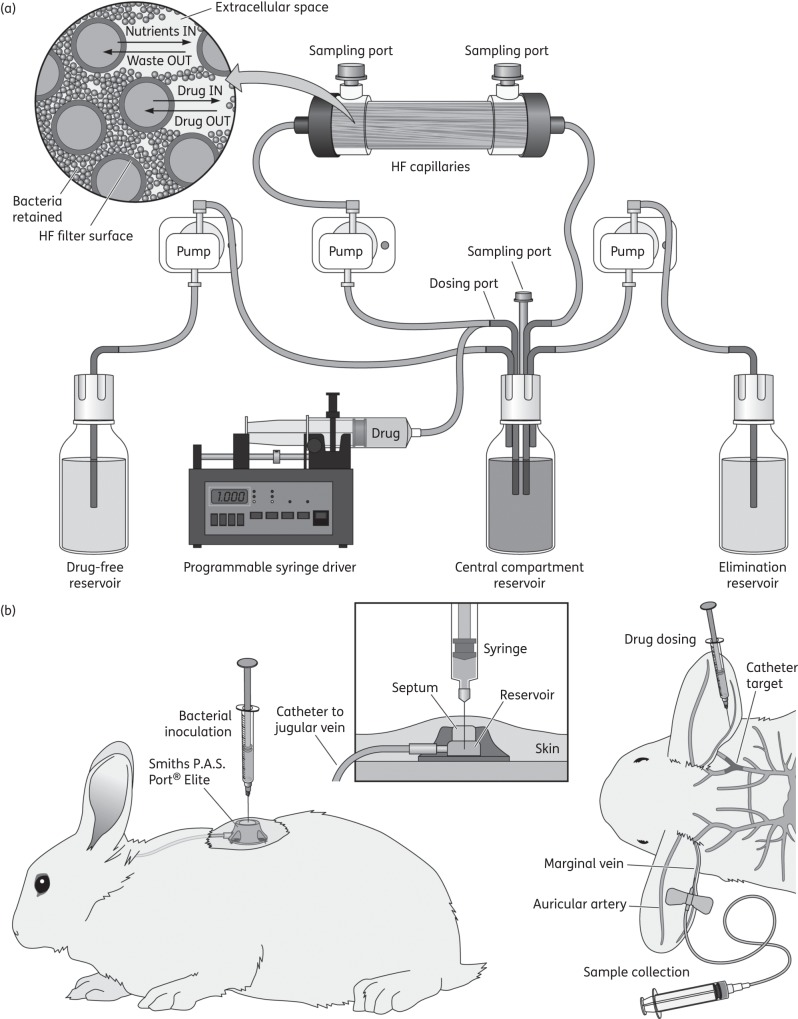
Vancomycin hydrochloride for intravenous infusion (Vancocin 500 mg, Flynn Pharma, Dublin, Ireland) was used. An HFIM was used to simulate a typical neonatal PK profile and study the PD responses of CoNS to different regimens of vancomycin (Figure 1a).15 An elimination t1/2 of 13 h for vancomycin was used.16
Figure 1.
Schematic representation of neonatal CLABSI models. (a) In vitro, HFIM: MH broth was pumped from a central compartment through an HF cartridge (FiberCell Systems, Frederick, MD, USA). Vancomycin was injected into the central compartment using a programmable syringe driver (Aladdin pump, World Precision Instruments, UK). Two peristaltic pumps (205U, Watson-Marlow, UK) were used. Fresh medium was pumped from a reservoir into the central compartment and the same volume removed as waste. The first pump had a speed rate that represented the neonatal simulated vancomycin elimination t1/2. (b) In vivo, rabbit model: central venous access was established with a rabbit jugular vein catheter with a Smiths P.A.S. Port® Elite (SAI Infusion Technologies, IL, USA) under general anaesthesia, to enable CoNS infection through the central line and biofilm formation.
For each experiment, fresh bacterial isolates were grown on blood agar plates (Oxoid, Hampshire, UK) and incubated at 37°C for 24 h. Bacteria were then inoculated into the extracapillary space of each HF cartridge. The initial inoculum used was ∼4.5 log10 cfu/mL. The desired inoculum was confirmed by quantitative culture on MH agar plates (Sigma–Aldrich, Hampshire, UK). The HFIM was incubated at 37°C in ambient air. A total of five experiments, each consisting of seven HF arms (control and six drug-treated arms), were conducted. Each experiment was performed with a different CoNS strain (three for S. epidermidis and two for S. capitis).
In vitro PK and PD studies
Initial dose-finding studies were conducted with neonatal-like concentration–time profiles of vancomycin that corresponded to human regimens of 7.5, 15 and 30 mg/kg/day. The total daily dose of vancomycin was administered: (i) as a 1 h infusion once daily [i.e. every 24 h (q24h)]; (ii) fractionated as half the total daily dose administered twice daily [i.e. every 12 h (q12h)] as a 1 h infusion; or (iii) via a 24 h continuous infusion. Treatment was initiated 24 h post-inoculation. Experiments were conducted for up to 10 days to simulate the typical duration of clinical therapy and enable the generation of antimicrobial resistance. The AUC, Cmax and Cmin vancomycin concentrations at steady-state and the burden of bacteria at the end of therapy were determined.
Total and vancomycin-resistant bacterial density were quantified at each timepoint by plating onto drug-free and vancomycin (4 mg/L)-containing MH agar plates (Sigma–Aldrich).13
Bacterial samples (1 mL) were withdrawn from each of the HF cartridges and aliquots of 0.1 mL were plated onto agar plates at 0, 2, 6 and 24 h post-infection and q24h thereafter immediately prior to dosing. ‘Resistant’ bacteria were defined as the number of colonies counted on the drug-containing plates.
In vivo model of neonatal CLABSI in rabbits
All experiments were conducted under UK Home Office project license (40/3630) and approved by the University of Liverpool Animal Welfare Committee. All animals were cared for according to national guidance. A non-neutropenic rabbit model of neonatal CLABSI was developed and used to study the response of CoNS to different regimens of vancomycin (Vancocin 500 mg, Flynn Pharma). Male New Zealand white rabbits (2.68–3.67 kg) were used for all experiments (Figure 1b). Two clinical strains of CoNS (S. epidermidis 122648 and S. capitis 122828) that were obtained from neonates were used for these experiments. Forty-two rabbits were studied (22 rabbits were infected with S. epidermidis and 20 with S. capitis). Each experiment consisted of six rabbits (two controls and two different dosage groups of two rabbits each).
A 1 mL volume of 8 log10 cfu/mL was administered via the central catheter of each rabbit and locked with 0.5 mL of lock solution (500 IU/mL heparin in 10% dextrose). After 2 h, up to 0.5 mL of lock solution was removed and the line flushed with 0.5 mL of sterile 0.9% saline. This inoculum was designed to establish a non-lethal model of CLABSI in the rabbits. Each experiment lasted 96 h. All rabbits were sacrificed 0.5 h after the final samples on day 4. At autopsy, the catheters were removed and the tip taken for quantitative culture.
PK and PD studies in a rabbit model of CLABSI
Vancomycin therapy was initiated 24 h post-inoculation and administered intravenously via the marginal ear vein. Dosages of 10, 20, 50, 100 and 150 mg/kg/day were administered q24h and/or q12h, as two divided doses, via an intravenous bolus. These dosages were chosen based on previous studies of vancomycin in rabbits.17,18 Blood (0.5 mL) samples for PK analysis were collected from each rabbit during the first dosing interval and then at steady-state. Samples were collected pre-dose and at 2, 4, 12 and 24 h post-dose from the opposite marginal vein to the vein used for the administration of the drug. Plasma samples were stored at −80°C until analysis.
CRP concentrations (mg/L) were used as the primary PD endpoint in rabbits and determined using a commercially available ELISA kit (Caltag Medsystems, Buckingham, UK). Blood samples (0.5 mL) for CRP analysis were taken at 0, 2, 24, 48, 72 and 96 h post-infection. Serum was stored at −80°C until analysis.
Blood samples (0.5 mL) were cultured in paediatric culture media bottles (BacT/Alert® FA plus, bioMérieux, Lyon, France) before the first dose and q24h thereafter and incubated at 37°C for 48 h before plating 0.1 mL of blood culture medium onto drug-free and drug-containing MH agar plates (i.e. vancomycin at 4 and 8 mg/L) (Sigma–Aldrich).
Quantitative counts from the tip of the catheter that was removed at autopsy were estimated. The catheter tips were inserted into 5 mL of PBS and sonicated for 15 min (60°C) before plating 0.1 mL of serial 10-fold dilutions onto drug-free and vancomycin-containing MH agar plates (4 and 8 mg/L) (Sigma–Aldrich).
PK/PD mathematical modelling
All PK and PD data were comodelled using a non-parametric population methodology using Pmetrics v.1.2.9.19 The structure of the PK/PD mathematical model fitted to HFIM PK/PD data was modified from a previously published model of bacterial resistance20 and took the following form:
| (1) |
| (2) |
| (3) |
Equation (1) describes the rate of change of the amount of vancomycin (mg) in the central compartment (X1). Equations (2) and (3) describe the rate of change of burden of a total bacterial population (T) and a resistant/mutant (R) bacterial population in the HFIM. POPmax (cfu/mL) = the theoretical maximum bacterial density, KgmaxT/R (log10 cfu/h) = maximum rate of growth in both populations, KkmaxT/R (log10 cfu/h) = the rate of bacterial killing induced by vancomycin, C50S/R (mg/L) = vancomycin drug concentrations that produce half-maximal killing and H/HR = slope functions for killing.
The model fitted to the rabbit CLABSI PK/PD data was similar, but incorporated an additional term to describe immunological killing because a decline in CRP levels was observed in control rabbits that only received vehicle:
| (4) |
| (5) |
| (6) |
| (7) |
Equations (4) and (5) describe the rate of change of vancomycin (mg) into and from a central (X1) and a peripheral compartment (X2). Equations (6) and (7) describe the rate of change of CRP concentrations (mg/L) (X3) in the rabbits and change of immune system function (X4) over time. IMAX, Kimax and KKim are the theoretical maximum rise, rate of rise of the immune function and rate of CRP suppression exerted by the immune system, respectively.
The fit of each of the PK/PD models to the respective datasets was assessed in the following ways: (i) the log-likelihood value; and (ii) both the coefficient of determination (r2) of the linear regression and visual inspection of the observed/predicted plots before and after the Bayesian step.
To determine the PK/PD index that best explained bacterial killing and the emergence of drug resistance in the HFIM, scatter plots were constructed that related the AUC/MIC, Cmax/MIC and Cmin/MIC to both the observed antibacterial effect and the emergence of a drug-resistant subpopulation. A non-linear regression model was then fitted to the data using Prism software (GraphPad Software, La Jolla, CA, USA). The coefficient of determination was used to discriminate the various PD indices.
Neonatal PK data and Monte Carlo simulations
The experimental data were bridged to the clinic using a recently developed population PK model of vancomycin for neonates (W. Z.). The model was developed from plasma concentrations obtained from 1463 neonates with post-menstrual age (PMA) range 23.3–52.4 weeks and weight range 415–11 400 g, from multiple investigators in the following age groups: (i) <29 weeks PMA, n = 335; (ii) 29–35 weeks PMA, n = 618; and (iii) >35 weeks PMA, n = 510.
Monte Carlo simulations were performed using NONMEM (W. Z.). The mean (SD) PK parameter values used for Monte Carlo simulations were: CL (L/h) = 0.118 (0.102); volume of distribution in the central compartment (Vc) (L) = 1.05 (0.77); volume of distribution in the peripheral compartment Vp (L) = 0.87 (1.62); and intercompartmental clearance Q (L/h) = 0.03. The currently recommended vancomycin regimens for each neonatal age group were studied, which are as follows: <29 weeks PMA, 15 mg/kg q24h; 29–35 weeks PMA, 15 mg/kg q12h; and >35 weeks PMA, 15 mg/kg every 8 h (q8h).21 The AUC at steady-state was determined for the simulated neonates using this regimen. A number of optimized regimens were then studied, with the goal of achieving parity in drug exposure (AUC) across the different age groups.
CRP data from a cohort of 10 neonates (aged 26–39 weeks PMA, weight range 690–5080 g) recruited as part of a teicoplanin PK study (EudraCT number 2012-005738-12) were used to place the rabbit CRP values profile in a clinical context.
A range of drug exposures (AUCs) linked to the predicted CRPs at 96 h (last experimental timepoint) was established by means of individual population simulations conducted in ADAPT 5,22 using the population PK/PD parameter medians from the rabbit PK/PD mathematical model. The number of simulated neonates achieving the range of drug exposures was then matched to the predicted linked population CRPs for both standard and optimized therapies. Measures of central tendency and dispersion for the CRP levels were calculated.
Results
Strains, MICs and mutational frequency
The broth microdilution modal MIC for all the strains by both methodologies used was 2 mg/L. All strains were oxacillin resistant by Etest (Oxoid). Following 48 h of incubation, the frequency of mutants able to grow on plates that contained 2× MIC was between 1.7 × 10⁻³ (S. capitis 122828) and 8.19 × 10⁻⁶ (S. epidermidis 121164).
HFIM of CoNS
A human neonatal-like vancomycin t1/2 and plasma concentration–time profiles were readily generated in the HFIM. The different species and strains of CoNS grew well in the HFIM. The initial density of organisms was ∼4.5 log10 cfu/mL, which grew over 24 h to a final density of ∼10 log10 cfu/mL before vancomycin therapy started.
PD of vancomycin against CoNS in the HFIM: dose-finding studies
There was a dose-dependent decline in the total bacterial density with increasing drug exposure with all the strains investigated. In contrast, lower dosages of vancomycin (7.5 mg/kg/day) resulted in the emergence of a vancomycin-resistant population, which was not observed with the use of higher dosages (30 mg/kg/day) (Figure 2).
Figure 2.
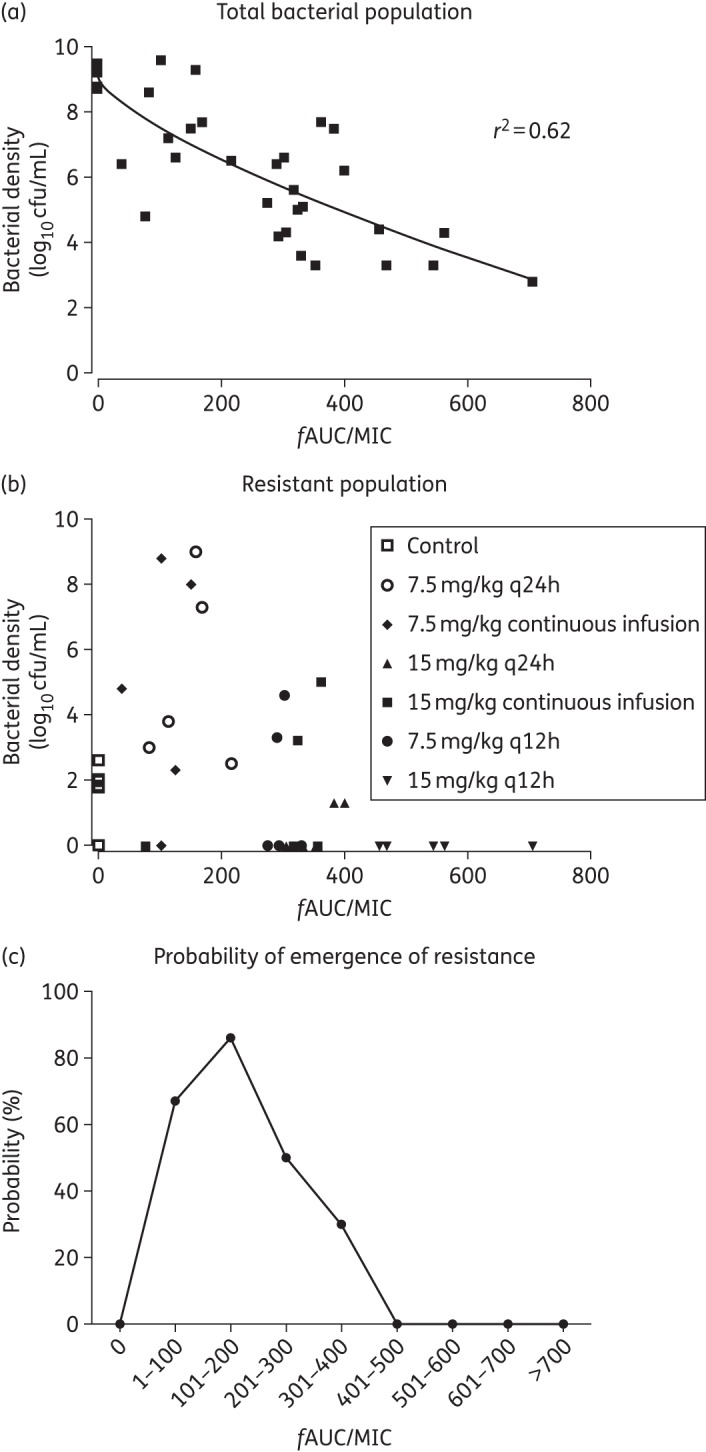
PD of vancomycin against five CoNS neonatal strains in the HFIM. (a) The total bacterial density (log10 cfu/mL) decline along the different fAUC/MIC reached at steady-state (96–120 h) in all the experiments. A sigmoid Emax model was fitted to the data (r2 = 0.62). (b) The resistant bacterial population decline along the same PD index. (c) The probability of emergence of resistance compared with control with each 100 range of fAUC/MIC ratios at steady-state.
Dose-fractionation studies
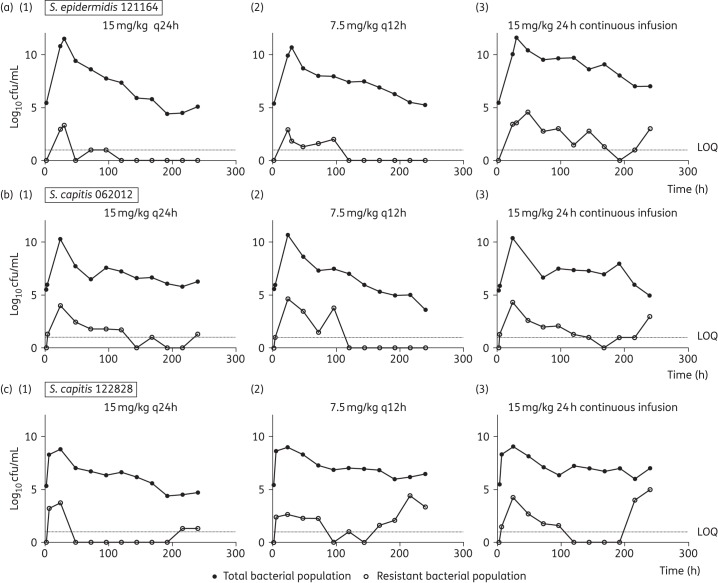
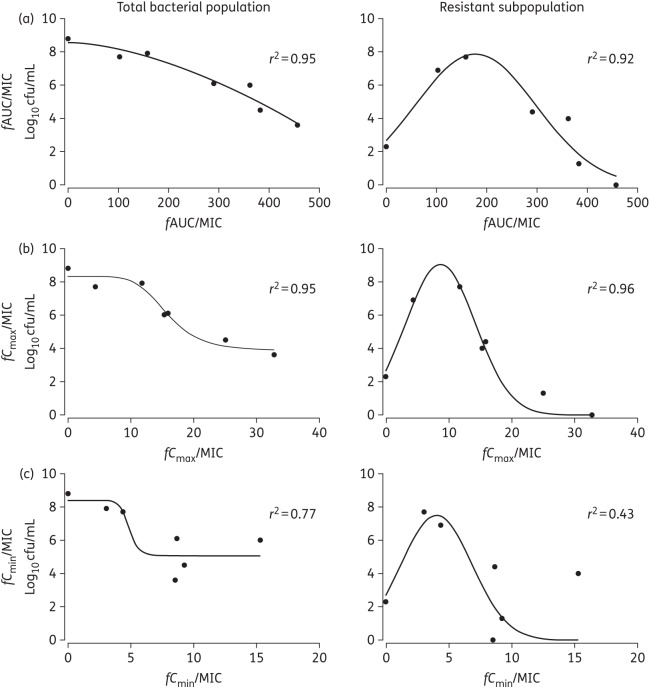
A daily dosage of 15 mg/kg/day resulted in logarithmic killing (>4 log10 cfu/mL cell kill) regardless of the schedule of administration, but daily administration of drug achieved the greatest logarithmic kill. The emergence of vancomycin resistance was more pronounced in the continuous infusion arms compared with intermittent therapy for strains S. epidermidis 121164, S. capitis 062012 and S. capitis 122828 regardless of the mutational frequency (Figure 3). Regression analyses, using an inhibitory sigmoid Emax model, showed a strong association between both fCmax/MIC and fAUC/MIC and bacterial killing (r2 = 0.95 for both indices). Non-linear regression analysis also showed a strong association between fCmax/MIC and fAUC/MIC and suppression of vancomycin resistance for all the strains, including S. capitis 122828, which had the highest mutational frequency of resistance (Figure 4).
Figure 3.
(a) Dose-fractionation studies (15 mg/kg/day) with (a) S. epidermidis 121164, the strain with the lowest mutational frequency to resistance, (b) S. capitis 062012 and (c) S. capitis 122828. Regimens consisted of 15 mg/kg q24h (1), q12h (2) and 24 h continuous infusion (3) in the HFIM. Filled symbols show the data points (bacterial density count in drug-free plates) for the total bacterial population. Open symbols represent data points (bacterial density count in 4 mg/L vancomycin drug-containing plates) for the resistant subpopulation. Dotted lines represent the lower limit of quantification (LOQ) of 1 log10 cfu/mL.
Figure 4.
PD of vancomycin against CoNS (S. capitis 122828), the strain with the highest mutational frequency to vancomycin resistance, in the HFIM. The endpoint is the bacterial density count (log10 cfu/mL) at the end of 9 days in the HFIM. An inhibitory sigmoid Emax model was fitted to the total bacterial population versus the PD index and a non-linear regression model was fitted to the resistant subpopulation versus the PD index. (a) fAUC/MIC. (b) fCmax/MIC. (c) fCmin/MIC.
A vancomycin fAUC/MIC ratio at steady-state >400 mg · h/L was associated with near-maximal bacterial killing and suppression of emergence of resistance (Figure 2a and b). Progressively higher drug exposure of vancomycin (AUC/MIC) resulted in progressively higher degrees of bacterial killing. An ‘inverted U’ was observed with maximal amplification of resistance with an fAUC/MIC of ∼200 (Figure 2c).
Vancomycin PD in the CLABSI rabbit model
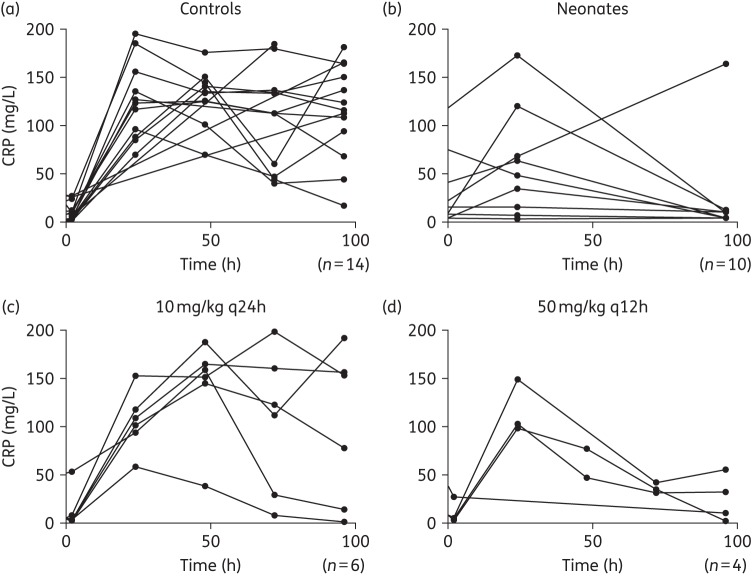
Vancomycin was well tolerated with regimens ≤100 mg/kg. Higher dosages caused acute infusional toxicity that was lethal. Vancomycin induced a dose-dependent decline in CRP (Figure 5). A neonatal CRP profile during teicoplanin therapy in a cohort of 10 neonates with suspected or confirmed CoNS sepsis was comparable to the CRP profiles observed in rabbits (Figure 5).
Figure 5.
Concentration–time profile of CRP for the control rabbits (a) and for the rabbits receiving the lowest (c) and highest (d) dose of vancomycin along the 4 days of the experiment in the CLABSI rabbit model. (b) The CRP profile in neonates at 0, 24 (first day of treatment) and 96 h of therapy with teicoplanin for comparison.
The median estimated clearance in the PK/PD model was 0.576 L/h and the Vc was 0.56 L. The distributional and elimination t1/2 were 0.18 and 0.9 h, respectively. The r2 for the observed-versus-predicted plots obtained after the Bayesian step from the PK/PD population model for vancomycin and CRP concentrations was 0.957 and 0.765, respectively. Predicted (Bayesian posteriors) median AUCs at steady-state ranged between 41.09 (10 mg/kg/day q24h) and 487.5 mg · h/L (100 mg/kg/day q12h).
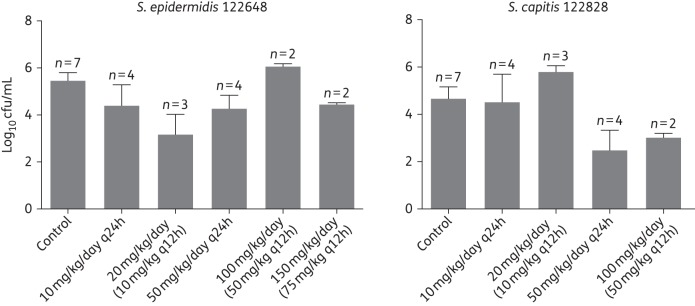
Quantitative cultures from blood cultures were only intermittently positive for blood. The total bacterial density from the catheter tips at autopsy is shown in Figure 6.
Figure 6.
Tip of the central catheter cultures (log10 cfu/mL) at autopsy from the CLABSI rabbit model (pooled data means and standard error of means) for each of the dosage regimens and the strains investigated (S. epidermidis 122648 and S. capitis 122828).
The relationship between the AUC/MIC and CRP at the end of the experiment is shown in Figure 7. A total drug AUC/MIC at a steady-state of 76 mg · h/L was required to achieve a 50% decrease of CRP by 96 h (end of experiment). However, to achieve a near-maximal effect (80% decrease of CRP at 96 h), a total drug AUC/MIC of 520 mg · h/L was required for both isolates of CoNS (Figure 7).
Figure 7.
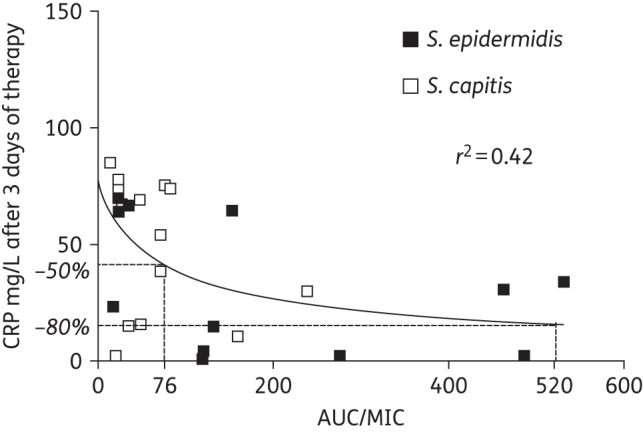
PD total AUC/MIC ratio relationship of vancomycin against CoNS (S. epidermidis and S. capitis) in the rabbit CLABSI model.
Bridging study
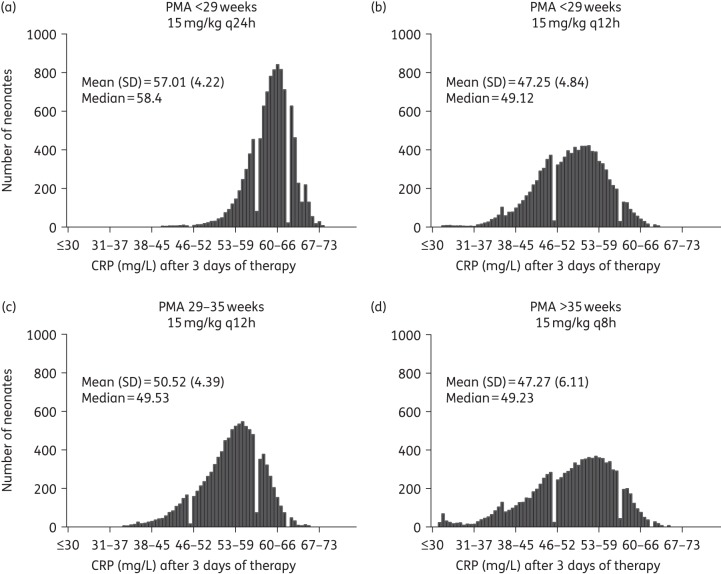
The distribution of expected CRP values in a population of 1000 simulated neonates for each PMA linked to their respective drug exposures (AUCs) receiving current dosage regimens showed that with standard therapy, neonates <29 weeks PMA were underdosed in comparison with the older age groups. The median predicted CRP from the simulations for neonates <29, 29–35 and >35 weeks PMA all receiving the currently recommended vancomycin regimen was 58.4, 49.53 and 49.23 mg/L, respectively. An optimized dosage regimen for the <29 weeks age group of 30 mg/kg/day (15 mg/kg q12h) reduced the CRP to values comparable to the ones of older age groups (median 49.12 mg/L) (Figure 8).
Figure 8.
Bridging study. Predicted CRP-AUC linked histograms showing the distribution of simulated neonates per PMA group [(a) <29 weeks, (c) 29–35 weeks and (d) >35 weeks] receiving currently recommended dosage regimens and a proposed optimized vancomycin regimen [(b) 15 mg/kg q12h for PMA <29 weeks]. CRP means, standard deviations and medians are shown.
Discussion
The aim of neonatal therapy is to manage both infection and inflammation in the presence of an infected central line that ordinarily cannot be removed. The optimal vancomycin regimen to achieve this goal is not known and is the focus of this study. We developed two new experimental models to investigate the PK/PD of vancomycin against CoNS, which yield different but complementary information.
The HFIM enables human neonatal concentration–time profiles to be simulated and is the ideal model to quantify bacterial killing and the emergence of antimicrobial resistance under drug pressure. In contrast, the rabbit CLABSI model is a closer mimic of neonatal infection and disease that employs CRP as the primary model readout to assess the response to antimicrobial therapy. While we acknowledge that several factors extraneous to drug exposure, such as immunological effectors and the inocula, may also have an impact on CRP concentrations, we observed similar CRP concentration–time profiles in rabbits and neonates receiving glycopeptide therapy (Figure 5). Furthermore, as is the case in human neonates in the neonatal ICU, blood cultures are only intermittently positive for CoNS in the rabbit CLABSI model and infection causes inflammation without causing fulminant sepsis and death. All these attributes suggest the rabbit model is a faithful mimic of neonatal disease and can be used for future assessment of antibiotics for neonates.
Studies conducted in the HFIM suggest that vancomycin exhibits concentration-dependent killing. Both the AUC/MIC and the Cmax/MIC readily accounted for the experimental data when the total and resistant subpopulations were considered (Figure 4a and b). There is a progressive decline in bacterial density with increasing AUC/MIC. In contrast, a characteristic ‘inverted U’ was observed when drug exposure was linked with the emergence of drug resistance.23,24 The concentration-dependent effect of vancomycin on bacterial killing is consistent with other studies in MRSA and Streptococcus pneumoniae infections.14,25 The PK/PD data strongly suggest that the use of less-fractionated regimens is appropriate in the clinic, with no PD evidence that vancomycin continuous infusions may be beneficial for treatment of CoNS. Furthermore, intermittent drug administration may facilitate the clinical use of vancomycin (by freeing up an intravenous line), minimize toxicity (because Cmin is linked to toxicity)26 and minimize the emergence of drug resistance.
In the HFIM, the drug exposure that predicts near-maximal killing and is required to suppress the emergence of drug resistance is an fAUC/MIC >400, which is equivalent to an fAUC >800 mg · h/L (because the MIC for the study strains is 2 mg/L), and a total drug AUC of ∼1330 mg · h/L (total AUC/MIC of 665) if 40% protein binding is assumed.27 Such a value is considerably higher than the total drug AUC/MIC value of 400 that is widely cited for treatment of MRSA28–31 and therefore, raises the question of the clinical relevance of the experimental findings from the HFIM. The rabbit CLABSI model provides some additional context for this finding. Here, a total drug AUC/MIC of 520 [corresponding to a total drug AUC of 1040 (MIC = 2 mg/L) and an fAUC/MIC of 312] is required for near-complete CRP suppression (Figure 7). The HFIM studies suggest this magnitude of drug exposure also prevents the emergence of CoNS mutants (Figure 2b and c). Collectively, therefore, both experimental models suggest: (i) higher AUC/MIC targets (total 665 and 520 for the HFIM and the rabbit model, respectively) than are currently proposed for MRSA infection in adults are required for maximal bacterial kill, prevention of amplification of a resistant subpopulation and suppression of circulating CRP in the setting of a retained central line; and (ii) the dose-fractionation studies suggest that less-fractionated regimens may be better in terms of bacterial kill and preventing the emergence of drug-resistant subpopulations.
The recommended vancomycin regimens for neonates vary widely, but commonly used regimens in Europe are as follows: (i) 15 mg/kg/day q24h in <29 weeks PMA; (ii) 15 mg/kg q12h in 29–35 weeks PMA; and (iii) 15 mg/kg q8h in >35 weeks PMA.21,32 The bridging study provides an opportunity to examine the potential adequacy of these regimens. After examining the experimental data, we decided not to define a cut-off value to classify therapeutic success and failure because of the arbitrary nature of such a value. The absence of clinical data makes any split somewhat difficult to justify. Rather, we used the whole exposure–effect relationship obtained from the rabbit model, ultimately using a clinically relevant readout of circulating CRP concentrations. Simulations suggest that neonates <29 weeks PMA are underdosed with respect to the older age groups and have higher predicted CRP values. A regimen of 15 mg/kg q12h is needed to achieve a similar reduction in CRP concentrations compared with older neonates and infants.
This study provides the PD rationale to explore the use of higher dosages in neonates <29 weeks PMA. These ideas can now be tested in a multicentre Phase IIb clinical trial. Somewhat surprisingly, the vancomycin exposure that is required for maximal antibacterial effect appears higher than is widely accepted for the treatment of more virulent Gram-positive organisms. The PK/PD data and models provide insight into the difficulties of managing infection in critically ill neonates with a trade-off between bacterial killing, preventing emergence of drug resistance and minimizing drug-related toxicity.
Funding
This study and V. R.-M. were supported by the European Union's Seventh Framework Programme for research, technological development and demonstration under grant agreement no: 602041(FP7-HEALTH-2013-INNOVATION-1). Neovanc: ‘Treatment of late onset bacterial sepsis caused by vancomycin susceptible bacteria in neonates and infants aged under 3 months’.
F. D.-P. is supported by a Sara Borrell postdoctoral fellowship from the Instituto de Salud Carlos III.
W. W. H. is supported by a National Institutes of Health Research (NIHR) Clinician Scientist Fellowship.
Transparency declarations
None to declare.
Acknowledgements
This work was presented, in part, at the Fifty-fourth Interscience Conference on Antimicrobial Agents and Chemotherapy, Washington, DC, USA, 2014 (poster A-970).
We thank Dr Ghaith Aljayyoussi for his helpful advice on analytical modelling and statistics.
References
- 1.Levit O, Bhandari V, Li F-Y et al. . Clinical and laboratory factors that predict death in very low birth weight infants presenting with late-onset sepsis. Pediatr Infect Dis J 2014; 33: 143–6. [DOI] [PMC free article] [PubMed] [Google Scholar]
- 2.Stoll BJ, Hansen NI, Bell EF et al. . Neonatal outcomes of extremely preterm infants from the NICHD Neonatal Research Network. Pediatrics 2010; 126: 443–56. [DOI] [PMC free article] [PubMed] [Google Scholar]
- 3.Hornik CP, Fort P, Clark RH et al. . Early and late onset sepsis in very-low-birth-weight infants from a large group of neonatal intensive care units. Early Hum Dev 2012; 88 Suppl 2: S69–74. [DOI] [PMC free article] [PubMed] [Google Scholar]
- 4.Vergnano S, Menson E, Kennea N et al. . Neonatal infections in England: the NeonIN surveillance network. Arch Dis Child Fetal Neonatal Ed 2011; 96: F9–14. [DOI] [PubMed] [Google Scholar]
- 5.Stoll BJ, Gordon T, Korones SB et al. . Late-onset sepsis in very low birth weight neonates: a report from the National Institute of Child Health and Human Development Neonatal Research Network. J Pediatr 1996; 129: 63–71. [DOI] [PubMed] [Google Scholar]
- 6.Stoll BJ, Hansen N, Fanaroff AA et al. . Late-onset sepsis in very low birth weight neonates: the experience of the NICHD Neonatal Research Network. Pediatrics 2002; 110: 285–91. [DOI] [PubMed] [Google Scholar]
- 7.Wisplinghoff H, Rosato AE, Enright MC et al. . Related clones containing SCC mec type IV predominate among clinically significant Staphylococcus epidermidis isolates. Antimicrob Agents Chemother 2003; 47: 3574–9. [DOI] [PMC free article] [PubMed] [Google Scholar]
- 8.Milstone AM, Reich NG, Advani S et al. . Catheter dwell time and CLABSIs in neonates with PICCs: a multicenter cohort study. Pediatrics 2013; 132: e1609–15. [DOI] [PMC free article] [PubMed] [Google Scholar]
- 9.Karlowicz MG, Furigay PJ, Croitoru DP et al. . Central venous catheter removal versus in situ treatment in neonates with coagulase-negative staphylococcal bacteremia. Pediatr Infect Dis J 2002; 21: 22–7. [DOI] [PubMed] [Google Scholar]
- 10.Adams-Chapman I, Stoll BJ. Neonatal infection and long-term neurodevelopmental outcome in the preterm infant. Curr Opin Infect Dis 2006; 19: 290–7. [DOI] [PubMed] [Google Scholar]
- 11.Mitha A, Foix-L'Hélias L, Arnaud C et al. . Neonatal infection and 5-year neurodevelopmental outcome of very preterm infants. Pediatrics 2013; 132: e372–80. [DOI] [PubMed] [Google Scholar]
- 12.Clinical and Laboratory Standards Institute. Methods for Dilution Antimicrobial Susceptibility Tests for Bacteria That Grow Aerobically—Ninth Edition: Approved Standard M07-A9. CLSI, Wayne, PA, USA, 2012. [Google Scholar]
- 13.EUCAST. Breakpoint Tables for Interpretation of MICs and Zone Diameters. 2015. http://www.eucast.org/fileadmin/src/media/PDFs/EUCAST_files/Breakpoint_tables/v_5.0_Breakpoint_Table_01.pdf. [Google Scholar]
- 14.Nicasio AM, Bulitta JB, Lodise TP et al. . Evaluation of once-daily vancomycin against methicillin-resistant Staphylococcus aureus in a hollow-fiber infection model. Antimicrob Agents Chemother 2012; 56: 682–6. [DOI] [PMC free article] [PubMed] [Google Scholar]
- 15.Felton TW, Goodwin J, O'Connor L et al. . Impact of bolus dosing versus continuous infusion of piperacillin and tazobactam on the development of antimicrobial resistance in Pseudomonas aeruginosa. Antimicrob Agents Chemother 2013; 57: 5811–9. [DOI] [PMC free article] [PubMed] [Google Scholar]
- 16.Seay RE, Brundage RC, Jensen PD et al. . Population pharmacokinetics of vancomycin in neonates. Clin Pharmacol Ther 1994; 56: 169–75. [DOI] [PubMed] [Google Scholar]
- 17.Nicolau DP, Freeman CD, Nightingale CH et al. . Pharmacokinetics of minocycline and vancomycin in rabbits. Lab Anim Sci 1993; 43: 222–5. [PubMed] [Google Scholar]
- 18.Ahmed A, Jafri H, Lutsar I et al. . Pharmacodynamics of vancomycin for the treatment of experimental penicillin- and cephalosporin-resistant pneumococcal meningitis. Antimicrob Agents Chemother 1999; 43: 876–81. [DOI] [PMC free article] [PubMed] [Google Scholar]
- 19.Neely MN, van Guilder MG, Yamada WM et al. . Accurate detection of outliers and subpopulations with Pmetrics, a nonparametric and parametric pharmacometric modeling and simulation package for R. Ther Drug Monit 2012; 34: 467–76. [DOI] [PMC free article] [PubMed] [Google Scholar]
- 20.Gumbo T, Louie A, Deziel MR et al. . Selection of a moxifloxacin dose that suppresses drug resistance in Mycobacterium tuberculosis, by use of an in vitro pharmacodynamic infection model and mathematical modeling. J Infect Dis 2004; 190: 1642–51. [DOI] [PubMed] [Google Scholar]
- 21.Sharland M, Andrew Cant E, Davies G et al. . OSH Manual of Childhood Infections: The Blue Book. 3rd edn. London: Oxford University Press, 2011. [Google Scholar]
- 22.D'Argenio DZ, Schumitzky A, Wang X. ADAPT 5 User's Guide: Pharmacokinetic/Pharmacodynamic Systems Analysis Software. 2009. Biomedical Simulations Resource, CA, USA. [Google Scholar]
- 23.Tam VH, Louie A, Deziel MR et al. . The relationship between quinolone exposures and resistance amplification is characterized by an inverted U: a new paradigm for optimizing pharmacodynamics to counterselect resistance. Antimicrob Agents Chemother 2007; 51: 744–7. [DOI] [PMC free article] [PubMed] [Google Scholar]
- 24.Zinner SH, Lubenko IY, Gilbert D et al. . Emergence of resistant Streptococcus pneumoniae in an in vitro dynamic model that simulates moxifloxacin concentrations inside and outside the mutant selection window: related changes in susceptibility, resistance frequency and bacterial killing. J Antimicrob Chemother 2003; 52: 616–22. [DOI] [PubMed] [Google Scholar]
- 25.Knudsen JD, Fuursted K, Raber S et al. . Pharmacodynamics of glycopeptides in the mouse peritonitis model of Streptococcus pneumoniae or Staphylococcus aureus infection pharmacodynamics of glycopeptides in the mouse peritonitis model of Streptococcus pneumoniae or Staphylococcus aureus infection. Antimicrob Agents Chemother 2000; 44: 1247–54. [DOI] [PMC free article] [PubMed] [Google Scholar]
- 26.Lodise TP, Patel N, Lomaestro BM et al. . Relationship between initial vancomycin concentration–time profile and nephrotoxicity among hospitalized patients. Clin Infect Dis 2009; 49: 507–14. [DOI] [PubMed] [Google Scholar]
- 27.Butterfield JM, Patel N, Pai MP et al. . Refining vancomycin protein binding estimates: Identification of clinical factors that influence protein binding. Antimicrob Agents Chemother 2011; 55: 4277–82. [DOI] [PMC free article] [PubMed] [Google Scholar]
- 28.Moise-Broder PA, Forrest A, Birmingham MC et al. . Pharmacodynamics of vancomycin and other antimicrobials in patients with Staphylococcus aureus lower respiratory tract infections. Clin Pharmacokinet 2004; 43: 925–42. [DOI] [PubMed] [Google Scholar]
- 29.Le J, Bradley JS, Murray W et al. . Improved vancomycin dosing in children using area under the curve exposure. Pediatr Infect Dis J 2013; 32: e155–63. [DOI] [PMC free article] [PubMed] [Google Scholar]
- 30.Frymoyer A, Guglielmo BJ, Hersh AL. Desired vancomycin trough serum concentration for treating invasive methicillin-resistant staphylococcal infections. Pediatr Infect Dis J 2013; 32: 1077–9. [DOI] [PubMed] [Google Scholar]
- 31.Liu C, Bayer A, Cosgrove SE et al. . Clinical practice guidelines by the Infectious Diseases Society of America for the treatment of methicillin-resistant Staphylococcus aureus infections in adults and children. Clin Infect Dis 2011; 52. [DOI] [PubMed] [Google Scholar]
- 32.British National Formulary for Children 2014–2015. 2014; 289–90. http://www.evidence.nhs.uk/formulary/bnfc/current/5-infections/51-antibacterial-drugs/517-some-other-antibacterials/vancomycin-and-teicoplanin/vancomycin. [Google Scholar]


