Significance
Distinct membranes separate cellular organelles, and communication between organelles occurs primarily at the interorganelle membrane junctions, which are established by junctional proteins. The junctions between the endoplasmic reticulum (ER) and the plasma membrane (PM) are essential for lipid transfer and Ca2+ dynamics; however, little is known about the composition of these junctions in T cells. We identified a protein complex containing junctophilin-4 and junctate as components of the ER–PM junctions that regulate Ca2+ dynamics in T cells by interacting with stromal interaction molecule 1 (STIM1), an essential activator of store-operated Ca2+ channels. This study highlights an important role of junctional proteins in T cells and helps in uncovering the pathological mechanisms underlying human diseases due to mutations in these proteins.
Keywords: junctophilins, ER–PM junctions, store-operated Ca2+ entry, STIM1, Orai1
Abstract
Orai1 and stromal interaction molecule 1 (STIM1) mediate store-operated Ca2+ entry (SOCE) in immune cells. STIM1, an endoplasmic reticulum (ER) Ca2+ sensor, detects store depletion and interacts with plasma membrane (PM)-resident Orai1 channels at the ER–PM junctions. However, the molecular composition of these junctions in T cells remains poorly understood. Here, we show that junctophilin-4 (JP4), a member of junctional proteins in excitable cells, is expressed in T cells and localized at the ER–PM junctions to regulate Ca2+ signaling. Silencing or genetic manipulation of JP4 decreased ER Ca2+ content and SOCE in T cells, impaired activation of the nuclear factor of activated T cells (NFAT) and extracellular signaling-related kinase (ERK) signaling pathways, and diminished expression of activation markers and cytokines. Mechanistically, JP4 directly interacted with STIM1 via its cytoplasmic domain and facilitated its recruitment into the junctions. Accordingly, expression of this cytoplasmic fragment of JP4 inhibited SOCE. Furthermore, JP4 also formed a complex with junctate, a Ca2+-sensing ER-resident protein, previously shown to mediate STIM1 recruitment into the junctions. We propose that the junctate–JP4 complex located at the junctions cooperatively interacts with STIM1 to maintain ER Ca2+ homeostasis and mediate SOCE in T cells.
The endoplasmic reticulum (ER)–plasma membrane (PM) junctions are ubiquitous structures essential for intermembrane communications (1–3). These junctions play an important role in lipid transfer and regulation of Ca2+ dynamics, including ER Ca2+ homeostasis and Ca2+ entry after receptor stimulation (1, 4). Four major categories of components of the ER–PM junctions have been identified so far: (i) dyad/triad junctional proteins in the heart and skeletal muscle (e.g., junctophilins and junctin), (ii) ER-resident vesicle-associated membrane protein-associated proteins (VAPs) that form the lipid transfer machinery by interacting with phospholipid-binding proteins, (iii) extended synaptogamin-like proteins (E-Syts) that tether membranes, and (iv) the Orai1–stromal interaction molecule 1 (STIM1) complex that forms the primary Ca2+ channel in T cells, the Ca2+ release-activated Ca2+ (CRAC) channels. Among these proteins, the dyad/triad junctional proteins and the Orai1–STIM1 complex are known to play a crucial role in Ca2+ dynamics, including excitation–contraction coupling in muscle and store-operated Ca2+ entry (SOCE) in immune cells, respectively (2, 5).
Stimulation of T-cell receptors (TCRs) triggers activation of SOCE primarily mediated by the PM-resident Orai1 channels and ER-resident STIM1 protein that senses ER Ca2+ concentration (6–11). Upon store depletion, STIM1 translocates and interacts with Orai1 at the preformed ER–PM junctions (12, 13). STIM1 uses two major mechanisms to translocate into the ER–PM junctions: by interactions with phosphatidylinositol-4,5-bisphosphate (PIP2) in the PM via its C-terminal polybasic residues and by interaction with Orai1 or the ER-resident junctate proteins (14, 15). Recently, septin filaments were shown to play a role in PIP2 enrichment at the ER–PM junctions before STIM1 recruitment (16). Subsequently, membrane-tethering VAP and E-Syt proteins were shown to be important for PIP2 replenishment after store depletion (17). The importance of protein interaction in STIM1 recruitment was demonstrated by a STIM1ΔK mutant truncated in its C-terminal polybasic domain. Interaction with Orai1 or junctate facilitated recruitment of this PIP2 binding-deficient mutant into the junctions (15, 18, 19). It was thought that the roles of dyad/triad junctional proteins are limited to muscle cells. However, identification of junctate as a STIM1-interacting partner implied that some components (or homologs) of ER–PM junctions in excitable cells may be shared in immune cells.
The junctophilin family consists of four genes (JP1, JP2, JP3, and JP4) that are expressed in a tissue-specific manner and are known to form ER–PM junctions in excitable cells (20, 21). Junctophilins contain eight repeats of the membrane occupation and recognition nexus (MORN) motifs that bind to phospholipids in the N terminus and a C-terminal ER membrane-spanning transmembrane segment (20, 22). In this study, we observed expression of JP4 in both human and mouse T cells, which was further enhanced by TCR stimulation. Depletion or deficiency of JP4 reduced ER Ca2+ content, SOCE, and activation of the nuclear factor of activated T cells (NFAT) and ERK mitogen-activated protein kinase (MAPK) pathways. Mechanistically, JP4 depletion reduced accumulation of STIM1 at the junctions without affecting the number and length of the ER–PM junctions. We observed a direct interaction between the cytoplasmic regions of JP4 and STIM1, and, correspondingly, overexpression of the STIM1-interacting JP4 fragment had a dominant negative effect on SOCE. Finally, we identified a protein complex consisting of JP4 and junctate at the ER–PM junctions, which may have a synergistic effect in recruiting STIM1 to the junctions. Therefore, our studies identify a PIP2-independent, but protein interaction-mediated, mechanism by which the junctate–JP4 complex recruits STIM1 into the ER–PM junctions to maintain ER Ca2+ homeostasis and activate SOCE in T cells.
Results
JP4 Plays an Important Role in ER Ca2+ Homeostasis and SOCE in T Cells.
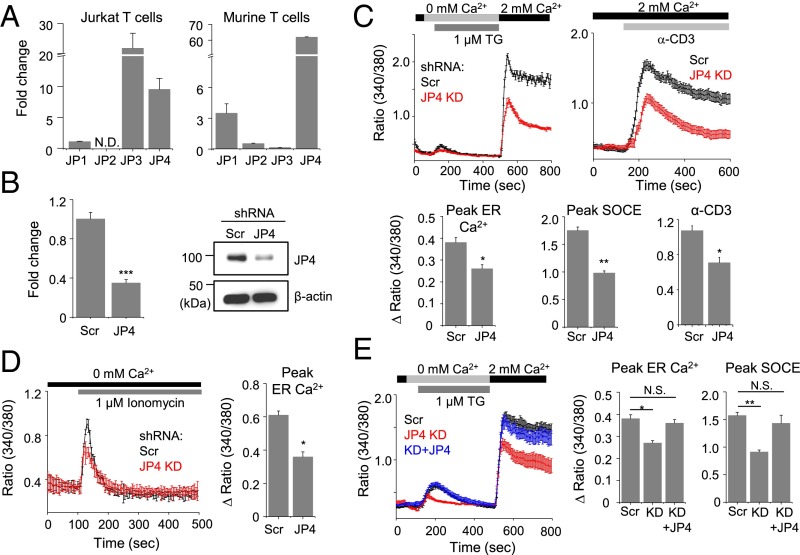
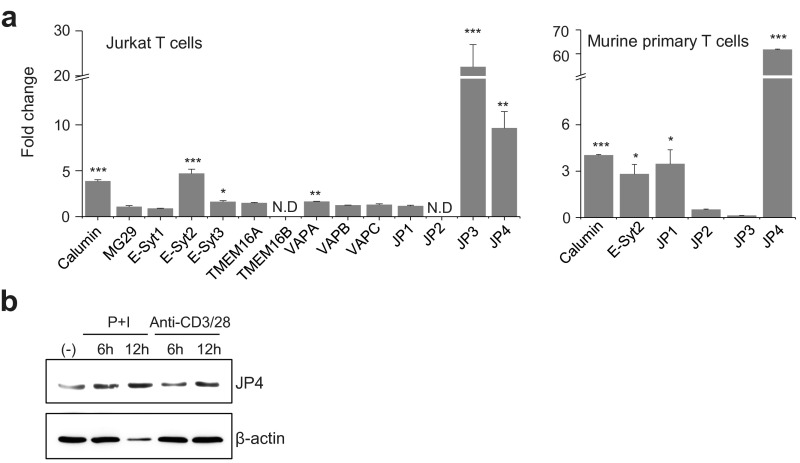
To identify components of the ER–PM junctions in T cells, we examined transcript expression of various molecules, including junctional proteins in excitable cells (calumin, MG29, and JP1 to -4), proteins involved in lipid modification and transfer (VAP-A, -B, and -C and TMEM16A and -B), and membrane-tethering proteins (E-Syt1, E-Syt2, and E-Syt3) in resting and stimulated Jurkat cells, a leukemic T-cell line. Among these candidates, mRNA expression of JP4 was induced by stimulation in both Jurkat and murine primary T cells (Fig. 1A and Fig. S1A). Increased mRNA expression of JP3 was also observed, but only in Jurkat cells. Consistent with these mRNA analyses, expression of JP4 protein in Jurkat cells was induced after stimulation (Fig. S1B). JP4 is the least understood member of the junctophilin family and, together with JP3, is known to play an important role in neurons. Although JP1 and JP2 have specific roles in skeletal and cardiac muscle cells, respectively, JP3 and JP4 have redundant function in the brain. Jph3 or Jph4 single knockout mice do not show obvious abnormalities; however, deletion of both genes causes severe growth retardation and premature death in mice, possibly due to impaired neuronal function (23). However, so far, the role of JP4 in other cell types has not been examined.
Fig. 1.
Decreased ER Ca2+ content and SOCE in JP4-depleted Jurkat cells. (A) Expression of junctophilin transcripts in Jurkat (Left) or murine primary CD4+ (Right) T cells with or without stimulation with phorbol 12-myristate 13-acetate (PMA) and ionomycin (6 h). Fold change depicts normalized mRNA levels relative to those under resting conditions. (B) Transcript (Left) and protein (Right) level of JP4 in Jurkat cells expressing control (Scr) or JP4-depleting shRNA (JP4). The transcript data show mean ± SEM of triplicates. (C) SOCE measurement in Jurkat cells expressing control (Scr) and JP4-depleting (JP4 KD) shRNA. Intracellular stores were passively depleted with thapsigargin (TG) (1 μM) in Ca2+-free solution, and SOCE was measured by perfusion with 2 mM Ca2+-containing solution (Left). TCR stimulation-induced SOCE was measured by cross-linking TCRs with α-CD3 antibody in the presence of external solution containing 2 mM Ca2+ (Right). (D) Measurement of ER Ca2+ content in Jurkat cells expressing control (Scr) and JP4-depleting shRNA after treatment with ionomycin (iono) (1 μM) in Ca2+-free solution. (E) Measurement of SOCE in Jurkat cells expressing control (Scr), JP4-depleting (JP4 KD) shRNA, or JP4-depleting shRNA plus siRNA-resistant JP4 after passive store depletion as described in C. In C–E, traces show averaged (±SEM) responses from 30 to 50 cells, and bar graph shows averaged peak [Ca2+]i ± SEM from three independent experiments. *P < 0.05, **P < 0.005, ***P < 0.0005.
Fig. S1.
Transcript levels of the ER–PM junctional proteins in T cells. (A) Transcript levels of the ER–PM junctional proteins determined by quantitative PCR (qPCR) using mRNAs extracted from Jurkat cells (Left) or primary murine CD4+ T cells (Right) under resting conditions and after stimulation with PMA and ionomycin for 6 h. Data show normalized fold change in expression compared with resting conditions. (B) Jurkat cells were stimulated with PMA (80 nM) and ionomycin (1 µM) or anti-CD3/28 antibody for 6 and 12 h. Lysates from unstimulated and stimulated Jurkat cells were subjected to immunoblot analyses to detect JP4. β-Actin was used as a loading control.
To determine the role of JP4 in T cells, we depleted its expression in Jurkat cells using short hairpin RNAs (shRNA) (selected from five different shRNAs) (Table S1). This hairpin reduced JP4 transcript and protein expression by ∼60% (Fig. 1B). JP4-depleted Jurkat cells showed reduced SOCE after passive depletion of the ER Ca2+ stores with thapsigargin, an inhibitor of the sarcoplasmic/endoplasmic reticulum Ca2+ ATPase (SERCA) pump or active depletion using anti-CD3 antibody cross-linking (Fig. 1C). Interestingly, ER Ca2+ content was also reduced in thapsigargin-treated JP4-depleted cells. We confirmed this observation using a strong ionophore, ionomycin, to ensure complete depletion of the ER Ca2+ stores (Fig. 1D). The specific role of JP4 in ER Ca2+ content and SOCE reduction was validated by rescue of these phenotypes in JP4-depleted cells expressing siRNA-resistant cDNA (Fig. 1E). Together, these results suggested an important role of JP4 in ER Ca2+ homeostasis and SOCE in T cells.
Table S1.
Sequences of primers for subcloning and quantitative RT-PCR and shRNAs for JP4 knockdown used in this study
| Plasmids | Forward primer sequence | Reverse primer sequence |
| Full-length JP4 in pMSCV-CITE-eGFP-PGK-Puro | CCGCTCGAGCTGTCCCCCGGG | GCGGAATTCGGTGAGGAGCTG |
| ΔMORN+TM in pMSCV-CITE-eGFP-PGK-Puro | CCCTCGAGATGGAGGAGGGCAAGTACAAG | CGGAATTCGGGGTTGGCAGCTCCCGG |
| Full-length JP4 in pC1-mCherry | AGATCTCGAGCTTCCCCCGGGGGCAAGTTCGAC | GCGGAATTCTCAGGTGAGGAGCTGGGAGAACAG |
| ΔMORN in pC1-mCherry | AGATCTCGAGCTGAGGAGGGCAAGTACAAG | GCGGAATTCTCAGGTGAGGAGCTGGGAGAACAG |
| ΔTM in pC1-mCherry | AGATCTCGAGCTTCCCCCGGGGGCAAGTTCGAC | GCGGAATTCtcaGGGGTTGGCAGCTCCCGG |
| JP4-shRNA#1 | ATCAGTTTGGCCATTCGAGCT | |
| JP4-shRNA#2 | AGCGAACGGCGAAAGAATCCG | |
| JP4-shRNA#3 | AAGACGCCCAGTGACTCGAAG | |
| JP4-shRNA#4 | AATGCCAGGCTGAGGTCCAGG | |
| JP4-shRNA#5 | TCTCGAAGACTTCCTGAACTG | |
| hGAPDH | ATCGTGGAAGGACTCATGACCACA | AGAGGCAGGGATGATGTTCTGGA |
| hJP1 | GGCGGAAGGTTCGACTTCG | GTAGCCCTGGTAGGTGTTGC |
| hJP2 | AAGCAGCGGTGCCAAGTAT | TGGGGTACTCCGTAGCCAT |
| hJP3 | CGTTGGGACTTGACCTTCTCC | CTGAGCCCGTACTGGACTTG |
| hJP4 | CGGGGCAAGGTTAAGGAGAAG | GGTCCTGGGCTATCAGTTTGG |
| hCalumin | GCTGACCTTCCTCTTGCATAA | CCTTGGTGCGACTACAGAAA |
| hMG29 | CTCCATCATCGTTGCATTTGG | CTCTGTGTAGAGGTTGTGGAAG |
| hE-Syt1 | TGGTGCTGATACCTGTGTATT | GACCTGGGCCACAATCTTAT |
| hE-Syt2 | CCAGACACTGAAAGAGCAGAA | AAGCTCCAACTAAGGGCATATC |
| hE-Syt3 | CCAGAAACAAGGTCAGCAAAG | CTCAAGAGTGAGGTCAGCATAG |
| hTMEM16-A | TTCCCAGCCTACCTCACTAA | GAAGATCAGCCTCTCCTCAAAG |
| hTMEM16-B | GCCACCCTCTTCTTCTCTATC | TCCAGCGTGTAGCCTTATTG |
| hVAP-1 | GCTCCACCAAACACTTCAGATA | TGCTACCTTTCTGAGCCTTAAA |
| hVAP-2 | TCTGTTGGGTGAACTGGTATTG | GCGCTGGAAGTGTGAGTAAT |
| hVAP-3 | TCTGTTGGGTGAACTGGTATTG | GCGCTGGAAGTGTGAGTAAT |
| mGAPDH | TGGAGATTGTTGCCATCAACGACCC | TAGACTCCACGACATACTCAGCACCG |
| mJP1 | AGGGGACCTGGAGTAACGG | CATGCCATAGGGCACACTCTG |
| mJP2 | GCTGGCTCTACAAGGGGGA | TTCCTCCGTCTGCGTAGGT |
| mJP3 | AGCTACGCAAGTCTGAGTCCA | CGTCCTGAATGACCGCCAG |
| mJP4 | AGCCCAGGATCTACAACCCAT | GGGGTCAGTCCATTCTCGT' |
| mCalumin | GTTGGAAGGGCAGGATGAAA | GCCAGAACACCACAGGTTATAG |
| mE-Syt2 | CATGCCTTTAGTTGGAGCTTTG | CCTTAGGACACCCTTTGGTATG |
| STIM1-shRNA | CCTCTCTTGACTCGCCATAAT |
JP4 Deficiency Affects ER Ca2+ Homeostasis, SOCE, and Cytokine Production in Primary T Cells.
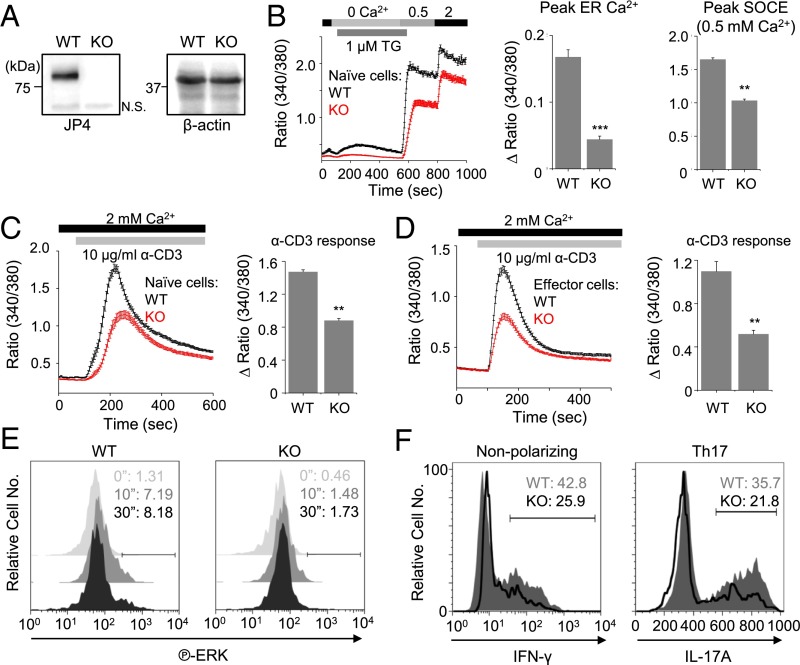
Next, we examined the physiological role of JP4 in T cells isolated from JP4 knockout mice (23). As expected, JP4 expression was abrogated in JP4 knockout primary naive CD4+ T cells (Fig. 2A). Furthermore, we observed a significant reduction in SOCE in JP4-deficent naive T cells after passive store depletion or TCR cross-linking (Fig. 2 B and C). Consistent with Jurkat cells, JP4 knockout primary T cells also showed a significant reduction in ER Ca2+ content (Fig. 2B). In addition, JP4-deficient effector T cells differentiated under nonpolarizing conditions also showed diminished SOCE after TCR cross-linking (Fig. 2D). These results confirm an important role of JP4 in ER Ca2+ homeostasis and SOCE.
Fig. 2.
Decreased Ca2+ signaling and effector function in JP4-deficient primary CD4+ T cells. (A) Immunoblot for detection of JP4 (Left) or β-actin (Right) in lysates from WT and JP4-deficient naive CD4+ T cells. N.S., nonspecific band. (B) SOCE measurement in WT and JP4-deficient (KO) naive T cells after passive store depletion with thapsigargin (TG) (1 μM) in Ca2+-free solution and addition of 0.5 and 2 mM Ca2+-containing solution. (C) SOCE measurements from WT and KO naive CD4+ T cells after TCR cross-linking with α-CD3 antibody in 2 mM Ca2+-containing solution. (D) SOCE measurement from WT and KO effector CD4+ T cells cultured under nonpolarizing conditions after TCR cross-linking as described in SI Materials and Methods. In B–D, traces show averaged (± SEM) responses from 30 to 50 cells, and bar graph shows averaged peak [Ca2+]i ± SEM from three independent experiments. (E) Representative flow plots showing phospho-ERK levels in WT and JP4-deficient naive T cells after stimulation with α-CD3 antibody (10 µg/mL) for indicated times. (F) Representative flow plots showing expression of IFN-γ and IL-17A in WT and JP4 KO T cells differentiated in the absence (Left) or presence (Right) of Th17-polarizing conditions for 4 d and restimulated with PMA and ionomycin (6 h). *P < 0.05, **P < 0.005, ***P < 0.0005.
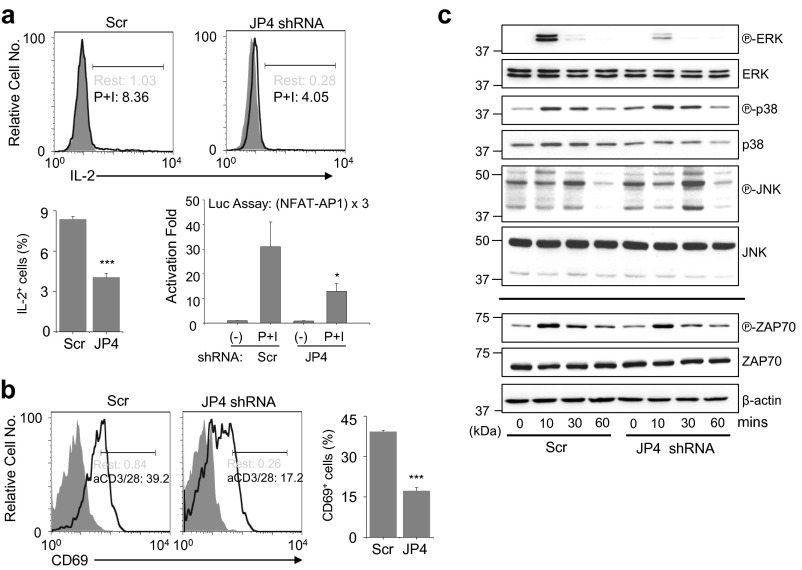
To investigate physiological outcomes of reduced SOCE in JP4-depleted cells, we examined Ca2+-dependent cytokine production. Accordingly, we observed reduced IL-2 expression in JP4-depleted cells (Fig. S2A). These results were supported by reduced NFAT-dependent luciferase expression in JP4-depleted cells. Furthermore, JP4-depleted cells also showed reduced expression of CD69, a T-cell activation marker, which is less dependent on the Ca2+-NFAT pathway (Fig. S2B). These results prompted us to examine the role of JP4 in activation of other signaling pathways downstream of TCR activation, including those of MAPKs—ERK, p38, and c-Jun N-terminal kinase (JNK). Although phosphorylation of p38 and JNK remained unaffected, that of ERK was substantially diminished in JP4-depleted Jurkat cells (Fig. S2C). An important role of Ca2+ in activation of the RasGRP1-ERK pathway in T cells has already been established (24). Therefore, it is likely that reduced ERK activation in JP4-depleted cells is caused by decreased SOCE. Consistent with these results, JP4-deficient T cells also showed decreased ERK activation after TCR stimulation (Fig. 2E). Finally, JP4-deficient effector T cells, differentiated under nonpolarizing or TH17-polarizing conditions, showed reduced expression of the effector cytokines IFN-γ and IL-17A, respectively (Fig. 2F). Together, these results suggest that JP4 is an important component of the Ca2+-dependent NFAT and ERK pathways to mediate T-cell activation and effector T-cell function.
Fig. S2.
JP4 depletion reduces activation of downstream signaling pathways after TCR stimulation. (A) Representative flow plots showing IL-2 expression in Jurkat cells expressing scrambled (Scr) or JP4 shRNA after stimulation with PMA (80 nM) and ionomycin (1 μM) for 6 h. Bar graph on the Left shows averaged percentage (±SEM) of IL-2–positive cells from three independent experiments. Bar graph on the Right shows activation fold of luciferase activity in control and JP4-depleted Jurkat cells transfected with a reporter plasmid containing three repeats of the NFAT-AP1 binding element. *P < 0.05, ***P < 0.0005. (B) Control and JP4-depleted cells were stimulated with anti-CD3 (2 μg/mL) and anti-CD28 (1 μg/mL) antibodies for 16 h and surface-stained for CD69. The bar graph shows averaged percentage (±SEM) of CD69-positive cells from three independent experiments. ***P < 0.0005. (C) Control and JP4-depleted cells were stimulated with anti-CD3 antibody (10 μg/mL) for the indicated times, and lysates were analyzed by immunoblotting for detection of phosphorylated or total ERK, p38, JNK, and ZAP70 proteins. β-Actin was used as a loading control. Data are representative of at least three independent experiments.
JP4 Controls ER Ca2+ Homeostasis and SOCE by Regulating STIM1 Function.
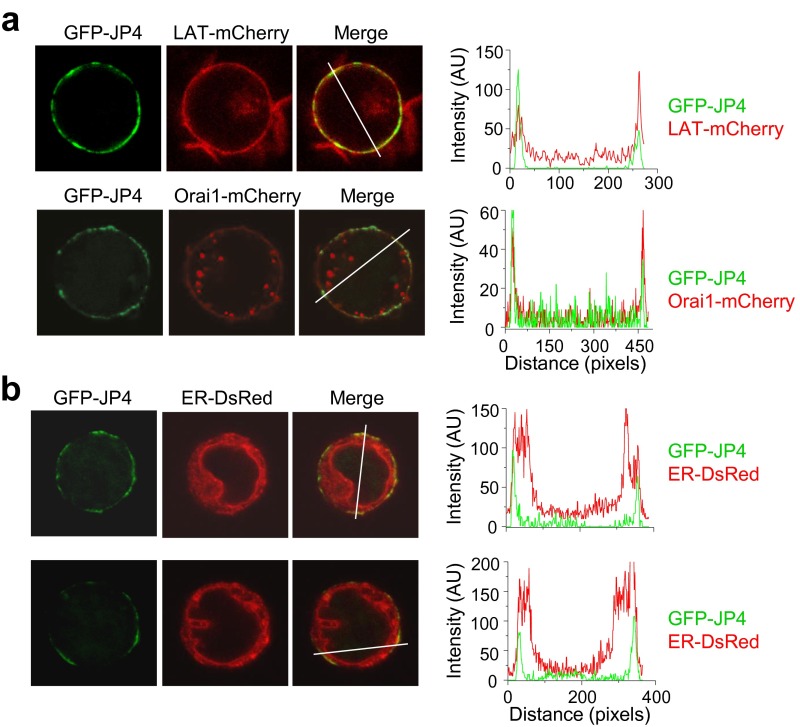
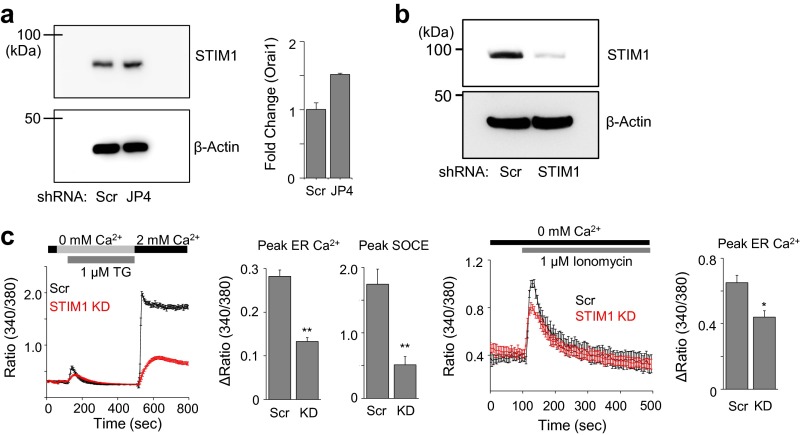
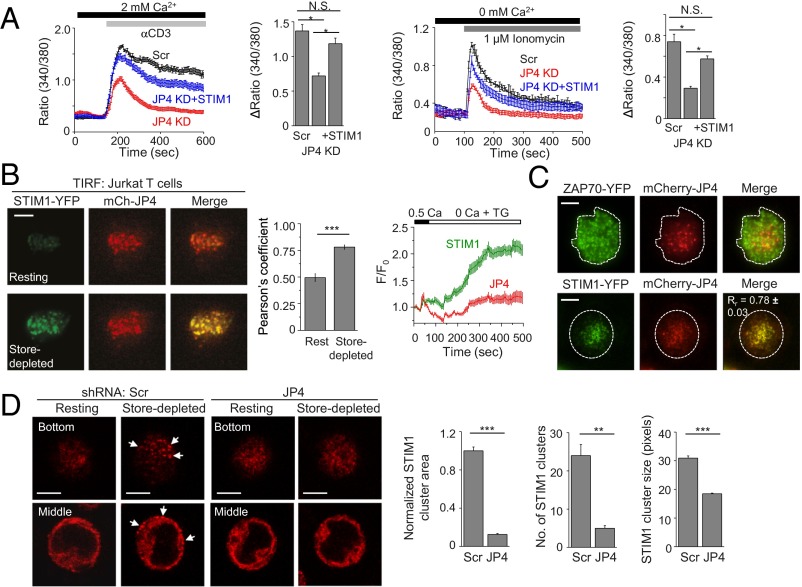
To elucidate the molecular mechanism of JP4 in regulation of ER Ca2+ content and SOCE, we first examined its localization in T cells. Confocal analyses showed colocalization of JP4 with PM markers as well as an ER marker in the peripheral ER close to the PM, validating its localization to the ER–PM junctions (Fig. S3). Furthermore, expression of Orai1 or STIM1 was not altered in JP4-depleted cells (Fig. S4A), suggesting that reduced SOCE is not due to altered expression of the CRAC channel components. Recently, it was shown that, in addition to mediating SOCE, STIM1 is also important for the replenishment of ER Ca2+ stores in resting Purkinje neurons (25). Similarly, in STIM1-depleted T cells, we observed reduction in both the ER Ca2+ content and SOCE (Fig. S4 B and C). Importantly, expression of STIM1 in JP4-depleted Jurkat cells significantly rescued the decreased ER Ca2+ content and SOCE, indicating that JP4 may regulate STIM1 function (Fig. 3A).
Fig. S3.
JP4 localizes at the ER–PM junctions in T cells. (A) Confocal microscopy images from the center of Jurkat cells expressing GFP-JP4 with LAT-mCherry (Top) or Orai1-mCherry (Bottom). LAT and Orai1 were used as markers for the plasma membrane under resting conditions. Line scan analysis of the overlay image shows colocalization by coincident alignment of fluorescent peak intensities (in arbitrary intensity units). (B) Confocal microscopy images from the center of two different Jurkat cells expressing GFP-JP4 together with ER-DsRed. Line scan analysis of the overlay image shows colocalization at the peripheral ER region by coincident alignment of fluorescent peak intensities.
Fig. S4.
STIM1 depletion reduces ER Ca2+ content in T cells. (A) Expression of STIM1 (Left) and Orai1 (Right) in control and JP4-depleted Jurkat cells detected by immunoblotting and quantitative RT-PCR, respectively. The transcript data show mean ± SEM of triplicates. (B) STIM1 expression in control (Scr) or STIM1-depleted (STIM1 KD) Jurkat cells determined by immunoblotting. β-Actin was used as a loading control. (C) SOCE and ER Ca2+ content measurements in control (Scr) or STIM1-depleted (STIM1 KD) Jurkat cells after passive store depletion with thapsigargin (TG) (1 μM) in Ca2+-free solution, and addition of 2 mM Ca2+-containing solution (Left). Traces show averaged (±SEM) responses from 30 to 50 Jurkat T cells. Bar graphs show change in ER Ca2+ content and SOCE (±SEM) from three independent experiments. Control (Scr) and STIM1-depleted (KD) Jurkat cells were treated with ionomycin (1 μM, iono) in Ca2+-free solution to measure the ER Ca2+ content (Right two panels). Traces show averaged (±SEM) responses from 30 to 50 cells, and bar graph shows change in ER Ca2+ content (±SEM) from three independent experiments. *P < 0.05, **P < 0.005.
Fig. 3.
JP4 is important for STIM1 recruitment at the ER–PM junctions. (A) Rescue of decreased SOCE and ER Ca2+ content in JP4-depleted Jurkat cells by STIM1 expression. Measurement of SOCE after TCR cross-linking in control (Scr), JP4-depleted (JP4 KD) cells, and JP4 KD cells expressing STIM1 (JP4 KD + STIM1) in the presence of external solution containing 2 mM Ca2+ (Left). These cells were also treated with ionomycin (1 μM) in Ca2+-free solution to measure the ER Ca2+ content (Right). Traces show averaged (±SEM) responses from 30 to 50 cells, and bar graph shows averaged peak [Ca2+]i ± SEM from three independent experiments. (B) Representative TIRF images of a Jurkat cell expressing STIM1-YFP and mCherry-JP4 under resting conditions (Top) or after store depletion with TG (Bottom). Bar graph (Right) shows average Pearson’s correlation coefficient values (±SEM) from 11 cells. Line graph shows the time course of change in normalized fluorescence intensity (average ± SEM) from 11 cells. (C) Representative TIRF images of Jurkat cells expressing ZAP70-YFP (Top) or STIM1-YFP (Bottom) with mCherry-JP4 (Top) after TCR stimulation on α-CD3 antibody-coated coverslips. The merge panel shows average Pearson’s correlation coefficient values (±SEM) from 8 cells. (D) Representative confocal images showing localization of endogenous STIM1 in Scr (Left) and JP4-depleted (Right) Jurkat cells before or after store depletion with TG. Two different sections from the center (“Middle”) or the footprint (“Bottom”) of the cell are shown. Arrows point toward STIM1 clusters. Bar graphs show normalized area (Left), number (Center), and size (Right) of STIM1-containing clusters from 8 to 12 cells after store depletion. *P < 0.05, **P < 0.005, ***P < 0.0005. (Scale bars: 5 μm.)
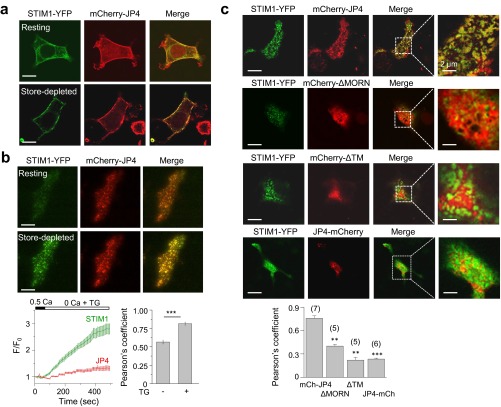
To understand how JP4 regulates STIM1 function, we examined their localization under resting and store-depleted conditions in HEK293 and Jurkat cells. In HEK293 cells, under resting conditions, mCherry-JP4 localized to the PM-proximal areas whereas STIM1-YFP was primarily in the ER (Fig. S5A). After store depletion, STIM1 was primarily detected in the periphery at the ER–PM junctions with JP4. To monitor the kinetics of accumulation of STIM1 together with JP4 at the ER–PM junctions, we used live-cell total internal reflection fluorescence (TIRF) microscopy. Under resting conditions, JP4 showed a punctated localization at the junctions, and, after store depletion, STIM1 was recruited to those JP4-marked junctions (Fig. S5B). Notably, the fluorescence intensity of JP4 did not significantly change between resting and store-depleted conditions. Truncation of either the phospholipid-binding MORN motifs (ΔMORN) or the ER membrane traversing TM segment (ΔTM) abolished JP4 colocalization with STIM1 at the junctions, suggesting their importance in STIM1 recruitment (Fig. S5C). Furthermore, we observed an influence of the site of attachment of the fluorescent protein on JP4 and STIM1 colocalization. The presence of mCherry in the N terminus of JP4 did not influence its colocalization with STIM1 whereas that in the C terminus (ER-luminal side) inhibited colocalization. These results suggested that mCherry fusion to the ER-luminal side of JP4 inhibits STIM1 from accessing the JP4-containing ER–PM junctions, possibly due to space constraints. Therefore, we used only the mCherry-JP4 construct for subsequent studies.
Fig. S5.
JP4 colocalizes with STIM1 at the ER–PM junctions in HEK293 cells. (A) Representative confocal images of HEK293 cells coexpressing STIM1-YFP and mCherry-JP4 under resting conditions (Top) or after passive store depletion with TG (Bottom). (Scale bars: 10 μm.) (B) Representative live cell TIRF images of a HEK293 cell coexpressing STIM1-YFP and mCherry-JP4 under resting conditions (Top) or after passive store depletion with TG (Bottom). (Scale bars: 10 μm.) The line graph below shows the time course of change in normalized fluorescence intensity (average ± SEM) from measurements of eight cells expressing STIM1 (green) and JP4 (red). The bar graph shows Pearson’s correlation coefficient values (±SEM) before and after store depletion. (C) Representative confocal images of HEK293 cells coexpressing STIM1-YFP with mCherry-JP4 (N-terminal fusion), mCherry-ΔMORN, mCherry-ΔTM, and JP4-mCherry (C-terminal fusion) proteins after passive store depletion with TG. (Scale bars: 10 μm.) The bar graph (below) shows Pearson’s correlation coefficient values (±SEM) from the indicated number of cells. **P < 0.005, ***P < 0.0005.
Next, we examined the localization of JP4 with STIM1 in T cells. Similar to HEK293 cells, TIRF microscopy showed enhanced colocalization of JP4 and STIM1 after passive store depletion in Jurkat cells (Fig. 3B). To examine their accumulation upon physiological stimulation, we monitored their localization at the contact site between T cells and anti-CD3 antibody-coated coverslips. TCR engagement induces accumulation and colocalization of Orai1 and STIM1 in clusters at the site of stimulation (26, 27). Upon T-cell receptor stimulation, we observed specific localization of JP4 near the center of the cell whereas ZAP70, a protein tyrosine kinase involved in proximal TCR signaling, accumulated in clusters throughout the footprint of the cell (Fig. 3C). Interestingly, we observed a strong colocalization between JP4 and STIM1 at the center of the contact sites. Together with previous observation that STIM1 colocalizes with Orai1 upon TCR stimulation (27), these data show the presence of JP4 at the site of Orai1 and STIM1 accumulation. Finally, to understand how JP4 affected STIM1 recruitment into the junctions, we examined localization of endogenous STIM1 in control or JP4-depleted Jurkat T cells. In control cells, endogenous STIM1 showed prominent accumulation at the PM proximal regions after store depletion (Fig. 3D, white arrows); however, the area, number, and size of STIM1-containing clusters was significantly reduced in JP4-depleted Jurkat cells. Together, these results suggested that JP4 is localized to the ER–PM junctions in resting cells and plays an essential role in STIM1 recruitment into these junctions after store depletion.
JP4 Physically Interacts with STIM1 to Regulate SOCE.
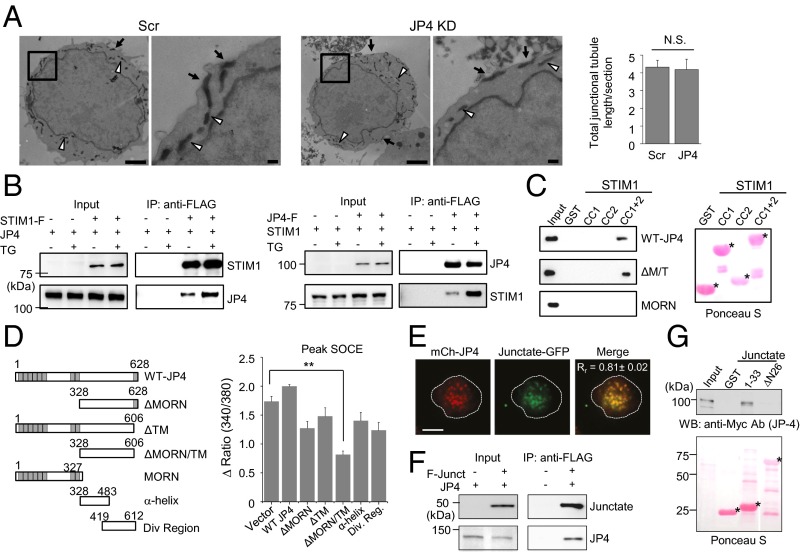
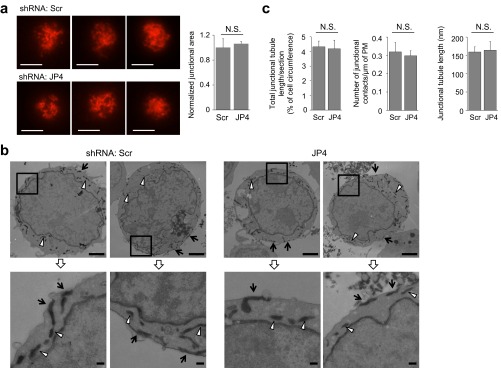
We envisaged two possible mechanisms via which JP4 can regulate STIM1 translocation, and thus SOCE. These mechanisms include affecting the formation of the ER–PM junctions in T cells as a structural component or recruiting STIM1 into the junctions via protein interaction. To differentiate between these possibilities, we examined the numbers and area of the ER–PM junctions in control or JP4-depleted cells by TIRF and electron microscopy. However, we did not observe any reduction in the area, number, or length of the PM-proximal ER tubules in JP4-depleted Jurkat cells (Fig. 4A and Fig. S6). These results suggest that JP4 is not a crucial structural component for tethering of the PM and ER membranes in T cells or that other junctional proteins may compensate in formation of the ER–PM junctions. In any case, our data show that a decrease in SOCE by JP4 depletion or deletion was not caused by reduced ER–PM junctions.
Fig. 4.
JP4 interacts with STIM1 via the cytoplasmic domain and forms a protein complex with junctate. (A) Representative electron microscopy images of control and JP4-depleted Jurkat cells expressing HRP-ER and processed for HRP cytochemistry showing ER tubules at the ER–PM junctions (arrows) and in the cytoplasm (white arrowheads). Bar graph shows the total length of the junctional HRP-tubules per section (normalized to the PM circumference) in control (n = 15) and JP4-depleted (n = 19) cells. (Scale bars: 2 μm; Inset, 0.2 μm.) (Fig. S6). (B) JP4 coimmunoprecipitates with STIM1. Immunoprecipitates of anti-FLAG antibody from HEK293 cells expressing FLAG-STIM1 and GFP-JP4 were immunoblotted for detection of STIM1 (anti-FLAG antibody) and JP4 (anti-GFP antibody), respectively (Left). For reverse immunoprecipitation, immunoprecipitates from cells expressing FLAG-JP4 and STIM1 were immunoblotted for detection of JP4 (anti-FLAG antibody) and STIM1 (anti-STIM1 antibody) (Right). Cells were left untreated or treated with thapsigargin for 5 min to deplete the ER Ca2+ stores before lysis. (C) JP4 interacts with the CC1 and CC2 region of STIM1. (Left) GST pulldown analyses using indicated fragments of STIM1 (CC1, amino acids 234–340; CC2, amino acids 363–389, CC1+2, amino acids 250–400) with full-length JP4, ΔMORN/ΔTM (ΔM/T), and the MORN domains. (Right) Ponceau S staining of the same blot. (D) SOCE measurement from Jurkat cells expressing full-length JP4 or its fragments. Schematic of full-length JP4 and its fragments used in this study (Left). Gray boxes indicate the N-terminal MORN domains or the C-terminal TM segment. Bar graph shows averaged peak SOCE ± SEM from three independent experiments (Right). **P < 0.005. (E) Colocalization of JP4 with junctate at the ER–PM junctions. Representative TIRF images of a Jurkat cell expressing junctate-GFP and mCherry-JP4. Pearson’s correlation coefficient (Rr; ± SEM) was calculated from 13 cells. (F) JP4 coimmunoprecipitates with junctate. HEK293 cells stably expressing FLAG-Junctate were transfected with a plasmid encoding GFP-JP4. FLAG immunoprecipitates were immunoblotted for detection of junctate (anti-FLAG antibody) and JP4 (anti-GFP antibody). (G) JP4 directly interacts with junctate. GST pulldown analysis was performed between the N-terminal 33 amino acid fragment of junctate (“1-33”) or junctate lacking the N-terminal 26 amino acids (ΔN26) with full-length JP4 purified from insect cells. (Bottom) Ponceau S staining of the same blot.
Fig. S6.
JP4 depletion does not alter the number and size of ER–PM junctions in T cells. (A) Representative TIRF images of control (Top) and JP4-depleted (Bottom) Jurkat cells expressing an ER-resident protein, Sec61β. (Scale bars: 10 μm.) The bar graph shows the normalized area in the footprint of cells covered by mCherry-Sec61β, which was calculated using ImageJ software as described in Materials and Methods. N.S., not significant. (B) Ultrastructural localization of the ER in control and JP4-depleted Jurkat cells. Representative electron microscopy images of two control and two JP4-depleted Jurkat cells expressing HRP-ER showing ER tubules at the ER–PM junctions (arrows) and cytoplasm (arrowheads). Bottom panels represent higher magnification images of the boxed areas in the Top panels. (Scale bars: Top, 2 μm (Top); Inset (Bottom), 0.2 μm.) (C) Quantification of ER–PM junctional area from control (Scr) and JP4-depleted (JP4) Jurkat cells. The total length of junctional tubules per section (normalized to the circumference of PM, presented in Fig. 4A), the number of junctional contact sites (per micrometer of the PM), and mean junctional tubule length (±SEM) were measured from 15 control and 19 JP4-depleted cells. N.S., not significant.
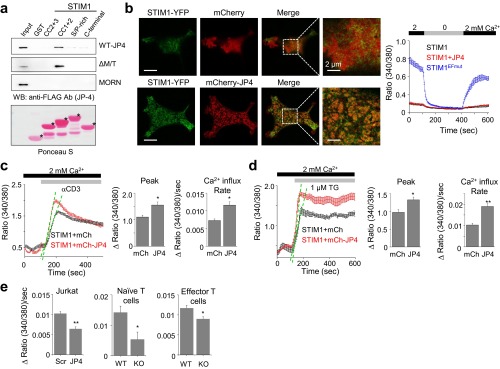
To examine whether JP4 recruits STIM1 to the junctions by physical interaction, we checked for their interaction using immunoprecipitation and pulldown analysis. In coimmunoprecipitation experiments, we could detect GFP-JP4 only in the immunoprecipitates of HEK293 cells expressing FLAG-STIM1, but not in those without STIM1 (Fig. 4B). Conversely, we detected STIM1 only in the immunoprecipitates from HEK293 cells expressing FLAG-JP4. In both the cases, we observed a substantial increase in their interaction after store depletion. To narrow down the interaction domain, we generated fragments of both JP4 and STIM1 for GST pulldown analyses. Because JP4 does not contain any ER-luminal domain, we checked its interaction with the cytoplasmic fragments of STIM1 corresponding to the coiled-coil domains (CC) 1 and 2 (amino acids 250–400), the Orai1-interacting domain containing CC2 and CC3 (amino acids 342–448), the serine and threonine-rich region (amino acids 400–600), and the C-terminal PIP2-interacting domain (amino acids 600–685). GST pulldown analyses showed a direct interaction of JP4 with the STIM1 fragment containing both the CC1 and CC2 regions (Fig. 4C and Fig. S7A). Further truncations of either CC1 or CC2 abolished their interaction. These results suggested that both CC1 and CC2 regions of STIM1 are required for its interaction with JP4. We also identified a cytoplasmic fragment of JP4 lacking the PM-binding MORN domain and the TM segment (amino acids 328–606; ΔMORN/TM) to be sufficient for interaction with STIM1. To summarize, these studies identified the cytoplasmic regions of both JP4 and STIM1 necessary for their interaction.
Fig. S7.
JP4 interacts with STIM1 and influences the rate of store-operated Ca2+ entry. (A) Interaction between the cytoplasmic fragments of STIM1 and JP4. GST pulldown analysis using cytoplasmic fragments of STIM1 (CC2 + 3, amino acids 342–448; CC1 + 2, amino acids 250–400; S/P-rich, amino acids 400–600; C-terminal, amino acids 600–685) with full-length JP4, ΔMORN/ΔTM (ΔM/T), and the MORN domains. (Bottom) Representative Ponceau S staining to show the relative amount of each GST-fused STIM1 fragment. (B) Confocal images from the footprint of cells showing clustering of STIM1-YFP at the ER–PM junctions in HEK293 cells expressing high levels of mCherry-JP4 without store depletion. Graph shows Ca2+ measurement from the same cells to examine whether recruitment of STIM1 by JP4 alters resting [Ca2+]. The constitutively active, STIM1 EF-hand mutant was used as a positive control. (C) SOCE measurements from Jurkat cells expressing STIM1 together with mCherry or mCherry-JP4 after stimulation with anti-CD3 antibody. The bar graphs show baseline subtracted Peak ratio (Left) and the rate of Ca2+ influx (±SEM), measured by change in ratio (Peak-basal) normalized to the time required to reach the peak. Dashed lines indicate initial rates of Ca2+ influx. (D) SOCE measurements from Jurkat cells expressing STIM1 together with mCherry or mCherry-JP4 after passive store depletion with thapsigargin (TG) in 2 mM Ca2+-containing extracellular solution. The bar graphs show peak ratio and rate of Ca2+ influx (±SEM) as described in C. (E) The rate of increase of SOCE (±SEM) was calculated from control (Scr), JP4-depleted Jurkat cells (JP4), or JP4 KO primary naive and effector T cells after stimulation with anti-CD3 antibody (original data derived from Figs. 1C and 2 C and D). *P < 0.05, **P < 0.005.
High overexpression of JP4 induced STIM1 clustering at the junctions even without store depletion, most likely by protein interaction (Fig. S7B). However, such recruitment of STIM1 did not increase the resting cytoplasmic [Ca2+], unlike the STIM1 EF-hand mutant, which constitutively induces Ca2+ entry. These results suggest that JP4 can recruit STIM1 into the junctions but cannot induce its open conformation to activate Ca2+ entry. We surmised that trapping of STIM1 by JP4 should reduce the time required for its translocation into the junctions to induce SOCE. Accordingly, we observed an increased rate of activation of SOCE in Jurkat cells overexpressing JP4 after TCR cross-linking or passive store depletion in the presence of a 2-mM Ca2+-containing external solution (Fig. S7 C and D). Conversely, we also observed a reduced rate of Ca2+ entry in JP4-depleted or deleted T cells under similar conditions (Fig. S7E). Together, these results suggest that JP4 is involved in efficient STIM1 recruitment into the junctions by capturing it after store depletion via direct interaction.
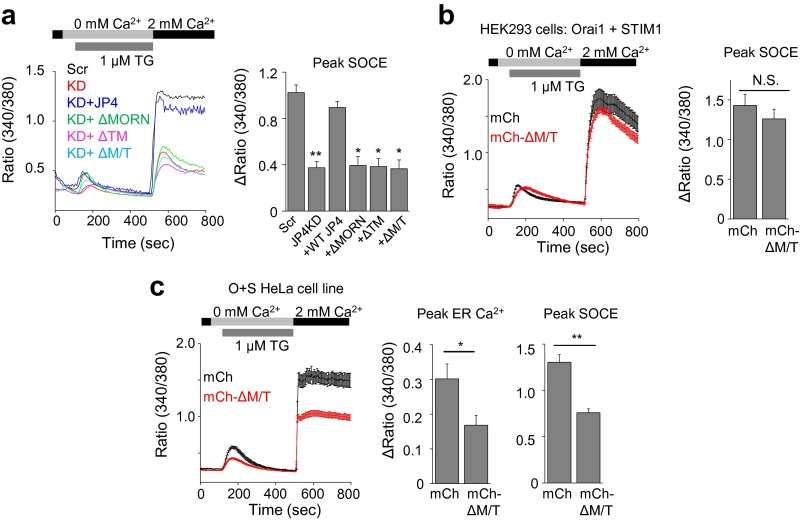
Our biochemical analyses identified binding of STIM1 to the ΔMORN/TM fragment of JP4. We hypothesized that overexpression of this cytoplasmic fragment should inhibit STIM1 accumulation and reduce SOCE. Accordingly, among various fragments, the ΔMORN/TM fragment of JP4 showed a strong inhibition of SOCE in Jurkat cells (Fig. 4D). None of these fragments could rescue SOCE in JP4-depleted Jurkat cells, consistent with their lack of colocalization with STIM1 (Figs. S5C and S8A). The dominant negative effect of the cytoplasmic ΔMORN/TM fragment was dependent on the STIM1 expression level because it did not affect SOCE in HEK293T cells transiently overexpressing Orai1 and STIM1 whereas it reduced SOCE in HeLa cells moderately expressing these two proteins via stable expression (Fig. S8 B and C). It is interesting that the cytoplasmic ΔMORN/TM fragment showed a greater inhibition of SOCE than other fragments, including the ER-localized ΔMORN fragment, which should have a higher probability to interact with STIM1. At the current stage, we do not understand the exact mechanism behind this inhibitory effect, but it is possible that, in addition to the MORN domain, truncation of the TM segment is necessary for full exposure of the STIM1-interacting domain. Together, these data suggest that JP4-STIM1 interaction is important for SOCE and that expression of the cytoplasmic ΔMORN/TM fragment is likely to sequester endogenous STIM1 from binding to JP4, and thus inhibit SOCE.
Fig. S8.
Inhibition of SOCE by the STIM1-interacting, cytoplasmic fragment of JP4. (A) WT JP4 and its fragments were expressed in JP4-depleted Jurkat cells, and SOCE levels were measured after store depletion with TG. (B) SOCE measurements from HEK293 cells transiently expressing Orai1 and STIM1 together with mCherry (black trace) or mCherry-ΔM/T fragment (red trace) after store depletion with TG. (C) SOCE measurements from HeLa cells stably expressing Orai1 and STIM1 after transient transfection with mCherry (black trace) or mCherry-ΔM/T fragment (red trace) after store depletion with TG. In all of the panels, traces show averaged (±SEM in B and C) responses from 30 to 50 cells, and the bar graph shows averaged responses (±SEM) from three independent experiments. N.S., not significant. *P < 0.05, **P < 0.005.
JP4–Junctate Protein Complex at the ER–PM Junctions in T Cells.
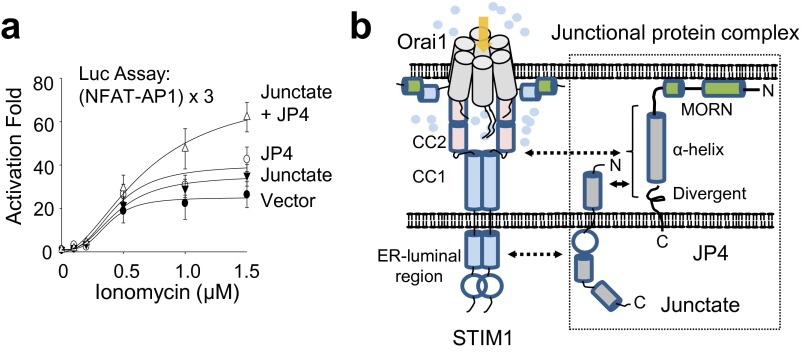
Earlier, we had identified junctate as a component of the ER–PM junctions in T cells (15). One caveat to defining junctate as a component of the ER–PM junctions is that, unlike JP4, it is distributed throughout the ER membrane, not just the PM-proximal region. A possible explanation lies in the very short N terminus of junctate, which lacks obvious phospholipid-binding motifs. However, it is possible that junctate interacts with PM-resident or specific junctional proteins to localize to the ER–PM junctions to mediate STIM1 recruitment. Interestingly, in Jurkat cells coexpressing JP4 and junctate, we observed a significant colocalization between these proteins at the junctions (Fig. 4E). We could also detect JP4 in junctate immunoprecipitates, suggesting an interaction between these two proteins (Fig. 4F). Because JP4 lacks a significant ER-luminal domain, we surmised that interaction between the two proteins should involve their N-terminal cytoplasmic regions. GST pulldown experiments showed a direct interaction of the short N-terminal cytoplasmic fragment of junctate with full-length JP4, which was abolished by truncation of this N-terminal fragment (Fig. 4G). In addition, we found a synergistic effect of coexpression of both JP4 and junctate on NFAT-driven luciferase expression in Jurkat cells (Fig. S9A). Together, these observations suggest the presence of a protein complex consisting of JP4 and junctate at the ER–PM junctions. Because both the proteins are prelocalized to the junctions and interact with STIM1, it is likely that the JP4–junctate protein complex can have a synergistic effect on STIM1 recruitment into the ER–PM junctions.
Fig. S9.
Role of the JP4–junctate complex in the Ca2+-NFAT signaling pathway. (A) Coexpression of junctate and JP4 enhances NFAT activity in Jurkat cells. Fold change in luciferase activity from Jurkat cells expressing junctate, JP4, or both proteins after stimulation with PMA (80 nM) and indicated concentrations of ionomycin for 6 h. The activation fold was normalized to those of unstimulated Jurkat T cells. (B) Schematic of ER–PM junctions in T cells containing junctate and JP4 to recruit STIM1. Double-headed arrows indicate the interaction domains among JP4, junctate, and STIM1. In resting T cells, JP4 forms a protein complex with junctate at the ER–PM junctions. After store depletion triggered by T-cell receptor stimulation, junctate and JP4 interact with STIM1 through their ER-luminal and the cytoplasmic regions containing the α-helix and divergent region, respectively. The CC1-CC2 and ER-luminal regions of STIM1 are involved in the interaction with JP4 and junctate. The Orai1 and phospholipid-interacting domains of STIM1 are also indicated. See Discussion for details.
Discussion
The importance of junctional proteins is highly emphasized in excitable cells (3, 28). Dyad or triad junctions are the primary sites for Ca2+ dynamics in cardiac or skeletal muscle cells. Specialized proteins connecting the plasma and the ER membranes reside within these junctions (3, 28, 29). These junctional proteins include various single transmembrane segment-containing proteins, such as junctophilins, junctin, junctate, mitsugumins, and sarcalumenin. However, it was not known whether these proteins are expressed and perform similar functions in nonexcitable cells. We found that, among them, JP4 is located at the ER–PM junctions in T cells, where it plays an essential role in both ER Ca2+ refilling as well as SOCE, primarily mediated by its interaction with STIM1. A schematic showing the proposed mechanism of activation of SOCE by JP4 is illustrated in Fig. S9B. Junctate and JP4 form a protein complex at the ER–PM junctions through the interaction between their cytoplasmic N termini. Strategic formation of protein complexes between the PM and ER-resident proteins to shape the junctions is common, as exemplified by the protein complexes formed by the PM-resident oxysterol-binding protein-related protein (ORP) and the ER-resident VAP proteins for lipid transfer (1). An important aspect of this junctate–JP4 protein complex is the capacity of both proteins to interact with STIM1, which can be important for increasing the efficiency and determining the site of STIM1 recruitment. The interaction between STIM1 and junctate are mediated by their ER-luminal regions (15) whereas that between STIM1 and JP4 is mediated by their cytoplasmic regions. It is technically difficult to demonstrate an increased affinity of STIM1 for the JP4–junctate complex vs. the individual proteins because of the qualitative nature of GST pulldown and immunoprecipitation techniques used. However, it is highly likely that the junctate–JP4 complex can have a synergistic effect on recruiting STIM1 to the junctions compared with individual proteins, considering their interactions with distinct regions of STIM1.
Two mechanisms for STIM1 recruitment into the ER–PM junctions have been reported. One depends on PIP2 enrichment at the junctions and the other is mediated by protein interactions. JP4 contains phospholipid-binding MORN motifs, which are highly conserved among the JP family. Interestingly, the MORN motifs of junctophilins have been shown to bind with high affinity to phosphatidylinositol (PI) monophosphates PI(3)P, PI(4)P, and PI(5)P and phosphatidyl serine (PS) whereas its affinity for PIP2 was lower, suggesting that JP4 may not play a significant role in PIP2 enrichment at the ER–PM junctions to mediate STIM1 recruitment (30). Instead, our study shows that JP4 forms a complex with junctate at the ER–PM junctions and recruits STIM1 into these junctions by protein interaction. Although JP4 can recruit STIM1 into the junctions, it is not sufficient to induce the open conformation of STIM1, necessary to activate SOCE. In addition to SOCE, JP4 is important for ER Ca2+ homeostasis. It is possible that the junctions defined by localization of JP4, junctate, and STIM1 play an important role in ER Ca2+ refilling. In addition to STIM1, STIM2, which has a lower Ca2+ binding affinity, has been shown to play an important role in this process (31, 32). Further studies are required to examine whether the JP4–junctate complex is necessary for STIM2 recruitment to affect ER Ca2+ refilling in T cells.
Another possible role of JP4 can be its involvement in the ER stress pathways. ER stress activates the unfolded protein response (UPR) that contributes to regulation of various intracellular signaling pathways, including Ca2+ and lipid signaling (33). ER stress responses help in controlling tissue damage and repair. However, under pathological conditions, ER stress-induced inflammation exacerbates diabetes, obesity, atherosclerosis, and cancer. A common feature of ER stress is ER Ca2+ depletion that can be sensed by the STIM proteins (34). The physiological role of the junctional proteins in ER stress needs further investigation for a better understanding of the human pathologies underlying neurodegenerative disorders, Huntington’s disease-like 2 (HDL2), arterial fibrillation, and cardiac hypertrophy caused by point mutations in junctate or junctophilins (35, 36). In summary, we uncovered an unexpected role of JP4 in ER Ca2+ homeostasis and Ca2+ signaling in T cells. Mechanistically, JP4 interacts with junctate to form a protein complex at the ER–PM junctions to recruit STIM1 by direct protein interaction. This study will help in understanding the composition of the ER–PM junctions in T cells and in uncovering their possible role in the pathology of human diseases caused by mutations in these proteins.
Materials and Methods
Plasmids and Cells.
GST-tagged truncated STIM1 fragments have been previously described (37). The cDNA encoding murine junctophilin-4 (JP4, clone ID 6810400) was purchased from Open Biosystems (GE Dharmacon). FLAG-, mCherry-, or eGFP-fused full-length JP4 and its fragments were subcloned into pMSCV-CITE-eGFP-PGK-Puro, pN1-mCherry, pC1-mCherry, or pEGFPC1 vectors using primers shown in Table S1. Please see SI Materials and Methods for details.
Mice.
All animals were maintained in pathogen-free barrier facilities and used in accordance with protocols approved by the Institutional Animal Care and Use Committee at the University of California, Los Angeles.
Single-Cell Ca2+ Imaging, Total Internal Reflection Fluorescence, and Confocal Microscopy.
Single-cell Ca2+ imaging of T Cells loaded with 1 μM Fura 2-AM was performed as previously described (38). Please see SI Materials and Methods for details.
Immunoprecipitation and GST Pulldown Analyses.
GFP-JP4–transfected HEK293T cells stably expressing FLAG-tagged STIM1 or JP4 were lysed and centrifuged at 100,000 × g for 1 h before preclearing. Lysates were immunoprecipitated with anti-FLAG antibody and protein A/G-Sepharose. Immunoprecipitates were washed and analyzed by immunoblotting. For pulldown analyses, GST-fused STIM1 fragments (37) and precleared lysates from HEK293 cells transfected with plasmids encoding FLAG-tagged JP4 were incubated in binding buffer. After multiple washes, bound proteins were analyzed by immunoblotting. Please see SI Materials and Methods for details.
SI Materials and Methods
Reagents and Antibodies.
Fura 2-AM and Lipofectamine 2000 were obtained from Invitrogen. Thapsigargin, phorbol 12-myristate 13-acetate (PMA), and ionomycin were purchased from EMD Millipore. Brefeldin A was purchased from eBioscience. Anti-FLAG antibody (F3165) from Sigma-Aldrich was used at 1:10,000 dilution. Anti–phospho-p44/42 MAPK (4377S), p44/42 MAPK (9102S), phospho-p38 MAPK (4511P), p38 MAPK (9212S), phospho-SAPK/JNK (9255S), SAPK/JNK (9252S), phospho-ZAP70 (2717P), and ZAP70 (3165P) antibodies from Cell Signal Technology were used at 1:1,000 dilution. Anti-β-actin (SC-1616) and GFP (SC-9996) antibodies from Santa Cruz Biotechnologies were used at 1:2,500 dilution. Hybridoma supernatant containing monoclonal anti-JP4 antibody was used at 1:10 dilution (21). Antibodies for staining human IL-2 (clone MQ1-17H12) and CD69 (clone FN50) and murine IFN-γ (clone XMG1.2) and IL-17A (clone ebio17B7) were obtained from eBioscience.
Plasmids and Cells.
cDNA encoding murine Junctophilin-4 (JP4, clone ID 6810400) was purchased from Open Biosystems (GE Dharmacon). The FLAG tag, mCherry, or eGFP-fused full-length JP4 and its fragments were subcloned into pMSCV-CITE-eGFP-PGK-Puro, pN1-mCherry, pC1-mCherry, or pEGFPC1 vectors using primers described in Table S1. GFP-junctate plasmid has been described earlier (15). GST-tagged truncated fragments of STIM1 corresponding to amino acids 250–400 [containing coiled-coil domains (CC) 1 and 2], the CAD domain (amino acids 342–448), the serine and threonine-rich region (amino acids 400–600), and the C-terminal PIP2-interacting domain (amino acids 600–685) have been previously described (37). New fragments corresponding to CC1 (amino acids 234–340) and CC2 (amino acids 363–389) domains were PCR amplified and subcloned into a pGEX4T-1 plasmid. Fragments of junctate corresponding to amino acids 1–33 and 27–299 were PCR amplified and subcloned into a pGEX4T-1 vector. HEK293, HeLaS3, and Jurkat T-cell lines were obtained from American Type Culture Collection Center. All of the clones were verified by sequencing. pLKO.1 plasmids encoding shRNAs for depletion of JP4 were purchased from Open Biosystems (catalog no. RHS4533-EG84502; GE Dharmacon). The sequences of the shRNAs are described in Table S1. After testing out multiple shRNAs for depletion efficiency and effects on cell viability, cells expressing shRNA#4 were selected for further experiments.
shRNA-Mediated Depletion and RT-PCR.
To generate lentiviruses for transduction, HEK293T cells were transfected with plasmid(s) encoding shRNA and packaging vectors (pMD2.G and psPAX2, purchased from Addgene) using the calcium phosphate transfection method. Culture supernatants were harvested at 48 and 72 h posttransfection and used for infection of 2.5 × 10⁶ Jurkat T cells together with polybrene (8 µg/mL). Cells were selected with puromycin (1 µg/mL) 48 h postinfection. Knockdown efficiency was quantified by RT-PCR analysis or immunoblotting. For RT-PCR, purified RNA was oligo(dT)-primed for first-strand cDNA synthesis (Superscript III kit; Invitrogen). Quantitative SYBR green real-time PCR was performed using an iCycler IQ5 (Bio-Rad). The cDNA levels were normalized to that of GAPDH. Sequences of the primers used for PCR are described in Table S1. For expression analysis of known candidates of ER–PM junctions, cDNAs made from Jurkat T cells or murine primary CD4+ T cells, under resting conditions or after stimulation with 20 nM PMA and 1 µM ionomycin, were used as template using primers described in Table S1.
Single-Cell Ca2+ Imaging, Total Internal Reflection Fluorescence, and Confocal Microscopy.
Single-cell Ca2+ imaging of T Cells loaded with 1 μM Fura 2-AM was performed as previously described (39). For each experiment, 30–50 individual T cells were analyzed using OriginPro (Originlab) software. TIRFM imaging was performed on HEK293T or Jurkat T cells using previously described methods (37). Acquisition and image analysis were performed using Slidebook (Intelligent Imaging Innovations, Inc.) and OriginPro8.5 (Originlab) software. For depletion of stores, cells were treated with 1 µM thapsigargin or ionomycin in Ca2+-free Ringer’s solution (prepared by substitution of CaCl2 with 2 mM MgCl2 and 0.1 mM EGTA) for 5 min. TCR stimulation of Jurkat T cells for Ca2+ imaging was done using 5 µg/mL soluble α-CD3 antibodies (OKT3 clone, NCI preclinical repository) followed by cross-linking with 10 µg/mL goat α-mouse antibody (MP Biomedicals). TCR stimulation of murine T cells for Ca2+ imaging was performed using 5 µg/mL biotinylated α-CD3 antibodies (clone 145–2C11; eBioscience), followed by cross-linking with 10 µg/mL immunopure streptavidin (ThermoFisher). Confocal images were acquired using an inverted microscope (Axiovert 100 LSM; Carl Zeiss) fitted with a 63× water immersion objective lens (C-Apochromat 63/1.2 W Corr; Carl Zeiss). Pascal 5 image software (Carl Zeiss) was used for data acquisition and analysis.
TCR Stimulation and Immunoblotting.
Jurkat cells (10 × 106) were serum-starved for 5 h and incubated with 10 µg/mL soluble α-CD3 antibodies and cross-linked with 20 µg/mL goat α-mouse antibody for indicated times. Cells were lysed in 2× SDS loading dye. Lysates were separated on 10% (wt/vol) SDS/PAGE and immunoblotted for detection of indicated proteins.
Purification of Recombinant Proteins from Baculovirus and Escherichia coli.
Full-length FLAG-tagged JP4 cDNA was integrated into baculoviruses, expressed in Sf9 cells, and purified following the manufacturer’s instructions (Bac-to-Bac Baculovirus Expression Systems; Invitrogen) and used for GST pulldown experiments. STIM1, JP4, and junctate fragments were subcloned into pGEX4T-1 plasmids. Transformants expressing the GST fusion protein were grown in liquid cultures and induced with isopropyl-1-thio-β-d-galactopyranoside (IPTG) (0.2 mM) at 18 °C overnight. Subsequently, cells were harvested and resuspended in lysis buffer [50 mM NaH2PO4, 500 mM NaCl, 10% (vol/vol) glycerol, pH 8.0] containing protease inhibitors and 0.5% Triton X-100. The lysates were incubated with glutathione Sepharose 4B beads for 2 h. Recombinant proteins were eluted using glutathione.
Immunoprecipitation and GST Pulldown Analyses.
cDNA encoding GFP-JP4 was transfected into HEK293T cells stably expressing FLAG-tagged STIM1. Transfected cells (2 × 10⁷) were lysed in lysis buffer [20 mM Tris-Cl, 2 mM EDTA, 100 mM NaCl, 10% (vol/vol) glycerol, 0.5% Igepal CA-630, protease inhibitor mixture (Roche)] and centrifuged at 100,000 × g for 1 h before preclearing with protein G-Sepharose. Lysates were immunoprecipitated with anti-FLAG antibody overnight and with protein A/G-Sepharose for an hour. Immunoprecipitates were washed five times in lysis buffer and analyzed by immunoblotting. For reverse immunoprecipitation, HEK293 cells transiently transfected with cDNAs encoding FLAG-JP4 and STIM1 were used, and immunoprecipitation experiments were performed as above. For pulldown analyses, GST-fused full-length STIM1 or its fragments (10 µg) and precleared lysates from HEK293 cells transfected with plasmids encoding full-length FLAG-tagged JP4 or its fragments were incubated overnight in binding buffer [0.05% Igepal CA-630, 10 mM Tris⋅HCl, pH 8.0, 50 mM NaCl, 2 mM EDTA, 5% (vol/vol) glycerol, protease inhibitor mixture (Roche)] after preclearing with GST protein-coated resin for 6 h. After extensive washing with the binding buffer, bound proteins were analyzed by immunoblotting. For interaction between junctate and JP4, GST-fused fragments of junctate and precleared lysates from Sf9 cells infected with baculovirus encoding full-length FLAG-tagged JP4 were used as described in Purification of Recombinant Proteins from Baculovirus and Escherichia coli.
T-Cell Isolation and Differentiation.
CD4+ T cells were purified from single-cell strained suspensions prepared by mechanical disruption of spleens and lymph nodes of adult mice after magnetic sorting with CD4+ beads (Invitrogen). CD4+CD25− naive T cells were selected by CD25 MACS positive selection (Miltenyi Biotec). For effector T-cell differentiation, cells were stimulated with 1 μg/mL anti-CD3 (Bio X Cell) and anti-CD28 (Bio X Cell) Abs for 48 h on a plate coated with 0.1 mg/mL goat anti-hamster (MP Biomedicals). CD4+CD25− T cells were cultured under TH17-polarizing conditions with 10 μg/mL anti–IL-4, 20 μg/mL anti–IFN-γ, 30 ng/mL IL-6 (Peprotech), and 3 ng/mL TGF-β (Peprotech) for 48 h. On day 4, differentiated T cells were restimulated with 20 nM phorbol myristate acetate (PMA) and 1 µM ionomycin for cytokine analysis. Brefeldin A (1 µg/mL) was added for the last 2 h. Cells were harvested, washed in PBS, permeabilized with saponin buffer (0.5% saponin, 1% BSA in 1× PBS), and stained intracellularly for indicated cytokines. For surface staining, 1 million Jurkat T cells were surface stained with indicated antibodies at 4 °C for 30 min, and data were acquired using FACSCalibur (Becton Dickinson) and analyzed using FlowJo software.
Electron Microscopy.
After transient transfection with HRP-ER plasmid (a kind gift from Richard Lewis, Stanford University, Stanford, CA), Jurkat T cells were fixed with 2% (wt/vol) glutaraldehyde (Electron Microscopy Sciences) in 0.1 M Na cacodylate buffer (Electron Microscopy Sciences). Fixed cells were amplified with a TSA-biotin system (PerkinElmer) and ABC kit (Vector Laboratories) for 30 min each before being prereacted with 1 mg/mL DAB (Sigma-Aldrich) in Tris-buffered saline for 10 min and then reacted with DAB with 0.01% H2O2 for 30 min. After postfixation with 1% OsO4 and en bloc stain with 1% uranyl acetate, cells were further processed as previously described (40) before embedding in Embed 812 (Electron Microscopy Sciences). Cells located by light microscopy were punched out, and 50- to 90-nm sections were cut and mounted on formvar-coated grids and viewed with an 80-kV transmission electron microscope (T12 Quick CryoEM) equipped with a slow-scan cooled CCD camera (Gatan 2kX2k). The number or length of HRP-containing tubules located within 50 nm of the plasma membrane were measured with selected EM images where the nucleus and entire cell circumference were visible (taken at 8,000–25,000× magnification), to restrict our analysis to sections cut through the middle rather than the edges of cells. Total junctional tubule length/section means percentage of summation of each length of HRP tubules located within 50 nm of the plasma membrane per length of cell circumference. Means are expressed ± SEM unless otherwise stated; statistical significance was measured by Student’s t test.
Image Analysis.
All acquired images were analyzed using Slidebook (Intelligent Imaging Innovations, Inc.) or ImageJ (NIH) software. For calculation of Pearson’s correlation coefficient, regions of interest (ROIs) within the images were determined using a manually selected pixel intensity threshold and the Coloc 2 module of ImageJ software. For comparison of junctional areas between control and JP4-depleted cells expressing Sec61β, threshold analysis using ImageJ software was carried out. A ratio of area with Sec61β localization/total area was calculated for each cell, and data were normalized to those of control cells expressing scrambled shRNA. To measure number or size of STIM1 clusters, we selected clusters that had a pixel value under the condition of lower threshold level 30 in ImageJ. Normalized STIM1 cluster area is the summation of areas of all of the STIM1 clusters.
Statistical Analysis.
Statistical comparisons were performed using a two-tailed Student’s t test. A P value of <0.05 was considered statistically significant.
Acknowledgments
We thank Markus Jew and Dr. Shubhamoy Ghosh for technical help, Drs. James Weiss and Guillaume Calmettes (UCLA) for sharing a confocal microscope, Drs. Minnie Wu and Richard Lewis (Stanford University) for kindly providing the HRP-ER plasmid and EM protocol, and Marianne Cilluffo for help with EM. This work was supported by National Institutes of Health Grant AI-083432 (to Y.G.), American Heart Association Grant 12SDG12040188 (to S.S.), and the Japan Society for the Promotion of Sciences Core-to-Core Grant (to H.T.).
Footnotes
The authors declare no conflict of interest.
This article is a PNAS Direct Submission.
This article contains supporting information online at www.pnas.org/lookup/suppl/doi:10.1073/pnas.1524229113/-/DCSupplemental.
References
- 1.Prinz WA. Bridging the gap: Membrane contact sites in signaling, metabolism, and organelle dynamics. J Cell Biol. 2014;205(6):759–769. doi: 10.1083/jcb.201401126. [DOI] [PMC free article] [PubMed] [Google Scholar]
- 2.Takeshima H, Hoshijima M, Song LS. Ca²⁺ microdomains organized by junctophilins. Cell Calcium. 2015;58(4):349–356. doi: 10.1016/j.ceca.2015.01.007. [DOI] [PMC free article] [PubMed] [Google Scholar]
- 3.Carrasco S, Meyer T. 2011. STIM proteins and the endoplasmic reticulum-plasma membrane junctions. Annu Rev Biochem 80(33):33.31–33.28.
- 4.Henne WM, Liou J, Emr SD. Molecular mechanisms of inter-organelle ER-PM contact sites. Curr Opin Cell Biol. 2015;35:123–130. doi: 10.1016/j.ceb.2015.05.001. [DOI] [PubMed] [Google Scholar]
- 5.Srikanth S, Gwack Y. Orai1, STIM1, and their associating partners. J Physiol. 2012;590(Pt 17):4169–4177. doi: 10.1113/jphysiol.2012.231522. [DOI] [PMC free article] [PubMed] [Google Scholar]
- 6.Srikanth S, Gwack Y. Orai1-NFAT signalling pathway triggered by T cell receptor stimulation. Mol Cells. 2013;35(3):182–194. doi: 10.1007/s10059-013-0073-2. [DOI] [PMC free article] [PubMed] [Google Scholar]
- 7.Liou J, et al. STIM is a Ca2+ sensor essential for Ca2+-store-depletion-triggered Ca2+ influx. Curr Biol. 2005;15(13):1235–1241. doi: 10.1016/j.cub.2005.05.055. [DOI] [PMC free article] [PubMed] [Google Scholar]
- 8.Roos J, et al. STIM1, an essential and conserved component of store-operated Ca2+ channel function. J Cell Biol. 2005;169(3):435–445. doi: 10.1083/jcb.200502019. [DOI] [PMC free article] [PubMed] [Google Scholar]
- 9.Feske S, et al. A mutation in Orai1 causes immune deficiency by abrogating CRAC channel function. Nature. 2006;441(7090):179–185. doi: 10.1038/nature04702. [DOI] [PubMed] [Google Scholar]
- 10.Vig M, et al. CRACM1 is a plasma membrane protein essential for store-operated Ca2+ entry. Science. 2006;312(5777):1220–1223. doi: 10.1126/science.1127883. [DOI] [PMC free article] [PubMed] [Google Scholar]
- 11.Zhang SL, et al. Genome-wide RNAi screen of Ca(2+) influx identifies genes that regulate Ca(2+) release-activated Ca(2+) channel activity. Proc Natl Acad Sci USA. 2006;103(24):9357–9362. doi: 10.1073/pnas.0603161103. [DOI] [PMC free article] [PubMed] [Google Scholar]
- 12.Fahrner M, Derler I, Jardin I, Romanin C. The STIM1/Orai signaling machinery. Channels (Austin) 2013;7(5):330–343. doi: 10.4161/chan.26742. [DOI] [PMC free article] [PubMed] [Google Scholar]
- 13.Lewis RS. Store-operated calcium channels: New perspectives on mechanism and function. Cold Spring Harb Perspect Biol. 2011;3(12):a003970. doi: 10.1101/cshperspect.a003970. [DOI] [PMC free article] [PubMed] [Google Scholar]
- 14.Cao X, et al. The ER/PM microdomain, PI(4,5)P₂ and the regulation of STIM1-Orai1 channel function. Cell Calcium. 2015;58(4):342–348. doi: 10.1016/j.ceca.2015.03.003. [DOI] [PMC free article] [PubMed] [Google Scholar]
- 15.Srikanth S, et al. Junctate is a Ca2+-sensing structural component of Orai1 and stromal interaction molecule 1 (STIM1) Proc Natl Acad Sci USA. 2012;109(22):8682–8687. doi: 10.1073/pnas.1200667109. [DOI] [PMC free article] [PubMed] [Google Scholar]
- 16.Sharma S, et al. An siRNA screen for NFAT activation identifies septins as coordinators of store-operated Ca2+ entry. Nature. 2013;499(7457):238–242. doi: 10.1038/nature12229. [DOI] [PMC free article] [PubMed] [Google Scholar]
- 17.Chang CL, et al. Feedback regulation of receptor-induced Ca2+ signaling mediated by E-Syt1 and Nir2 at endoplasmic reticulum-plasma membrane junctions. Cell Reports. 2013;5(3):813–825. doi: 10.1016/j.celrep.2013.09.038. [DOI] [PubMed] [Google Scholar]
- 18.Park CY, et al. STIM1 clusters and activates CRAC channels via direct binding of a cytosolic domain to Orai1. Cell. 2009;136(5):876–890. doi: 10.1016/j.cell.2009.02.014. [DOI] [PMC free article] [PubMed] [Google Scholar]
- 19.Liou J, Fivaz M, Inoue T, Meyer T. Live-cell imaging reveals sequential oligomerization and local plasma membrane targeting of stromal interaction molecule 1 after Ca2+ store depletion. Proc Natl Acad Sci USA. 2007;104(22):9301–9306. doi: 10.1073/pnas.0702866104. [DOI] [PMC free article] [PubMed] [Google Scholar]
- 20.Takeshima H, Komazaki S, Nishi M, Iino M, Kangawa K. Junctophilins: A novel family of junctional membrane complex proteins. Mol Cell. 2000;6(1):11–22. doi: 10.1016/s1097-2765(00)00003-4. [DOI] [PubMed] [Google Scholar]
- 21.Nishi M, Sakagami H, Komazaki S, Kondo H, Takeshima H. Coexpression of junctophilin type 3 and type 4 in brain. Brain Res Mol Brain Res. 2003;118(1-2):102–110. doi: 10.1016/s0169-328x(03)00341-3. [DOI] [PubMed] [Google Scholar]
- 22.Garbino A, et al. Molecular evolution of the junctophilin gene family. Physiol Genomics. 2009;37(3):175–186. doi: 10.1152/physiolgenomics.00017.2009. [DOI] [PMC free article] [PubMed] [Google Scholar]
- 23.Moriguchi S, et al. Functional uncoupling between Ca2+ release and afterhyperpolarization in mutant hippocampal neurons lacking junctophilins. Proc Natl Acad Sci USA. 2006;103(28):10811–10816. doi: 10.1073/pnas.0509863103. [DOI] [PMC free article] [PubMed] [Google Scholar]
- 24.Ebinu JO, et al. RasGRP links T-cell receptor signaling to Ras. Blood. 2000;95(10):3199–3203. [PubMed] [Google Scholar]
- 25.Hartmann J, et al. STIM1 controls neuronal Ca²⁺ signaling, mGluR1-dependent synaptic transmission, and cerebellar motor behavior. Neuron. 2014;82(3):635–644. doi: 10.1016/j.neuron.2014.03.027. [DOI] [PubMed] [Google Scholar]
- 26.Barr VA, et al. Dynamic movement of the calcium sensor STIM1 and the calcium channel Orai1 in activated T-cells: Puncta and distal caps. Mol Biol Cell. 2008;19(7):2802–2817. doi: 10.1091/mbc.E08-02-0146. [DOI] [PMC free article] [PubMed] [Google Scholar]
- 27.Lioudyno MI, et al. Orai1 and STIM1 move to the immunological synapse and are up-regulated during T cell activation. Proc Natl Acad Sci USA. 2008;105(6):2011–2016. doi: 10.1073/pnas.0706122105. [DOI] [PMC free article] [PubMed] [Google Scholar]
- 28.Berridge MJ, Bootman MD, Roderick HL. Calcium signalling: Dynamics, homeostasis and remodelling. Nat Rev Mol Cell Biol. 2003;4(7):517–529. doi: 10.1038/nrm1155. [DOI] [PubMed] [Google Scholar]
- 29.Weisleder N, Takeshima H, Ma J. Immuno-proteomic approach to excitation--contraction coupling in skeletal and cardiac muscle: Molecular insights revealed by the mitsugumins. Cell Calcium. 2008;43(1):1–8. doi: 10.1016/j.ceca.2007.10.006. [DOI] [PMC free article] [PubMed] [Google Scholar]
- 30.Bennett HJ, et al. Human junctophilin-2 undergoes a structural rearrangement upon binding PtdIns(3,4,5)P3 and the S101R mutation identified in hypertrophic cardiomyopathy obviates this response. Biochem J. 2013;456(2):205–217. doi: 10.1042/BJ20130591. [DOI] [PMC free article] [PubMed] [Google Scholar]
- 31.Mekahli D, Bultynck G, Parys JB, De Smedt H, Missiaen L. Endoplasmic-reticulum calcium depletion and disease. Cold Spring Harb Perspect Biol. 2011;3(6):a004317. doi: 10.1101/cshperspect.a004317. [DOI] [PMC free article] [PubMed] [Google Scholar]
- 32.Brandman O, Liou J, Park WS, Meyer T. STIM2 is a feedback regulator that stabilizes basal cytosolic and endoplasmic reticulum Ca2+ levels. Cell. 2007;131(7):1327–1339. doi: 10.1016/j.cell.2007.11.039. [DOI] [PMC free article] [PubMed] [Google Scholar]
- 33.Hetz C. The unfolded protein response: Controlling cell fate decisions under ER stress and beyond. Nat Rev Mol Cell Biol. 2012;13(2):89–102. doi: 10.1038/nrm3270. [DOI] [PubMed] [Google Scholar]
- 34.Soboloff J, Rothberg BS, Madesh M, Gill DL. STIM proteins: Dynamic calcium signal transducers. Nat Rev Mol Cell Biol. 2012;13(9):549–565. doi: 10.1038/nrm3414. [DOI] [PMC free article] [PubMed] [Google Scholar]
- 35.Holmes SE, et al. A repeat expansion in the gene encoding junctophilin-3 is associated with Huntington disease-like 2. Nat Genet. 2001;29(4):377–378. doi: 10.1038/ng760. [DOI] [PubMed] [Google Scholar]
- 36.Landstrom AP, et al. Mutations in JPH2-encoded junctophilin-2 associated with hypertrophic cardiomyopathy in humans. J Mol Cell Cardiol. 2007;42(6):1026–1035. doi: 10.1016/j.yjmcc.2007.04.006. [DOI] [PMC free article] [PubMed] [Google Scholar]
- 37.Srikanth S, et al. A novel EF-hand protein, CRACR2A, is a cytosolic Ca2+ sensor that stabilizes CRAC channels in T cells. Nat Cell Biol. 2010;12(5):436–446. doi: 10.1038/ncb2045. [DOI] [PMC free article] [PubMed] [Google Scholar]
- 38.Srikanth S, Gwack Y. Measurement of intracellular Ca2+ concentration in single cells using ratiometric calcium dyes. Methods Mol Biol. 2013;963:3–14. doi: 10.1007/978-1-62703-230-8_1. [DOI] [PubMed] [Google Scholar]
- 39.Srikanth S, Jung HJ, Ribalet B, Gwack Y. The intracellular loop of Orai1 plays a central role in fast inactivation of Ca2+ release-activated Ca2+ channels. J Biol Chem. 2010;285(7):5066–5075. doi: 10.1074/jbc.M109.072736. [DOI] [PMC free article] [PubMed] [Google Scholar]
- 40.Wu MM, Buchanan J, Luik RM, Lewis RS. Ca2+ store depletion causes STIM1 to accumulate in ER regions closely associated with the plasma membrane. J Cell Biol. 2006;174(6):803–813. doi: 10.1083/jcb.200604014. [DOI] [PMC free article] [PubMed] [Google Scholar]


