Significance
Steroid hormones coordinate the activity of many brain regions by binding to nuclear receptors that act as transcription factors. This study uses genome-wide correlation of gene expression in the mouse brain to discover (i) brain regions that respond in a similar manner to particular steroids, (ii) signaling pathways that are used in a steroid receptor and brain region-specific manner, and (iii) potential target genes and relationships between groups of target genes. The data constitute a rich repository for the research community to support further new insights in neuroendocrine relationships and to develop novel ways to manipulate brain activity in research or clinical settings.
Keywords: neuroendocrinology, nuclear receptors, transcription regulation, estrogens, glucocorticoids
Abstract
Steroid receptors are pleiotropic transcription factors that coordinate adaptation to different physiological states. An important target organ is the brain, but even though their effects are well studied in specific regions, brain-wide steroid receptor targets and mediators remain largely unknown due to the complexity of the brain. Here, we tested the idea that novel aspects of steroid action can be identified through spatial correlation of steroid receptors with genome-wide mRNA expression across different regions in the mouse brain. First, we observed significant coexpression of six nuclear receptors (NRs) [androgen receptor (Ar), estrogen receptor alpha (Esr1), estrogen receptor beta (Esr2), glucocorticoid receptor (Gr), mineralocorticoid receptor (Mr), and progesterone receptor (Pgr)] with sets of steroid target genes that were identified in single brain regions. These coexpression relationships were also present in distinct other brain regions, suggestive of as yet unidentified coordinate regulation of brain regions by, for example, glucocorticoids and estrogens. Second, coexpression of a set of 62 known NR coregulators and the six steroid receptors in 12 nonoverlapping mouse brain regions revealed selective downstream pathways, such as Pak6 as a mediator for the effects of Ar and Gr on dopaminergic transmission. Third, Magel2 and Irs4 were identified and validated as strongly responsive targets to the estrogen diethylstilbestrol in the mouse hypothalamus. The brain- and genome-wide correlations of mRNA expression levels of six steroid receptors that we provide constitute a rich resource for further predictions and understanding of brain modulation by steroid hormones.
Steroid receptors are part of the superfamily of nuclear receptors (NRs) that act as transcription factors regulating expression of numerous biologically important target genes (1). Their transcriptional activity is induced by steroid hormones, which respond to changed demands in terms of reproductive status, mineral balance, or stressful physical and psychological challenges. A crucial site of action is the brain, where these hormones have strong modulatory effects on physiological regulation, cognitive function, mood, and behavior. They do so by changing cellular responsiveness to a variety of neurotransmitters and peptides, and by inducing morphological changes (2, 3).
Understanding the effects of steroid hormones on the brain faces the challenge to identify in as many as 900 different brain nuclei (4) both the highly cell-specific target genes that mediate the hormone effects (5, 6) and the signaling factors that mediate or influence steroid receptor signaling. The latter include proteins affecting prereceptor metabolism, interacting transcription factors (7), and downstream NR coregulator proteins (1). Even if the effects of steroid hormones are well-studied in specific regions (1, 8), overall, the brain steroid receptor targets and mediators remain largely unknown.
In situ hybridization (ISH) has been used to identify the functional roles of the 49 NR genes in adult mouse brain based on the clustering of the NR expression patterns in anatomical and regulatory networks (9). In this study, we substantially extended this approach to identify targets and signaling partners of the steroid receptors, and relationships between different regions of the mouse brain, based on genome-wide coexpression with steroid receptors. The Allen Brain Atlas (ABA) (4) is the most comprehensive repository of ISH-based gene expression in the adult mouse brain. We used the ABA to identify genes that have 3D spatial gene expression profiles similar to steroid receptors.
To validate the functional relevance of this approach, we analyzed the coexpression relationship of the glucocorticoid receptor (Gr) and estrogen receptor alpha (Esr1) and their known transcriptional targets in specific brain regions. We then exploited these associations to derive hypotheses about the functional role of receptors in brain regions with no previously known effects of steroids. Furthermore, we studied the region-specific coexpression of NRs and their downstream mediators (coregulators) to identify specific partners mediating the hormonal effects on dopaminergic transmission. Finally, to illustrate the potential of using spatial coexpression to predict region-specific steroid receptor targets in the brain, we identified and validated genes that responded to changes in estrogen in the mouse hypothalamus (HY).
Results
Spatial Expression Reveals Known Sites of Action of Steroid Receptors in the Mouse Brain.
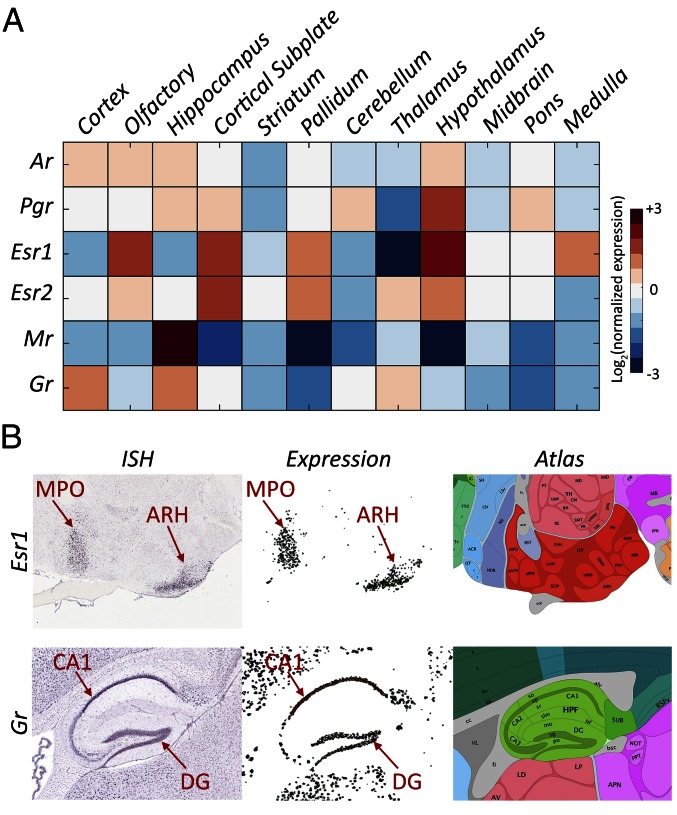
We first analyzed the mRNA expression of six nuclear steroid receptors [Esr1 and estrogen receptor beta (Esr2), androgen receptor (Ar), progesterone receptor (Pgr), Gr, and mineralocorticoid receptor (Mr)] across the brain using the 3D spatial gene expression data from the ABA (4). We generated a general overview of the expression of each receptor across 12 nonoverlapping brain structures covering the entire brain: isocortex; olfactory areas (OLF), hippocampal formation, cortical subplate, striatum (STR), pallidum (PAL), cerebellum, thalamus (TH), HY, midbrain (MB), pons, and medulla (Fig. 1A). The expression profiles generally correspond to the known distribution and sites of action of different receptors (9), and provide comprehensive information at the higher aggregation level of brain regions described here. For example, Esr1 is highly expressed in the HY, OLF, and cortical subpalate. Within the HY, Esr1 shows high expression in the arcuate hypothalamic nucleus (ARH), and medial preoptic nucleus (MPO) (Fig. 1B). Gr is highly expressed in the cornu ammonis subdivision 1 (CA1) and dentate gyrus (DG) areas of the hippocampus, cortex, and TH, whereas Mr is predominantly expressed in the hippocampus (Fig. 1A). These expression patterns are well in line with the known sites of action of the different receptors across the brain (10, 11).
Fig. 1.
Expression of steroid receptors in the mouse brain. (A) Expression of six steroid receptors across the 12 brain regions. Reported values are the average expression energy per region normalized to the average expression across the whole brain and then log2-transformed. (B) Example sagittal sections from the Allen Brain Atlas (4) showing the ISH (Left), expression mask (Middle), and corresponding atlas section (Right) of Esr1 in the HY (Top) and Gr in the hippocampus (Bottom). Red arrows indicate the MPO, ARH, CA1, and DG.
Genes Spatially Coexpressed with Steroid Receptors Indicate Regional Functional Specificity.
To go beyond the expression profiles of steroid receptors as reported in the literature, we identified genes with similar expression profiles to each of the receptors. Based on the principle of “guilt by association,” these coexpressed genes are likely to be enriched in receptor target genes and receptor signaling partners such as coregulators. For each steroid receptor, we ranked genes based on their spatial coexpression across the whole brain as well as in each of the aforementioned 12 brain structures separately, resulting in 13 ranked lists per receptor (Dataset S1). (Datasets S1–S6 are available at data.3tu.nl/repository/uuid:ecc3b182-d312-4216-9053-a824d0e04d5e.) For each steroid receptor, strongly coexpressed genes within a brain region are likely related to the localized functional role of the receptor. For example, of the top 10 genes coexpressed with Esr1 across the whole brain, four were previously shown to be regulated by ESR1 and/or estrogens in various tissues (Gpr101, Calcr, Ngb, and Gpx3) (12–15). These genes were also coexpressed with Esr1 in the HY, in line with their functional relationship to Esr1 in mediating, for example, reproductive and metabolic processes. However, whole-brain correlation of these genes with Esr1 was also driven by the TH, MB, and PAL, demonstrating less obvious relationships between Esr1 and these target genes. Strikingly, among the top 10 genes coexpressed with Gr across the whole brain, none are strongly coexpressed with Gr in the HY, indicating that Gr signaling in the HY is rather distinct from Gr signaling in the cortex, STR, TH, and MB.
In addition, we analyzed the functional enrichment of genes coexpressed with Gr and Esr1 in the 12 brain regions (Table S1). Esr1-coexpressed genes were enriched for neuropeptide regulation in the HY as well as the cerebellum. A number of Gr-associated genes in the HY were related to glia and oligodendrocyte development, supporting the known effects of Gr on these processes in the HY (16).
Glucocorticoid-Responsive Genes Are Highly Expressed with Gr in HP, Pons, MB, and Whole Brain.
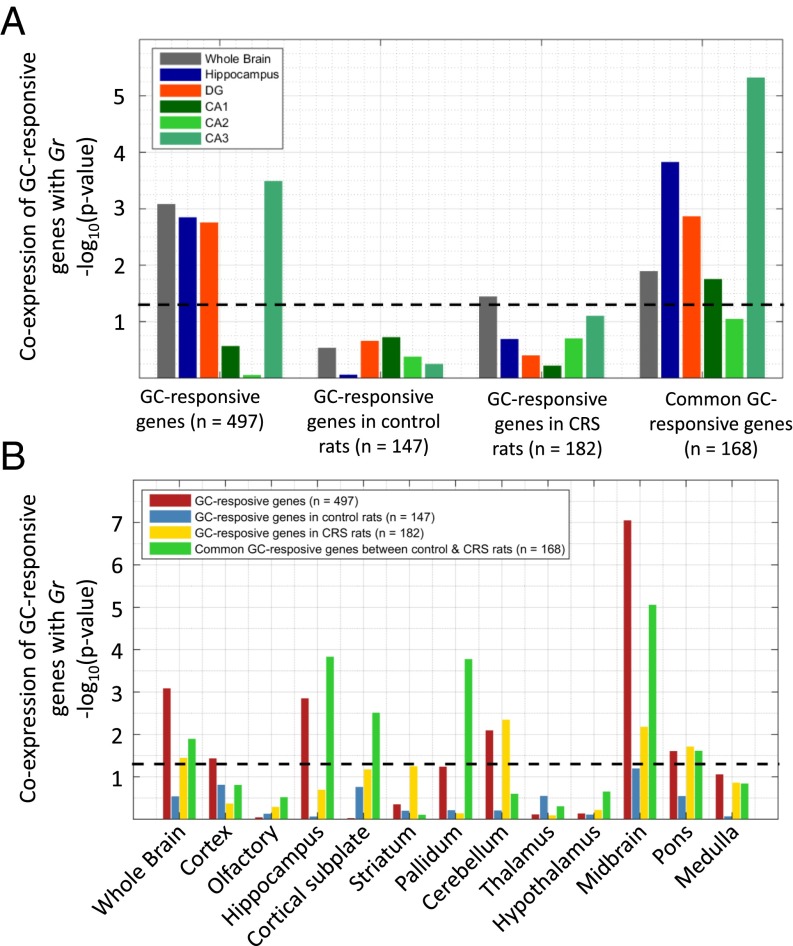
To test the validity of our hypothesis that coexpressed genes constitute candidate targets of steroid receptors, we assessed the extent of coexpression between Gr and known GR target genes. Because Gr has an important role in mediating transcription of genes involved in coping with stress within the hippocampus (2), we analyzed the coexpression of glucocorticoid (GC)-responsive genes (i.e., likely GR targets) with Gr in the whole brain and hippocampus, and in its substructures, such as the DG and the different subregions of the CA (Fig. 2A and Dataset S2). The set of GC-responsive genes we considered originates from experiments where male rats were exposed to GC treatment in a chronic restraint stress (CRS) condition as well as in a control situation (17). These experiments resulted in three sets of genes differentially expressed in DG neurons: (i) GC-responsive genes in CRS rats, (ii) GC-responsive genes in control rats, and (iii) genes that show differential expression in GC treatment for both conditions (common GC-responsive genes).
Fig. 2.
Coexpression of GC-responsive genes and Gr in the hippocampus. (A) Coexpression of four GC-responsive gene sets with Gr in the whole brain, hippocampus, DG, CA1, CA2, and CA3. (B) Coexpression of four GC-responsive gene sets with Gr across the whole brain, as well as the 12 major brain structures. All bars indicate the −log10 of the Wilcoxon rank sum test, and the dashed line indicates the significance level at P = 0.05.
As expected, GC-responsive genes are significantly coexpressed with Gr in the DG (where they were identified) but, interestingly, also in the whole brain and in the CA3 region [false discovery rate (FDR)-corrected P < 1.8 × 10⁻³; Mann–Whitney U test]. The significant coexpression of GC-responsive genes in the CA3 area indicates that those cells in CA3 that do express Gr (10) may be functionally linked to DG granule cells in terms of their response to GCs. Of note, only those genes that responded to GC treatment in stressed and control rats (common GC-responsive genes) showed a significant coexpression with Gr in the DG, CA1, and (very substantially) CA3 regions of the hippocampus. The data reveal that only the subset of invariant, context-independent GR target genes is related to constitutive coexpression with Gr, even if the correlation data come from “control” conditions.
The coexpression of the GC-responsive gene sets with Gr was not significant for areas such as the HY and the cortex. We initially considered these negative control regions, given that the target genes were identified in microdissected DG granule neurons (17) and the presumed high degree of cell specificity. However, the coexpression of Gr with GC-responsive genes in CA3 prompted us to test whether this coexpression also occurs in other brain areas. Fig. 2B shows that the set of common GC-responsive genes is not only coexpressed with Gr in the hippocampus (DG, CA1, and CA3) but also in the cortical subplate, PAL, and MB. These associations indicate a potential, as yet unknown, relationship between these three brain areas in terms of endocrine regulation, in accordance with the notion that the cellular responses to GCs can be similar in distributed parts of brain networks (18). Taken together, these results show that GR targets are coexpressed with Gr in the DG, the region where responsiveness was measured, as well as pointing to other brain regions that might share the same regulation mechanism.
Sexually Dimorphic Genes Are Highly Coexpressed with Esr1 in the HY.
To illustrate the generalizability of our approach to other receptors and brain regions, we followed the same approach to analyze the coexpression of Esr1 and its putative targets. Xu et al. (19) showed that a set of 16 genes, including Esr1, has sexual dimorphic expression in the adult mouse HY. In addition, they showed that these 16 genes are sensitive to gonadal steroids (also in the male mouse brain) and that some are necessary for effects of estrogens on sexually dimorphic behavior (19), making this set of ESR1 targets in the HY quite valuable.
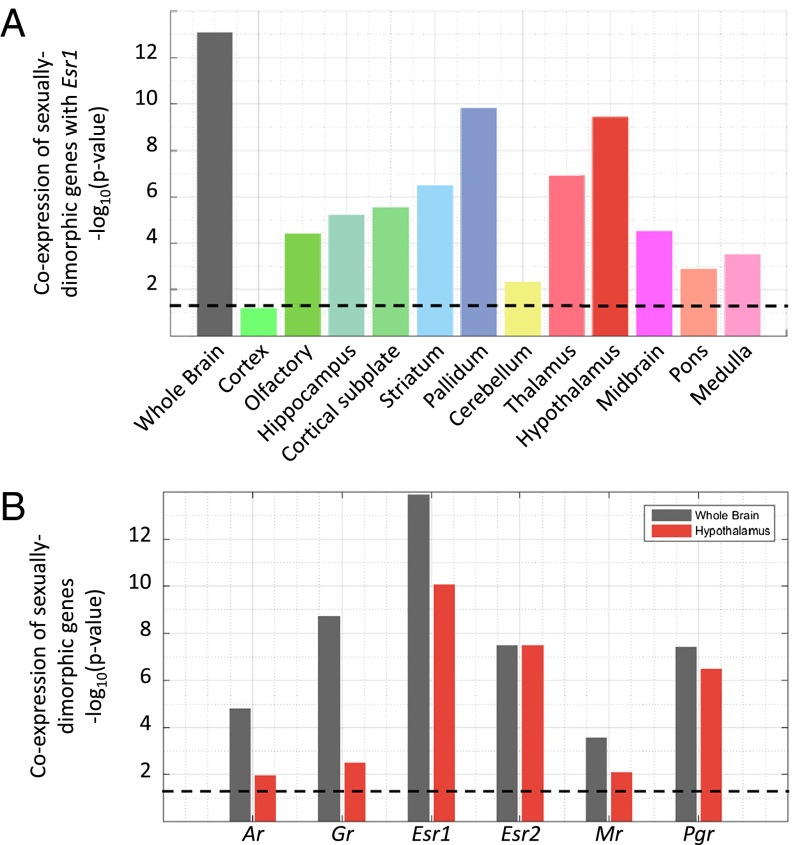
Table S2 shows the correlation values for each of the 15 sexually dimorphic genes with Esr1 in whole brain, as well as in the HY, based on data from the ABA. The set of 15 genes is significantly correlated to Esr1 based on whole-brain analysis (FDR-corrected P = 8.69 ×10⁻¹⁴, Mann–Whitney U test) as well as the hypothalamic expression pattern (P = 3.85 × 10⁻¹⁰). To test whether the correlation between the 15 genes and Esr1 is HY-specific, we repeated the analysis for all 12 brain structures. Fig. 3A shows that sexually dimorphic genes are mostly correlated to Esr1 in the HY, PAL, TH, and STR (P < 10−6). Similar to the results obtained for GR target genes, we observed high coexpression outside the main region of action (e.g., in the PAL), suggesting that these brain regions share aspects of their transcriptional response to estrogen receptor activation. Furthermore, sex steroid receptors (Esr1, Esr2, and Pgr) showed higher coexpression levels with the sexually dimorphic genes with respect to the stress steroid-related Mr and Gr in the HY (Fig. 3B). The strongest coexpression was with Esr1, indicating that the hypothalamic sexual dimorphism genes are mainly, but probably not exclusively, related to Esr1. Taken together, these results show that spatial coexpression can pinpoint context-specific actions of steroid receptors (in this case, Gr and Esr1) and yields region-specific coexpressed genes, a very rich resource with which to generate hypotheses about steroid receptor targets.
Fig. 3.
Coexpression of sexually dimorphic genes and Esr1 in the HY. (A) Coexpression of 15 sexually dimorphic genes with Esr1 across the mouse brain. (B) Coexpression of the 15 sexually dimorphic genes with the six steroid receptors across the whole brain, as well as the HY. All bars indicate the −log10 of the Wilcoxon rank sum test, and the dashed line indicates the significance level at P = 0.05.
Region-Specific Coregulator Analysis Points to Dopaminergic Transmission via Pak6.
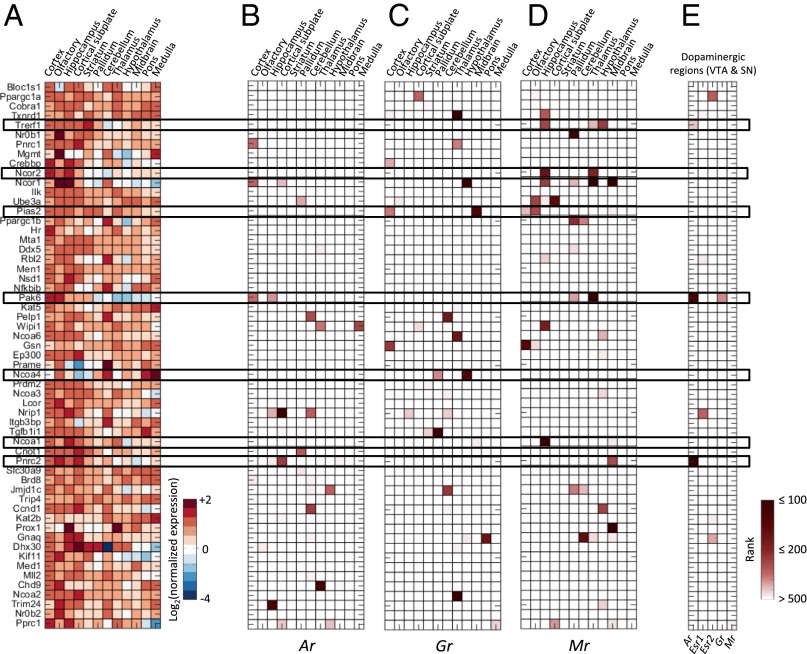
So far, we have analyzed the potential of genes coexpressed with receptors to include region-specific targets. However, because correlation only indicates association rather than causation, coexpressed genes can also include coregulators of steroid receptors. Previous studies have shown the signaling pathways of steroid receptors to differ across brain regions in a gene-specific manner (1, 20). To identify putative region-dependent coregulators of steroid receptors, we analyzed the coexpression relationships of each steroid receptor and a set of 62 NR coregulators as present on a peptide array (21) (complete data are provided in Dataset S3). Fig. 4A shows that the expression of coregulators varies greatly across the different brain regions. For example, although Ncoa1 is expressed in a fairly homogeneous manner, conforming to earlier results (20), Ncoa4 is substantially enriched in the caudal brain regions.
Fig. 4.
Coexpression of coregulators and steroid receptors. (A) Expression of 62 coregulators in 12 brain regions. Reported values are the average expression energy per region normalized to the average expression across the whole brain and then log2-transformed. Coexpression ranks of the 62 coregulators with Ar (B), Gr (C), and Mr (D). Dark red corresponds to high rank (i.e., strong coexpression). (E) Rank sum of the coexpression rank of each coregulator with Ar in the dopaminergic regions (VTA and SN).
The coexpressions of coregulators with the Ar, Gr, and Mr differ greatly across different brain regions, indicating selective coregulation (Fig. 4 B–D). For example, the AR/GR coactivators Pias2 (22) and Ncoa4 (23) are highly coexpressed with Gr in the MB and HY, respectively (Fig. 4C). However, both coactivators are not coexpressed with Ar within the same regions even though the relative abundance of Ar in the MB and the HY is higher than Gr (Fig. 1A). Mr is predominantly expressed in the hippocampus, where it is highly coexpressed with Ncoa1, Txnrd1, Trefl, Ncor1, Wipi1, and Ncor2 (Fig. 4D). Although Ncoa1 is a known MR coregulator (24), little is known about the effect of the other coregulators on MR function in the hippocampus, and they might be good candidates for further functional analysis.
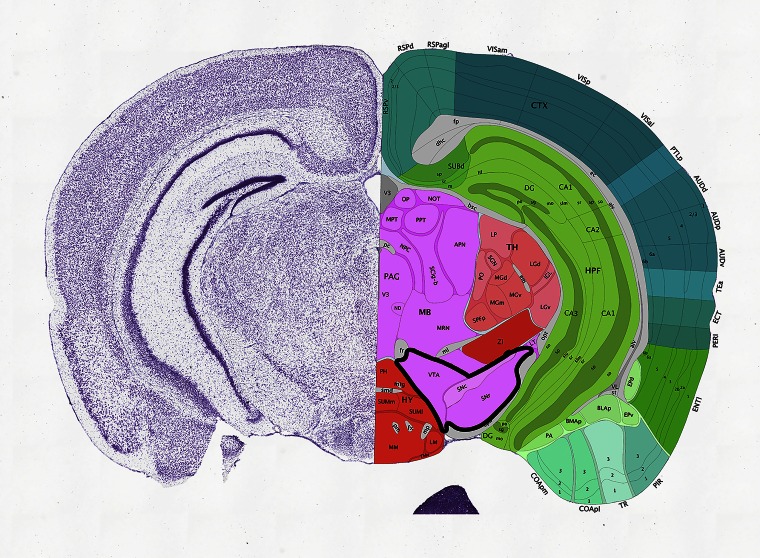
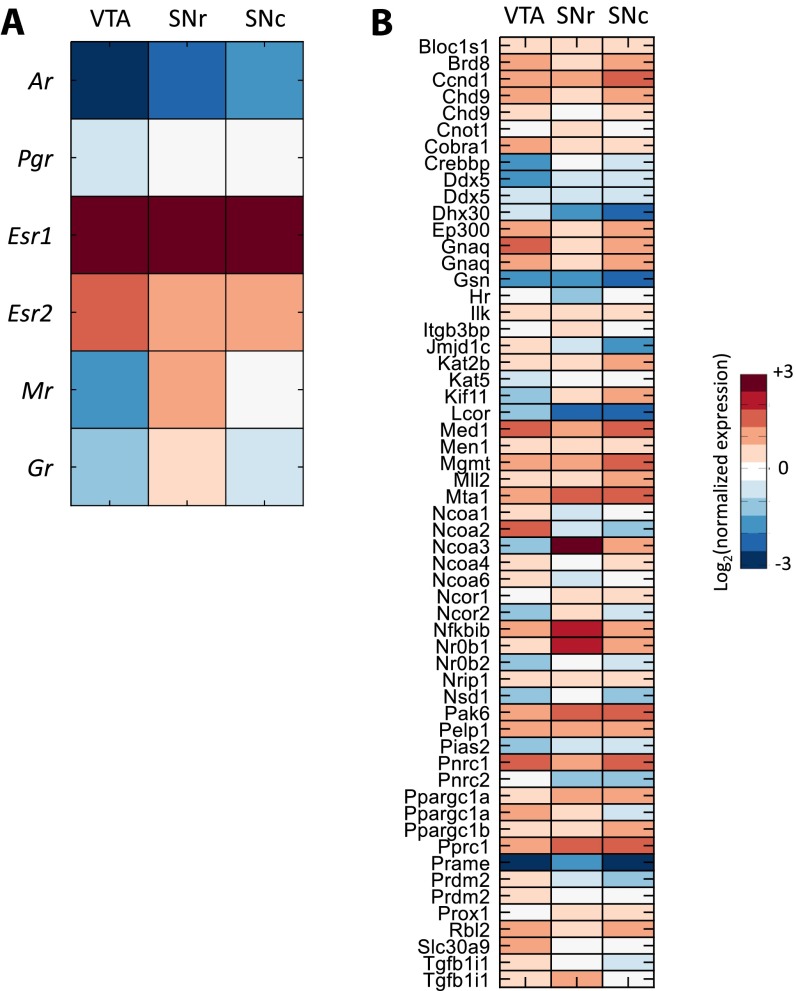
Because there still is substantial heterogeneity across the 12 brain regions that we initially analyzed, we narrowed down our analysis to well-established target regions of steroid hormone action. We analyzed the coexpression of the 62 coregulators with the steroid receptors in dopaminergic regions in the ventral tegmental area (VTA) and substantia nigra (SN), which are known targets of steroid actions (25, 26) (Figs. S1 and S2). We found three significantly coexpressed coregulators with Ar in VTA/SN: Pnrc2, Pak6, and Trerf1 (Fig. 4E and Dataset S4), suggesting that these coregulators may be involved in mediating AR effects on dopaminergic transmission. Furthermore, only Pak6 was strongly coexpressed with Gr in the dopaminergic regions (P < 0.01). Thus, AR and GR may share some, but not all, coregulators, much like the fact that AR binding sites may overlap, in part, with GR binding sites (27). These results indicate that we can use genome-wide spatial coexpression not only to analyze the relationship between the receptors and their targets but also to identify region-specific coregulators.
Fig. S1.
Dopaminergic system in the mouse brain. A coronal section from the Allen Brain Atlas (4) shows the VTA and SN (thick black contour) that composes the dopaminergic system, indicated.
Fig. S2.
Expression of steroid receptors and coregulators in the dopaminergic system. The expression of six steroid receptors (A) and 62 coregulators (B) in the VTA, SN reticular part (SNr), and SN compact part (SNc). Reported values are the average expression energy per region normalized to the average expression across the whole brain and then log2-transformed.
Predictive Value of Coexpression for Hormone Responsiveness: Magel2 Is Likely a Target of ESR1.
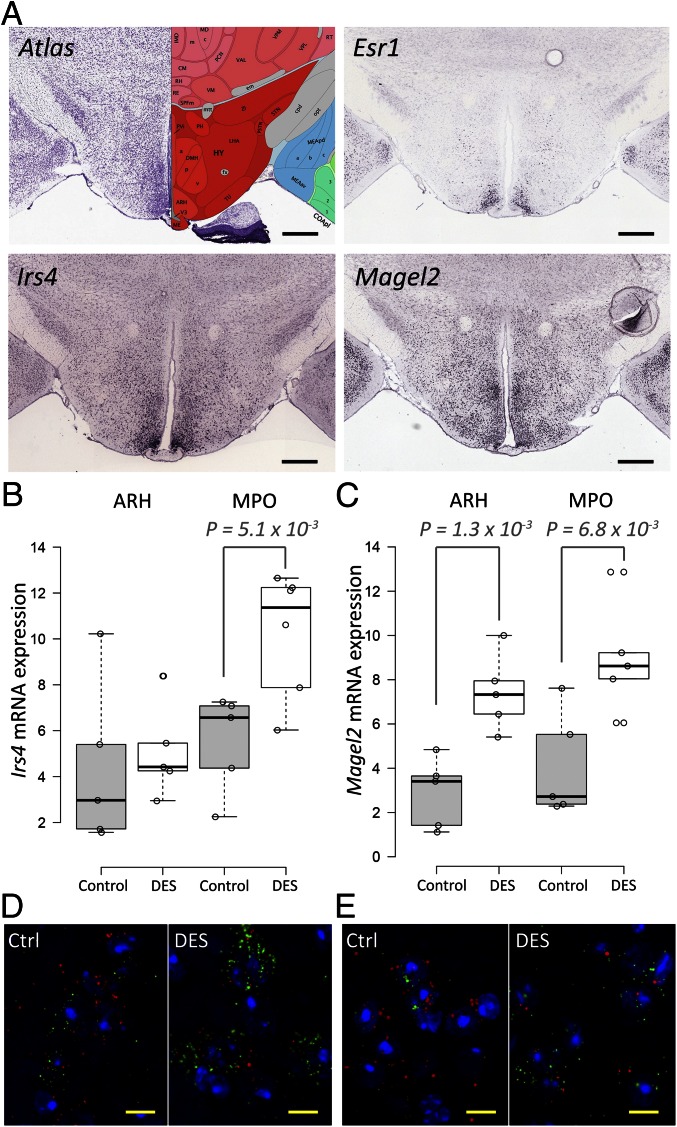
Finally, we set out to test the predictive value of high coexpression with a steroid receptor to identify transcriptional targets. We measured the response of genes that are highly coexpressed with Esr1 in the HY to estrogen diethylstilbestrol (DES) in castrated male mice using quantitative PCR (qPCR) (SI Materials and Methods). In the male brain, testosterone can be metabolized to estrogen or act directly via the AR. To avoid interpretation difficulties, we decided to activate brain estrogen receptors directly with the selective ligand DES. We selected the top 10 most strongly coexpressed genes with Esr1 in the HY. As a negative control, we used the set of genes that are not coexpressed with Esr1 in the HY. Fig. 5A shows examples, from the ISH experiments of the ABA, of Irs4 and Magel2, two of the strongly coexpressed genes selected for validation. Because Esr1 is not homogeneously expressed across the HY (Fig. 1B), we analyzed the responsiveness of the set of top 10 genes to DES in the anterior (MPO) and posterior (ARH) parts of the HY separately. Fold-change up-regulation was modest, which may be due to nonresponsiveness, a modest transcriptional response of brain targets, or dilution of the signal in the hypothalamic homogenates (Table S3).
Fig. 5.
Highly coexpressed genes are potential steroid targets. (A) Coronal ISH sections showing the expression of Esr1, Irs4, and Magel2. (Scale bars, 600 μm.) Data taken from the Allen Brain Atlas (4). Response of Irs4 (B) and Magel2 (C) to DES treatment in castrated mice in the MPO and ARH using dISH. (D) dISH of Esr1 (red) and Irs4 (green) in the anterior HY. (Scale bars, 10 μm. Magnification, 100×.) (E) dISH of Esr1 (red) and Magel2 (green) in the anterior HY. (Scale bars, 10 μm. Magnification, 100×.) mRNA expression in ISH was quantified as the percentage of the image surface with positive signal. Reported P values are calculated with a one-sided, two-sample t test with a significant level at P < 0.05.
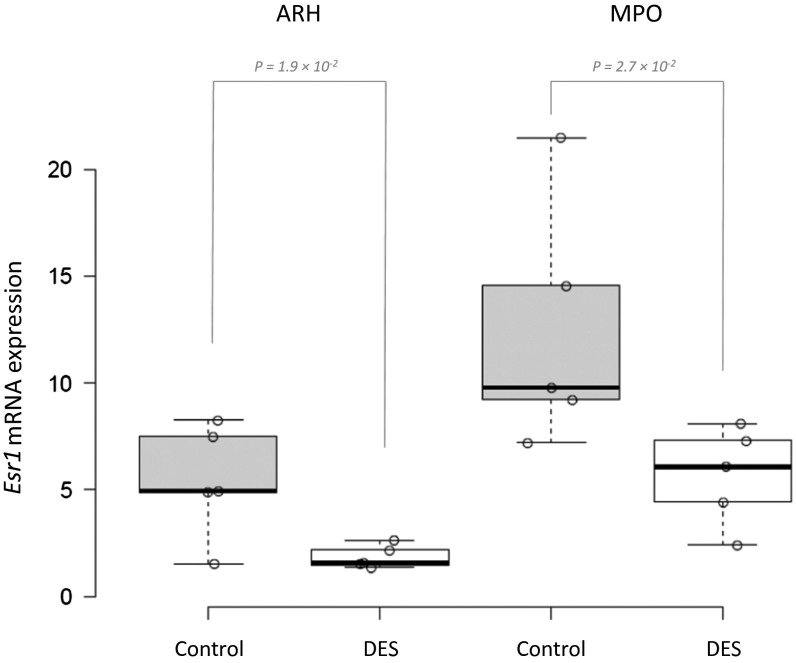
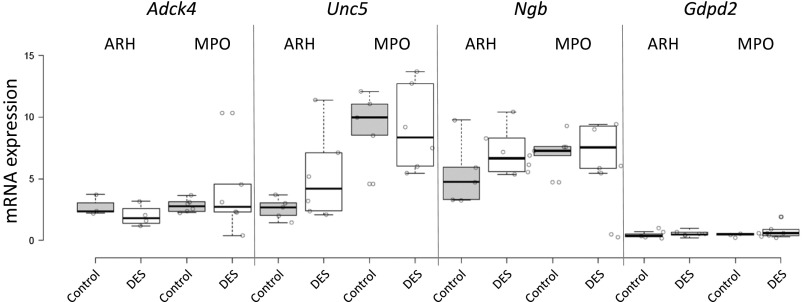
To confirm colocalization further, we performed quantitative double ISH (dISH) for Esr1 and the six mRNAs (Irs4, Magel2, Adck4, Unc5, Ngb, and Gdpd2) that showed more than 1.3-fold enrichment in qPCR. Esr1 mRNA was consistently down-regulated more than twofold upon DES treatment, validating the treatment (Fig. S3). Irs4 and Magel2 mRNA were both significantly up-regulated by DES treatment in MPO (1.9-fold and 2.4-fold, respectively), whereas only Magel2 was up-regulated in ARH (2.6-fold) (Fig. 5 B and D). A 1.3-fold induction of Ngb mRNA in ARH did not reach statistical significance, whereas Gdpd2, Unc5d, and Adck4 mRNA levels showed no trend of regulation after DES treatment (Fig. S4).
Fig. S3.
Down-regulation of mRNA levels of Esr1 in response to DES treatment. The mRNA levels of Esr1, measured using dISH, were significantly down-regulated (P < 0.05) in the anterior (MPO) and posterior (ARH) HY of the control and DES-treated mice.
Fig. S4.
Response of Esr1-coexpressed genes to DES treatment. The mRNA levels of Adck4, Unc5, Ngb, and Gdpd2 were measured using dISH in the anterior (MPO) and posterior (ARH) HY of the control and DES-treated mice.
The data indicate that additional criteria are necessary for reliable target prediction. Because Irs4 and Magel2 are among the top genes expressed in the HY (ranked 1 and 11, respectively) compared with a ranking of 141 for Adck4 and 284 for Unc5d, these criteria may include a combination of expression, coexpression filters, and other criteria.
Identifying GR-Related Corticosterone Targets in the Hippocampus.
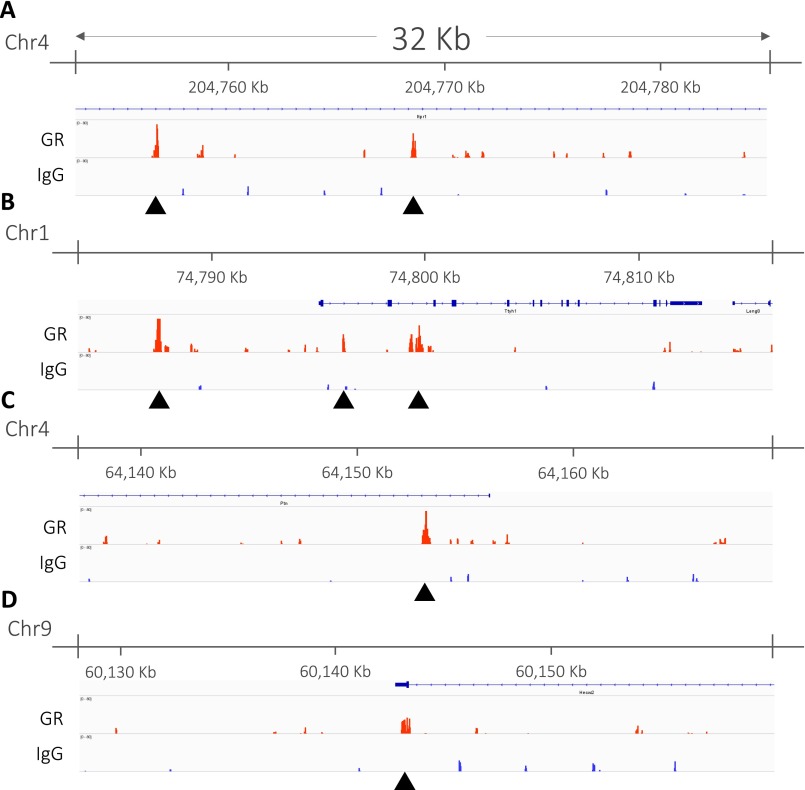
Using gene expression measurements (qPCR and dISH), we validated the responsiveness of Irs4 and Magel2 as predicted ESR1 targets to DES treatment. Despite its importance, especially in detecting colocalization, gene expression remains an indirect measurement of interaction. Therefore, we set out to detect genomic binding of steroid receptors directly using chromatin immunoprecipitation followed by next-generation sequencing (ChIP-Seq). Previously, we used ChIP-Seq to identify genomic binding sites of GR in the rat hippocampus (28). Reanalyzing this data, we identified 694 corticosterone target genes with GR binding sites, of which 16 were within the top 200 genes coexpressed with Gr in the hippocampus (16 of 200; P = 9.97 × 10⁻⁵, one-sided Fisher’s exact test; Table S4). Fig. S5 shows examples of the GR binding sites we identified in genes strongly coexpressed with Gr. We did not observe any significant enrichment of corticosterone target genes in the 200 genes with the lowest correlation to Gr in the hippocampus (five of 200; P = 0.62, one-sided Fisher’s exact test) or in the set of 200 genes with the highest correlation to Esr1 in the hippocampus (one of 200; P = 1, one-sided Fisher’s exact test).
Fig. S5.
Validating GR targets in hippocampus using ChIP-Seq. Examples of GR binding sites to genes strongly coexpressed with Gr in the hippocampus: Itpr1 (A), Ttyh1 (B), Ptn (C), and Hecw2 (D). For each gene, a genomic region of 32 kb centered around the identified peak is shown using the Integrative Genomics Viewer (46). Black arrows indicate the intergenic peaks identified within the gene.
SI Materials and Methods
Allen Mouse Brain Atlas.
The ABA of the Mouse Brain (4) (mouse.brain-map.org) is a spatially mapped ISH gene expression atlas of the 8-wk-old adult C57BL/6J male mouse brain. The genome-wide atlas contains expression data for ∼20,000 genes. For each gene, ISH brain sections were sampled at 25-μm intervals across the entire brain. The high (in-plane)-resolution primary data from each experiment were reconstructed in three dimensions and registered to the Nissl stain-based reference atlas [Allen Mouse Reference Atlas (ARA)], created specifically for this project. For each gene, the data were then aggregated into isotropic voxels defined by a uniform 200-μm grid in the reference space. Resulting data consist of a spatially aligned 67 × 41 × 58 (rostral-caudal, dorsal-ventral, left-right) volume for each gene. The ontology of the ARA is used to label individual voxels with their anatomical nomenclature. Some genes were assayed more than once, using a different probe or plane of sectioning (sagittal or coronal). Generally, ∼20,000 genes were assayed using sagittal-sectioning experiments, whereas the coronal-sectioning experiments were carried out for ∼4,000 genes.
The Allen Mouse Brain Atlas provides expression of genes under normal conditions. Brain sections were collected from thousands of animals, and hence do not represent a single individual. In brief, each brain sectioned in either the sagittal or coronal plane was used to generate eight series (each series contains five slides, each slide contains four sections) (4). Each of these series was hybridized to a single gene with each physical brain used to survey several independent genes (39). For many genes in the dataset, several experiments were conducted, resulting in multiple measurements of those genes from different animals. Moreover, for genes assayed using both sagittal and coronal sectioning experiments, sections were collected from different animals. A visual analysis of the expression pattern of the Man1a gene which is measured using 19 different experiments (18 sagittal and 1 coronal) shows a high consistency of expression patterns, although these patterns come from different animals.
Data Preprocessing.
We downloaded the 26,069 expression energy volumes corresponding to all experiments (21,722 sagittal and 4,347 coronal) through the Application Programming Interface of the ABA on February 12, 2013. Expression energy, E(S), is a measurement combining the expression level [I(v); the integrated amount of signal within each voxel] and the expression density (the amount of “expressing cells” within each voxel). The average expression energy of gene g in region S is calculated as:
where v is a voxel in region S, |S| is the total number of voxels representing S, and M(v) is a binary expression mask with 1’s and 0’s representing expressing and nonexpressing voxels, respectively.
In sagittal-sectioning experiments, data were generated from the left hemisphere of the brain only while in coronal-sectioning experiments; data were generated from both hemispheres. Voxels with more than 20% missing data (no gene expression value) were removed from further analysis, resulting in 27,365 voxels in the sagittal datasets and 61,164 voxels in the coronal datasets.
Spatial Coexpression.
We used Pearson’s correlation coefficient as a measure of similarity between 3D spatial expression profiles. Given a steroid receptor of interest (seed gene), we calculate the Pearson’s correlation between the spatial expression profile of that seed gene and every other gene in the ABA based on the expression values within any structure of interest (e.g., for the whole brain, correlations were calculated based on the expression across 27,365 voxels in the sagittal datasets and 61,164 voxels in the coronal dataset).
Together with the coexpression calculations, we also calculated the average expression energy of gene g in structure S, , as well as the normalized average expression :
where is the average expression of gene g in the whole-mouse brain.
Enrichment Analysis.
To characterize the functional associations of NRs in each of the 12 brain regions, we performed functional enrichment analysis on the top 200 spatially coexpressed genes. Functional enrichment analysis was performed using Enrichr (40). For each region, we report the top 10 enriched Gene Ontology biological process and molecular function.
Gene Set Analysis.
To assess the coexpression between a set of genes and a steroid receptor of interest, a Mann–Whitney U test is used. The test assesses the null hypothesis that the correlations of the set of targets or mediators, on the one hand, and the correlations of all other genes, on the other hand, are independent samples from identical continuous distributions with equal medians, against the alternative that they do not have equal medians. The returned P values from different experiments are corrected for multiple testing by controlling the FDR using the Benjamini–Hochberg method (41) (FDR-corrected).
Selecting Targets for Validation.
To select genes for validation, we generated a list of genes ranked by the strength of their coexpression with Esr1 in the HY. We restricted our analysis to the list of genes with a coronal experiment in the ABA (4,345 genes; Dataset S5). To improve our predictions of coexpressed genes, we filtered out genes with a normalized average expression <THY in the HY. In our experiments, we used THY = 0.5 because the average expression of our receptor of interest, Esr1, in the HY was 0.44. After filtering, we selected the top 10 coexpressed genes as Esr1-related genes for validation using qPCR. In contrast, we selected the 10 genes showing the weakest coexpression with Esr1 (correlation ≈ 0) as a background set.
Sum of Ranks Analysis.
To assess a set of coexpressed genes for a seed gene in a set of functionally related brain structures, such as the dopaminergic system composed of the VTA and SN (Fig. S1), we used a rank sum analysis. We ranked all genes based on their correlation to the seed gene within the structure of interest. Because the number of samples (voxels) used in the correlation calculation varies between different brain structures (i.e., brain structures have different numbers of voxels), comparisons of coexpression across different structures are carried out based on the rank of the gene in a specific list rather than by comparing correlation values. Given a set of structures S, we calculate the sum of ranks RS such that: where is the rank of the correlation between gene i and gene j in structure s. The rank of the correlation is calculated as the rank of the correlation value between seed gene i and target gene j among the list of correlations of all genes with the seed gene i.
We assessed the significance of the sum of ranks value based on permutations. Given a set of n functionally related brain structures, we randomly draw n random integers from a discrete uniform distribution ranging from 1 to the total number of genes (26,022 in the case of all genes and 4,345 in the case of genes with coronal-only experiment). We repeated the experiment 10,000 times and calculated the sum of the randomly drawn numbers to obtain a probability distribution function of obtaining a certain sum of ranks.
Validation Using qPCR and dISH.
C57BL/6J mice were obtained from Charles River Laboratories at the indicated age and were kept for 1 wk under standard housing conditions before they were enrolled in an experimental setup. Nine-week-old male mice underwent gonadectomy or a sham operation under isoflurane anesthesia. Gonadectomy involved a small incision in the skin after which the testes were removed. After 1 wk of recovery, these mice received daily s.c. injections with 100 μg/kg DES (Steraloids, Inc.) dissolved in olive oil or the olive oil vehicle alone for 1 wk before they were terminated by cardiac puncture under isoflurane anesthesia. Brains were rapidly dissected and frozen on powdered dry ice, and stored at −80 °C. All animal experiments were performed with the approval of the Animal Ethics Committee at Erasmus Medical Center. To collect mRNA, frozen brains were cut sagittally over the midline, and 60-μm sections containing HY from one hemisphere were collected on uncoated glass slides (Menzel–Gläser). Hypothalamic tissue was punched out using appropriate Harris Uni-core punching needles (Tedpella) and pooled per anterior (+0.26 to −1.22 mm relative to bregma) or posterior (−1.22 to −2.7 mm relative to bregma) division. RNA isolation and cDNA synthesis have been performed as described in ref. 42. qPCR was performed on a IQ5 PCR platform (Bio-Rad) as described by Boon et al. (43), using 36b4 as a housekeeping gene. Primer sequences are listed in Dataset S6.
For nonisotopic double-label semiquantitative ISH, we used the Panomics View-RNA method (Affymetrix). Probe sets were designed by, and are available from, the manufacturer. Twelve-micrometer-thick section cryosections on Superfrost Plus microscope slides (Menzel Gläser) were postfixed in 4% (vol/vol) formaldehyde (Sigma–Aldrich). Preincubation was performed following the manufacturer’s instructions (https://www.panomics.com/). Probes were hybridized for 4 h in a Startspin thermobrite stove (Iris Sample Processing). Linear amplification and visualization steps were performed following the manufacturer’s instructions. Slides were lightly counterstained with Mayer’s hematoxylin and DAPI (1 min of incubation at 3 μg/mL), and embedded in Innovex mounting medium (Innovex Biosciences).
Validation Using ChIP-Seq.
We remapped the ChIP-Seq data from Polman et al. (28) to the Rattus Norvegicus genome version 5 (rn5) using the Burrow–Wheeler Aligner (44) on default settings. GR peaks were called using model-based analysis of ChIP-Seq (MACS) (45), version 2.14, with the IgG Ab-binding dataset as the background using the following settings: P value cutoff = 0.05; model fold = [10, 40]; λ = 1,000/10,000; effective genome size = 2.5 × 10⁹. In total, we identified 694 genes with intergenic GR binding peaks. Data were visualized by uploading bigwig files to the Integrative Genomics Viewer (IGV) (46).
Discussion
Because nuclear steroid receptors act as transcription factors, they may be expected a priori to coexpress with their target genes and signaling partners. In the brain, the effects of steroid receptors are region-specific, and by analyzing their spatial coexpression relationships across different brain regions, we can define potential targets and partners, as well as parallels between brain areas. The complexity and large variability in gene expression across the brain have forced many studies to analyze either brain-wide expression of a small set of genes or genome-wide expression in a few regions. The availability of high-resolution ISH-based expression maps of the mouse brain in the ABA allows the identification of all genes with a similar expression pattern across many brain regions that might indicate functional similarity between the gene products (29). We provide a comprehensive description of the coexpression of genes with six receptors of gonadal and adrenal steroid hormones in the male mouse brain. Our results demonstrate that genes that are spatially coexpressed with receptors in a region-specific manner can enhance our understanding of brain modulation by steroid hormones.
Using genome-wide spatial coexpression analysis, we observed strong coexpression of known GR transcriptional targets in the hippocampus and known ESR1 transcriptional targets in the HY. These observations support our hypothesis that genes showing strong coexpression with a steroid receptor are enriched in transcriptional targets and/or coregulators of that receptor. In addition, the unanticipated coexpression of genes with these receptors outside their known sites of action may extend our understanding of the coordinated steroid response of the brain. For example, the high coexpression between Gr and its GC-responsive target genes (originally derived from the DG) in CA3, the MB, and the PAL is in line with a network that has been referred to as the neurocircuitry of stress (30). Likewise, dendritic complexity of neurons and excitability are modulated by GCs and stress across different brain regions simultaneously (18). Such similar responses of distinct brain regions suggest similar cellular machinery, and thus similarly correlated gene expression with the responsible receptor.
For the genes that are expressed in a sex-specific manner, we confirmed their coexpression with Esr1, Esr2, and Pgr, which is in accordance with their regulation by gonadal steroids (19). Lack of coexpression with Ar may reflect the fact that many testosterone effects on the HY are mediated by estrogen receptors after aromatization of testosterone into estradiol. It is as yet unclear whether the significant coexpression with Pgr reflects simply coexpression of Esr1 and Pgr or also points to progesterone regulation of these genes. Regardless, we extended the coexpression between sexually dimorphic genes to extrahypothalamic sites, pointing to a parallel regulation in, at least, the PAL, a region that includes the bed nucleus of the stria terminalis, where regulation by (nonspecified) gonadal hormones has been observed (19).
Our analysis of the coexpression of coregulators and steroid receptors identified known relationships, such as the high coexpression between Ncoa1 and Mr in the hippocampus (20). More importantly, this brain-wide analysis provides an overview of potentially unknown relationships between steroid receptors and coregulators. By focusing on dopaminergic regions (VTA and SN), we identified strong coexpression of Pak6 with Ar as well as Gr. Of interest, Pak6 is a known AR coregulator (31) and Pak6 KO mice show several locomotion and behavioral deficits that are likely related to disturbed dopaminergic transmission (32). Thus, this example of Pak6 coexpression underscores the feasibility of our methodology to find potential partners of nuclear steroid receptors. Of note, steroid receptor/coactivator interactions may be induced with a certain degree of specificity by selective modulator types of steroid receptor ligands (24, 33). The coexpression of steroid receptors with their coactivators may not only predict steroid responsiveness but also point to selective activation of particular circuits with synthetic ligands (24).
To test whether spatial coexpression can be used to predict transcriptional targets of steroid receptors in the brain, we used qPCR and dISH to assess if genes strongly coexpressed with Esr1 in the HY include any ESR1 targets. Among the tested genes we identified two estrogen-regulated genes: Irs4, a previously known ESR1 target (19); and Magel2, a previously unidentified ESR1 target. Loss of Magel2 leads to impaired reproduction, providing an immediate link to estrogen regulation (34). This gene is deleted in Prader–Willi syndrome, which is associated with hypogonadotropic hypogonadism, obesity, and hyperphagia (35). Likewise, Irs4 has a role in hypothalamic leptin signaling and regulation of metabolism (36). Therefore, hypothalamic estrogen responsiveness of Magel2 and Irs4 may be related to estrogen effects on metabolism (37). The presently modest predictive power may be improved by incorporating the effect size (i.e., the absolute expression of a gene), given the values for true positives Irs4 and Magel2. Also, the presence of conserved steroid response elements on the DNA could be a useful additional filter (38).
The enrichment of known targets and coregulators of a certain NR within the same brain regions where the NR is expressed confirms the validity of our analysis. Our approach is even strengthened by the notion that the receptor and its targets and/or coregulators are significantly coexpressed despite the genome-wide and brain-wide qualitative approach of measuring mRNA levels using ISH. However, there are some intrinsic limitations to the analysis. First, although the quality of ISH is overall high, it is insufficient for some genes. Of the three datasets covering expression of Gr, only one was of sufficient quality. Also, Ncoa1, which codes for an important coregulator for ESR1 and GR (1, 20), is expressed at low levels and not significantly associated with the two receptors. Consequently, there is the risk for increased false-negative results associated with a genome-wide approach using these data. Second, the ABA maps the expression of all genes under the same normal conditions. This dataset, although unique in its brain-wide and genome-wide coverage, does not include variations between individuals or context-specific expression patterns (SI Materials and Methods).
Our approach relies on Pearson’s correlation as a measure of similarity between 3D expression patterns of genes, summarized to 200-μm isotropic voxels. Although using the expression volumes instead of the original ISH slices simplifies computations and reduces noise effects, the lower resolution yields the analysis of small brain nuclei unreliable. For example, the very small number of voxels representing dorsal raphe nucleus in the 3D atlas hampered analysis of the serotonergic dorsal raphe nucleus. By using correlation as a measure of coexpression, we detect both direct and indirect statistical associations between genes rather than causal relationships, yielding functional validation using expression measurements (qPCR and/or dISH) and ChIP analysis crucial to confirm predicted associations as well as causality.
Concluding, we have shown that nuclear steroid hormone receptors coexpress with genes not known to associate, and in brain regions where steroids were not known to be active. These findings point toward the brain region-specific signaling machinery of the steroid receptors.
Materials and Methods
SI Materials and Methods includes detailed descriptions of the ABA mouse data, data preprocessing steps, spatial coexpression, gene set analysis, selecting targets for experimental validation, rank sum analysis, qPCR validation, dISH, and the ChIP-Seq experiments.
All animal experiments were performed with the approval of the Animal Ethics Committee at Erasmus Medical Center.
Supplementary Material
Acknowledgments
We thank Dr. M. J. M. Schaaf for his critical insight on the manuscript. This research has received partial funding from The Netherlands Technology Foundation (STW), as part of the STW Project 12721 (Genes in Space) under the Imaging Genetics (IMAGENE) Perspective programme, and from the European Union Seventh Framework Programme (FP7/2007-2013) under Grant Agreement 604102.
Footnotes
The authors declare no conflict of interest.
This article is a PNAS Direct Submission.
See Commentary on page 2563.
This article contains supporting information online at www.pnas.org/lookup/suppl/doi:10.1073/pnas.1520376113/-/DCSupplemental.
References
- 1.Stanisić V, Lonard DM, O’Malley BW. Modulation of steroid hormone receptor activity. Prog Brain Res. 2010;181:153–176. doi: 10.1016/S0079-6123(08)81009-6. [DOI] [PubMed] [Google Scholar]
- 2.de Kloet ER, Joëls M, Holsboer F. Stress and the brain: From adaptation to disease. Nat Rev Neurosci. 2005;6(6):463–475. doi: 10.1038/nrn1683. [DOI] [PubMed] [Google Scholar]
- 3.Toffoletto S, Lanzenberger R, Gingnell M, Sundström-Poromaa I, Comasco E. Emotional and cognitive functional imaging of estrogen and progesterone effects in the female human brain: A systematic review. Psychoneuroendocrinology. 2014;50:28–52. doi: 10.1016/j.psyneuen.2014.07.025. [DOI] [PubMed] [Google Scholar]
- 4.Lein ES, et al. Genome-wide atlas of gene expression in the adult mouse brain. Nature. 2007;445(7124):168–176. doi: 10.1038/nature05453. [DOI] [PubMed] [Google Scholar]
- 5.John S, et al. Chromatin accessibility pre-determines glucocorticoid receptor binding patterns. Nat Genet. 2011;43(3):264–268. doi: 10.1038/ng.759. [DOI] [PMC free article] [PubMed] [Google Scholar]
- 6.Krum SA, et al. Unique ERalpha cistromes control cell type-specific gene regulation. Mol Endocrinol. 2008;22(11):2393–2406. doi: 10.1210/me.2008-0100. [DOI] [PMC free article] [PubMed] [Google Scholar]
- 7.Ravasi T, et al. An atlas of combinatorial transcriptional regulation in mouse and man. Cell. 2010;140(5):744–752. doi: 10.1016/j.cell.2010.01.044. [DOI] [PMC free article] [PubMed] [Google Scholar]
- 8.Datson NA, et al. The transcriptional response to chronic stress and glucocorticoid receptor blockade in the hippocampal dentate gyrus. Hippocampus. 2012;22(2):359–371. doi: 10.1002/hipo.20905. [DOI] [PubMed] [Google Scholar]
- 9.Gofflot F, et al. Systematic gene expression mapping clusters nuclear receptors according to their function in the brain. Cell. 2007;131(2):405–418. doi: 10.1016/j.cell.2007.09.012. [DOI] [PubMed] [Google Scholar]
- 10.Reul JMHM, de Kloet ER. Two receptor systems for corticosterone in rat brain: microdistribution and differential occupation. Endocrinology. 1985;117(6):2505–2511. doi: 10.1210/endo-117-6-2505. [DOI] [PubMed] [Google Scholar]
- 11.Pérez SE, Chen E-Y, Mufson EJ. Distribution of estrogen receptor alpha and beta immunoreactive profiles in the postnatal rat brain. Brain Res Dev Brain Res. 2003;145(1):117–139. doi: 10.1016/s0165-3806(03)00223-2. [DOI] [PubMed] [Google Scholar]
- 12.Nilaweera KN, et al. G protein-coupled receptor 101 mRNA expression in supraoptic and paraventricular nuclei in rat hypothalamus is altered by pregnancy and lactation. Brain Res. 2008;1193:76–83. doi: 10.1016/j.brainres.2007.11.048. [DOI] [PubMed] [Google Scholar]
- 13.Kanno S, Hirano S, Kayama F. Effects of the phytoestrogen coumestrol on RANK-ligand-induced differentiation of osteoclasts. Toxicology. 2004;203(1-3):211–220. doi: 10.1016/j.tox.2004.06.015. [DOI] [PubMed] [Google Scholar]
- 14.De Marinis E, et al. 17β-Oestradiol anti-inflammatory effects in primary astrocytes require oestrogen receptor β-mediated neuroglobin up-regulation. J Neuroendocrinol. 2013;25(3):260–270. doi: 10.1111/jne.12007. [DOI] [PubMed] [Google Scholar]
- 15.Baltgalvis KA, Greising SM, Warren GL, Lowe DA. Estrogen regulates estrogen receptors and antioxidant gene expression in mouse skeletal muscle. PLoS One. 2010;5(4):e10164. doi: 10.1371/journal.pone.0010164. [DOI] [PMC free article] [PubMed] [Google Scholar]
- 16.Zia MTK, et al. Postnatal glucocorticoid-induced hypomyelination, gliosis, and neurologic deficits are dose-dependent, preparation-specific, and reversible. Exp Neurol. 2015;263:200–213. doi: 10.1016/j.expneurol.2014.09.013. [DOI] [PMC free article] [PubMed] [Google Scholar]
- 17.Datson NA, et al. Previous history of chronic stress changes the transcriptional response to glucocorticoid challenge in the dentate gyrus region of the male rat hippocampus. Endocrinology. 2013;154(9):3261–3272. doi: 10.1210/en.2012-2233. [DOI] [PMC free article] [PubMed] [Google Scholar]
- 18.Dias-Ferreira E, et al. Chronic stress causes frontostriatal reorganization and affects decision-making. Science. 2009;325(5940):621–625. doi: 10.1126/science.1171203. [DOI] [PubMed] [Google Scholar]
- 19.Xu X, et al. Modular genetic control of sexually dimorphic behaviors. Cell. 2012;148(3):596–607. doi: 10.1016/j.cell.2011.12.018. [DOI] [PMC free article] [PubMed] [Google Scholar]
- 20.Lachize S, et al. Steroid receptor coactivator-1 is necessary for regulation of corticotropin-releasing hormone by chronic stress and glucocorticoids. Proc Natl Acad Sci USA. 2009;106(19):8038–8042. doi: 10.1073/pnas.0812062106. [DOI] [PMC free article] [PubMed] [Google Scholar]
- 21.Nwachukwu JC, et al. Reservatrol modulates the inflammatory response via an estrogen receptor-signal integration network. Elife. 2014;2014(3) doi: 10.7554/eLife.02057. [DOI] [PMC free article] [PubMed] [Google Scholar]
- 22.Kotaja N, Aittomäki S, Silvennoinen O, Palvimo JJ, Jänne OA. ARIP3 (androgen receptor-interacting protein 3) and other PIAS (protein inhibitor of activated STAT) proteins differ in their ability to modulate steroid receptor-dependent transcriptional activation. Mol Endocrinol. 2000;14(12):1986–2000. doi: 10.1210/mend.14.12.0569. [DOI] [PubMed] [Google Scholar]
- 23.Alen P, et al. Interaction of the putative androgen receptor-specific coactivator ARA70/ELE1alpha with multiple steroid receptors and identification of an internally deleted ELE1beta isoform. Mol Endocrinol. 1999;13(1):117–128. doi: 10.1210/mend.13.1.0214. [DOI] [PubMed] [Google Scholar]
- 24.Zalachoras I, et al. Differential targeting of brain stress circuits with a selective glucocorticoid receptor modulator. Proc Natl Acad Sci USA. 2013;110(19):7910–7915. doi: 10.1073/pnas.1219411110. [DOI] [PMC free article] [PubMed] [Google Scholar]
- 25.Niwa M, et al. Adolescent stress-induced epigenetic control of dopaminergic neurons via glucocorticoids. Science. 2013;339(6117):335–339. doi: 10.1126/science.1226931. [DOI] [PMC free article] [PubMed] [Google Scholar]
- 26.Purves-Tyson TD, et al. Testosterone induces molecular changes in dopamine signaling pathway molecules in the adolescent male rat nigrostriatal pathway. PLoS One. 2014;9(3):e91151. doi: 10.1371/journal.pone.0091151. [DOI] [PMC free article] [PubMed] [Google Scholar]
- 27.Schauwaers K, et al. Loss of androgen receptor binding to selective androgen response elements causes a reproductive phenotype in a knockin mouse model. Proc Natl Acad Sci USA. 2007;104(12):4961–4966. doi: 10.1073/pnas.0610814104. [DOI] [PMC free article] [PubMed] [Google Scholar]
- 28.Polman JAE, de Kloet ER, Datson NA. Two populations of glucocorticoid receptor-binding sites in the male rat hippocampal genome. Endocrinology. 2013;154(5):1832–1844. doi: 10.1210/en.2012-2187. [DOI] [PubMed] [Google Scholar]
- 29.Dong H-W, Swanson LW, Chen L, Fanselow MS, Toga AW. Genomic-anatomic evidence for distinct functional domains in hippocampal field CA1. Proc Natl Acad Sci USA. 2009;106(28):11794–11799. doi: 10.1073/pnas.0812608106. [DOI] [PMC free article] [PubMed] [Google Scholar]
- 30.Shin LM, Liberzon I. The neurocircuitry of fear, stress, and anxiety disorders. Neuropsychopharmacology. 2010;35(1):169–191. doi: 10.1038/npp.2009.83. [DOI] [PMC free article] [PubMed] [Google Scholar]
- 31.Lee SR, et al. AR and ER interaction with a p21-activated kinase (PAK6) Mol Endocrinol. 2002;16(1):85–99. doi: 10.1210/mend.16.1.0753. [DOI] [PubMed] [Google Scholar]
- 32.Nekrasova T, Jobes ML, Ting JH, Wagner GC, Minden A. Targeted disruption of the Pak5 and Pak6 genes in mice leads to deficits in learning and locomotion. Dev Biol. 2008;322(1):95–108. doi: 10.1016/j.ydbio.2008.07.006. [DOI] [PubMed] [Google Scholar]
- 33.Atucha E, et al. A mixed glucocorticoid/mineralocorticoid selective modulator with dominant antagonism in the male rat brain. Endocrinology. 2015;156(11):4105–4114. doi: 10.1210/en.2015-1390. [DOI] [PubMed] [Google Scholar]
- 34.Mercer RE, Wevrick R. Loss of magel2, a candidate gene for features of Prader-Willi syndrome, impairs reproductive function in mice. PLoS One. 2009;4(1):e4291. doi: 10.1371/journal.pone.0004291. [DOI] [PMC free article] [PubMed] [Google Scholar]
- 35.Eiholzer U, et al. Hypothalamic and gonadal components of hypogonadism in boys with Prader-Labhart-Willi syndrome. J Clin Endocrinol Metab. 2006;91(3):892–898. doi: 10.1210/jc.2005-0902. [DOI] [PubMed] [Google Scholar]
- 36.Sadagurski M, Dong XC, Myers MG, Jr, White MF. Irs2 and Irs4 synergize in non-LepRb neurons to control energy balance and glucose homeostasis. Mol Metab. 2014;3(1):55–63. doi: 10.1016/j.molmet.2013.10.004. [DOI] [PMC free article] [PubMed] [Google Scholar]
- 37.Frank A, Brown LM, Clegg DJ. The role of hypothalamic estrogen receptors in metabolic regulation. Front Neuroendocrinol. 2014;35(4):550–557. doi: 10.1016/j.yfrne.2014.05.002. [DOI] [PMC free article] [PubMed] [Google Scholar]
- 38.Datson NA, et al. Specific regulatory motifs predict glucocorticoid responsiveness of hippocampal gene expression. Endocrinology. 2011;152(10):3749–3757. doi: 10.1210/en.2011-0287. [DOI] [PubMed] [Google Scholar]
- 39.Ng L, et al. Neuroinformatics for genome-wide 3D gene expression mapping in the mouse brain. IEEE/ACM Trans Comput Biol Bioinformatics. 2007;4(3):382–393. doi: 10.1109/tcbb.2007.1035. [DOI] [PubMed] [Google Scholar]
- 40.Chen EY, et al. Enrichr: Interactive and collaborative HTML5 gene list enrichment analysis tool. BMC Bioinformatics. 2013;14(1):128. doi: 10.1186/1471-2105-14-128. [DOI] [PMC free article] [PubMed] [Google Scholar]
- 41.Benjamini Y, Hochberg Y. Controlling the false discovery rate: A practical and powerful approach to multiple testing. J R Stat Soc Series B Stat Methodol. 1995;57(1):289–300. [Google Scholar]
- 42.Datson NA, et al. A molecular blueprint of gene expression in hippocampal subregions CA1, CA3, and DG is conserved in the brain of the common marmoset. Hippocampus. 2009;19(8):739–752. doi: 10.1002/hipo.20555. [DOI] [PubMed] [Google Scholar]
- 43.Boon MR, et al. Peripheral cannabinoid 1 receptor blockade activates brown adipose tissue and diminishes dyslipidemia and obesity. FASEB J. 2014;28(12):5361–5375. doi: 10.1096/fj.13-247643. [DOI] [PubMed] [Google Scholar]
- 44.Li H, Durbin R. Fast and accurate short read alignment with Burrows-Wheeler transform. Bioinformatics. 2009;25(14):1754–1760. doi: 10.1093/bioinformatics/btp324. [DOI] [PMC free article] [PubMed] [Google Scholar]
- 45.Zhang Y, et al. Model-based analysis of ChIP-Seq (MACS) Genome Biol. 2008;9(9):R137. doi: 10.1186/gb-2008-9-9-r137. [DOI] [PMC free article] [PubMed] [Google Scholar]
- 46.Robinson JT, et al. Integrative genomics viewer. Nat Biotechnol. 2011;29(1):24–26. doi: 10.1038/nbt.1754. [DOI] [PMC free article] [PubMed] [Google Scholar]
Associated Data
This section collects any data citations, data availability statements, or supplementary materials included in this article.


