

Abstract
After more than twenty years busily mapping the human brain, what have we learned from neuroimaging? This review (coda) considers this question from the point of view of structure–function relationships and the two cornerstones of functional neuroimaging; functional segregation and integration. Despite remarkable advances and insights into the brain’s functional architecture, the earliest and simplest challenge in human brain mapping remains unresolved: We do not have a principled way to map brain function onto its structure in a way that speaks directly to cognitive neuroscience. Having said this, there are distinct clues about how this might be done: First, there is a growing appreciation of the role of functional integration in the distributed nature of neuronal processing. Second, there is an emerging interest in data-driven cognitive ontologies, i.e., that are internally consistent with functional anatomy. We will focus this review on the growing momentum in the fields of functional connectivity and distributed brain responses and consider this in the light of meta-analyses that use very large data sets to disclose large-scale structure–function mappings in the human brain.
Introduction
Over the past twenty years, neuroimaging has become the predominant technique in behavioral and cognitive neuroscience. The volume of papers and number of fields it pervades are unrivaled. Despite this, it is curiously difficult to summarize its achievements in general terms. The simplest attempts falls back on the two principles that shaped brain mapping at its inception; namely functional segregation and integration: Neuroimaging has established functional segregation (the segregated or modular deployment of functional specialization within brain regions) as a fundament of brain organization (Fig. 1). However, the initial hope of associating each brain area with a particular function (Posner et al., 1998) has not been realized. While it is true that notions like the ‘motion sensitive center’ and ‘fusiform face area’ are part of common imaging parlance, the functionally informed labeling of all but the smallest portion of cortex remains elusive. Indeed people now prefer to talk about processing hierarchies, intrinsic networks and default modes that have no clear association with discrete cognitive processing components. So can functional integration accommodate functional labels in the context of distributed processing?
Fig. 1.

Publication rates pertaining to functional segregation and integration. Publications per year searching for Activation or Connectivity and functional imaging. This reflects the proportion of studies looking at functional segregation (Activation) and those looking at integration (Connectivity).
Source: PubMed.gov. U.S. National Library of Medicine.
The premise we pursue in this review is that structure–function mappings can be defined and will lead to new cognitive ontologies that are grounded on the functional architectures that support them. However, to access the mappings and ontologies may require us to disassemble current views of cognition and use a more physiologically and anatomically informed approach. Interestingly, many of the tools and ideas required to establish distributed structure–function mappings are exactly those tools and concepts (e.g. standard anatomical spaces) that were essential in establishing brain mapping as the discipline we know today. However, we may now be able to exploit them in a different context, with new approaches to modeling distributed responses and advances in data-mining and meta-analyses.
This review comprises two sections. In the first, we look at recent advances in the modeling of functional integration and network activity. We will cover approaches to both endogenous activity and experimentally evoked or induced responses. To illustrate the power of these approaches, this section focuses on processing hierarchies and the necessary distinction between forward and backward connections as revealed by neuroimaging. It concludes by considering recent advances in network discovery in the setting of hierarchical brain architectures. In the second section, we turn to the unmet challenge above; namely, how do we elaborate cognitive ontologies that map properly to distributed functional architectures in the brain. This section reviews the requisite standardization tools and recent advances in meta-analyses and related multivariate approaches. We conclude with a synthesis of the two sections and consider the application of meta-analytic approach to network discovery and structure–function mappings.
Modeling distributed neuronal systems
In this section, we address the different approaches to modeling neuronal dynamics. Biophysical models of neuronal dynamics are usually used for one of two things; either to understand the emergent properties of neuronal systems or as observation models for measured neuronal responses. In other words, they are used to simulate brain-like dynamics or are used explicitly to predict observed brain activity. We discuss examples of both: in terms of emergent behaviors, we will consider dynamics on structure (Freeman, 1994; Coombes and Doole, 1996; Robinson et al., 1997; Tsuda, 2001; Freeman, 2005; Bressler and Tognoli, 2006; Kriener et al., 2008; Rubinov et al., 2009; Buice and Cowan, 2009) and how this has been applied to characterizing autonomous or endogenous fluctuations in fMRI signals (e.g., Honey et al., 2007, 2009; Deco et al., 2009). We then consider dynamic causal models that are used to explain responses elicited in designed experiments. This section concludes with recent advances in causal modeling that means it can be applied to the study of endogenous fluctuations, in terms of directed neuronal interactions. The first half of this section is based on Friston and Dolan (2010), to which readers are referred for more details.
Modeling autonomous dynamics
There has been a recent upsurge in studies of fMRI signal correlations observed while the brain is at rest (Biswal et al., 1995). These patterns seem to reflect anatomical connectivity (Greicius et al., 2009) and can be characterized in terms of fluctuations of remarkably reproducible spatial patterns or modes (i.e., intrinsic or resting-state networks). One of these modes recapitulates the pattern of deactivations observed across a range of activation studies (the default mode; Raichle et al., 2001). These studies highlight that, even at rest, endogenous brain activity is self-organizing and highly structured. There are many questions about autonomous (self sustaining) dynamics and the structures that support them. Some of the most interesting come from computational anatomy and neuroscience. The emerging picture is that endogenous fluctuations are a consequence of dynamics on anatomical connectivity structures with particular scale-invariant and small-world characteristics (Achard et al., 2006; Honey et al., 2007; Bassett et al., 2006; Deco et al., 2009). In other words, the pattern and strength of brain connections are sufficient to propagate dynamics over large distances, but not dense or strong enough to cause every brain area to synchronize vigorously. This self organized criticality is a well-studied and universal characteristic of complex systems and suggests that we may be able to understand the brain in terms of universal phenomena: phenomena that do not depend upon the biophysical details of the underlying system. For example, Buice and Cowan (2009) model neocortical dynamics using field-theoretic methods to describe both spontaneous neural fluctuations and responses to stimuli. In their models, the density and extent of lateral cortical interactions can be chosen to make the effects of fluctuations negligible. However, as the generation and decay of neuronal activity becomes more balanced, there is a transition into a regime of critical fluctuations. These models suggest that the scaling laws found in many measurements of neocortical activity, are consistent with the existence of phase-transitions at a critical point. They show how such properties lead to both random and rhythmic brain activity (Buice and Cowan, 2009) and speak to larger questions about how the brain maintains its dynamics near phase-transitions, where the patterns of activity changed quantitatively from one sort to another (i.e., self-organized criticality; Kitzbichler et al., 2009) and the putative role of cortical gain control (Abbott et al., 1997). This is an important issue, because self-organization near phase-transitions shows universal patterns and structures, as studied in synergetics (e.g., Jirsa et al., 1994; Jirsa and Haken, 1996; Jirsa and Kelso, 2000; Tognoli and Kelso, 2009; Tschacher and Haken, 2007). Although there have been recent papers arguing for criticality and power law effects in large-scale cortical activity (e.g. Kitzbichler et al., 2009; Linkenkaer-Hansen et al., 2001; Stam and de Bruin, 2004; Freyer et al., 2009), there is also work that argues otherwise; at least at higher frequencies (e.g. Bedard et al., 2006; Miller et al., 2007; Touboul and Destexhe, 2009). The important distinction appears to be that ‘slow’ fluctuations may contain critical oscillations, whereas high-frequency coherent oscillations may reflect other dynamical processes. In summary, endogenous fluctuations may be one way in which anatomy speaks to us through dynamics. They also suggest important questions about how fluctuations shape evoked responses (e.g., Hesselmann et al., 2008).
Dynamical approaches to understanding phenomena in neuroimaging data focus on emergent behaviors and the constraints under which brain-like behavior manifest (e.g., Breakspear and Stam, 2005; Alstott et al., 2009). In the remainder of this section, we turn to models that try to explain observed neuronal activity directly. This is a relatively new field that rests on model fitting or inversion. Model inversion is important: to date, most efforts in computational neuroscience have focused on models of neuronal dynamics (that define a mapping from causes to neuronal dynamics). The inversion of these models (the mapping from neuronal dynamics to their causes) now allows one to test different models against empirical data. Put simply, this means one can compare different models or hypotheses about the generation of neuronal activity by evaluating the evidence for different models, where the evidence is just the probability of some neuroimaging data, under the model. This is known as model comparison or selection, which we will illustrate in the context of dynamic causal modeling.
Dynamic causal modeling
Dynamic causal modeling (DCM) refers to the (Bayesian) inversion and comparison of dynamic models that cause observed data. These models are formulated in continuous time (or frequency) and describe how underlying neuronal and physiological states evolve, in response to experimental inputs or endogenous fluctuations. Usually, but not necessarily, these formulations are in terms of differential equations that describe the motion or flow of hidden neurophysiologic states, while an observer function maps from hidden states to observed brain signals. This mapping is probabilistic and involves some observation noise. Noise at the level of the hidden states can model endogenous fluctuations in neural activity of the sort considered above (Friston et al., 2008); we will return to this later.
Differential equations are essential when modeling the dynamics of biological systems. The basic idea behind DCM is to formulate one or more models of how data are caused in terms of a network of distributed sources. These sources talk to each other through parameterized connections and influence the dynamics of hidden states that are intrinsic to each source. Model inversion provides probabilistic estimates of the model parameters; namely extrinsic connection strengths and intrinsic (synaptic) parameters. These estimates can then be used to evaluate the probability of the data given the model per se. This is the model evidence and is the key quantity that is used for model comparison. In one sense, this approach just formalizes the scientific process based on the evidence for different hypotheses.
DCM was originally introduced for fMRI using a simple model based upon a bilinear approximation to the underlying equations of motion that couple neuronal states in different brain regions (Friston et al., 2003). Crucially, DCMs are generalizations of the conventional convolution model used to analyze fMRI data and event-related potential (ERP) analyses in electrophysiological research. The only difference is that one allows for hidden neuronal states in one part of the brain to be influenced by neuronal states elsewhere. In this sense, they are biophysically informed multivariate analyses of distributed brain responses.
Most DCMs consider point sources both for fMRI and EEG data (c.f., equivalent current dipoles) and are formally equivalent to graphical models, which are used as generative or causal models of observed responses. Inference on the coupling within and between the nodes (brain regions) of these graphs or networks is generally based on perturbing the system experimentally and trying to explain the observed responses by optimizing the model parameters (e.g., connection strengths). This optimization furnishes posterior or conditional probability distributions over the unknown parameters (e.g., effective connectivity) and the evidence for the model. The evidence is tremendously important because it enables model comparison (Penny et al., 2004). The power of Bayesian model comparison, in the context of dynamic causal modeling, has become increasing apparent. This now represents one of the most important applications of DCM and allows different hypotheses to be tested, where each DCM corresponds to a specific hypothesis about functional brain architectures (e.g., Acs and Greenlee, 2008; Allen et al., 2008; Grol et al., 2007; Heim et al., 2009; Smith et al., 2006; Stephan et al., 2007; Summerfield and Koechlin, 2008). Although DCM is probably best known through its application to fMRI, more recent applications have focused on neurobiologically plausible models of electrophysiological dynamics. Furthermore, different data features (e.g., ERPs or induced responses) can be modeled with the same DCM. Figs. 2 to 4 illustrate some key developments in DCM, which are reviewed briefly below.
Fig. 2.

Dynamical causal modeling of electromagnetic responses. Neuronally plausible, generative or forward models are essential for understanding how event-related fields (ERFs) and potentials (ERPs) are generated. DCMs for event-related responses measured with EEG or MEG use biologically informed models to make inferences about the underlying neuronal networks generating responses. The approach can be regarded as a neurobiologically constrained source reconstruction scheme, in which the parameters of the reconstruction have an explicit neuronal interpretation. Specifically, these parameters encode, among other things, the coupling among sources and how that coupling depends upon stimulus attributes or experimental context. The basic idea is to supplement conventional electromagnetic forward models, of how sources are expressed in measurement space, with a model of how source activity is generated by neuronal dynamics. A single inversion of this extended forward model enables inference about both the spatial deployment of sources and the underlying neuronal architecture generating them. Left panel: This schematic shows a few sources that are coupled with extrinsic connections. Each source is modeled with three subpopulations (pyramidal, spiny-stellate and inhibitory interneurons). These have been assigned to granular and agranular cortical layers, which receive forward and backward connections respectively. Right panel: Source model with a layered architecture comprising three neuronal subpopulations, each with three states; voltage and (excitatory and inhibitory) conductances for each subpopulation. These neuronal state-equations are based on a Morris–Lecar (Morris and Lecar, 1981) model and include random fluctuations on the neuronal states (see Marreiros et al., 2009). The effects of these fluctuations can be modeled in terms of the dynamics of the ensuing probability distribution over the states of a population; this is known as a mean-field model. These models can be contrasted with neural-mass models that only consider the expected (mean) state of the population.
Fig. 4.

Forward and backward connections (a DCM study of induced responses). This example provides evidence for functional asymmetries between forward and backward connections that define hierarchical architectures in the brain. It exploits the fact that modulatory or nonlinear influences of one neuronal system on another (i.e., effective connectivity) entail coupling between different frequencies. Functional asymmetry is addressed here by comparing dynamic causal models of MEG responses induced by visual processing of faces. Bayesian model comparison indicated that the best model had nonlinear forward and backward connections. Under this model, there is a striking asymmetry between these connections; in which high (gamma) frequencies in lower cortical areas excite low (alpha) frequencies in higher areas, while the reciprocal effect is suppressive. Left panel: (Above): Log-evidence (pooled over subjects) for four DCMs with different combinations of linear and nonlinear (N vs. L) coupling in forward and backward (F vs. B) connections. It can be seen that the best model is FNBN, with nonlinear coupling in both forward and backward connections. (Below): Location of the four sources (in MNI coordinates) and basic connectivity structure of the models. LV and RV; left and right occipital face area; LF and RF; left and right fusiform face area. Right panel: (Above): SPM of the t-statistic (p>0.05 uncorrected) testing for a greater suppressive effect of backward connections, relative to forward connections (over subjects and hemisphere). (Below): Subject and hemisphere-specific estimates of the coupling strengths at the maximum of the SPM (red arrow). See Chen et al. (2009) for further details.
These examples are chosen to illustrate how much information is latent in neuroimaging data and how it can be accessed by using increasingly detailed and biologically realistic models. One obvious question here is how detailed can these models be? The answer to this question is pragmatic: when models become too complex, there evidence actually starts to decrease (c.f., Occam’s razor). Crucially, the difference between the evidence for two overly complicated or detailed models disappears. This enables one to conclude that, for the data in hand, there is no evidence for one model over another. In other words, Bayesian model comparison allows one to find the right level of biophysical detail that is supported by the data available. Data from fMRI has exquisite spatial resolution but cannot differentiate between detailed models of temporal dynamics that are formulated in terms of realistic populations and synaptic processes. Conversely, electromagnetic data, although lacking precise spatial information can support very detailed physiological models, provided we know where in space the signals were generated. The biological plausibility of current models is illustrated by the neural mass models used in DCM for electromagnetic signals.
Neural-mass models
Most recent developments in modeling have focused on electromagnetic (EEG and MEG) data (David et al., 2006; Kiebel et al., 2006, 2007; Garrido et al., 2007a,b; Clearwater et al., 2008; Chen et al., 2008; Garrido et al., 2008), with related developments to cover local field potential (LFP) recordings (Moran et al., 2007, 2008). These models are more sophisticated than the neuronal models for fMRI and are based upon neural-mass or mean-field models of interacting neuronal populations (see Deco et al., 2008). These models summarize the dynamics of neuronal populations in terms of their mean activity, which greatly simplifies the models by providing an abstraction that retains the basic behaviors but dispenses with the detailed dynamics of individual neurons. Typically, each source of electromagnetic activity is modeled as an equivalent current dipole (or ensemble of small cortical patches); whose activity reflects the depolarization of three populations (usually one inhibitory and two excitatory). Crucially, one can embed any neural-mass model into DCM. These can include models based upon second-order linear differential equations (c.f., Lopes da Silva et al., 1974; Jansen and Rit, 1995) or conductance-based models based on nonlinear differential equations (c.f., Morris and Lecar, 1981). This is useful, because there is an established literature and understanding about the behavior of these various neural mass models of neuronal dynamics.
As with DCM for fMRI, DCM for electromagnetic responses is just a generalization of conventional (equivalent current dipole) models that have been equipped with parameterized connections among and within sources (David et al., 2006). These models fall into the class of spatiotemporal dipole models (Scherg and Von Cramon, 1985) and enable entire time-series over peristimulus time to be modeled. Face validation of these models has used known electro-physiological phenomena and independent measures of coupling (e.g. David and Friston, 2003; David et al., 2004). Their predictive validity has been established using, for example, the mismatch negativity (Näätänen, 2003) as an exemplar sensory learning paradigm (e.g., Garrido et al., 2007a, 2008).
Developments in this area have been rapid and can be summarized along two lines. First, people have explored more realistic neural-mass models based upon nonlinear differential equations, whose states correspond to voltages and conductances (c.f., Morris and Lecar, 1981). See Fig. 2. This allows one to formulate DCMs in terms of well-characterized synaptic dynamics and model different types of receptor-mediated currents explicitly. Furthermore, conventional neural-mass modeling (which considers only the average state of a neuronal ensemble) has been extended to cover ensemble dynamics in terms of probability distributions over the hidden states of neuronal populations. This involves modeling not just the average activity but also its dispersion and covariance among different neuronal populations (Marreiros et al., 2009). The second line of development concerns the particular data features the models try to explain. In conventional DCMs for ERPs, the time-course of voltage at the sensors is modeled explicitly. However, DCMs for spectral responses (Moran et al., 2007, 2008) can be applied to continuous recordings of arbitrary length. This modeling initiative rests on a linear systems analysis of the underlying neural-mass model to give a predicted spectral response for unknown but parameterized endogenous input. In other words, one can make the simplifying assumption that observed fluctuations in electromagnetic signals are caused by small endogenous perturbations to the system’s average state. This means that, given the spectral or frequency profile of electrophysiological recordings, one can estimate the coupling among different sources and the spectral energy of neuronal and observation noise generating observed spectra. This has proved particularly useful for LFP recordings and has been validated using animal models and psychopharmacological constructs (Moran et al., 2007, 2008). Indeed, this could be a potentially important tool in studies of receptor function and related learning paradigms. Finally, there are DCMs for induced responses (Chen et al., 2008). Like the steady-state models, these predict the spectral power of responses but as a function of peristimulus time. The underlying neural model here is based upon the simple bilinear approximation to any neuronal dynamics. The key benefit of these DCMs is that one can quantify the evidence for between-frequency coupling among sources, relative to homologous models restricted to within-frequency coupling. Coupling between frequencies corresponds to nonlinear coupling. Being able to detect nonlinear coupling is important because it speaks to nonlinear or modulatory synaptic mechanisms that might differentiate between forward and backward connections.
Forward and backward connections in the brain
To provide a concrete example of how DCM has been used to build a picture of distributed processing in the brain, we focus on the role of forward and backward message-passing among hierarchically deployed cortical areas (Felleman and Van Essen, 1991). Many current formulations of perceptual inference and learning can be cast in terms of minimizing prediction error (e.g., predictive coding; Ballard et al., 1983; Mumford, 1992; Dayan et al., 1995; Rao and Ballard, 1998; Murray et al., 2002) or, more generally, surprise (Friston et al., 2006). The predictive coding hypothesis suggests that prediction errors are passed forward from lower levels of sensory hierarchies to higher levels, to optimize representations in the brain’s internal model of its world. Predictions based upon these representations are then passed down backward connections to suppress or explain away prediction errors. This message-passing scheme rests upon reciprocal or recurrent self organized dynamics that necessarily involve forward and backward connections. There are some key predictions that arise from this scheme. First, top-down influences mediated by backward connections should have a tangible influence on evoked responses that are modulated by prior expectations induced by priming and attention. Second, the excitatory influences of forward (glutamatergic) connections must be balanced by the (polysynaptic) inhibitory influence of backward connections; this completes the feedback loop suppressing prediction error. Third, the backward connections should involve nonlinear or modulatory effects; because it is these, and only these, that model nonlinearities in the world that generate sensory input.
These functionally grounded attributes of forward and backward connections, and their asymmetries, are exactly the sort of things that current modeling of neuroimaging data can now test. A fairly comprehensive picture is now emerging from DCM studies using several modalities and paradigms: Initial studies focused on attentional modulation in visual processing. These studies confirmed that the attentional modulation of visually evoked responses throughout the visual hierarchy could be accounted for by changes in the strength of connections mediated by attentional set (see Friston et al., 2003). In other words, no extra input was required to explain attention-related responses; these were explained by recurrent dynamics among reciprocally connected areas, whose influence on each other increased during attentive states.
More recently the temporal anatomy of forward and backward influences has been addressed using DCM for event related potentials ERPs. Garrido et al. (2007b) used model comparison to show that the evidence for backward connections was more pronounced in later components of the ERP. Put another way, backward connections are necessary to explain late or endogenous response components in simple auditory ERPs. See Fig. 3. These results fit comfortably with the dynamics of reciprocally connected neuronal populations, whose time-constants are much greater than any single neuronal unit within each population. Garrido et al. (2008) then went on to ask whether one could understand repetition suppression in terms of changes in forward and backward connection strengths that are entailed by predictive coding. DCM showed that repetition suppression, of the sort that might explain the mismatch negativity (Näätänen, 2003), could be explained purely in terms of a change in forward and backward connections with repeated exposure to a particular stimulus. Furthermore, by using functional forms for the repetition-dependent changes in coupling strength, Garrido et al. (2009) showed that changes in extrinsic (cortico-cortical) coupling were formally distinct from intrinsic (within area) coupling. This was consistent with theoretical predictions about changes in post-synaptic gain and distinct changes in synaptic efficacy associated with learning under predictive coding. Finally, Chen et al. (2009) addressed functional asymmetries in forward and backward connections during face perception, using DCM for induced responses. These asymmetries were expressed in terms of nonlinear or cross-frequency coupling; where high frequencies in a lower area excited low frequencies in a higher area, whereas the reciprocal influences where inhibitory. See Fig. 4. These results may be related to the differential expression of gamma activity in superficial and deep pyramidal cells that are the origin of forward and backward connections respectively (see Chrobak and Buzsaki, 1998; Roopun et al., 2008; Fries, 2009; Wang, 2010). The emerging story here is that forward connections may employ predominantly fast (gamma) frequencies, while backward influences may be meditated by slower (beta) activity.
Fig. 3.

Forward and backward connections (a DCM study of evoked responses). Electrophysiological responses to stimuli unfold over several hundred milliseconds. Early or exogenous components are thought to reflect a perturbation of neuronal dynamics by (bottom-up) sensory inputs. Conversely, later endogenous components have been ascribed to (top-down) recurrent dynamics among hierarchical cortical levels. This example shows that late components of event-related responses are indeed mediated by backward connections. The evidence is furnished by dynamic causal modeling of auditory responses, elicited in an oddball paradigm using electroencephalography (EEG). Here, we consider the evidence for models with and without backward connections in data gathered over increasing windows of peristimulus time. Left panel (Model specification and data): The upper graph shows the ERP responses to a deviant tone, from 0 to 400 ms peristimulus time (averaged over subjects). Sources comprising the DCM were connected with backward (gray) and/or forward (dark gray) connections as shown below. A1: primary auditory cortex, STG: superior temporal gyrus, IFG: inferior temporal gyrus. Two different models were tested, with and without backward connections (FB and F respectively). Sources (estimated posterior moments and locations of equivalent dipoles) are superimposed on an MRI of a standard brain in MNI space (upper left). Right panel (Bayesian model selection): The upper graph shows the differences in log-evidence when comparing the model with backward connections (FB) against the model without (F). It shows that the evidence for the model with backward connections is substantially greater when, and only when, we consider the evidence in data late in peristimulus time (after about 220 ms). The lower graphs show predicted (solid) and observed (broken) responses (of the principal spatial mode in channel space). The improved fit afforded by backward connections is evident. This sort of result links a generic feature of brain responses to recurrent dynamics; which are a cornerstone of most modern theories of perceptual inference and learning. See Garrido et al. (2007b) for further details.
Recent electrophysiological evidence suggests that the top-down signals may be expressed predominantly in the beta frequency range. Conversely, the bottom up signals reporting prediction error may be expressed at higher (gamma) frequencies (see Wang, 2010 for a comprehensive review). This is asymmetry is exactly consistent with theoretical treatments of evidence accumulation in predictive coding; where “Principal cells elaborating predictions (e.g., deep pyramidal cells) may show distinct (low-pass) dynamics, relative to those encoding error (e.g., superficial pyramidal cells)” (Friston, 2008). The same theme emerges in adaptive resonance treatments of attentive learning by laminar thalamocortical circuits: prediction errors “cause gamma oscillations that support attention, resonance, learning, and … beta oscillations during reset and hypothesis testing operations that are initiated in the deeper cortical layers” (Grossberg and Versace, 2008). An empirical example here is the work of Zhang et al. (2008), who showed that prestimulus cortical activity is correlated with the speed (reaction time: RT) of visuomotor processing. These authors recorded local field potentials from macaque monkeys trained to perform a visuomotor pattern discrimination task. “In the prefrontal cortex, prestimulus power in the beta range (14–30 Hz) was negatively correlated with RT in two monkeys, suggesting a possible role of activity in this frequency range in the mediation of top-down control of visuomotor processing” (Zhang et al., 2008).
The implicit spectral asymmetry in forward and backward connections is a nice example of how far we have come in terms of characterizing structure–function relationships and the sorts of questions currently being addressed. In principle, the application of modern causal modeling techniques to characterize distributed electromagnetic responses is now in a position to address very detailed and specific hypotheses about the dynamics and structural architectures that underlie neuronal computations.
In conclusion, we have come some way, in terms of understanding the functional anatomy of forward and backward connections in the brain. Interestingly, some of the more compelling insights have been obtained by using biophysical models with simple paradigms (like the mismatch negativity) and simple non-invasive techniques (like EEG). All the examples so far have used evoked or induced responses to make inferences about distributed processing. Can we apply the same modeling principles to autonomous or endogenous activity and still find evidence for structured hierarchical processing?
Network discovery
Dynamic causal modeling is usually portrayed as a hypothesis-led approach to understanding distributed neuronal architectures underlying observed brain responses (Friston et al., 2003). Generally, competing hypotheses are framed in terms of different networks or graphs, and model selection is used to quantify the evidence for one network (hypothesis) over another (Penny et al., 2004). However, in recent years, the number of models people consider has grown enormously; to the extent that DCM is now used to compare very large numbers of models (e.g., Stephan et al., 2008; Penny et al., 2004). Using DCMs based on stochastic differential equations, it is now possible to take this discovery theme one step further and throw away prior knowledge about the experimental causes of observed responses to make DCM entirely data-led. This enables network discovery using observed responses during both activation studies and (task-free) studies of autonomous or endogenous activity.
This form of network discovery uses model selection to identify the sparse network connections that best explains observed time-series (Friston et al., 2011). The connectivity specifies the form of the network (e.g., cyclic or acyclic) and its graph-theoretical attributes (e.g., degree distribution). Crucially, this form of network discovery can be applied to experimentally evoked responses (activation studies) or endogenous activity in task-free (resting state) fMRI studies. Unlike many conventional approaches to network discovery, DCM permits the analysis of directed and cyclic graphs. In other words, one can compare models with directed connections of a biologically plausible sort that can be recurrent or reciprocal. This modeling application furnishes a network description of distributed activity in the brain that is optimal in the sense of having the greatest evidence, relative to other networks.
To illustrate this approach, Fig. 5 shows an example of network discovery following a search over all combinations of connections among six nodes or regions. This example used DCM for fMRI and an attention to motion paradigm (see Friston et al., 2011 for details). Six representative regions were defined as clusters of contiguous voxels surviving an (omnibus) F-test for all effects of interest at p<0.001 (uncorrected) in a conventional SPM analysis. These regions were chosen to cover a distributed network (of largely association cortex) in the right hemisphere, from visual cortex to frontal eye fields. The activity of each region (node) was summarized with its principal eigenvariate to ensure an optimum weighting of contributions for each voxel with the ROI. Fig. 5 summarizes the results of post hoc model selection. The upper left panel shows the log of the evidence for the 32,768 models considered (reflecting all possible combinations of bidirectional edges among the six nodes analyzed). In this example, there is a reasonably clear optimum model. This is evident if we plot the probability of each model, given the data (assuming all models were equally likely a priori), as shown on the upper right. In this case, we can be over 80% certain that one network generated the observed fMRI data. Usually, one finds that subsets of models are, collectively, better than other subsets, where a subset can be defined by the presence or absence of a particular connection or attribute.
Fig. 5.

Model selection and network discovery. This figure summarizes the results of model selection using fMRI data. The upper left panel shows the log-evidence profile over all models considered (encoding different combinations of edges among the six nodes). The implicit model posterior (assuming flat priors over models), is shown on the upper right and suggests that we can be over 80% certain that a particular architecture generated these data. The parameter estimates of the connections under a model with full connectivity (left) and selected model (right) are shown in the lower panels. We can see that certain connections have been switched off as the parameter estimates are reduced to their prior value of zero. It is these anti-edges that define the architecture we are seeking. This architecture is shown graphically in the next figure.
The parameter estimates of the connections under the model with full connectivity (left) and the selected model (right) are shown in the lower panels. One can see that three connections have been ‘switched off’. This is a surprisingly dense network, in which all but three of the fifteen reciprocal connections appear to be necessary to explain observed responses. This dense connectivity may reflect the fact that we deliberately chose regions that play an integrative (associational) role in cortical processing (c.f., hubs in graph theory; Bullmore and Sporns, 2009).
Fig. 6 shows the underlying graph in anatomical and functional (spectral embedding) space. Note that these plots refer to undirected graphs (we will look at directed connections strengths below). The upper panel shows the six regions connected using the conditional means of the coupling parameters (in Fig. 5), under the selected (optimal) model. The color of the arrows reports the source of the strongest bidirectional connection, while its width represents its absolute (positive or negative) strength. This provides a description of the architecture in anatomical space. A more functionally intuitive depiction of this graph is provided in the lower panel. Here, we have used spectral embedding to place the nodes in a functional space, where the distance between them reflects the strength of bidirectional coupling. But what do these graphical representations tell us about putative hierarchical structure?
Fig. 6.

The selected graph (network) in anatomical space and functional space. This figure shows the graph selected (on the basis of the posterior probabilities in the previous figure) in anatomical space and functional (spectral embedding) space. The upper panel shows the six regions connected using the conditional means of the coupling parameters, under the model selected (see Fig. 5). The color of the arrow reports the source of the strongest bidirectional connection, while its width represents its absolute (positive or negative) strength. This provides a description of the architecture or graph in anatomical space. A more functionally intuitive depiction of this graph is provided in the lower panel. Here, we have used spectral embedding to place the nodes in a functional space, where the distance between them reflects the strength of bidirectional coupling. Spectral embedding uses the eigenvectors vectors (principle components) of the weighted graph Laplacian to define a small number of dimensions that best capture the proximity or conditional dependence between nodes. Here, we have used the first three eigenvectors to define this functional space. The weighted adjacency matrix was, in this case, simply the maximum (absolute) conditional estimate of the coupling parameters. The middle panel shows the asymmetry strengths based on the conditional estimates of the selected model. This provides a further way of characterizing the functional architecture in hierarchical terms, based on (bidirectional) coupling. vis —visual cortex; sts — superior temporal sulcus; pfc — prefrontal cortex; ppc — posterior parietal cortex; ag — angular gyrus; fef — frontal eye fields.
Asymmetric connections and hierarchies
Network analyses using functional connectivity (correlations among observed neuronal time series) or diffusion weighted MRI data cannot ask whether a connection is larger in one direction relative to another, because they are restricted to the analysis of undirected (simple) graphs. However, here we have the unique opportunity to exploit asymmetries in reciprocal connections and revisit questions about hierarchical organization (e.g., Capalbo et al., 2009; Hilgetal et al., 2000; Lee and Mumford, 2003; Reid et al., 2009). There are many interesting analyses that one could consider, given a weighted (and signed) connectivity matrix. Here, we will illustrate a simple analysis of functional asymmetries: There are several strands of empirical and theoretical evidence to suggest that, in comparison to bottom-up influences, the net effects of top-down connections on their targets are inhibitory (e.g., by recruitment of local lateral connections; cf., Angelucci and Bullier, 2003; Crick and Koch, 1998). Theoretically, this is consistent with predictive coding, where top-down predictions suppress prediction errors in lower levels of a hierarchy (see above). One might therefore ask which hierarchical ordering of the nodes maximizes the average strength of forward connections relative to their backward homologue. This can be addressed by finding the order of nodes that maximizes the difference between the average forward and backward conditional estimates of effective connectivity: The resulting order was vis, sts, pfc, ppc, ag, and fef, (see Fig. 6), which is not dissimilar to the vertical deployment of the nodes in functional embedding space (Fig. 6; lower panel). The middle panel shows the asymmetry indices for each connection, based on the estimates of the selected model. This is a pleasing result because it places the visual cortex at the bottom of the hierarchy and the frontal eye fields at the top, which we would expect from the functional anatomy of these regions. Note that there was no bias in the model or its specification toward this result. Furthermore, we did not use any of the experimental factors in specifying the model and yet the data tell us that a plausible hierarchy is the best explanation for observed fluctuations in brain activity (Müller-Linow et al., 2008).
Summary
In summary, current modeling initiatives in neuroimaging call on biophysical models of neuronal dynamics by treating them as forward or generative models for empirical time-series. The ensuing inferences pertain to the models per se and their parameters (e.g., effective connectivity) that generate observed responses. Using model comparison, one can search over wide model-spaces to find optimal architectures or networks. Having selected the best model (or subset of models), one then has access to the posterior density on the neuronal and coupling parameters defining the network. Of key interest here are changes in coupling that are induced experimentally with, for example, drugs, attentional set or time. These experimentally induced changes enable one to characterize the context-sensitive reconfiguration of brain networks and test hypotheses about the relative influence of top-down and bottom-up signals. Recent advances in models based on stochastic differential equations can now accommodate hidden fluctuations in neuronal states that enable the modeling of autonomous or endogenous brain dynamics. Coupled with advances in post hoc model selection, we can now search over vast model-spaces to discover the most likely networks generating both evoked and spontaneous activity.
The examples in this section have been chosen to illustrate how models of neuronal dynamics can be used to exploit neuroimaging data that, on the surface, may have an apparently limited spatial temporal resolution. However, by using biologically plausible explanations for these data we can link processes at the synaptic scale to the globally distributed network responses we measure. The central role of models is not remarkable, in that it speaks to the crucial role of hypotheses or theories about functional brain architectures. Having considered the basic structures or architectures that are latent in neuroimaging data, we now turn to the functional attribution of these structures in terms of cognitive ontologies and task-analyses.
Meta-analytic approaches to neural system modeling
In this section, we discuss the rapidly evolving use of coordinate-based meta-analysis of functional and structural neuroimaging data to create graphical models of human neural systems. These models provide data-driven hypotheses to guide experimental designs and inform statistical modeling (e.g., by providing priors for DCM and other forms of graphical analysis). The neuroimaging community enjoys the enviable status of having developed analytic and reporting standards that not only provide excellent per-study sensitivity, but also enable a growing repertoire of spatial meta-analytic methods. Spatial normalization is the most fundamental analytic and reporting standard that enables spatial meta-analysis: Spatial normalization transforms a brain image from ‘native space’ into a standardized space defined by a reference brain (Fox, 1995a,b), where locations are addressed by x–y–z coordinates. The original motivation for introducing spatial normalization (Fox et al., 1985) was to allow the locations of task-induced functional activations to be reported in a “precise and unambiguous” manner, thereby “facilitating direct comparison of experimental results from different laboratories”; i.e., in anticipation of coordinate-based meta-analysis. The power of this standard has been reinforced by the widespread adoption of voxel-wise analyses (rather than region-of-interest analysis) and the acquisition of imaging data sets that span the entire brain (or nearly so). Both of these advances reduce the bias inherent in spatially selective (region-of-interest) reporting. Collectively, these standards are enabling an evolving family of coordinate-based meta-analysis (CBMA) methods, several of which exhibit the ability to extract “emergent properties”, i.e., to discover classes of observations not reported in the source publications (Laird et al., 2009a).
Coordinate-based meta-analysis: Early efforts
Meta-analysis is most generally defined as the post hoc combination of results from independent studies. The original use of meta-analysis was to combine non-significant effects to reveal effects that were collectively significant (e.g., to determine which adverse events are rare but real drug side effects and which are random events). This application uses the implicit large sample sizes to increase statistical power (Pearson, 1904). In the neuroimaging community, however, the primary use of meta-analysis has been to synthesize the published literature for the purpose of generating constraints on the interpretation, design and analysis of subsequent studies (Fox et al., 1998). In the first neuroimaging meta-analysis, coordinates from extant reports were tabulated and plotted to constrain interpretation of a primary (non-meta-analytic) study (Frith et al., 1991). Shortly thereafter, “stand-alone” neuroimaging meta-analyses began to appear (Tulving et al., 1994; Fox, 1995a,b; Picard and Strick, 1996), serving as quantitative reviews and hypothesis generation. Although the first neuroimaging meta-analyses were statistically informal, this soon changed. The shift to quantitative CBMA perhaps began with Paus (1996), who computed and interpreted means and standard deviations of the x–y–z addresses in a review of studies of the frontal eye fields. Fox and colleagues extended this initiative by correcting raw estimates of spatial location and variance for sample size, to create scalable models of location probabilities (functional volumes models or FVM) and suggesting uses of such models for data analysis (Fox et al., 1997, 1999, 2001). To support systematic development of CBMA methods, Fox, Lancaster and colleagues developed the BrainMap database as an open-access repository of functional neuroimaging studies, providing both study results (activation locations) and coded experimental meta-data that necessarily entailed an evolving cognitive ontology (Fox and Lancaster, 2002; Laird et al., 2005b,c; Fox et al., 2005a,b).
Activation likelihood estimation
Activation likelihood estimation (ALE) and related techniques (Turkeltaub et al., 2002; Chein et al., 2002; Wager et al., 2003) moved CBMA a quantum leap forward. ALE input data are activation–location coordinates from conceptually related studies; e.g., all Stroop tasks. ALE models the uncertainty in localization of activation foci using Gaussian probability density distributions. The voxel-wise union of these distributions yields the ALE value, an estimate of the likelihood that at least one of the foci in a dataset was truly located at a given voxel. As with FVM, a great advantage of ALE is that the tables of coordinates routinely reported by neuroimaging studies are its input data: “raw” data are not required. Unlike FVM, however, ALE requires no user selection of comparable coordinates for modeling: rather, once a set of experiments (e.g. a group of experiments using similar paradigm) is selected for meta-analysis, the entire set of reported coordinates is used, thereby greatly increasing the reproducibility and objectivity of the analysis.
In the original implementation of ALE, there were several acknowledged limitations. For example, while applying false discovery rate (FDR) method to compute voxel-wise significance, Turkeltaub used a fixed-effect analysis that did not correct for multiple comparisons; the size of the modeled Gaussian distribution was rationalized based on the spatial resolution of the input images, rather than on a formal estimate of spatial uncertainty. In short, a method for comparing ALE maps was lacking; there were no correction for the variable number of activations reported per experiment or the number of experiments per paper. Many of limitations subsequently have been addressed by various investigators. Laird et al. (2005a) provided a correction for multiple comparisons and a method for ALE–ALE statistical contrast. Eickhoff et al. (2009) introduced empirical estimates of between-subject and between-template spatial variability (a modification of the FVM spatial probability model) in place of user-selected Gaussian filtering. In addition, the permutation test was modified to test for the above-chance clustering between experiments in an anatomically constrained space (gray-matter only), resulting in a transition from fixed-effects to random-effects inference. Turkeltaub et al. (2012) introduced corrections for the variable numbers of foci per experiment and experiments per paper, to prevent undue weighting of ALE maps by individual experiments (e.g., with large numbers of foci) or individual papers (e.g., with multiple similar experiments.) Each of these additions increased statistical rigor and specificity without decreasing sensitivity.
Since its introduction, ALE has been applied to many aspects of normal brain function (Decety and Lamm, 2007; Costafreda et al., 2008; Spreng et al., 2009; Soros et al., 2009), as well as in studies of neuropsychiatric and neurological disorders, such as schizophrenia (Ragland et al., 2009; Minzenberg et al., 2009; Glahn et al., 2005), obsessive–compulsive disorder (Menzies et al., 2008), depression (Fitzgerald et al., 2008), and developmental stuttering (Brown et al., 2005). Recently, ALE has been extended to voxel-based morphometry (Schroeter et al., 2007; Glahn et al., 2008; Ellison-Wright et al., 2008) and diffusion tensor imaging studies (Ellison-Wright and Bullmore, 2009). The most interesting ALE applications do not merely merge previous results, but also identify previously unspecified spatial regions, resolve conflicting views, validate new paradigms and generate hypotheses (including spatial models, below) for experimental testing. A more comprehensive list of ALE studies and algorithms is available at www.brainmap.org/pubs.
Within-paradigm network discovery
As a voxel-based algorithm, ALE identifies foci having significant co-occurrence probabilities across studies. In graphical modeling, these foci serve as “nodes”. Having used ALE to identify nodes, it should be possible to use the co-occurrence patterns among nodes in a CBMA data set to compute “edges”, creating a fully meta-analytic neural system model. To explore this possibility, Neumann and colleagues applied replicator dynamics: a network discovery technique from theoretical biology. Replicator dynamics detects networks of strongly interacting entities using the principles of natural selection. In the context of fMRI data analysis, it can be employed to explore relations between voxels within the same cortical areas and, most importantly, to reveal interdependencies between different cortical areas (Lohmann and Bohn, 2002). Neumann extended this strategy by developing Replicator Dynamics Network Analysis (RDNA), a meta-analytic method using an ALE dataset to define nodes and then computes edges from the per-experiment spatial probability density maps. RDNA was successfully applied to the Stroop task (using data drawn from the BrainMap database) to identify the dominant clique present in these data (Neumann et al., 2005).
Because Neumann’s implementation of RDNA was limited to identification of a single dominant clique, Lancaster and colleagues modified the RDNA algorithm to provide multiple subnets (Lancaster et al., 2005). Lancaster also introduced fractional similarity network analysis (FSNA), which is based on a pattern-matching strategy using the Jaccard similarity measure. As applied to neuroimaging data, FSNA takes as input an ALE data set. The pattern-matching algorithm is applied at the per-experiment level to form similarity subnets. Similarity subsets are groupings of members that are most similar in their patterns of occurrence. The FSNA algorithm is a robust and general scheme that identifies similarity subsets, where set elements can be characterized using a fixed length binary feature pattern. The length or dimension of a binary feature pattern is the number of elements (nodes) used in forming the pattern. Lancaster also evaluated RDNA and FSNA (using the same Stroop CVM data sets used by Neumann) with varying thresholds and compared the two techniques. Note that both for these within-paradigm network modeling approaches and for the more advanced methods that followed (below), the “edges” are emergent properties, as the data meta-analyzed reported only activation sites (“nodes”), extracting “functional integration” information from “functional segregation” studies.
Between-paradigm meta-analytic connectivity modeling
While the approaches above are based on within-paradigm co-occurrence patterns, between-paradigm co-occurrence patterns can also serve as a source of functional connectivity modeling. The basic argument behind this approach is that just as the correlation of activations between regions within a single study can be taken as evidence of inter-regional connectivity (e.g., in “traditional” functional connectivity analyses); and just as the probability of co-occurrence within paradigm but over studies can be taken as evidence of functional inter-regional connectivity (e.g., in RDNA and FSNA, above); so can the probability of co-occurrence over paradigms and studies be used to assess functional connectivity. The connectivity patterns derived by this class of analysis will not be specific to a single paradigm, but instead will yield more general (canonical) connectivity patterns that subserve a wider range of behavioral operations.
To pilot this approach, Koski and Paus (2000) assembled a database of 413 conditional contrasts (individual experiments). The number of experiments (conditional contrasts) yielding a peak in seven, pre-defined frontal subdivisions was tabulated and compared for experiments with and without anterior cingulate gyrus (ACG) activation. Frequency distributions were compared with a chi-squared test, to identify statistically significant co-occurrences. While viewing their new approach as quite promising, Koski and Paus’s study lacked any form of validation. Acknowledging this shortcoming, they recommended further explorations of the method using larger data sets (e.g., the BrainMap database), developing more sophisticated statistical approaches, and validating the approach against alternative connectivity measures (e.g., TMS/PET). Each of the recommendations has been adopted by one or more subsequent authors.
Postuma and Dagher (2006) were the first to generate synthetic, meta-analytic functional connectivity images. For this study, the authors compiled a database of activated locations from 539 experiments. They seeded this dataset with volumes bounding the caudate nucleus and putamen and observed co-activation patterns “consistent with the concept of spatially segregated corticostriatal connections as predicted by previous anatomical labeling studies in non-human primates”. As with the Koski and Paus study, no formal validations were reported.
The region-seeding (“structure-based”) strategy of Postuma and Dagher was adopted and extended by Robinson and colleagues in application to the amygdala (Robinson et al., 2010), using the Harvard/Oxford atlas to define the amygdala region of interest. To compute co-occurrence probabilities, Robinson applied ALE, terming the output a “structure-based” (i.e., region seeded) “meta-analytic connectivity model” (MACM). By way of validation, Robinson compared the MACM amygdala-connectivity results with those obtained by tract-tracing in rhesus monkeys, as reported in the CoCoMac database (Stephan et al., 2000). For the MACM analysis, the BrainMap database provided 170 and 156 experiments for the left and right amygdala, respectively and found startlingly good correspondence.
The first within-species validation of the MACM approach was provided by Eickhoff et al. (2010), using diffusion tensor imaging (DTI) probabilistic tractography to confirm MACM-derived connectivity. For this validation, Eickhoff drew upon previously defined cytoarchitectonic subdivisions of the human parietal operculum (Eickhoff et al., 2010); a parcellation scheme believed to be homologous to that described in the rhesus monkey. The connectivity patterns of the two most well studied subdivisions (OP1 and OP4) were compared across techniques. For MACM, the regions of interest jointly extracted 245 experiments from the BrainMap database. For DTI, 18 healthy normal volunteers were studied. Comparison of connectivity patterns between techniques showed close (but not perfect) correspondence. It should be noted that DTI tractography will provide connectivity limited to first-order (direct) connections, while MACM – showing all co-occurrences – would be expected to yield both direct and indirect connections. Further, DTI will be intrinsically biased toward heavily myelinated connections, while MACM should preclude this bias.
The second within-species validation of meta-analytic functional connectivity compared resting-state functional connectivity (using BOLD fMRI) to MACM in the nucleus accumbens (Cauda et al., 2011). For the nucleus accumbens region-of-interest, BrainMap provided 57 experiments, a relatively small input data set. For resting-state fMRI, 17 healthy subjects were studied. Despite the limited amount of BrainMap data utilized, the MACM proved robust (Fig. 7), as did the RSN map. Overall, the two techniques converged, with resting-state connectivity showing somewhat greater sensitivity than MACM. In this context, it is important to note that the sensitivity of MACM is strongly influenced by the size of the seed region and the volume of data in the BrainMap database. As the database becomes more populated, the sensitivity of MACM will increase and allow progressively finer anatomical connectivity parcellations. It should also be noted that Eickhoff, Robinson and Cauda all made use of BrainMap behavioral domain and/or paradigm class metadata to interpret the functional roles of both the seed regions and their connections.
Fig. 7.

Meta-analytic connectivity modeling (MACM). The co-occurrence-based functional connectivity of the nucleus accumbens is shown. Colors from red to yellow indicate a prevalent right lateralization. Colors from blue to green indicate a prevalent left lateralization. Despite being computed from a relatively small volume of interest (containing activations from only 57 experiments from the BrainMap database), validation by comparison to a region-seeded analysis of resting-state BOLD fMRI showed excellent correspondence. For more details, see Cauda et al. (2011).
A third class of validation of the MACM strategy applies connectivity-based parcellation to BrainMap data, compared the resulting segmentation to borders defined by other methods. Connectivity-based parcellation has been shown to provide a close correspondence between structurally and functionally defined borders, using the boundary between SMA and pre-SMA as a demonstration case (Johansen-Berg et al., 2004). Eickhoff et al. (2011) applied connectivity-based parcellation BrainMap data, for the same brain regions (SMA and pre-SMA) obtaining the same borders. In an even more telling validation, Bzdok et al. (personal communication) applied connectivity-based parcellation to the BrainMap data for the amygdala, demonstrating a close correspondence to previously defined cytoarchitecture borders (Fig. 8).
Fig. 8.
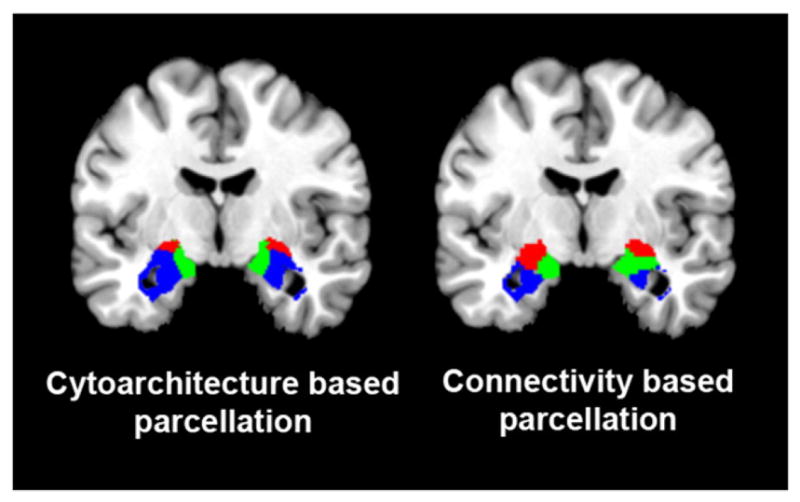
Connectivity-based parcellation. Connectivity-based parcellation of the amygdala, using the BrainMap database (right) shows good spatial contiguity and localization in accordance with microscopically observed parcellation (left) (Amunts et al., 2005). Blue = corresponds to laterobasal nuclei group, red = corresponds to centromedial nuclei group, and green = corresponds to superficial nuclei group. Images were rendered using Mango (multi-image analysis GUI; http://ric.uthscsa.edu/mango/). Figure courtesy of Danilo Bzdok.
Bayesian network discovery
A very recent advance in the use of CBMA for connectivity modeling was reported by Neumann et al. (2010), who built on the use of Bayesian networks for the representation of statistical dependencies. Bayesian networks are probabilistic graphical models representing a set of random variables and their probabilistic interdependencies. More formally, a Bayesian network is a directed acyclic graph (DAG) that comprises a set of nodes (vertices) and directed links (edges) connecting these nodes. Bayesian networks were chosen, for three reasons. First, they belong to the class of directed graphical models, which enables us to investigate directed interdependencies between the activation of different brain regions. Second, the structure of Bayesian networks can be inferred from observed data. In other words, we can learn the statistical interdependencies between the brain regions from activations observed across a number of imaging experiments. Third, the theory for learning Bayesian networks from data has been fully established.
In application to neuroimaging meta-analysis, Neumann’s approach used co-activation patterns of brain regions across imaging studies and learned the structure of the underlying directed acyclic graphs. This was done by first computing an ALE map of a large subset (2505 experiments) of the BrainMap data. This map first was restricted to the 49 most commonly occurring regions and then was further restricted to the 13 most commonly co-occurring regions, using three separate applications of the replicator dynamics process, each of which identified sub-sets of regions. The regions included part of the posterior medial frontal cortex primarily covering supplementary and pre-supplementary motor areas, anterior cingulate cortex, posterior parts of the lateral prefrontal cortex bilaterally, dorsal premotor cortex bilaterally, left and right anterior insula, left and right thalamus, left and right anterior intraparietal sulcus and left cerebellum. For these regions, DAGs were computed for groupings provided by each run of replicator dynamics and for the collection of all regions. The DAG computed for a 10-node grouping (run 3) is illustrated in Fig. 9.
Fig. 9.
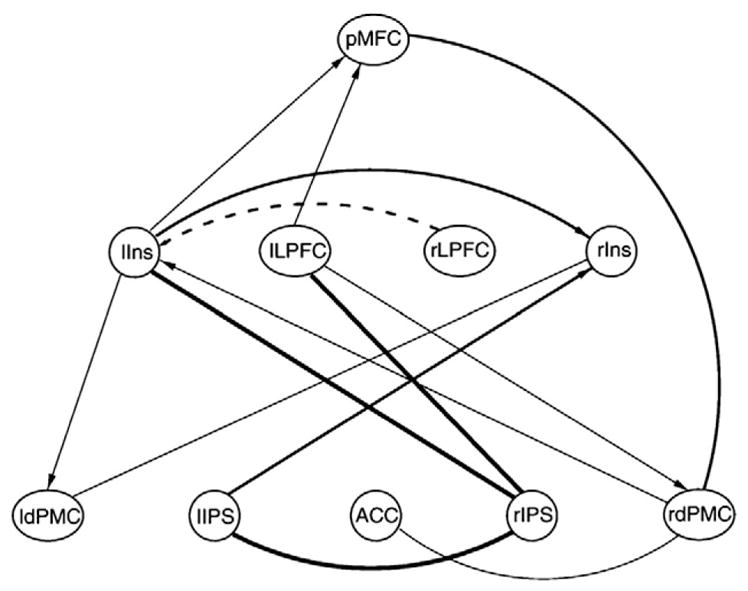
Bayesian network discovery. A Bayesian network extracted from the BrainMap database is shown. Bayesian networks are directed acyclic graphs (DAGS) computed by the conditional probabilities of co-occurrences. The nodes of the graph were selected by a step-wise filtering of the database to identify the thirteen most commonly co-occurring regions among the 49 most commonly occurring regions. The regions include part of posterior medial frontal cortex (pMFC), anterior cingulate cortex (ACC), lateral prefrontal cortex (LPFC), dorsal premotor cortex bilaterally (dPMC), insula (Ins), and anterior intraparietal sulcus (IPS). While this analysis required an exceptional volume of data, it demonstrates the suitability of the BrainMap database for Bayesian inferential approaches including discovery of directed graphs. For more details, see Neumann et al. (2010).
Supplementing this real-world application with extensive simulations, Neumann demonstrated that structure learning for Bayesian networks can be used to infer partially directed functional networks from fMRI meta-analysis data. For small numbers of functional regions, directed and undirected statistical interdependencies (functional connectivity) can be reliably detected from a few tens or hundreds of observations. In larger networks, at least a subset of expected interdependencies is reliably detectable, given sufficient data. This is in keeping with the Bayesian discovery of networks using DCM, described above.
Independent component analysis
In the two preceding sections, we can see an emerging trend toward methods that exploit large data sets (i.e. using the entire Brain-Map database or large subsets thereof) even if they are behaviorally inhomogeneous (i.e., not based on the same paradigm). The most extreme examples of this trend are seen in the recent publications by Toro et al. (2008) and by Smith et al. (2009).
Toro and colleagues used the BrainMap database to generate a comprehensive “connectivity atlas”. At the time this atlas was generated, BrainMap included 3402 experiments (conditional contrasts) reporting a total of 27,909 activated locations. For each experiment, a binary, per-study activation volume was generated at a voxel-size of 4 mm3 isotropic. From these, the co-occurrence pattern likelihood was computed between all voxels, using likelihood ratios. This generated 45,000 unique co-activation maps (one for each 4 mm3 voxel in the brain). Reproducibility of the co-activation map was assessed by estimating the similarity between pairs of partial co-activation maps that used disjoint random subsamples of experiments for group sizes of 500, 1000, 1500, 2000, 2500 and 3000. The correlation between maps was significant and increased asymptotically with the number of experiments, being reasonably high with only 500 experiments. Thus, the co-activation maps did not depend on a particular choice of experiments, and there existed a robust structure in the meta-analytic functional connectivity that can be recovered even with a moderate number of studies. This dataset was probed by selecting seed regions in three networks widely described in the functional neuroimaging literature and, in particular, in resting-state fMRI studies: the frontal/parietal “attention” network, the “default mode network”, and the cortical/diencephalic/cerebellar “motor” network (Fox et al., 2005a,b). In each case, the correspondence between the CBMA-derived connectivity maps and the resting-state fMRI-derived networks was remarkable.
Stimulated by Toro’s observations, Smith and colleagues took this strategy a step further, and applied ICA to the entire BrainMap data (Smith et al., 2009). ICA has been widely used to demonstrate intrinsic connectivity networks in the resting brain using fMRI (i.e., resting-state networks or RSNs). Although observed at rest, Fox and Raichle (2007) proposed that RSNs represent basic organizational units of the brain, being “functional networks” drawn upon during task performance. Smith tested this hypothesis by comparing ICA decompositions of resting-state fMRI to those derived from the entirety of the BrainMap data. At the time of this data extraction (2007), BrainMap contained 7432 experiments, representing imaging studies from 29,671 human subjects. In parallel, ICA analyses were performed using resting-state fMRI data from 36 healthy volunteers. Decompositions were performed into both 20 and 70 components.
Of the 20 components generated separately from the two datasets, ten maps from each set were unambiguously paired between datasets, with a minimum correlation r=0.25 (p<10−5, corrected for multiple comparisons and for spatial smoothness.) These ten well-matched pairs of networks are shown in Fig. 10. With an ICA dimensionality of 70, the primary networks split into subnets in similar (but not identical) ways, continuing to show close correspondence between BrainMap and RSN components. This argues that the full repertoire of functional networks utilized by the brain in action (coded in BrainMap) is continuously and dynamically “active” even when at “rest” and, vice versa, that RSNs represent an intrinsic functional architecture of the brain that is drawn upon to support task performance.
Fig. 10.

Independent component analysis. Ten well-matched pairs of networks from the 20-component analysis of the 29,671-subject BrainMap activation database and (a completely separate analysis of) the 36-subject resting FMRI dataset. This figure shows the 3 most informative orthogonal slices for each pair. (Left column of each pair) Resting fMRI data, shown superimposed on the mean fMRI image from all subjects. (Right column of each pair). For more details, see Smith et al. (2009).
Functional ontologies
For system modeling, meta-analysis has the substantial advantage of being able to filter its findings with the behavioral metadata associated with each experiment in the BrainMap database. Behavioral filtering has been widely used in selecting papers for inclusion in a meta-analysis (discussed in Fox et al., 2005b). A more recently developed use of behavioral metadata is to characterize the behavioral properties of a specific region, e.g., the target of a structure-based meta-analysis (Robinson et al., 2010; Cauda et al., 2011). Fig. 11 illustrates the use of behavioral domain field to categorize the functional specificity of the Amygdala in the context of structure-based MACMs. Statistical methods to test for between-region differences in behavioral domain profiles have been developed and will be released pending ongoing validations (J. Lancaster, S. Eickhoff, A. Laird, P. Fox and colleagues). Using this approach, it appears that –given sufficient numbers of experiments and well-developed behavioral metadata – unique behavioral characterization of individual brain regions is a viable possibility. This will be done, however, by means of complex behavioral profiles, rather than by assigning a concisely described (“put”, “get”, “move”), individual mental operation to each brain region, as Posner et al. (1998) had suggested. This approach is in keeping with the view of Price and Friston (2005), who argued that the mapping between mental operations and brain regions is a many-to-many mapping, in which a single region can be involved in many cognitive processes and a single elementary process engages multiple regions. It is also concordant with the argument put forward by Poldrack (2006), that the cognitive “reverse inference” (i.e., that a specific mental operation is necessarily engaged if a particular brain region is activated) is intrinsically weak due (in part) to participation of individual regions in multiple cognitive operations.
Fig. 11.

Behavioral domain profiles. Behavior domain profiles are shown for amygdala. The difference in the behavioral domain profiles of the amygdala (Row B) and the whole-brain (whole-database; Row A) is apparent, with a much greater participation of the amygdala in tasks categorized as involving “Emotion”. Further, there may be a difference in behavioral profile of the right and left amygdala, when the specific types of emotion are considered (Row C). For more details, see Robinson et al. (2010).
An extension of the behavioral domain profile approach is to extract profiles for multiple regions jointly, i.e., to characterize a functional network. This strategy was employed by Laird et al. (2009a,b,c), in work which behaviorally categorized the default mode network (DMN), examining behavioral domain profiles of individual areas and of groups of areas (i.e., sub networks). An extension of this concept, recently developed by J. Robinson, is using behavioral domains to filter meta-analytic connectivity models, creating models of functionally specific projections of individual brain structures. This is illustrated in Fig. 12, in which the projections (co-activation patterns) of the caudate nucleus were filtered by BrainMap behavioral domains. Note that cortical components of the cognitive, motoric, perceptual and emotional networks are largely discrete. This strategy of mapping the behavioral specificity by pathway provides the additional benefit of a disclosing a previously undescribed functional sub-segregation of the human caudate nucleus which appears homologous to the non-human primate.
Fig. 12.

Behavioral domain filtering. A MACM of the caudate nucleus filtered by the top tier of the behavioral domain hierarchy is illustrated. Caudate-connected regions differed in their behavioral specificity, ranging from having a single dominant domain to having four well-represented domains. The projection patterns closely matched those established in the primate literature and were confirmed by DTI tractography.
Figure courtesy of Jennifer Robinson.
Another strategy for meta-analytic structure–function inference was pioneered by Smith et al. (2009), in the context of applying ICA to the BrainMap database. Fig. 12 (left side) is a “heat map” showing the respective contributions of BrainMap behavioral domains to individual components in the ICA shown in Fig. 9. Close inspection reveals that some components have very high behavioral specificity, while other components have contributions from a wide range of behavioral domains. The ICA-based strategy of Smith and colleagues has been extended by Laird and colleagues (manuscript in review) both by enriching the metadata included in the analysis and by applying hierarchical clustering analysis to sort components into functionally related groupings (Fig. 13, right side). While this approach provided a much more refined association of components with behaviors, some components still show limited behavioral specificity. The most likely explanation for this lack of behavioral specificity in some networks is two-fold: First, the behavioral specificity of some regions and networks (“hubs” in the terminology of Small World modeling) is almost certainly low. Hub regions are engaged in a wide variety of tasks and will defy precise behavioral characterization. Second, a more evolved functional ontology is needed, as has been argued (Price and Friston, 2005; Poldrack, 2006). Relative to the second cause, the approaches illustrated here, we would suggest, provide the tools for ontology development to proceed programmatically. This can be determined by targeting networks that show limited behavioral domain specificity and enriching the metadata, e.g., by adding levels to the coding hierarchy. This work is ongoing (Fox et al., 2005a,b; Laird et al., 2011). Ultimately, categorizations of behavior that are reflected in the network properties of the brain will have superior intrinsic validity and utility than those based solely on cognitive theory.
Fig. 13.

Behavioral domain ICA and hierarchical clustering. Mapping of BrainMap metadata onto ICA components are shown. On the left panel, twenty (of 66) of the behavioral domain categorization were correlated with ten of the primary functional networks in a heat-map representation of a 20-component ICA of the BrainMap database. (See Smith et al., 2009 for more details.) On the right, the metadata analysis has been extended to include 50 behavioral domain categories and 75 paradigm class categories. Hierarchical clustering was used to group the ICA into spatially and behaviorally related clusters for all 20 ICA components. For more details, see Laird et al. (2011).
A closing point of some importance is that meta-analysis offers the most versatile, most powerful extant approach for discovering the behavioral significance of networks mapped using either DTI tractography or resting-state fMRI. DTI, being an anatomical technique, contains no behavioral information. Resting-state fMRI, being performed “at rest”, is not under experimental control, leaving the behavior unspecified. Both DTI and resting-state fMRI have been shown to provide very similar connectivity maps to MACM. Consequently, behavioral characterizations provided for MACM-defined pathways should be reasonably applied to pathways defined by the other techniques.
Meta-analyses as priors
The family of coordinate-based meta-analysis methods described above may appear to be conceptually discrete methods. In practice, however, they tend to be applied serially, with simpler forms of meta-analysis providing input for more advanced forms. For example, FSNA and RDA (above) take an ALE volume as input and compute a paradigm-specific system-model. Similarly, Neumann et al. (2010) used ALE to identify nodes before doing Bayesian network discovery. The MACM approach of Robinson et al. (2010) used ALE to provide priors. While these are examples of CBMAs providing priors for CBMAs, the strategy is more general. Karlsgodt et al. (2010), for example, used ALE to select regions-of-interest for analysis for an analysis of brain-behavior pleiotropy (one to many mapping) of visual working memory. The most advanced and impactful use of CBMA to provide priors is in the domain of graphical modeling, as follows.
System-level modeling approaches most commonly applied to functional neuroimaging data (SEM, DCM and Small World modeling), are confirmatory methods that require strong a priori hypotheses about the regions involved (nodes) and their interdependencies (edges). Otherwise stated, well-chosen priors improve model fit (Stephan et al., 2009). Given ability of the several approaches described above to provide fairly complete, data-driven models, their use as priors for graphical modeling seems quite promising. Perhaps the first application of this strategy was reported by Laird, who used an ALE meta-analysis of TMS/PET studies of primary motor cortex to inform an SEM analysis of a TMS/PET dataset (Laird et al., 2008). The goodness of fit of the model thus derived to the data was quite striking, endorsing the value of this strategy. A subsequent application of the strategy used previously published ALE meta-analyses of stuttered and non-stuttered speech (Brown et al., 2005) as priors for fitting PET data during cued speech in persons with and without stuttering (Price et al., 2009). Again, the goodness-of-fit of the ALE-based models to datasets was striking. Further, this strategy allowed excellent between-group (stuttering vs. non-stuttering) discrimination with group sizes as small as 15 (power>0.8). This strongly suggests a role for this analysis and modeling approach to treatment trials, using graphical models to characterize the brain mechanisms of action of treatments in patient groups. This strategy is currently being explored in treatment trials of post-traumatic stress disorder in a military population (Fig. 14), in persistent developmental stuttering and in Parkinson’s disease by Fox and colleagues.
Fig. 14.

Meta-analytic neural system models. Meta-analytically derived graphical models are illustrated. In the left panel, a graphical model of the default mode network (DMN) is represented, divided into behaviorally specific cliques. Nine nodes in the model were determined by ALE meta-analysis of “task-negative” responses from 119 experiments, following the original description of the DMN (Shulman et al., 1997). For each of the nine nodes, behavioral domain profiles were generated, to characterize the “task-positive” functions of the nodes and to inform grouping into behaviorally related cliques. MACM was then performed on each of the nine nodes, to yield per-node connectivity maps. Path directionality indicates that an endpoint region was observed in the region-seeded MACM of a starting-point region. (For more detail, see Laird et al., 2009a,b,c). In the right panel, a graphical model of the scenario-based trauma recall task as performed in patients with post-traumatic stress disorder (PTSD) is illustrated. The model was generated using procedures similar to those described for the right panel, but limiting input to studies reporting activations induced by the trauma recall task in PTSD patients and normal volunteers.
Figure courtesy of Amy Ramage.
Summary
In summary, coordinate-based meta-analytic approaches have evolved rapidly over the past decade, becoming progressively more effective at mining the vast volume of the functional and structural neuroimaging literature. While early CBMA methods focused on activation likelihood estimation, subsequent methods have extended this approach to inter-regional dependencies and characterization of the behavioral properties of regions and networks. The networks extracted by CBMA have been repeatedly validated relative to those extracted by other connectivity imaging methods (e.g., DTI and RSNs), allowing the behavioral inferences uniquely provided by CBMA to be applied to these data sets. The ultimate goal of these meta-analytic methods is to inform subsequent studies, both by informing interpretation of observed results and by providing well-formulated, spatially specific hypotheses – including graphical models – to guide experimental design and statistical analysis, including construction of graphical models as priors for causal analysis (SEM, DEM) and other model-based analysis.
Conclusion
In conclusion, we have reviewed some of the remarkable advances in imaging neuroscience over the past two decades, with a special focus on functional integration and distributed processing. In the first section, we covered developments in network discovery and the analysis of effective connectivity at a mechanistic and neural level. In the second section, we saw that the concepts of functional connectivity transcend measures of neuronal activity and can be used to characterize interregional dependencies at a much larger (meta-analytic) scale. In both settings, the deep questions pertain to how processing is distributed over neuronal networks and the effective or functional connectivity among their nodes.
From the point of view of this review, there has been a notable shift from early questions about functional segregation such as “Which area does my paradigm activate?” to questions about functional integration. In this context, the experimental paradigms and the associated cognitive constructs serve simply to elicit activations (and co-activations) that are then used to infer connectivity architectures. At the level of effective connectivity, this is self-evident in the way that various experimental factors are modeled in terms of influencing connections. In this context, we have also seen that cognitive constructs are not always necessary to disclose processing principles; for example, in the analysis of task-free paradigms and endogenous fluctuations. In meta-analyses, the paradigms and underlying cognitive ontology serve to delimit (filter) the data that are subject to co-activation analysis. In this sense, they provide a constraint or context, within which to understand the functional affiliations of the distributed patterns inherent in data. Perhaps surprisingly, some of the most interesting results were obtained with very large datasets, in which these constraints are relaxed completely and all brain activations are considered collectively.
In terms of structure–function relationships, the meta-analytic treatments described above clearly reflect a greater role for neurophysiology in defining meaningful brain systems. It is also evident that the way forward, in terms of quantifying structure function mappings, lies in assimilating large amounts of physiological and cognitive variables. One might anticipate that over the next few years people will apply the techniques described above, not just to the conditional contrasts encoding brain activations, but to concatenated vectors of data that encode the activations and the experimental factors (and implicit cognitive processing components) that elicit them. In other words, we can apply current techniques to look not just for connections between brain regions but for connections between regions and cognitive processes in (abstract) cognitive spaces. Conceptually, these connections are formally what we mean by a structure–function mapping.
In terms of integrating analyses of effective connectivity described in the first section and meta-analyses of functional connectivity described in the second, there are some potentially exciting avenues that suggest themselves: we have noted above that the role of meta-analysis is to provide constraints or prior beliefs that can inform more detailed modeling of within-paradigm data. The mechanisms for this integration are largely in place and involve using the meta-analytic functional connectivity as priors on effective connectivity. This has already proven a fruitful strategy when combining probabilistic information from tractography and dynamic causal modeling. The idea here is to show models that are meta-analytically informed have more evidence than the equivalent model without meta-analytic priors. Not only would this nuance the study of effective connectivity but would provide definitive evidence for the large scale and generic constructs provided by meta-analyses. We are currently pursuing this.
In conclusion, we hope to have described the key trends and ideas that we have been pursuing since the inception of human brain mapping and comment upon the direction these ideas are taking us. We appreciate that this may be something of a colloquial perspective but it is one that engages us and a growing number of researchers in imaging neuroscience.
Acknowledgments
KJF was funded by the Wellcome Trust. PTF was funded by the Research Imaging Institute and the Department of Radiology of the University of Texas Health Science Center at San Antonio, by the South Texas Veterans Health Care System, by the National Institutes of Health (MH74457, RR024387, MH084812, NS062254, AA019691), and by the Congressionally Directed Medical Research Program (W81XWH0820112).
References
- Abbott LF, Varela JA, Sen K, Nelson SB. Synaptic depression and cortical gain control. Science. 1997 Jan 10;275(5297):220–224. doi: 10.1126/science.275.5297.221. [DOI] [PubMed] [Google Scholar]
- Achard S, Salvador R, Whitcher B, Suckling J, Bullmore E. A resilient, low-frequency, small-world human brain functional network with highly connected association cortical hubs. J Neurosci. 2006;26(1):63–72. doi: 10.1523/JNEUROSCI.3874-05.2006. [DOI] [PMC free article] [PubMed] [Google Scholar]
- Acs F, Greenlee MW. Connectivity modulation of early visual processing areas during covert and overt tracking tasks. Neuroimage. 2008;41:380–388. doi: 10.1016/j.neuroimage.2008.02.007. [DOI] [PubMed] [Google Scholar]
- Allen P, Mechelli A, Stephan KE, Day F, Dalton J, Williams S, McGuire PK. Fronto-temporal interactions during overt verbal initiation and suppression. J Cogn Neurosci. 2008;20:1656–1669. doi: 10.1162/jocn.2008.20107. [DOI] [PubMed] [Google Scholar]
- Alstott J, Breakspear M, Hagmann P, Cammoun L, Sporns O. Modeling the impact of lesions in the human brain. PLoS Comput Biol. 2009 Jun;5(6):e1000408. doi: 10.1371/journal.pcbi.1000408. [DOI] [PMC free article] [PubMed] [Google Scholar]
- Amunts K, Kedo O, Kindler M, Pieperhoff P, Mohlberg H, Shah NJ, Habel U, Schneider F, Zilles K. Cytoarchitectonic mapping of the human amygdala, hippocampal region and entorhinal cortex: intersubject variability and probability maps. Anat Embryol (Berl) 2005;210:343–352. doi: 10.1007/s00429-005-0025-5. [DOI] [PubMed] [Google Scholar]
- Angelucci A, Bullier J. Reaching beyond the classical receptive field of V1 neurons: horizontal or feedback axons? J Physiol Paris. 2003;97:141–154. doi: 10.1016/j.jphysparis.2003.09.001. [DOI] [PubMed] [Google Scholar]
- Ballard DH, Hinton GE, Sejnowski TJ. Parallel visual computation. Nature. 1983;306:21–26. doi: 10.1038/306021a0. [DOI] [PubMed] [Google Scholar]
- Bassett DS, Meyer-Lindenberg A, Achard S, Duke T, Bullmore E. Adaptive reconfiguration of fractal small-world human brain functional networks. Proc Natl Acad Sci U S A. 2006 Dec 19;103(51):19518–19523. doi: 10.1073/pnas.0606005103. [DOI] [PMC free article] [PubMed] [Google Scholar]
- Bedard C, Kroger H, Destexhe A. Model of low-pass filtering of local field potentials in brain tissue. Phys Rev E Stat Nonlin Soft Matter Phys. 2006;73(5 Pt 1):051911. doi: 10.1103/PhysRevE.73.051911. [DOI] [PubMed] [Google Scholar]
- Biswal B, Yetkin FZ, Haughton VM, Hyde JS. Functional connectivity in the motor cortex of resting human brain using echo-planar MRI. Magn Reson Med. 1995;34(4):537–541. doi: 10.1002/mrm.1910340409. [DOI] [PubMed] [Google Scholar]
- Breakspear M, Stam CJ. Dynamics of a neural system with a multiscale architecture. Philos Trans R Soc Lond B Biol Sci. 2005 May 29;360(1457):1051–1074. doi: 10.1098/rstb.2005.1643. [DOI] [PMC free article] [PubMed] [Google Scholar]
- Bressler SL, Tognoli E. Operational principles of neurocognitive networks. Int J Psychophysiol. 2006 May;60(2):139–148. doi: 10.1016/j.ijpsycho.2005.12.008. [DOI] [PubMed] [Google Scholar]
- Brown S, Laird AR, Ingham RJ, Ingham JC, Fox PT. Stuttered and fluent speech production: an ALE meta-analysis of functional neuroimaging studies. Hum Brain Mapp. 2005;25:105–117. doi: 10.1002/hbm.20140. [DOI] [PMC free article] [PubMed] [Google Scholar]
- Buice MA, Cowan JD. Statistical mechanics of the neocortex. Prog Biophys Mol Biol. 2009 Feb-Apr;99(2–3):53–86. doi: 10.1016/j.pbiomolbio.2009.07.003. [DOI] [PubMed] [Google Scholar]
- Bullmore E, Sporns O. Complex brain networks: graph theoretical analysis of structural and functional systems. Nat Rev Neurosci Mar. 2009;19(3):186–198. doi: 10.1038/nrn2575. [DOI] [PubMed] [Google Scholar]
- Capalbo M, Postuma E, Goebel R. Combining structural connectivity and response latencies to model the structure of the visual system. PLos Comput Biol. 2009;4(8):e10000159. doi: 10.1371/journal.pcbi.1000159. [DOI] [PMC free article] [PubMed] [Google Scholar]
- Cauda F, Cavanna AE, D’agata F, Sacco K, Duca S, Geminiani GC. Functional connectivity and coactivation of the nucleus accumbens: a combined functional connectivity and structure-based meta-analysis. J Cogn Neurosci. 2011;23:2864–2877. doi: 10.1162/jocn.2011.21624. [DOI] [PubMed] [Google Scholar]
- Chein JM, Fissell K, Jacobs S, Fiez JA. Functional heterogeneity within Broca’s area during verbal working memory. Psychol Behav. 2002;77:635–639. doi: 10.1016/s0031-9384(02)00899-5. [DOI] [PubMed] [Google Scholar]
- Chen CC, Kiebel SJ, Friston KJ. Dynamic causal modelling of induced responses. Neuroimage. 2008 Jul 15;41(4):1293–1312. doi: 10.1016/j.neuroimage.2008.03.026. [DOI] [PubMed] [Google Scholar]
- Chen CC, Henson RN, Stephan KE, Kilner JM, Friston KJ. Forward and backward connections in the brain: a DCM study of functional asymmetries. Neuroimage. 2009 Apr 1;45(2):453–462. doi: 10.1016/j.neuroimage.2008.12.041. [DOI] [PubMed] [Google Scholar]
- Chrobak JJ, Buzsaki G. Gamma oscillations in the entorhinal cortex of the freely behaving rat. J Neurosci. 1998;18(1):388–398. doi: 10.1523/JNEUROSCI.18-01-00388.1998. [DOI] [PMC free article] [PubMed] [Google Scholar]
- Clearwater JM, Kerr CC, Rennie CJ, Robinson PA. Neural mechanisms of ERP change: combining insights from electrophysiology and mathematical modeling. J Integr Neurosci. 2008 Dec;7(4):529–550. doi: 10.1142/s0219635208002003. [DOI] [PubMed] [Google Scholar]
- Coombes S, Doole SH. Neuronal populations with reciprocal inhibition and rebound currents: effects of synaptic and threshold noise. Phys Rev E Stat Phys Plasmas Fluids Relat Interdiscip Topics. 1996 Oct;54(4):4054–4065. doi: 10.1103/physreve.54.4054. [DOI] [PubMed] [Google Scholar]
- Costafreda SG, Brammer MJ, David AS, Fu CH. Predictors of amygdala activation during the processing of emotional stimuli: a meta-analysis of 385 PET and fMRI studies. Brain Res Rev. 2008;58:57–70. doi: 10.1016/j.brainresrev.2007.10.012. [DOI] [PubMed] [Google Scholar]
- Crick F, Koch C. Constraints on cortical and thalamic projections: the no-strong-loops hypothesis. Nature. 1998;391(6664):245–250. doi: 10.1038/34584. [DOI] [PubMed] [Google Scholar]
- David O, Friston KJ. A neural-mass model for MEG/EEG: coupling and neuronal dynamics. Neuroimage. 2003 Nov;20(3):1743–1755. doi: 10.1016/j.neuroimage.2003.07.015. [DOI] [PubMed] [Google Scholar]
- David O, Cosmelli D, Friston KJ. Evaluation of different measures of functional connectivity using a neural-mass model. Neuroimage. 2004 Feb;21(2):659–673. doi: 10.1016/j.neuroimage.2003.10.006. [DOI] [PubMed] [Google Scholar]
- David O, Kiebel SJ, Harrison LM, Mattout J, Kilner JM, Friston KJ. Dynamic causal modeling of evoked responses in EEG and MEG. Neuroimage. 2006 May 1;30(4):1255–1272. doi: 10.1016/j.neuroimage.2005.10.045. [DOI] [PubMed] [Google Scholar]
- Dayan P, Hinton GE, Neal RM. The Helmholtz machine. Neural Comput. 1995;7:889–904. doi: 10.1162/neco.1995.7.5.889. [DOI] [PubMed] [Google Scholar]
- Decety J, Lamm C. The role of the right tempoparietal junction in social interaction: how low-level computational processes contribute to meta-cognition. Neuroscientist. 2007;13:580–593. doi: 10.1177/1073858407304654. [DOI] [PubMed] [Google Scholar]
- Deco G, Jirsa VK, Robinson PA, Breakspear M, Friston K. The dynamic brain: from spiking neurons to neural-masses and cortical fields. PLoS Comput Biol. 2008 Aug 29;4(8):e1000092. doi: 10.1371/journal.pcbi.1000092. [DOI] [PMC free article] [PubMed] [Google Scholar]
- Deco G, Jirsa V, McIntosh AR, Sporns O, Kötter R. Key role of coupling, delay, and noise in resting brain fluctuations. Proc Natl Acad Sci U S A. 2009 Jun 23;106(25):10302–10307. doi: 10.1073/pnas.0901831106. [DOI] [PMC free article] [PubMed] [Google Scholar]
- Eickhoff SB, Laird AR, Grefkes C, Wang LE, Zilles K, Fox PT. Coordinate-based activation likelihood estimation meta-analysis of neuroimaging data: a random-effects approach based on empirical estimates of spatial uncertainty. Hum Brain Mapp. 2009;30:2907–2926. doi: 10.1002/hbm.20718. [DOI] [PMC free article] [PubMed] [Google Scholar]
- Eickhoff S, Jbabdi S, Caspers S, Laird AR, Fox PT, Zilles K, Behrens T. Anatomical and functional connectivity of cytoarchitectonic areas within the human parietal operculum. J Neurosci. 2010;30:6409–6421. doi: 10.1523/JNEUROSCI.5664-09.2010. [DOI] [PMC free article] [PubMed] [Google Scholar]
- Eickhoff SB, Bzdok D, Laird AR, Roski C, Caspers S, Zilles K, Fox PT. Co-activation patterns distinguish cortical modules, their connectivity and functional differentiation. Neuroimage. 2011;57:938–949. doi: 10.1016/j.neuroimage.2011.05.021. [DOI] [PMC free article] [PubMed] [Google Scholar]
- Ellison-Wright I, Bullmore E. Meta-analysis of diffusion tensor imaging studies in schizophrenia. Schizophr Res. 2009;108:3–10. doi: 10.1016/j.schres.2008.11.021. [DOI] [PubMed] [Google Scholar]
- Ellison-Wright I, Glahn DC, Laird AR, Thelen SM, Bullmore ET. The anatomy of first-episode and chronic schizophrenia: an anatomical likelihood estimation meta-analysis. Am J Psychiatry. 2008;165:1015–1023. doi: 10.1176/appi.ajp.2008.07101562. [DOI] [PMC free article] [PubMed] [Google Scholar]
- Felleman DJ, Van Essen DC. Distributed hierarchical processing in the primate cerebral cortex. Cereb Cortex. 1991;1:1–47. doi: 10.1093/cercor/1.1.1-a. [DOI] [PubMed] [Google Scholar]
- Fitzgerald PB, Laird AR, Maller J, Daskalakis ZJ. A meta-analytic study of changes in brain activation in depression. Hum Brain Mapp. 2008;29:683–695. doi: 10.1002/hbm.20426. [DOI] [PMC free article] [PubMed] [Google Scholar]
- Fox PT. Broca’s area: motor encoding in somatic space. Behav Brain Sci. 1995a;18:344–345. [Google Scholar]
- Fox PT. Spatial normalization: origins, objectives, applications and alternatives. Hum Brain Mapp. 1995b;3:161–164. [Google Scholar]
- Fox PT, Lancaster JL. Mapping context and content: the BrainMap model. Nat Rev Neurosci. 2002;3:319–321. doi: 10.1038/nrn789. [DOI] [PubMed] [Google Scholar]
- Fox MD, Raichle ME. Spontaneous fluctuations in brain activity observed with functional magnetic resonance imaging. Nat Rev Neurosci. 2007 Sep;8(9):700–711. doi: 10.1038/nrn2201. [DOI] [PubMed] [Google Scholar]
- Fox PT, Perlmutter JS, Raichle ME. A stereotactic method of anatomical localization for positron emission tomography. J Comput Assist Tomogr. 1985;9:141–153. doi: 10.1097/00004728-198501000-00025. [DOI] [PubMed] [Google Scholar]
- Fox PT, Lancaster JL, Parsons LM, Xiong JH, Zamarripa F. Functional volumes modeling: theory and preliminary assessment. Hum Brain Mapp. 1997;5:306–311. doi: 10.1002/(SICI)1097-0193(1997)5:4<306::AID-HBM17>3.0.CO;2-B. [DOI] [PubMed] [Google Scholar]
- Fox PT, Parsons LM, Lancaster JL. Beyond the single study: function–location meta-analysis in cognitive neuroimaging. Curr Opin Neurobiol. 1998;8:178–187. doi: 10.1016/s0959-4388(98)80138-4. [DOI] [PubMed] [Google Scholar]
- Fox PT, Huang AY, Parsons LM, Xiong JH, Rainey L, Lancaster JL. Functional volumes modeling: scaling for group size in averaged images. Hum Brain Mapp. 1999;8:143–150. doi: 10.1002/(SICI)1097-0193(1999)8:2/3<143::AID-HBM12>3.0.CO;2-9. [DOI] [PMC free article] [PubMed] [Google Scholar]
- Fox PT, Huang A, Parsons LM, Xiong JH, Zamarippa F, Rainey L, Lancaster JL. Location-probability profiles for the mouth region of human primary sensory-motor cortex: meta-analysis and validation. Neuroimage. 2001;13:196–209. doi: 10.1006/nimg.2000.0659. [DOI] [PubMed] [Google Scholar]
- Fox MD, Snyder AZ, Vincent JL, Corbetta M, Van Essen DC, Raichle ME. The human brain is intrinsically organized into dynamic, anticorrelated functional networks. Proc Natl Acad Sci U S A. 2005a;102:9673–9678. doi: 10.1073/pnas.0504136102. [DOI] [PMC free article] [PubMed] [Google Scholar]
- Fox PT, Laird AR, Fox SP, Fox M, Uecker AM, Crank M, Koenig SF, Lancaster JL. BrainMap taxonomy of experimental design: description and evaluation. Hum Brain Mapp. 2005b;25:185–198. doi: 10.1002/hbm.20141. [DOI] [PMC free article] [PubMed] [Google Scholar]
- Freeman WJ. Characterization of state transitions in spatially distributed, chaotic, nonlinear, dynamical systems in cerebral cortex. Integr Physiol Behav Sci. 1994 Jul-Sep;29(3):294–306. doi: 10.1007/BF02691333. [DOI] [PubMed] [Google Scholar]
- Freeman WJ. A field-theoretic approach to understanding scale-free neocortical dynamics. Biol Cybern. 2005 Jun;92(6):350–359. doi: 10.1007/s00422-005-0563-1. [DOI] [PubMed] [Google Scholar]
- Freyer F, Aquino K, Robinson PA, Ritter P, Breakspear M. Non-Gaussian statistics in temporal fluctuations of spontaneous cortical activity. J Neurosci. 2009;29:8512–8524. doi: 10.1523/JNEUROSCI.0754-09.2009. [DOI] [PMC free article] [PubMed] [Google Scholar]
- Fries P. Neuronal gamma-band synchronization as a fundamental process in cortical computation. Annu Rev Neurosci. 2009;32:209–224. doi: 10.1146/annurev.neuro.051508.135603. [DOI] [PubMed] [Google Scholar]
- Friston K. Hierarchical models in the brain. PLoS Comput Biol. 2008;4(11):e1000211. doi: 10.1371/journal.pcbi.1000211. [DOI] [PMC free article] [PubMed] [Google Scholar]
- Friston KJ, Dolan RJ. Computational and dynamic models in neuroimaging. Neuroimage. 2010 Sep;52(3):752–765. doi: 10.1016/j.neuroimage.2009.12.068. [DOI] [PMC free article] [PubMed] [Google Scholar]
- Friston KJ, Harrison L, Penny W. Dynamic causal modelling. Neuroimage. 2003 Aug;19(4):1273–1302. doi: 10.1016/s1053-8119(03)00202-7. [DOI] [PubMed] [Google Scholar]
- Friston K, Kilner J, Harrison L. A free-energy principle for the brain. J Physiol Paris. 2006 Jul-Sep;100(1–3):70–87. doi: 10.1016/j.jphysparis.2006.10.001. [DOI] [PubMed] [Google Scholar]
- Friston KJ, Trujillo-Barreto N, Daunizeau J. DEM: a variational treatment of dynamic systems. Neuroimage. 2008 Jul 1;41(3):849–885. doi: 10.1016/j.neuroimage.2008.02.054. [DOI] [PubMed] [Google Scholar]
- Friston KJ, Li B, Daunizeau J, Stephan KE. Network discovery with DCM. Neuroimage. 2011 Jun 1;56(3):1202–1221. doi: 10.1016/j.neuroimage.2010.12.039. [DOI] [PMC free article] [PubMed] [Google Scholar]
- Frith CD, Friston KJ, Liddle PF, Frackowiak RS. Willed action and the pre-frontal cortex in man: a study with PET. Proc R Soc Lond B Biol Sci. 1991;244:241–246. doi: 10.1098/rspb.1991.0077. [DOI] [PubMed] [Google Scholar]
- Garrido MI, Kilner JM, Kiebel SJ, Stephan KE, Friston KJ. Neuroimage. 2007a Jul 1;36(3):571–580. doi: 10.1016/j.neuroimage.2007.03.014. [DOI] [PMC free article] [PubMed] [Google Scholar]
- Garrido MI, Kilner JM, Kiebel SJ, Friston KJ. Evoked brain responses are generated by feedback loops. Proc Natl Acad Sci U S A. 2007b Dec 26;104(52):20961–20966. doi: 10.1073/pnas.0706274105. [DOI] [PMC free article] [PubMed] [Google Scholar]
- Garrido MI, Friston KJ, Kiebel SJ, Stephan KE, Baldeweg T, Kilner JM. The functional anatomy of the MMN: a DCM study of the roving paradigm. Neuroimage. 2008 Aug 15;42(2):936–944. doi: 10.1016/j.neuroimage.2008.05.018. [DOI] [PMC free article] [PubMed] [Google Scholar]
- Garrido MI, Kilner JM, Kiebel SJ, Stephan KE, Baldeweg T, Friston KJ. Repetition suppression and plasticity in the human brain. Neuroimage. 2009 Oct 15;48(1):269–279. doi: 10.1016/j.neuroimage.2009.06.034. [DOI] [PMC free article] [PubMed] [Google Scholar]
- Glahn DC, Ragland JD, Abramoff A, Barrett J, Laird AR, Bearden CE, Velligan DI. Beyond hypofrontality: a quantitative meta-analysis of functional neuroimaging studies of working memory in schizophrenia. Hum Brain Mapp. 2005;25:60–69. doi: 10.1002/hbm.20138. [DOI] [PMC free article] [PubMed] [Google Scholar]
- Glahn DC, Laird AR, Ellison-Wright I, Thelen SM, Robinson JL, Lancaster JL, Bullmore E, Fox PT. Meta-analysis of gray matter anomalies in schizophrenia: application of anatomic likelihood estimation and network analysis. Biol Psychiatry. 2008;64:774–781. doi: 10.1016/j.biopsych.2008.03.031. [DOI] [PMC free article] [PubMed] [Google Scholar]
- Greicius MD, Supekar K, Menon V, Dougherty RF. Resting-state functional connectivity reflects structural connectivity in the default mode network. Cereb Cortex. 2009 Jan;19(1):72–78. doi: 10.1093/cercor/bhn059. [DOI] [PMC free article] [PubMed] [Google Scholar]
- Grol MY, Majdandzic J, Stephan KE, Verhagen L, Dijkerman HC, Bekkering H, Verstraten FA, Toni I. Parieto-frontal connectivity during visually guided grasping. J Neurosci. 2007;27:11877–11887. doi: 10.1523/JNEUROSCI.3923-07.2007. [DOI] [PMC free article] [PubMed] [Google Scholar]
- Grossberg S, Versace M. Spikes, synchrony, and attentive learning by laminar thalamocortical circuits. Brain Res. 2008 Jul 7;1218:278–312. doi: 10.1016/j.brainres.2008.04.024. [DOI] [PubMed] [Google Scholar]
- Heim S, Eickhoff SB, Ischebeck AK, Friederici AD, Stephan KE, Amunts K. Effective connectivity of the left BA 44, BA 45, and inferior temporal gyrus during lexical and phonological decisions identified with DCM. Hum Brain Mapp. 2009;30:392–402. doi: 10.1002/hbm.20512. [DOI] [PMC free article] [PubMed] [Google Scholar]
- Hesselmann G, Kell CA, Kleinschmidt A. Ongoing activity fluctuations in hMT+ bias the perception of coherent visual motion. J Neurosci. 2008;28(53):14481–14485. doi: 10.1523/JNEUROSCI.4398-08.2008. [DOI] [PMC free article] [PubMed] [Google Scholar]
- Hilgetal CC, O’Neill MA, Young MP. Hierarchical organization of macaque and cat cortical sensory systems explored with a novel network processor. Phil Trans R Soc Lond B. 2000;355:71–89. doi: 10.1098/rstb.2000.0550. [DOI] [PMC free article] [PubMed] [Google Scholar]
- Honey CJ, Kötter R, Breakspear M, Sporns O. Network structure of cerebral cortex shapes functional connectivity on multiple time scales. Proc Natl Acad Sci U S A. 2007;104(24):10240–10245. doi: 10.1073/pnas.0701519104. [DOI] [PMC free article] [PubMed] [Google Scholar]
- Honey CJ, Sporns O, Cammoun L, Gigandet X, Thiran JP, Meuli R, Hagmann P. Predicting human resting-state functional connectivity from structural connectivity. Proc Natl Acad Sci U S A. 2009;106:2035–2040. doi: 10.1073/pnas.0811168106. [DOI] [PMC free article] [PubMed] [Google Scholar]
- Jansen BH, Rit VG. Electroencephalogram and visual evoked potential generation in a mathematical model of coupled cortical columns. Biol Cybern. 1995;73:357–366. doi: 10.1007/BF00199471. [DOI] [PubMed] [Google Scholar]
- Jirsa VK, Haken H. Field theory of electromagnetic brain activity. Phys Rev Lett. 1996;77:960–963. doi: 10.1103/PhysRevLett.77.960. [DOI] [PubMed] [Google Scholar]
- Jirsa VK, Kelso JA. Spatiotemporal pattern formation in neural systems with heterogeneous connection topologies. Phys Rev E Stat Phys Plasmas Fluids Relat Interdiscip Topics. 2000 Dec;62(6 Pt B):8462–8465. doi: 10.1103/physreve.62.8462. [DOI] [PubMed] [Google Scholar]
- Jirsa VK, Friedrich R, Haken H, Kelso JA. A theoretical model of phase transitions in the human brain. Biol Cybern. 1994;71(1):27–35. doi: 10.1007/BF00198909. [DOI] [PubMed] [Google Scholar]
- Johansen-Berg H, Behrens TE, Robson MD, Drobnjak I, Rushworth MF, Brady JM, Smith SM, Higham DJ, Matthews PM. Changes in connectivity profiles define functional distinct regions in human medial prefrontal cortex. Proc Natl Acad Sci U S A. 2004;101:13334–13340. doi: 10.1073/pnas.0403743101. [DOI] [PMC free article] [PubMed] [Google Scholar]
- Karlsgodt KH, Kochunov P, Winkler AM, Laird AR, Almasy L, Duggirala R, Olvera RL, Fox PT, Blangero J, Glahn DC. A multimodal assessment of the genetic control over working memory. J Neurosci. 2010;30:8197–8202. doi: 10.1523/JNEUROSCI.0359-10.2010. [DOI] [PMC free article] [PubMed] [Google Scholar]
- Kiebel SJ, David O, Friston KJ. Dynamic causal modelling of evoked responses in EEG/MEG with lead field parameterization. Neuroimage. 2006 May 1;30(4):1273–1284. doi: 10.1016/j.neuroimage.2005.12.055. [DOI] [PubMed] [Google Scholar]
- Kiebel SJ, Garrido MI, Friston KJ. Dynamic causal modelling of evoked responses: the role of intrinsic connections. Neuroimage. 2007 Jun;36(2):332–345. doi: 10.1016/j.neuroimage.2007.02.046. [DOI] [PubMed] [Google Scholar]
- Kitzbichler MG, Smith ML, Christensen SR, Bullmore E. Broadband criticality of human brain network synchronization. PLoS Comput Biol. 2009 Mar;5(3):e1000314. doi: 10.1371/journal.pcbi.1000314. [DOI] [PMC free article] [PubMed] [Google Scholar]
- Koski L, Paus T. Functional connectivity of the anterior cingulate cortex with the human frontal lobe: a brain-mapping meta-analysis. Exp Brain Res. 2000;133:55–65. doi: 10.1007/s002210000400. [DOI] [PubMed] [Google Scholar]
- Kriener B, Tetzlaff T, Aertsen A, Diesmann M, Rotter S. Correlations and population dynamics in cortical networks. Neural Comput. 2008 Sep;20(9):2185–2226. doi: 10.1162/neco.2008.02-07-474. [DOI] [PubMed] [Google Scholar]
- Laird AR, Fox PM, Price CJ, Glahn DC, Uecker AM, Lancaster JL, Turkeltaub PE, Kochunov P, Fox PT. ALE meta-analysis: controlling the false discovery rate and performing statistical contrasts. Hum Brain Mapp. 2005a;25:155–164. doi: 10.1002/hbm.20136. [DOI] [PMC free article] [PubMed] [Google Scholar]
- Laird AR, Lancaster JL, Fox PT. BrainMap: the social evolution of a human brain mapping database. Neuroinformatics. 2005b;3:65–78. doi: 10.1385/ni:3:1:065. [DOI] [PubMed] [Google Scholar]
- Laird AR, McMillan KM, Lancaster JL, Kochunov P, Turkeltaub PE, Pardo JV, Fox PT. A comparison of label-based review and activation likelihood estimation in the Stroop task. Hum Brain Mapp. 2005c;25:6–21. doi: 10.1002/hbm.20129. [DOI] [PMC free article] [PubMed] [Google Scholar]
- Laird AR, Robbins JM, Li K, Price LR, Cykowski MD, Narayana S, Laird RW, Franklin C, Fox PT. Modeling motor connectivity using TMS/PET and structural equation modeling. Neuroimage. 2008;41:424–436. doi: 10.1016/j.neuroimage.2008.01.065. [DOI] [PMC free article] [PubMed] [Google Scholar]
- Laird AR, Eickhoff SB, Kurth F, Fox PM, Uecker AM, Turner JA, Robinson JL, Lancaster JL, Fox PT. ALE meta-analysis workflows via the Brain-Map database: progress towards a probabilistic functional brain atlas. Front Neuroinformatics. 2009a;3:23. doi: 10.3389/neuro.11.023.2009. [DOI] [PMC free article] [PubMed] [Google Scholar]
- Laird AR, Eickhoff SB, Li K, Robin DA, Glahn DC, Fox PT. Investigating the functional heterogeneity of the default mode network using coordinate-based meta-analytic modeling. J Neurosci. 2009b;29:14496–14505. doi: 10.1523/JNEUROSCI.4004-09.2009. [DOI] [PMC free article] [PubMed] [Google Scholar]
- Laird AR, Lancaster JL, Fox PT. Lost in localization? The focus is meta-analysis. Neuroimage. 2009c;48:18–20. doi: 10.1016/j.neuroimage.2009.06.047. [DOI] [PMC free article] [PubMed] [Google Scholar]
- Laird AR, Fox PM, Eickhoff SB, Turner JA, Ray KL, McKay DR, Glahn DC, Beckmann CF, Smith SM, Fox PT. Behavioral interpretations of intrinsic connectivity networks. J Cogn Neurosci. 2011;23(12):4022–4037. doi: 10.1162/jocn_a_00077. [DOI] [PMC free article] [PubMed] [Google Scholar]
- Lancaster JL, Laird AR, Fox M, Glahn DE, Fox PT. Automated analysis of meta-analysis networks. Hum Brain Mapp. 2005;25:174–184. doi: 10.1002/hbm.20135. [DOI] [PMC free article] [PubMed] [Google Scholar]
- Lee TS, Mumford D. Hierarchical Bayesian inference in the visual cortex. J Opt Soc Am A Opt Image Sci Vis. 2003;20:1434–1448. doi: 10.1364/josaa.20.001434. [DOI] [PubMed] [Google Scholar]
- Linkenkaer-Hansen K, Nikouline VV, Palva JM, Ilmoniemi RJ. Long-range temporal correlations and scaling behavior in human brain oscillations. J Neurosci. 2001;21:1370–1377. doi: 10.1523/JNEUROSCI.21-04-01370.2001. [DOI] [PMC free article] [PubMed] [Google Scholar]
- Lohmann G, Bohn S. Using replicator dynamics for analyzing fMRI data of the human brain. IEEE Trans Med Imaging. 2002;21(5):485–492. doi: 10.1109/TMI.2002.1009384. [DOI] [PubMed] [Google Scholar]
- Lopes da Silva FH, Hoeks A, Smits H, Zetterberg LH. Model of brain rhythmic activity. The alpha-rhythm of the thalamus. Kybernetik. 1974;15:27–37. doi: 10.1007/BF00270757. [DOI] [PubMed] [Google Scholar]
- Marreiros AC, Kiebel SJ, Daunizeau J, Harrison LM, Friston KJ. Population dynamics under the Laplace assumption. Neuroimage. 2009 Feb 1;44(3):701–714. doi: 10.1016/j.neuroimage.2008.10.008. [DOI] [PubMed] [Google Scholar]
- Menzies LAC, Chamberlain SR, Laird AR, Thelen SM, Sahakian BJ, Bullmore ET. Integrating evidence from neuroimaging and neuropsychological studies of obsessive compulsive disorder: the orbitofronto-striatal model revisited. Neurosci Biobehav Rev. 2008;32:525–549. doi: 10.1016/j.neubiorev.2007.09.005. [DOI] [PMC free article] [PubMed] [Google Scholar]
- Miller KJ, Sorensen LB, Ojemann JG, den Nijs M. ECoG observations of power-law scaling in the human cortexArxiv. 2007 preprint arXiv:0712.08462007. [Google Scholar]
- Minzenberg MJ, Laird AR, Thelen SM, Carter CS, Glahn DC. Meta-analysis of 41 functional neuroimaging studies of executive function in schizophrenia. Arch Gen Psychiatry. 2009;66:811–822. doi: 10.1001/archgenpsychiatry.2009.91. [DOI] [PMC free article] [PubMed] [Google Scholar]
- Moran RJ, Kiebel SJ, Stephan KE, Reilly RB, Daunizeau J, Friston KJ. A neural-mass model of spectral responses in electrophysiology. Neuroimage. 2007 Sep 1;37(3):706–720. doi: 10.1016/j.neuroimage.2007.05.032. [DOI] [PMC free article] [PubMed] [Google Scholar]
- Moran RJ, Stephan KE, Kiebel SJ, Rombach N, O’Connor WT, Murphy KJ, Reilly RB, Friston KJ. Bayesian estimation of synaptic physiology from the spectral responses of neural-masses. Neuroimage. 2008 Aug 1;42(1):272–284. doi: 10.1016/j.neuroimage.2008.01.025. [DOI] [PMC free article] [PubMed] [Google Scholar]
- Morris C, Lecar H. Voltage oscillations in the barnacle giant muscle fiber. Biophys J. 1981;35:193–213. doi: 10.1016/S0006-3495(81)84782-0. [DOI] [PMC free article] [PubMed] [Google Scholar]
- Müller-Linow M, Hilgetag CC, Hütt MT. Organization of excitable dynamics in hierarchical biological networks. PLoS Comput Biol. 2008;4(9):e1000190. doi: 10.1371/journal.pcbi.1000190. [DOI] [PMC free article] [PubMed] [Google Scholar]
- Mumford D. On the computational architecture of the neocortex. II The role of cortico-cortical loops. Biol Cybern. 1992;66:241–251. doi: 10.1007/BF00198477. [DOI] [PubMed] [Google Scholar]
- Murray SO, Kersten D, Olshausen BA, Schrater P, Woods DL. Shape perception reduces activity in human primary visual cortex. Proc Natl Acad Sci U S A. 2002 Nov 12;99(23):15164–15169. doi: 10.1073/pnas.192579399. [DOI] [PMC free article] [PubMed] [Google Scholar]
- Näätänen R. Mismatch negativity: clinical research and possible applications. Int J Psychophysiology. 2003;48:179–188. doi: 10.1016/s0167-8760(03)00053-9. [DOI] [PubMed] [Google Scholar]
- Neumann J, Lohmann G, Derrfuss J, Yves von Cramon D. The meta-analysis of functional imaging data using replicator dynamics. Hum Brain Mapp. 2005;25:165–173. doi: 10.1002/hbm.20133. [DOI] [PMC free article] [PubMed] [Google Scholar]
- Neumann J, Fox PT, Turner R, Lohmann G. Learning partially directed functional networks from meta-analysis imaging data. Neuroimage. 2010;49:1372–1384. doi: 10.1016/j.neuroimage.2009.09.056. [DOI] [PMC free article] [PubMed] [Google Scholar]
- Paus T. Location and function of the human frontal eye-field: a selective review. Neuropsychologia. 1996;34:475–483. doi: 10.1016/0028-3932(95)00134-4. [DOI] [PubMed] [Google Scholar]
- Pearson K. Report on certain enteric fever inoculation statistics. Br Med J. 1904;3:243–1246. [PMC free article] [PubMed] [Google Scholar]
- Penny WD, Stephan KE, Mechelli A, Friston KJ. Comparing dynamic causal models. Neuroimage. 2004 Jul;22(3):1157–1172. doi: 10.1016/j.neuroimage.2004.03.026. [DOI] [PubMed] [Google Scholar]
- Picard N, Strick PL. Motor areas of the medial wall: a review of their location and functional activation. Cereb Cortex. 1996;6:342–353. doi: 10.1093/cercor/6.3.342. [DOI] [PubMed] [Google Scholar]
- Poldrack RA. Can cognitive processes be inferred from neuroimaging data? Trends Cogn Sci. 2006;10:59–63. doi: 10.1016/j.tics.2005.12.004. [DOI] [PubMed] [Google Scholar]
- Posner MI, Petersen SE, Fox PT, Raichle ME. Localization of cognitive operations in the human brain. Science. 1998;240(4859):1627–1631. doi: 10.1126/science.3289116. [DOI] [PubMed] [Google Scholar]
- Postuma RB, Dagher A. Basal ganglia functional connectivity based on a meta-analysis of 126 positron emission tomography and functional magnetic resonance imaging publications. Cereb Cortex. 2006;16:1508–1521. doi: 10.1093/cercor/bhj088. [DOI] [PubMed] [Google Scholar]
- Price CJ, Friston KJ. Functional ontologies for cognition: the systematic definition of structure and function. Cogn Neuropsychol. 2005;22:262–275. doi: 10.1080/02643290442000095. [DOI] [PubMed] [Google Scholar]
- Price LR, Laird AR, Fox PT. Modeling dynamic functional neuroimaging data using structural equation modeling. Struct Eq Model. 2009;16:147–162. doi: 10.1080/10705510802561402. [DOI] [PMC free article] [PubMed] [Google Scholar]
- Ragland JD, Laird AR, Ranganath C, Blumenfeld RS, Gonzales SM, Glahn DC. Prefrontal activation deficits during episodic memory in schizophrenia. Am J Psychiatry. 2009;166:863–874. doi: 10.1176/appi.ajp.2009.08091307. [DOI] [PMC free article] [PubMed] [Google Scholar]
- Raichle ME, MacLeod AM, Snyder AZ, Powers WJ, Gusnard DA, Shulman GL. A default mode of brain function. Proc Natl Acad Sci U S A. 2001 Jan 16;98(2):676–682. doi: 10.1073/pnas.98.2.676. [DOI] [PMC free article] [PubMed] [Google Scholar]
- Rao RP, Ballard DH. Predictive coding in the visual cortex: a functional interpretation of some extra-classical receptive field effects. Nat Neurosci. 1998;2:79–87. doi: 10.1038/4580. [DOI] [PubMed] [Google Scholar]
- Reid AT, Krummack A, Wanke E, Kotter R. Optimization of cortical hierarchies with continuous scales and ranges. Neuroimage. 2009;47(2):611–617. doi: 10.1016/j.neuroimage.2009.04.061. [DOI] [PubMed] [Google Scholar]
- Robinson PA, Rennie CJ, Wright JJ. Propagation and stability of waves of electrical activity in the cerebral cortex. Phys Rev E Stat Nonlin Soft Matter Phys. 1997;56:826–840. [Google Scholar]
- Robinson JL, Laird AR, Glahn DC, Lovallo WR, Fox PT. Meta-analytic connectivity modelling: delineating the functional connectivity of the human amygdala. Hum Brain Mapp. 2010;31:173–184. doi: 10.1002/hbm.20854. [DOI] [PMC free article] [PubMed] [Google Scholar]
- Roopun AK, Kramer MA, Carracedo LM, Kaiser M, Davies CH, Traub RD, Kopell NJ, Whittington MA. Period concatenation underlies interactions between gamma and beta rhythms in neocortex. Front Cell Neurosci. 2008;2:1. doi: 10.3389/neuro.03.001.2008. [DOI] [PMC free article] [PubMed] [Google Scholar]
- Rubinov M, Sporns O, van Leeuwen C, Breakspear M. Symbiotic relationship between brain structure and dynamics. BMC Neurosci. 2009 Jun 2;10:55. doi: 10.1186/1471-2202-10-55. [DOI] [PMC free article] [PubMed] [Google Scholar]
- Scherg M, Von Cramon D. Two bilateral sources of the late AEP as identified by a spatio-temporal dipole model. Electroencephalogr Clin Neurophysiol. 1985 Jan;62(1):32–44. doi: 10.1016/0168-5597(85)90033-4. [DOI] [PubMed] [Google Scholar]
- Schroeter ML, Raczka K, Neumann J, Yves von Cramon D. Towards a nosology for frontotemporal lobar degenerations — a meta-analysis involving 267 subjects. Neuroimage. 2007;36:497–510. doi: 10.1016/j.neuroimage.2007.03.024. [DOI] [PubMed] [Google Scholar]
- Shulman GL, Fiez JA, Corbetta M, Buckner RL, Miezin FM, Raichle ME, Petersen SE. Common blood flow changes across visual tasks: II. Decreases in cerebral cortex. J Cogn Neurosci. 1997;9:648–663. doi: 10.1162/jocn.1997.9.5.648. [DOI] [PubMed] [Google Scholar]
- Smith AP, Stephan KE, Rugg MD, Dolan RJ. Task and content modulate amygdala–hippocampal connectivity in emotional retrieval. Neuron. 2006;49:631–638. doi: 10.1016/j.neuron.2005.12.025. [DOI] [PubMed] [Google Scholar]
- Smith SM, Fox PT, Miller KL, Glahn DC, Fox PM, Mackay CE, Filippini N, Watkins KE, Toro R, Laird AR, Beckmann CF. Correspondence of the brain’s functional architecture during activation and rest. Proc Natl Acad Sci U S A. 2009;106:13040–13045. doi: 10.1073/pnas.0905267106. [DOI] [PMC free article] [PubMed] [Google Scholar]
- Soros P, Inamoto Y, Martin RE. Functional brain imaging of swallowing: an activation likelihood estimation meta-analysis. Hum Brain Mapp. 2009;30:2426–2439. doi: 10.1002/hbm.20680. [DOI] [PMC free article] [PubMed] [Google Scholar]
- Spreng RN, Mar RA, Kim AS. The common neural basis of autobiographical memory, prospection, navigation, theory of mind and the default mode: a quantitative meta-analysis. J Cogn Neurosci. 2009;21:489–510. doi: 10.1162/jocn.2008.21029. [DOI] [PubMed] [Google Scholar]
- Stam CJ, de Bruin EA. Scale-free dynamics of global functional connectivity in the human brain. Hum Brain Mapp. 2004;22:97–109. doi: 10.1002/hbm.20016. [DOI] [PMC free article] [PubMed] [Google Scholar]
- Stephan KE, Hilgetag CC, Burns GAPC, O’Neill MA, Young MP, Kotter R. Computational analysis of functional connectivity between areas of primate cerebral cortex. Philos Trans R Soc Lond B Biol Sci. 2000;355:111. doi: 10.1098/rstb.2000.0552. [DOI] [PMC free article] [PubMed] [Google Scholar]
- Stephan KE, Weiskopf N, Drysdale PM, Robinson PA, Friston KJ. Comparing hemodynamic models with DCM. Neuroimage. 2007 Nov 15;38(3):387–401. doi: 10.1016/j.neuroimage.2007.07.040. [DOI] [PMC free article] [PubMed] [Google Scholar]
- Stephan KE, Kasper L, Harrison LM, Daunizeau J, den Ouden HE, Breakspear M, Friston KJ. Nonlinear dynamic causal models for fMRI. Neuroimage. 2008 Aug 15;42(2):649–662. doi: 10.1016/j.neuroimage.2008.04.262. [DOI] [PMC free article] [PubMed] [Google Scholar]
- Stephan KI, Tittgemeyer M, Knosche TR, Moran RJ, Friston KJ. Tractography-based priors for dynamic causal models. Neuroimage. 2009;47:1628–1638. doi: 10.1016/j.neuroimage.2009.05.096. [DOI] [PMC free article] [PubMed] [Google Scholar]
- Summerfield C, Koechlin E. A neural representation of prior information during perceptual inference. Neuron. 2008;59:336–347. doi: 10.1016/j.neuron.2008.05.021. [DOI] [PubMed] [Google Scholar]
- Tognoli E, Kelso JA. Brain coordination dynamics: true and false faces of phase synchrony and metastability. Prog Neurobiol. 2009 Jan 12;87(1):31–40. doi: 10.1016/j.pneurobio.2008.09.014. [DOI] [PMC free article] [PubMed] [Google Scholar]
- Toro R, Fox PT, Paus T. Functional coactivation map of the human brain. Cereb Cortex. 2008;18:2553–2559. doi: 10.1093/cercor/bhn014. [DOI] [PMC free article] [PubMed] [Google Scholar]
- Touboul J, Destexhe A. Can power-law scaling and neuronal avalanches arise from stochastic dynamics? 2009 doi: 10.1371/journal.pone.0008982. arXiv:0910.0805v12009. [DOI] [PMC free article] [PubMed] [Google Scholar]
- Tschacher W, Haken H. Intentionality in non-equilibrium systems? The functional aspects of self-organised pattern formation. New Ideas Psychol. 2007;25:1–15. [Google Scholar]
- Tsuda I. Toward an interpretation of dynamic neural activity in terms of chaotic dynamical systems. Behav Brain Sci. 2001 Oct;24(5):793–810. doi: 10.1017/s0140525x01000097. [DOI] [PubMed] [Google Scholar]
- Tulving E, Kapur S, Craik FIM, Moscovitch M, Huole S. Hemispheric encoding/retrieval asymmetry in episodic memory: positron emission tomography findings. Proc Natl Acad Sci U S A. 1994;91:2016–2020. doi: 10.1073/pnas.91.6.2016. [DOI] [PMC free article] [PubMed] [Google Scholar]
- Turkeltaub PE, Eden GF, Jones KM, Zeffiro TA. Meta-analysis of the functional neuroanatomy of single-word reading: method and validation. Neuroimage. 2002;6:765–780. doi: 10.1006/nimg.2002.1131. [DOI] [PubMed] [Google Scholar]
- Turkeltaub PE, Eickhoff SB, Laird AR, Fox M, Wiener M, Fox PT. Minimizing within-experiment and within-group effects in activation likelihood estimation meta-analyses. Hum Brain Mapp. 2012;33(1):1–13. doi: 10.1002/hbm.21186. [DOI] [PMC free article] [PubMed] [Google Scholar]
- Wager TD, Phan KL, Liberzon I, Taylor SF. Valence, gender, and lateralization of functional brain anatomy in emotion: a meta-analysis of findings in neuroimaging. Neuroimage. 2003;19:513–531. doi: 10.1016/s1053-8119(03)00078-8. [DOI] [PubMed] [Google Scholar]
- Wang XJ. Physiological and computational principles of cortical rhythms in cognition. Physiol Rev. 2010 Jul;90(3):1195–1268. doi: 10.1152/physrev.00035.2008. [DOI] [PMC free article] [PubMed] [Google Scholar]
- Zhang Y, Wang X, Bressler SL, Chen Y, Ding M. Prestimulus cortical activity is correlated with speed of visuomotor processing. J Cogn Neurosci. 2008 Oct;20(10):1915–1925. doi: 10.1162/jocn.2008.20132. [DOI] [PubMed] [Google Scholar]