

Abstract
The ventral stream of the human extrastriate visual cortex shows a considerable functional heterogeneity from early visual processing (posterior) to higher, domain‐specific processing (anterior). The fusiform gyrus hosts several of those “high‐level” functional areas. We recently found a subdivision of the posterior fusiform gyrus on the microstructural level, that is, two distinct cytoarchitectonic areas, FG1 and FG2 (Caspers et al., Brain Structure & Function, 2013). To gain a first insight in the function of these two areas, here we studied their behavioral involvement and coactivation patterns by means of meta‐analytic connectivity modeling based on the BrainMap database (http://www.brainmap.org), using probabilistic maps of these areas as seed regions. The coactivation patterns of the areas support the concept of a common involvement in a core network subserving different cognitive tasks, that is, object recognition, visual language perception, or visual attention. In addition, the analysis supports the previous cytoarchitectonic parcellation, indicating that FG1 appears as a transitional area between early and higher visual cortex and FG2 as a higher‐order one. The latter area is furthermore lateralized, as it shows strong relations to the visual language processing system in the left hemisphere, while its right side is stronger associated with face selective regions. These findings indicate that functional lateralization of area FG2 relies on a different pattern of connectivity rather than side‐specific cytoarchitectonic features. Hum Brain Mapp 35:2754–2767, 2014. © 2013 Wiley Periodicals, Inc.
Keywords: extrastriate visual cortex, fusiform face area, meta‐analytic connectivity modeling, meta‐analysis, visual word form area
INTRODUCTION
The visual cortex is one of the most highly differentiated parts of the human brain covering about 27% of the cortical surface [van Essen, 2004]. Within the primate visual system, the ventral stream [Mishkin et al., 1983; Ungerleider and Haxby, 1994] is particularly involved in the recognition and identification of objects. In this context, the cortex of the fusiform gyrus is a mosaic of specialized areas with an antero‐posterior gradient that includes area hOC4v/hV4 for early visual processing [for cytoarchitecture see Rottschy et al., 2007; Wilms et al., 2010] and more anteriorly higher‐order areas including the fusiform face area (FFA) [Kanwisher et al., 1997], the fusiform body area [Peelen and Downing, 2005] or the visual word‐form area (VWFA) [Cohen et al., 2000]. We recently showed that a similar heterogeneity of the posterior fusiform gyrus is also present at a microstructural level. Observer‐independent histological analysis identified two cytoarchitectonically distinct areas on the posterior fusiform cortex antero‐lateral to hOC4v/hV4, which were termed FG1 and FG2 [Caspers et al., 2013]. The probabilistic cytoarchitectonic maps of this study provide a topographical basis to investigate further structural‐functional relationships of both areas in the ventral visual cortex. Here, we analyzed the behavioral characteristics and patterns of coactivity of these two histologically defined areas.
From macaque monkeys, it is known that areas of the visual cortex show highly differentiated connectivity patterns and the various functions are facilitated through an intense interaction of those areas with other brain regions [Felleman and van Essen, 1991]. A particularly powerful method investigating those interactions and functional relationships is the analysis of coactivation patterns across a large number of neuroimaging experiments, preferably from a broad range of functional domains. This enables the delineation of the brain networks consistently interacting with a particular seed region under various task constraints.
We here applied meta‐analytic connectivity modeling (MACM) [Jakobs et al., 2012; Robinson et al., 2010], in which patterns of significantly coactivated brain regions are assessed by coordinate‐based meta‐analysis of experiments that activate a specific region in combination with data‐base driven tools for functional characterization to establish the functional coactivity profile and response characteristics for the cytoarchitectonic areas FG1 and FG2 on the fusiform gyrus. Moreover, we assessed commonalities and differences between these adjoining cortical regions in their coactivations as well as hemispheric lateralization. In combination, these approaches facilitate a comprehensive functional characterization of FG1 and FG2, and give the opportunity to infer relationship between cytoarchitecture and functional specialization.
MATERIAL AND METHODS
Definition of Regions of Interest (ROI)
The probability maps obtained from the cytoarchitectonic delineation of FG1 and FG2 provided the anatomical seed regions (Fig. 1). These maps resulted from the observer‐independent cytoarchitectonic mapping on the posterior fusiform gyrus in 10 postmortem brains (five male, five female; no neurologic or psychiatric diseases; mean age: 67) [Caspers et al., 2013]. FG1 was found on the medial bank of the posterior fusiform gyrus and within the collateral sulcus adjoining early visual area hOc4v/hV4 [Rottschy et al., 2007; Wilms et al., 2010]. FG2 was located immediately adjacent to FG1 on the lateral bank of the posterior fusiform gyrus extending into the lateral occipitotemporal sulcus. To represent these microscopically defined regions while accommodating their interindividual variability, we used the maximum probability map representations (MPM) [Eickhoff et al., 2005) of FG1 and FG2 as seed regions. The use of the MPM has been shown to be the most adequate method to estimate probabilistically the location of anatomical regions in stereotaxic space [Eickhoff et al., 2006]. It provides a unique and nonoverlapping parcellation of the cerebral cortex, which assigns each voxel of the standard brain to the cortical area it most probably belongs to, based on the observer‐independent delineation in 10 postmortem brains. The asymmetric surface of the seeds (see Fig. 1) thus resembles the natural asymmetry of FG1 and FG2 with respect to their microanatomical location and their intersubject variability. To study possible lateralization effects, analyses of the left and right hemispheric seeds of both areas FG1 and FG2 were performed separately, resulting in four seed regions in total. Additionally, the left and right seeds of each area were combined into a single seed per area for an overall coactivity analysis of FG1 and FG2.
Figure 1.
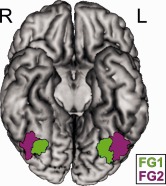
Maximum Probability Map (MPM) of cytoarchitectonic areas FG1 and FG2; basal view of the MNI single subject brain without cerebellum.
Assessment of Experiments Involved with the Seed Regions
The BrainMap database (http://www.brainmap.org [Laird et al., 2005, 2009a, 2011a]) was employed for the retrieval of relevant neuroimaging experiments. At the time of assessment, the database contained coordinates of reported activation foci and associated meta‐data of almost 10,000 neuroimaging experiments. For our analysis, only studies of healthy subjects reporting activation in standard stereotaxic space were considered, while all experiments that investigated age, gender, handedness, or training effects or involved a clinical population were excluded. As the first step of the analysis, we identified (separately for each seed) all experiments that featured at least one focus of activation within the respective seed (MNI space). To facilitate such filtering, coordinates from Talairach space were converted into MNI coordinates by using Lancaster transformation [Lancaster et al., 2007]. Then, all experiments activating the currently considered seed were identified. The retrieval was solely based on reported activation coordinates, not on any anatomical or functional label. For FG1, 130 experiments were identified for the left hemispheric seed, 118 experiments for the right sided seed, and 221 experiments for the combined seed of both hemispheres. For FG2, the left hemispheric seed comprised 246 experiments, the right seed 160 experiments, and the bilateral seed 352 experiments. The number of experiments of the combined seeds does not match the sum of the counts for both hemispheres, when there are experiments, which report activations within the left and the right seed region in one experiment. Moreover, please note that this number of studies directly reflects the raw data of the location‐based search in the BrainMap database, without additional manipulations.
Profiling of Behavioral Domains and Paradigm Classes
The stored meta‐data “Behavioral Domains” and “Paradigm Classes” of the experiments were retrieved to establish functional profiles of the investigated regions. These meta‐data are classifications of the experiments in the database and were established by the BrainMap project [Laird et al., 2005]. The behavioral Domains classify the mental operations isolated by the experiments into currently six main categories (cognition, action, perception, emotion, interoception, and pharmacology) and their subcategories [Fox et al., 2005b]. The Paradigm Classes represent the experimental task used in the respective experiment. To obtain a functional characterization of FG1 and FG2, the frequency of each observed behavioral Domain and Paradigm Class in the activated experiments was determined relative to their whole database distribution [Eickhoff et al., 2010]. Thus, for each behavioral Domain and Paradigm Class category, the number of activation foci associated with this meta‐data category was assessed within a seed region and compared against the number of foci, which would be expected for this category in the seed. This expected number of foci was determined by multiplying the number of foci for the current category in the entire database with the proportion of foci in BrainMap located within the respective seed region. The significantly over‐represented behavioral Domains and Paradigm Classes of each ROI were determined by binomial‐tests at P < 0.05.
Meta‐Analytic Connectivity Modeling
Coactivation patterns of FG1 and FG2 were evaluated using MACM, which was introduced first on a functional connectivity investigation of the amygdala [Robinson et al., 2010]. The key idea behind MACM is to assess, which brain regions are coactivated above chance with a particular seed region in functional neuroimaging experiments [Eickhoff et al., 2010; Laird et al., 2009b]. MACM entails to first identify all experiments in a database that activate a particular brain region as described above and then test for convergence across (all) foci reported in these experiments. Obviously, as experiments were selected by activation in the seed, highest convergence will be observed in the seed region. Significant convergence of the reported foci in other brain regions, however, indicates consistent coactivation with the seed.
The whole brain peak coordinates of the identified experiments were downloaded from BrainMap database for each seed region. Coordinates were analyzed with the modified activation likelihood estimation (ALE) algorithm [Eickhoff et al., 2009, 2012] to detect areas of convergence. This approach models each focus as a Gaussian distribution reflecting empirical estimates of the uncertainty of different spatial normalization techniques and intersubject variability as a function of the number of subjects. Modeled activation maps are calculated for each experiment by combining the Gaussian distributions of the reported foci [Turkeltaub et al., 2012]. That is, taking the union across these yielded voxel‐wise ALE scores that describe the convergence of results at each particular location of the brain. To distinguish “true” convergence between studies from random convergence, that is, noise, in the proposed revision of the ALE algorithm [Eickhoff et al., 2012], ALE scores are compared with an empirical null‐distribution reflecting a random spatial association between experiments [see Eickhoff et al., 2012; Turkeltaub et al., 2012]. The P‐value of an observed ALE is then given by the proportion of this null‐distribution (precisely, its cumulative density function) corresponding equal or higher ALE values. The ALE maps reflecting the convergence of coactivations with any particular seed region were subsequently thresholded at P < 0.05 cluster‐level corrected (cluster‐forming threshold: P < 0.001 at voxel‐level) and converted into Z‐scores for display.
Combination of Single Maps
For further investigation of commonalities and distinctions between the individual ALE maps, conjunction and difference analyses were performed. For conjunction analysis, the minimum statistic [Nichols et al., 2005] was used, yielding voxels that showed significant ALE values in both coactivation maps. The result corresponds to the intersection of the (cluster‐level corrected) ALE coactivation maps [Caspers et al., 2010]. Difference maps were established by calculating the voxel‐wise differences of the Z‐scores obtained from the ALE maps of the two MACM analyses. The difference maps were then tested against an ALE difference map assuming the null‐distribution, which was generated from a random bipartition of the pooled experiments underlying either of the two inspected maps, at P < 0.001 [Eickhoff et al., 2011; Rottschy et al., 2012]. To avoid obtaining significant coactivation in voxels of the difference map that do not show significant coactivation on the underlying ALE map, the resulting maps were masked with the main effect of the respective ALE map. Furthermore, only regions with at least 20 cohesive voxels were considered in the resulting difference maps.
In this analysis, we calculated conjunction and difference maps between the bilateral coactivation maps of FG1 and FG2, which indicate the regions with which both seed regions are commonly coactive and those that show stronger coactivation with FG1 than FG2 and vice versa. Left versus right differences were computed for each area (FG1 and FG2) using the ALE maps of the single sided seeds.
Anatomical allocation of the coactivated regions was performed using the SPM Anatomy Toolbox (http://www.fz-juelich.de/inm/inm-1/spm_anatomy_toolbox, [Eickhoff et al., 2007]).
RESULTS
Behavioral Domains and Paradigm Classes Analysis
The results of the behavioral Domain and Paradigm Class analysis of the four cytoarchitectonically defined seed regions (left and right FG1; left and right FG2) are illustrated in Figure 2. As expected for areas within the ventral visual cortex, the analysis revealed that all four seeds were involved in perception of visual stimuli including passive viewing tasks. Furthermore, they were all associated with language functions, albeit to a different degree.
Figure 2.
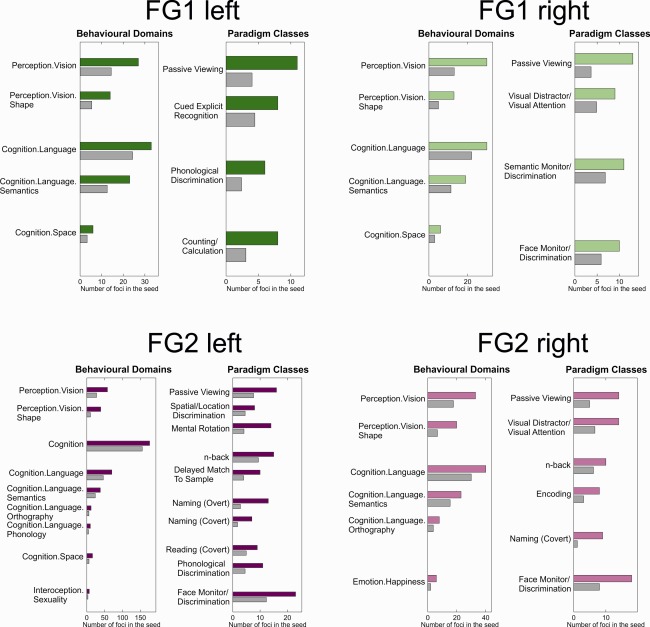
Behavioral Domains and Paradigm Classes. The colored bars indicate the number of foci that were actually observed for the respective behavioral domain/paradigm class in experiments activating the respective seed region. Gray bars indicate the number of foci that would be expected by chance given the frequency of foci for the respective behavioral domain/paradigm class within the database.
Moreover, this analysis revealed a largely symmetrical involvement of FG1 in a broad range of behavioral Domains and Paradigm Classes involving the processing of visual stimuli, for example, spatial cognition, cued explicit recognition tasks, or visual attention tasks. Thus, the functional characteristics of FG1 point to a rather broad and hence unspecific involvement in visual processing. Notably, however, only right FG1 was involved in face perception, whereas its left counterpart was more often engaged in calculation and phonological discrimination tasks.
The behavioral Domains and Paradigm Classes for FG2 on the other hand showed a considerably higher specificity for a narrower range of categories. Moreover, when compared with FG1, area FG2 featured a more pronounced involvement in language functions. The performed functional characterization also pointed to a significant association of FG2 with face discrimination tasks, overt and covert naming, and an engagement by working memory paradigms (n‐back, encoding, and delayed match to sample). In contrast to that of FG1, the functional response profile of FG2 showed a distinctive asymmetry. The focus of language involvement clearly lay on the left hemisphere of FG2, which showed above‐chance activation for reading and phonological discrimination tasks. The involvement in face perception was lateralized to the right side, which showed a higher relative ratio than the left side, an association which is also well reflected in the fact that involvement in affective processing (happiness) was solely found in right FG2.
MACM: Conjunction Analysis of Bilateral FG1 and FG2
The conjunction of the ALE coactivation maps of bilateral FG1 and FG2 revealed an extensive network of regions that showed significant coactivation with both FG1 and FG2 (Fig. 3). This network included the ventral and dorsal visual cortex surrounding the seeds. A comparison with cytoarchitectonic maps revealed that the ventral part of this activation overlapped with areas hOc1 (V1), hOc2 (V2) [Amunts et al., 2000], hOC3v (V3v), and hOC4v (hV4) [Rottschy et al., 2007] as well as area hOc5 (V5/MT+) [Malikovic et al., 2007] of the lateral occipital cortex. In the dorsal parts, coactivation extended up to the intraparietal cortex, that is, areas hIP1 [Choi et al., 2006] and hIP3 [Scheperjans et al., 2008]. In addition, significant coactivation was found in the region of inferior frontal gyri, pars triangularis, and pars opercularis, and the adjoining inferior frontal sulcus and middle frontal gyrus in both hemispheres. This cluster partially included cytoarchitectonic areas 44 and 45 [Amunts et al., 1999]. Coactivation with premotor regions was found on the dorsolateral precentral gyrus bilaterally (area 6) [Geyer, 2004], and in the region of the supplementary motor area. Additional coactivations were found bilaterally with the anterior insular cortex. There were also subcortical coactivations in the left and right amygdala (basolateral and superficial nuclei) [Amunts et al., 2005], in the left thalamus and in the left putamen.
Figure 3.
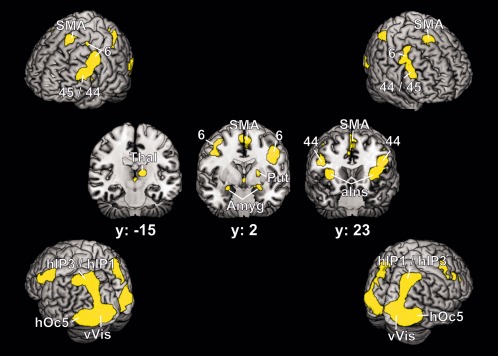
Conjunction analysis of the coactivation maps of FG1 and FG2, represented on the MNI single subject brain. Four different viewing angles and three coronal sections are shown. The regions marked in yellow indicate regions that are significantly coactivated with both FG1 and FG2. Areas: 6 [Geyer, 2004]; 44, 45 [Amunts et al., 1999]; hIP1 [Choi et al., 2006]; hIP3 [Scheperjans et al., 2008]; hOc5 [Malikovic et al., 2007]. SMA = supplementary motor area, Thal = thalamus, Put = putamen, Amyg = amygdala, aIns = anterior insula, vVis = ventral visual cortex including areas hOc1, hOc2 [Amunts et al., 2000], hOc3v, hOc4v [Rottschy et al., 2007].
MACM: Difference Analysis of Bilateral FG1 versus FG2
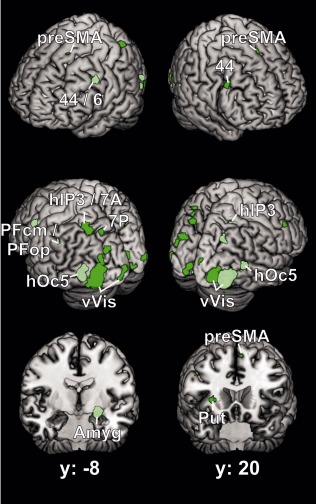
A difference analysis between the ALE coactivation maps of bilateral FG1 and FG2 (Fig. 4) was performed to assess which regions were more consistently coactivated with one of these histological areas. It revealed significantly stronger coactivation for FG1 than FG2 mainly within the bilateral visual cortex and the intraparietal sulcus. These regions included occipital areas hOc1, hOc2, hOC3v, and hOC4v as well as parietal areas hIP3 and 7PC [Scheperjans et al., 2008]. The only extra‐visual region showing stronger coactivation to FG1 than FG2 was the left mid‐insular cortex.
Figure 4.
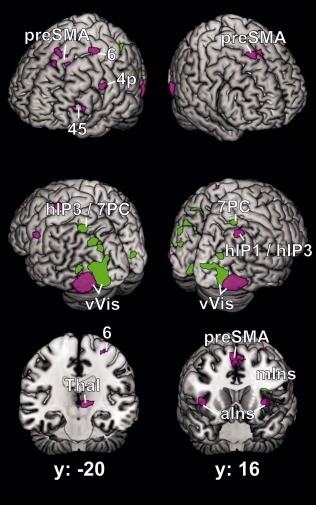
Difference between the coactivation maps of the left and right FG1 and FG2, shown on the MNI single subject brain from four different viewing angles and on two coronal sections. Green regions indicate sites, which are significantly more likely to coactivate with FG1 than FG2, regions in violet represent FG2 > FG1. Areas: 4p [Geyer et al., 1996]; 6 [Geyer, 2004]; 45 [Amunts et al., 1999]; hIP1 [Choi et al., 2006]; hIP3, 7PC [Scheperjans et al., 2008]. preSMA = pre‐supplementary motor area, Thal = thalamus, aIns = anterior insula, mIns = mid‐insular cortex, vVis = ventral visual cortex including areas hOc1, hOc2 [Amunts et al., 2000], hOc3v, hOc4v [Rottschy et al., 2007].
In contrast, FG2 showed stronger coactivation with multiple predominantly extra‐visual regions, in particular the right intraparietal sulcus (hIP1 and hIP3), bilateral anterior insula, the presupplementary motor area, the left precentral gyrus in the region of area 4p [Geyer et al., 1996] and the left dorsolateral premotor cortex (area 6). Furthermore, FG2 was stronger coactivated than FG1 with the pars triangularis of the left inferior frontal gyrus, partially overlapping area 45 [Amunts et al., 1999], and with the left thalamus.
MACM: Lateralization
Lateralization in coactivation was examined for each cytoarchitectonic area by contrasting the coactivation maps of its respective left‐ and right‐hemispheric representation against each other. For FG1 the analysis revealed a quite symmetrical picture (Fig. 5). Both, left and right FG1 showed stronger coactivation than the respective other side with the ipsilateral ventral and dorsal visual cortex surrounding the seed as well as with the ipsilateral parietal cortex in cytoarchitectonic areas hIP1, hIP3, 7A, and 7P [Scheperjans et al., 2008]. Furthermore, some regions of the early ventral visual cortex were more strongly coactivated with the contralateral than with the ipsilateral FG1, in particular the earlier visual areas hOc1, hOc2, and hOc3v. Beside these symmetrical differences, the left sided FG1 seed was more strongly coactive than its right homologue with the left presupplementary motor area, right putamen, and pars opercularis of right inferior frontal gyrus, partially overlapping area 44. In contrast, right FG1 showed stronger coactivation with hOc5 of both sides, the superficial and basolateral nuclei of the left amygdala, the left lateral precentral gyrus at the transition between areas 44 and 6 and with the inferior parietal cortex including cytoarchitectonic areas PFcm and PFop [Caspers et al., 2008].
Figure 5.
Difference between the left and the right coactivation maps of FG1, represented on the MNI single subject brain from four different viewing angles and on two coronal sections. Dark‐green regions indicate the left > right contrast, light‐green colored regions the right > left contrast. Areas: 6 [Geyer, 2004]; 44 [Amunts et al., 1999]; hIP3, 7A, 7P [Scheperjans et al., 2008]; PFcm, PFop [Caspers et al., 2008]; hOc5 [Malikovic et al., 2007]. preSMA = pre‐supplementary motor area, Amyg = amygdala, Put = putamen, vVis = ventral visual cortex including areas hOc1, hOc2 [Amunts et al., 2000], hOc3v, hOc4v [Rottschy et al., 2007].
The comparison between the coactivation patterns of the left and right FG2 revealed a more asymmetric picture (Fig. 6). Except for local differences in the visual cortex, the left FG2 exhibited stronger coactivation than the right side with the intraparietal areas hIP1 and hIP3, the inferior frontal cortex (area 44) and the dorsolateral motor and premotor cortex of both sides. Furthermore, regions of the left middle temporal gyrus and the left thalamus were more strongly coactive with left than right FG2. Right area FG2, however, was more strongly coactivated with the primary and secondary visual areas hOc1 and hOc2 and bilaterally to Lobule VI of the cerebellum [Diedrichsen et al., 2009], as well as with the superficial nuclei of the left amygdala and a small region on the left inferior frontal gyrus. Moreover, the right FG2 showed additional coactivation—anterior and separate from the seed region FG2—in the right fusiform gyrus.
Figure 6.
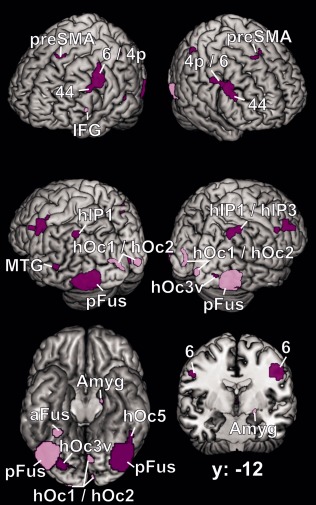
Difference between the left and the right coactivation maps of FG2, represented on the MNI single subject brain from four different viewing angles, on a ventral view without the cerebellum and on a coronal section. Dark‐violet regions indicate the left > right contrast, light‐violet regions the right > left contrast. Areas: 4p [Geyer et al., 1996]; 6 [Geyer, 2004]; 44 [Amunts et al., 1999]; hIP1 [Choi et al., 2006]; hIP3 [Scheperjans et al., 2008]; hOc1, hOc2 [Amunts et al., 2000]; hOc3v [Rottschy et al., 2007]. preSMA = pre‐supplementary motor area, IFG = inferior frontal gyrus, MTG = middle temporal gyrus, Amyg = amygdala, pFus = posterior fusiform gyrus, aFus = anterior fusiform gyrus.
DISCUSSION
In this study, we investigated the functional characteristics and coactivation patterns of cytoarchitectonically defined areas FG1 and FG2 using a meta‐analytic approach. This approach enables a combined analysis of structural, functional, and coactivation data in this part of the human ventral visual cortex. For the analysis of coactivation patterns, MACM was applied on large‐scale neuroimaging data provided by the BrainMap database. MACM bases on the probability of co‐occurrence of neuronal activity between regions over paradigms and studies indicating that activity in one region is more likely to be followed by activity in the other region as well. These coactivations can hence be regarded as the meta‐analytic correlate to functional connectivity [Wager et al., 2009]. In this context, it is important to point back to the definition of functional connectivity as the “temporal correlations between spatially remote neurophysiological events” [Friston, 1994]. Following this notion, significant coactivations identified in MACM indeed indicate functional connectivity. In this regard, it is important to stress that, just as for other functional connectivity techniques (e.g., “resting‐state”), the connectivity patterns derived from MACM consider direct as well as indirect connections between the different regions and do not imply any causality [Eickhoff and Grefkes, 2011]. The coactivation patterns in MACM are not specific to a single paradigm, but instead cover a broad range of tasks and mental operations. They, hence, yield robust and more canonical connectivity patterns [Fox and Friston, 2012]. Compared with “resting‐state” analyses, which rely on the correlation of signal fluctuations in fMRI time series of subjects at rest and represent the currently most widely used approach to map functional connectivity, MACM principally differs in the unit of observation. Whereas this is provided by a particular imaging time‐point in resting‐state analyses, it is provided by the set of activation foci of a particular neuroimaging experiment in MACM. Because the coactivation patterns revealed by MACM represent those networks that are conjointly recruited across a broad range of tasks, they are commonly called “task‐based” or “task‐dependent” functional connectivity in contrast to the “task‐independent” functional connectivity of resting‐state networks. By now, MACM was successfully used in several studies for the analysis of functional connectivity patterns [e.g., Eickhoff et al., 2010; Jakobs et al., 2012; Robinson et al., 2010; Torta and Cauda, 2011] and it could be demonstrated that the intrinsic networks delineated by means of MACM based on the BrainMap database show a good correlation with resting‐state networks [Cauda et al., 2011; Laird et al., 2011b; Smith et al., 2009].
A possible drawback of the MACM approach is the lack of control over possible confounds regarding the composition of subject populations. As there is a large number of experiments integrated in the analysis, subjects cannot be adequately balanced for age, gender, education etc. between experiments. However, this heterogeneity in the subject population is a nonsystematic confound that reflects the socio‐demographic variability in the underlying populations and should thus enhance generalizability of the obtained results. Another consideration is that not all brain regions are equally likely activated by neuroimaging experiments, for example, due to regional differences in effect sizes or spatial variability as well as due to limited accessibility of fMRI techniques. To give an example, susceptibility artifacts of the transverse sinus have been shown to affect the fMRI signal of the ventral occipitotemporal cortex surrounding area hV4 [Winawer et al., 2010], which may lead to an underrepresentation of this area in the literature. Lastly, any meta‐analysis of neuroimaging experiments with MACM is naturally constrained to tasks that can be performed in a scanner, which possibly omits some more natural cognitive processes. However, given the tremendous number of neuroimaging experiments from a broad range of tasks stored in the BrainMap database we would argue that the large amount of possible task‐based interactions with the seed can be revealed and that the results emerged from the data‐driven approach are thus widely generalizable. Moreover, possible asymmetries regarding over‐ or under‐representations of tasks within the database are faced by considering the whole‐database distribution of task representations in the functional analysis of the seeds.
A Common Functional Involvement in a Fundamental Network
As expected for areas of the ventral visual cortex, our functional profiling revealed common engagement of FG1 and FG2 in several aspects of visual processing. Particularly, the perception of visual shapes was very likely to elicit activation in both areas and on both sides, which may indicate a common involvement of FG1 and FG2 in the processing of visual objects. Comparing the topographic locations of FG1 and FG2 with recent functional neuroimaging literature [see Caspers et al., 2013 for a detailed discussion] showed that both areas correspond to the “object‐related” visual cortex, which immediately adjoins the early ventral visual areas V3v and V4v [Malach et al., 2002]. Additionally, both areas showed a common involvement in language perception, albeit with different specificity. Based on the topography of FG1 and FG2, this is consistent with the idea of a continuous posterior‐anteriorly directed pathway of visual language processing along the ventral occipitotemporal cortex [Dehaene et al., 2005; Szwed et al., 2011], where FG1 and FG2 would be engaged at an intermediate stage.
Further evidence for a shared involvement of FG1 and FG2 in at least some processes or functions was provided by the analysis of their coactivation patterns. The conjunction of the coactivity maps of both areas indicated an extensive network spanning occipital, temporal, parietal, frontal, insular as well as subcortical regions, which coactivates with both, FG1 and FG2. Thus, it can be regarded as a general network of brain regions that interact with both areas of the posterior fusiform gyrus. Interestingly, virtually all of these regions are also considered part of the “task‐positive‐network” (TPN) [Dosenbach et al., 2007; Fox et al., 2005a; Fransson, 2005]. This TPN is interpreted as a fundamental ensemble jointly activated in a broad range of cognitive tasks, particularly in those demanding targeted attention. The inclusion of FG1 and FG2 in this fundamental network might indicate a common involvement of both areas in goal‐directed and attention‐demanding visual processing, in particular for the recognition of visual objects.
Moreover, there are fiber tracts, which may directly connect the fusiform gyrus to other regions of this fundamental network. For example, the inferior longitudinal fasciculus is known to contain fibers running from the fusiform region to the temporal pole, the amygdala and occipital regions [Catani et al., 2003; Martino et al., 2011]. The inferior frontal‐occipital fasciculus in turn spans between the fusiform gyrus as well as dorsolateral and ventrolateral frontal regions [Catani et al., 2002]. Additionally, anterior parts of the ventral occipito‐temporal cortex are connected to parietal, temporal, and frontal regions via the superior longitudinal fasciculus [Catani et al., 2002]. However, while the tracts connecting the more posterior visual areas, that is, the inferior longitudinal fasciulus and the inferior frontal‐occipital fasciculus are found quite symmetrical in both hemispheres [Forkel et al., in press; Thiebaut de Schotten et al., 2011], parts of the superior longitudinal fasciculus are found asymmetrically [Thiebaut de Schotten et al., 2011], which is associated with language processing [Catani et al., 2005; Powell et al., 2006; Takao et al., 2011]. Particularly, a direct correlation between the structure of the posterior (temporoparietal) segment of the arcuate fasciculus and reading ability could recently be demonstrated [Thiebaut de Schotten et al., in press].
Hierarchical Segregation of FG1 and FG2
Beside the commonalities discussed above, our analysis also revealed clear distinctions in functional characteristics of FG1 and FG2 and segregated networks of coactivation. The behavioral profiles of the left and right FG1 are highly symmetric but functionally less specific than those of FG2. In contrast, the functions of bilateral FG2 show a clear focus on face perception tasks, language related tasks, and tasks associated with the working memory. Moreover, the functional profiles for FG2 also showed a considerably higher degree of hemispheric asymmetry than those for FG1. These differences in the behavioral involvement and hence function between FG1 and FG2 are reflected by their coactivation patterns, which were identified as significant differences in the contrast of the respective coactivation maps. While FG1 featured significantly stronger coactivation than FG2 with the visual cortex up to the region of the intraparietal sulcus, the latter area showed stronger coactivation with nonvisual areas, particularly with (pre‐) motor, inferior frontal, and insular regions. Additionally, a predominantly symmetric coactivity pattern of cortical areas was found for left and right FG1. Contrastingly, a pronounced interhemispheric difference could be observed for left and right FG2 as seed regions.
These distinctions point to different functional roles of FG1 and FG2: The behavioral profile and the more symmetric coactivation pattern together with the stronger coactivations of FG1 with the visual cortex are in accordance with the characteristics of “early” visual areas. In contrast, the lateralized involvement of FG2 in higher‐order processes, like language and face perception, as well as the strong and more lateralized coactivations to various nonvisual areas suggest that FG2 operates on a hierarchically higher level of visual processing. Well in line with this conclusion, the involvement in overt and covert naming points to an associative function of FG2 in visual object recognition.
The current results are well in accordance with the comparisons of the probabilistic cytoarchitectonic maps with stereotaxic coordinates of activated sites [see Caspers et al., 2013] for a detailed discussion], which indicate that FG1 is located immediately antero‐lateral to early visual area hOc4v/hV4 [Rottschy et al., 2007; Wilms et al., 2010] in a functionally hitherto not further defined region between retinotopic area VO‐1 [Arcaro et al., 2009; Brewer et al., 2005] and face and word‐form selective regions of the fusiform gyrus. In contrast, FG2 has strong relations to the posterior part of the FFA [Pinsk et al., 2009; Weiner and Grill‐Spector, 2010, 2012] and to the VWFA [Cohen et al., 2000, 2002; Dehaene et al., 2010; Vigneau et al., 2005]. Accordingly, FG1 might probably be integrated in the visual processing hierarchy at an intermediate stage as a transitional area between the “early” and the “higher” visual cortex, while FG2 already corresponds to a higher‐order associative region.
Two Distinct Functional Systems in FG2
In contrast to FG1, the more anterior‐lateral and (as discussed above) presumably higher area FG2 showed a marked lateralization and hence hemispheric specialization. In particular, the behavioral profile of FG2 reveals a considerably stronger involvement of the left FG2 in reading tasks. This is supported by the analysis of coactivation patterns, where left FG2 shows stronger coactivations than the right sided seed with inferior frontal and premotor regions, as well as the middle temporal gyrus. These regions are strongly associated with (particularly visually driven) language processing and have been described in common networks with the left fusiform gyrus [Bokde et al., 2001; Devlin et al., 2004; Nakamura et al., 2007; Price, 2004; Vandenberghe et al., 1996; Zhao et al., 2011]. These results point to a putative correspondence of the left FG2 with the visual word processing system, that is, the VWFA, which is commonly found on the lateral aspect of the fusiform gyrus and within the lateral occipitotemporal sulcus and shows activation in response to visually presented word‐forms [Cohen et al., 2000].
In contrast, the behavioral profiles show that the involvement of FG2 in face perception is lateralized to the right side and only right FG2 shows a high activity during affective processing. Furthermore, the analysis of coactivation patterns for the right FG2 area shows notably stronger coactivation with the left amygdala, which points to a presumably stronger involvement in emotional processes [for review see Pessoa, 2011]. Such an interaction between the right fusiform gyrus and the amygdala for emotional face perception is well documented [Breiter et al., 1996; Herrington et al., 2011; Ishai, 2008; Muller et al., 2011; Phillips et al., 1997; Vuilleumier et al., 2001]. Our results thus seem to reflect the known lateralization of the FFA (more dominant on the right side) and amygdala (more dominant on the left side) in the context of (affective) face processing and social interactions. In turn, the right side of FG2 hence should correspond to the dominant right‐hemispheric FFA. Interestingly, our results indicated a further region on the fusiform gyrus (anterior and separated from FG2), which was consistently coactive with the right FG2 seed. This is well in accordance with recent findings on a bipartition of the FFA, especially on the right side [Mei et al., 2010; Pinsk et al., 2009; Weiner and Grill‐Spector, 2010, 2013, 2012], where FG2 is probably corresponding to the posterior FFA (“pFus‐faces”/“FFA‐1”).
In summary, the topographic location of FG2 on the lateral bank of the posterior fusiform gyrus as well as its lateralized behavioral profile and coactivations thus indicate a putative correspondence of the cytoarchitectonically defined FG2 to both the FFA (in particular on the right hemisphere) and the VWFA (in particular on the left hemisphere).
Face and Word‐Form Related Visual Regions Probably Share the Same Neural Basis
The above conclusions create an interesting dilemma when considering that cytoarchitectonic area FG2 is homogenously found on the lateral bank of the posterior fusiform gyrus in both hemispheres with no interhemispheric differences in cytoarchitecture, cortical volume, or relative stereotaxic location [see Caspers et al., 2013]. In spite of this symmetry, however, the present results point to a hemisphere‐specific involvement of FG2 in two apparently distinctive functional systems, that is, visual face and word processing, with putative correspondence to the FFA and the VWFA, respectively. While puzzling, this observation is actually well in line with previous functional imaging results showing that the FFA and the VWFA are typically found in similar stereotaxic locations on the lateral aspect of the fusiform gyrus, but with different side preferences [Dien, 2009]. While the FFA seems to be right‐dominant but can generally also be found on the left hemisphere [Cabeza and Nyberg, 2000; Kanwisher et al., 1997; Willems et al., 2010], the lateralization of the VWFA to the left hemisphere is even more pronounced [Cai et al., 2008; Cohen et al., 2000, 2002; Vigneau et al., 2005], although not exclusive [Ben‐Shachar et al., 2007]. However, to date there is no report available of a detailed analysis of the topographic relationship between the VWFA and the FFA within the same subject.
While a direct comparison is thus missing, one report shows that VWFA is involved in memorization of words and faces [Mei et al., 2010]. Moreover, there are case reports of prosopagnosic individuals with right fusiform lesions, which also show an impairment of their reading ability [Behrmann and Kimchi, 2003], as well as of individuals with left hemispheric lesions, which suffer from both, pure alexia and prosopagnosia [Liu et al., 2011]. Recently, functional imaging at higher resolution has shown that face‐sensitive sites on the fusiform gyrus are not arranged as one homogenously organized area but in several distributed cortical patches, which alternate with patches of different functional specialization [Weiner and Grill‐Spector, 2010]. It has been suggested that this organizational feature also pertains for word‐selective with face‐selective patches in the left hemisphere. Such interdigitating functional patches in homogeneously appearing cytoarchitectonic area [Caspers et al., 2013] could be explained by different connectivity patterns, but a common cytoarchitecture of the patches. Thus, the language‐ and face‐selective regions of the posterior fusiform gyrus would be embedded within the same cortical unit, that is, the cytoarchitectonic area FG2, but each type of patches shows a distinctive connectivity preference. In this context, however, it is important to emphasize, that these connectional differences between patches most likely will be below the current resolution of functional or structural in‐vivo imaging of connectivity. That is, it will for the time being most likely not be possible to actually reveal these patterns of differential connectivity directly. The differences observed in the present article should hence rather reflect net differences in functional connectivity resulting from the presence of more “language related” patches on the left side (yielding a net excess of connections to language areas) and more “face related” patches on the right (yielding a net excess of connections to face processing areas). This idea assorts well with a recently proposed conception on the organization of word‐ and face‐selective visual regions on the fusiform gyrus, which emphasized the representations of word‐forms and faces to be arranged within the same neuronal units and was substantiated by a computational model [Plaut and Behrmann, 2011].
Moreover, the concept that face‐ and word‐selective visual processing is implemented within the same cytoarchitectonic area also fits well to the “recycling hypothesis” [Dehaene and Cohen, 2007, 2011] of the genesis of the VWFA. The hypothesis explains our reading ability as a relatively recent step in human evolution implemented in already existing cytoarchitectonic areas. Therefore, when learning to read, the human brain has to “recycle” those cortical areas, which are best able to facilitate the required processing rules for reading, while the former functionality is partially displaced. In case of the VWFA, the function of visual language recognition is embedded in the evolutionary older cortex for visual object and face recognition. This hypothetical interpretation is supported by the observation that neural response to written language in the ventral visual cortex is progressively lateralized to the left when humans learn to read [Maurer et al., 2006], while the representation of faces concurrently increases in the right and a decreases in the left hemisphere [Cantlon et al., 2011; Dehaene et al., 2010].
Area FG2 thus shows functional lateralization despite symmetric cytoarchitectonic characteristics and an equal size in both hemispheres. These functional distinctions between left and right FG2 and their differing object‐selectivity may probably be caused by different input‐ and output‐interactions, that is differences in connectivity. First evidence for a hemispheric disparity in functional connectivity of FG2 was demonstrated by our analysis of coactivation patterns and hence supports the notion that within the same structural area (FG2) interactions with different remote regions may lead to distinguishable functions. This results, although at first glance surprising, are well in line with the notion that the functional behavior of a particular cortical location is determined by both, its microstructural organization and its connectivity [Eickhoff and Grefkes, 2011; Kötter and Sommer, 2000].
CONCLUSIONS
Our data indicate that cytoarchitectonic areas, FG1 and FG2, on the posterior fusiform gyrus are commonly involved in the processing of visual objects and show several commonalities in task‐based functional connectivity, forming a fundamental “task‐positive” network involved in the visual processing for cognitive tasks. However, the coactivation data and the respective profiles of behavior demonstrate a functional segregation of these cytoarchitectonic areas: It could be shown that FG1 shows features of an early visual area, while FG2 belongs to the hierarchically higher visual cortex. We furthermore demonstrated that area FG2 shows a lateralized domain‐specificity. Whereas FG2 on the left hemisphere is more involved in visual language processing, right FG2 shows stronger relations to emotion and face processing. This lateralization supports the association of FG2 with the functionally defined visual word‐form (predominantly left) and the fusiform face system (predominantly right). These findings point to a common neural basis of visual processing of written language and faces and indicate possible implications for the organization of the functionally defined VWFA and FFA.
REFERENCES
- Amunts K, Schleicher A, Burgel U, Mohlberg H, Uylings HB, Zilles K (1999): Broca's region revisited: Cytoarchitecture and intersubject variability. J Comp Neurol 412:319–341. [DOI] [PubMed] [Google Scholar]
- Amunts K, Malikovic A, Mohlberg H, Schormann T, Zilles K (2000): Brodmann's areas 17 and 18 brought into stereotaxic space‐where and how variable? Neuroimage 11:66–84. [DOI] [PubMed] [Google Scholar]
- Amunts K, Kedo O, Kindler M, Pieperhoff P, Mohlberg H, Shah NJ, Habel U, Schneider F, Zilles K (2005): Cytoarchitectonic mapping of the human amygdala, hippocampal region and entorhinal cortex: Intersubject variability and probability maps. Anat Embryol 210:343–352. [DOI] [PubMed] [Google Scholar]
- Arcaro MJ, McMains SA, Singer BD, Kastner S (2009): Retinotopic organization of human ventral visual cortex. J Neurosci 29:10638–10652. [DOI] [PMC free article] [PubMed] [Google Scholar]
- Behrmann M, Kimchi R (2003): What does visual agnosia tell us about perceptual organization and its relationship to object perception? J Exp Psychol Hum Percept Perform 29:19–42. [DOI] [PubMed] [Google Scholar]
- Ben‐Shachar M, Dougherty RF, Deutsch GK, Wandell BA (2007): Differential sensitivity to words and shapes in ventral occipito‐temporal cortex. Cereb Cortex 17:1604–1611. [DOI] [PubMed] [Google Scholar]
- Bokde AL, Tagamets MA, Friedman RB, Horwitz B (2001): Functional interactions of the inferior frontal cortex during the processing of words and word‐like stimuli. Neuron 30:609–617. [DOI] [PubMed] [Google Scholar]
- Breiter HC, Etcoff NL, Whalen PJ, Kennedy WA, Rauch SL, Buckner RL, Strauss MM, Hyman SE, Rosen BR (1996): Response and habituation of the human amygdala during visual processing of facial expression. Neuron 17:875–887. [DOI] [PubMed] [Google Scholar]
- Brewer AA, Liu J, Wade AR, Wandell BA (2005): Visual field maps and stimulus selectivity in human ventral occipital cortex. Nat Neurosci 8:1102–1109. [DOI] [PubMed] [Google Scholar]
- Cabeza R, Nyberg L (2000): Imaging cognition II: An empirical review of 275 PET and fMRI studies. J Cogn Neurosci 12:1–47. [DOI] [PubMed] [Google Scholar]
- Cai Q, Lavidor M, Brysbaert M, Paulignan Y, Nazir TA (2008): Cerebral lateralization of frontal lobe language processes and lateralization of the posterior visual word processing system. J Cogn Neurosci 20:672–681. [DOI] [PubMed] [Google Scholar]
- Cantlon JF, Pinel P, Dehaene S, Pelphrey KA (2011): Cortical representations of symbols, objects, and faces are pruned back during early childhood. Cerebral Cortex 21:191–199. [DOI] [PMC free article] [PubMed] [Google Scholar]
- Caspers J, Zilles K, Eickhoff SB, Schleicher A, Mohlberg H, Amunts K (2013): Cytoarchitectonical analysis and probabilistic mapping of two extrastriate areas of the human posterior fusiform gyrus. Brain Struct Funct 218:511–526. [DOI] [PMC free article] [PubMed] [Google Scholar]
- Caspers S, Eickhoff SB, Geyer S, Scheperjans F, Mohlberg H, Zilles K, Amunts K (2008): The human inferior parietal lobule in stereotaxic space. Brain Struct Funct 212:481–495. [DOI] [PubMed] [Google Scholar]
- Caspers S, Zilles K, Laird AR, Eickhoff SB (2010): ALE meta‐analysis of action observation and imitation in the human brain. Neuroimage 50:1148–1167. [DOI] [PMC free article] [PubMed] [Google Scholar]
- Catani M, Howard RJ, Pajevic S, Jones DK (2002): Virtual in vivo interactive dissection of white matter fasciculi in the human brain. Neuroimage 17:77–94. [DOI] [PubMed] [Google Scholar]
- Catani M, Jones DK, Donato R, Ffytche DH (2003): Occipito‐temporal connections in the human brain. Brain 126:2093–2107. [DOI] [PubMed] [Google Scholar]
- Catani M, Jones DK, ffytche DH (2005): Perisylvian language networks of the human brain. Ann Neurol 57:8–16. [DOI] [PubMed] [Google Scholar]
- Cauda F, Cavanna AE, D'Agata F, Sacco K, Duca S, Geminiani GC (2011): Functional connectivity and coactivation of the nucleus accumbens: A combined functional connectivity and structure‐based meta‐analysis. J Cogn Neurosci 23:2864–2877. [DOI] [PubMed] [Google Scholar]
- Choi HJ, Zilles K, Mohlberg H, Schleicher A, Fink GR, Armstrong E, Amunts K (2006): Cytoarchitectonic identification and probabilistic mapping of two distinct areas within the anterior ventral bank of the human intraparietal sulcus. J Comp Neurol 495:53–69. [DOI] [PMC free article] [PubMed] [Google Scholar]
- Cohen L, Dehaene S, Naccache L, Lehericy S, Dehaene‐Lambertz G, Henaff MA, Michel F (2000): The visual word form area: Spatial and temporal characterization of an initial stage of reading in normal subjects and posterior split‐brain patients. Brain 123 (Pt 2):291–307. [DOI] [PubMed] [Google Scholar]
- Cohen L, Lehericy S, Chochon F, Lemer C, Rivaud S, Dehaene S (2002): Language‐specific tuning of visual cortex? Functional properties of the visual word form area. Brain 125:1054–1069. [DOI] [PubMed] [Google Scholar]
- Dehaene S, Cohen L (2007): Cultural recycling of cortical maps. Neuron 56:384–398. [DOI] [PubMed] [Google Scholar]
- Dehaene S, Cohen L (2011): The unique role of the visual word form area in reading. Trends Cogn Sci 15:254–262. [DOI] [PubMed] [Google Scholar]
- Dehaene S, Cohen L, Sigman M, Vinckier F (2005): The neural code for written words: A proposal. Trends Cogn Sci 9:335–341. [DOI] [PubMed] [Google Scholar]
- Dehaene S, Pegado F, Braga LW, Ventura P, Nunes Filho G, Jobert A, Dehaene‐Lambertz G, Kolinsky R, Morais J, Cohen L (2010): How learning to read changes the cortical networks for vision and language. Science 330:1359–1364. [DOI] [PubMed] [Google Scholar]
- Devlin JT, Jamison HL, Matthews PM, Gonnerman LM (2004): Morphology and the internal structure of words. Proc Natl Acad Sci U S A 101:14984–14988. [DOI] [PMC free article] [PubMed] [Google Scholar]
- Diedrichsen J, Balsters JH, Flavell J, Cussans E, Ramnani N (2009): A probabilistic MR atlas of the human cerebellum. Neuroimage 46:39–46. [DOI] [PubMed] [Google Scholar]
- Dien J (2009): A tale of two recognition systems: Implications of the fusiform face area and the visual word form area for lateralized object recognition models. Neuropsychologia 47:1–16. [DOI] [PubMed] [Google Scholar]
- Dosenbach NU, Fair DA, Miezin FM, Cohen AL, Wenger KK, Dosenbach RA, Fox MD, Snyder AZ, Vincent JL, Raichle ME, Schlaggar BL, Petersen SE (2007): Distinct brain networks for adaptive and stable task control in humans. Proc Natl Acad Sci U S A 104:11073–11078. [DOI] [PMC free article] [PubMed] [Google Scholar]
- Eickhoff SB, Grefkes C (2011): Approaches for the integrated analysis of structure, function and connectivity of the human brain. Clin EEG Neurosci 42:107–121. [DOI] [PMC free article] [PubMed] [Google Scholar]
- Eickhoff SB, Stephan KE, Mohlberg H, Grefkes C, Fink GR, Amunts K, Zilles K (2005): A new SPM toolbox for combining probabilistic cytoarchitectonic maps and functional imaging data. Neuroimage 25:1325–1335. [DOI] [PubMed] [Google Scholar]
- Eickhoff SB, Heim S, Zilles K, Amunts K (2006): Testing anatomically specified hypotheses in functional imaging using cytoarchitectonic maps. Neuroimage 32:570–582. [DOI] [PubMed] [Google Scholar]
- Eickhoff SB, Paus T, Caspers S, Grosbras MH, Evans AC, Zilles K, Amunts K (2007): Assignment of functional activations to probabilistic cytoarchitectonic areas revisited. Neuroimage 36:511–521. [DOI] [PubMed] [Google Scholar]
- Eickhoff SB, Laird AR, Grefkes C, Wang LE, Zilles K, Fox PT (2009): Coordinate‐based activation likelihood estimation meta‐analysis of neuroimaging data: A random‐effects approach based on empirical estimates of spatial uncertainty. Hum Brain Mapp 30:2907–2926. [DOI] [PMC free article] [PubMed] [Google Scholar]
- Eickhoff SB, Jbabdi S, Caspers S, Laird AR, Fox PT, Zilles K, Behrens TE (2010): Anatomical and functional connectivity of cytoarchitectonic areas within the human parietal operculum. J Neurosci 30:6409–6421. [DOI] [PMC free article] [PubMed] [Google Scholar]
- Eickhoff SB, Bzdok D, Laird AR, Roski C, Caspers S, Zilles K, Fox PT (2011): Co‐activation patterns distinguish cortical modules, their connectivity and functional differentiation. Neuroimage 57:938–949. [DOI] [PMC free article] [PubMed] [Google Scholar]
- Eickhoff SB, Bzdok D, Laird AR, Kurth F, Fox PT (2012): Activation likelihood estimation meta‐analysis revisited. Neuroimage 59:2349–2361. [DOI] [PMC free article] [PubMed] [Google Scholar]
- Felleman DJ, van Essen DC (1991): Distributed hierarchical processing in the primate cerebral cortex. Cereb Cortex 1:1–47. [DOI] [PubMed] [Google Scholar]
- Forkel SJ, Thiebaut de Schotten M, Kawadler JM, Dell'acqua F, Danek A, Catani M: The anatomy of fronto‐occipital connections from early blunt dissections to contemporary tractography. Cortex (in press). [DOI] [PubMed] [Google Scholar]
- Fox MD, Snyder AZ, Vincent JL, Corbetta M, Van Essen DC, Raichle ME (2005a): The human brain is intrinsically organized into dynamic, anticorrelated functional networks. Proc Natl Acad Sci U S A 102:9673–9678. [DOI] [PMC free article] [PubMed] [Google Scholar]
- Fox PT, Friston KJ (2012): Distributed processing; distributed functions? Neuroimage 61:407–426. [DOI] [PMC free article] [PubMed] [Google Scholar]
- Fox PT, Laird AR, Fox SP, Fox PM, Uecker AM, Crank M, Koenig SF, Lancaster JL (2005b): Brain map taxonomy of experimental design: Description and evaluation. Hum Brain Mapp 25:185–198. [DOI] [PMC free article] [PubMed] [Google Scholar]
- Fransson P (2005): Spontaneous low‐frequency BOLD signal fluctuations: An fMRI investigation of the resting‐state default mode of brain function hypothesis. Hum Brain Mapp 26:15–29. [DOI] [PMC free article] [PubMed] [Google Scholar]
- Friston KJ (1994): Functional and effective connectivity in neuroimaging: A synthesis. Hum Brain Mapp 2:56–78. [Google Scholar]
- Geyer S (2004): The microstructural border between the motor and the cognitive domain in the human cerebral cortex. Adv Anat Embryol Cell Biol 174, I‐VIII:1–89. [DOI] [PubMed] [Google Scholar]
- Geyer S, Ledberg A, Schleicher A, Kinomura S, Schormann T, Burgel U, Klingberg T, Larsson J, Zilles K, Roland PE (1996): Two different areas within the primary motor cortex of man. Nature 382:805–807. [DOI] [PubMed] [Google Scholar]
- Herrington JD, Taylor JM, Grupe DW, Curby KM, Schultz RT (2011): Bidirectional communication between amygdala and fusiform gyrus during facial recognition. Neuroimage 56:2348–2355. [DOI] [PMC free article] [PubMed] [Google Scholar]
- Ishai A (2008): Let's face it: It's a cortical network. Neuroimage 40:415–419. [DOI] [PubMed] [Google Scholar]
- Jakobs O, Langner R, Caspers S, Roski C, Cieslik EC, Zilles K, Laird AR, Fox PT, Eickhoff SB (2012): Across‐study and within‐subject functional connectivity of a right temporo‐parietal junction subregion involved in stimulus‐context integration. Neuroimage 60:2389–2398. [DOI] [PMC free article] [PubMed] [Google Scholar]
- Kanwisher N, McDermott J, Chun MM (1997): The fusiform face area: A module in human extrastriate cortex specialized for face perception. J Neurosci 17:4302–4311. [DOI] [PMC free article] [PubMed] [Google Scholar]
- Kötter R, Sommer FT (2000): Global relationship between anatomical connectivity and activity propagation in the cerebral cortex. Philos Trans R Soc Lond B Biol Sci 355:127–134. [DOI] [PMC free article] [PubMed] [Google Scholar]
- Laird AR, Lancaster JL, Fox PT (2005): BrainMap: The social evolution of a human brain mapping database. Neuroinformatics 3:65–78. [DOI] [PubMed] [Google Scholar]
- Laird AR, Eickhoff SB, Kurth F, Fox PM, Uecker AM, Turner JA, Robinson JL, Lancaster JL, Fox PT (2009a): ALE meta‐analysis workflows via the brainmap database: Progress towards a probabilistic functional brain atlas. Front Neuroinform 3:23. [DOI] [PMC free article] [PubMed] [Google Scholar]
- Laird AR, Eickhoff SB, Li K, Robin DA, Glahn DC, Fox PT (2009b): Investigating the functional heterogeneity of the default mode network using coordinate‐based meta‐analytic modeling. J Neurosci 29:14496–14505. [DOI] [PMC free article] [PubMed] [Google Scholar]
- Laird AR, Eickhoff SB, Fox PM, Uecker AM, Ray KL, Saenz JJ Jr., McKay DR, Bzdok D, Laird RW, Robinson JL, Turner JA, Turkeltaub PE, Lancaster JL, Fox PT (2011a). The BrainMap strategy for standardization, sharing, and meta‐analysis of neuroimaging data. BMC Res Notes 4:349. [DOI] [PMC free article] [PubMed] [Google Scholar]
- Laird AR, Fox PM, Eickhoff SB, Turner JA, Ray KL, McKay DR, Glahn DC, Beckmann CF, Smith SM, Fox PT (2011b): Behavioral interpretations of intrinsic connectivity networks. J Cogn Neurosci 23:4022–4037. [DOI] [PMC free article] [PubMed] [Google Scholar]
- Lancaster JL, Tordesillas‐Gutierrez D, Martinez M, Salinas F, Evans A, Zilles K, Mazziotta JC, Fox PT (2007): Bias between MNI and Talairach coordinates analyzed using the ICBM‐152 brain template. Hum Brain Mapp 28:1194–1205. [DOI] [PMC free article] [PubMed] [Google Scholar]
- Liu YC, Wang AG, Yen MY (2011). “Seeing but not identifying”: Pure alexia coincident with prosopagnosia in occipital arteriovenous malformation. Graefes Arch Clin Exp Ophthalmol 249:1087–1089. [DOI] [PubMed] [Google Scholar]
- Malach R, Levy I, Hasson U (2002): The topography of high‐order human object areas. Trends Cogn Sci 6:176–184. [DOI] [PubMed] [Google Scholar]
- Malikovic A, Amunts K, Schleicher A, Mohlberg H, Eickhoff SB, Wilms M, Palomero‐Gallagher N, Armstrong E, Zilles K (2007): Cytoarchitectonic analysis of the human extrastriate cortex in the region of V5/MT+: A probabilistic, stereotaxic map of area hOc5. Cereb Cortex 17:562–574. [DOI] [PubMed] [Google Scholar]
- Martino J, De Witt Hamer PC, Vergani F, Brogna C, de Lucas EM, Vazquez‐Barquero A, Garcia‐Porrero JA, Duffau H (2011): Cortex‐sparing fiber dissection: An improved method for the study of white matter anatomy in the human brain. J Anat 219:531–541. [DOI] [PMC free article] [PubMed] [Google Scholar]
- Maurer U, Brem S, Kranz F, Bucher K, Benz R, Halder P, Steinhausen HC, Brandeis D (2006): Coarse neural tuning for print peaks when children learn to read. Neuroimage 33:749–758. [DOI] [PubMed] [Google Scholar]
- Mei L, Xue G, Chen C, Xue F, Zhang M, Dong Q (2010): The “visual word form area” is involved in successful memory encoding of both words and faces. Neuroimage 52:371–378. [DOI] [PMC free article] [PubMed] [Google Scholar]
- Mishkin M, Ungerleider LG, Macko KA (1983): Object vision and spatial vision: Two cortical pathways. Trends Neurosci 6:414–417. [Google Scholar]
- Muller VI, Habel U, Derntl B, Schneider F, Zilles K, Turetsky BI, Eickhoff SB (2011): Incongruence effects in crossmodal emotional integration. Neuroimage 54:2257–2266. [DOI] [PMC free article] [PubMed] [Google Scholar]
- Nakamura K, Dehaene S, Jobert A, Le Bihan D, Kouider S (2007): Task‐specific change of unconscious neural priming in the cerebral language network. Proc Natl Acad Sci U S A 104:19643–19648. [DOI] [PMC free article] [PubMed] [Google Scholar]
- Nichols T, Brett M, Andersson J, Wager T, Poline JB (2005): Valid conjunction inference with the minimum statistic. Neuroimage 25:653–660. [DOI] [PubMed] [Google Scholar]
- Peelen MV, Downing PE (2005): Selectivity for the human body in the fusiform gyrus. J Neurophysiol 93:603–608. [DOI] [PubMed] [Google Scholar]
- Pessoa L (2011): Reprint of: Emotion and cognition and the amygdala: From “what is it?” to “what's to be done?”. Neuropsychologia 49:681–694. [DOI] [PMC free article] [PubMed] [Google Scholar]
- Phillips ML, Young AW, Senior C, Brammer M, Andrew C, Calder AJ, Bullmore ET, Perrett DI, Rowland D, Williams SC, Gray JA, David AS (1997): A specific neural substrate for perceiving facial expressions of disgust. Nature 389:495–498. [DOI] [PubMed] [Google Scholar]
- Pinsk MA, Arcaro M, Weiner KS, Kalkus JF, Inati SJ, Gross CG, Kastner S (2009): Neural representations of faces and body parts in macaque and human cortex: A comparative FMRI study. J Neurophysiol 101:2581–2600. [DOI] [PMC free article] [PubMed] [Google Scholar]
- Plaut DC, Behrmann M (2011): Complementary neural representations for faces and words: A computational exploration. Cogn Neuropsychol 28:251–275. [DOI] [PubMed] [Google Scholar]
- Powell HW, Parker GJ, Alexander DC, Symms MR, Boulby PA, Wheeler‐Kingshott CA, Barker GJ, Noppeney U, Koepp MJ, Duncan JS (2006): Hemispheric asymmetries in language‐related pathways: A combined functional MRI and tractography study. Neuroimage 32:388–399. [DOI] [PubMed] [Google Scholar]
- Price CJ (2004): The functional anatomy of reading In: Richard SJF, Karl JF, Christopher DF, Raymond JD, Cathy JP, Semir Z, John TA, William DP, editors. Human Brain Function, 2nd ed Burlington: Academic Press; pp 547–562. [Google Scholar]
- Robinson JL, Laird AR, Glahn DC, Lovallo WR, Fox PT (2010): Metaanalytic connectivity modeling: Delineating the functional connectivity of the human amygdala. Hum Brain Mapp 31:173–184. [DOI] [PMC free article] [PubMed] [Google Scholar]
- Rottschy C, Eickhoff SB, Schleicher A, Mohlberg H, Kujovic M, Zilles K, Amunts K (2007): Ventral visual cortex in humans: Cytoarchitectonic mapping of two extrastriate areas. Hum Brain Mapp 28:1045–1059. [DOI] [PMC free article] [PubMed] [Google Scholar]
- Rottschy C, Langner R, Dogan I, Reetz K, Laird AR, Schulz JB, Fox PT, Eickhoff SB (2012): Modelling neural correlates of working memory: A coordinate‐based meta‐analysis. Neuroimage 60:830–846. [DOI] [PMC free article] [PubMed] [Google Scholar]
- Scheperjans F, Eickhoff SB, Hömke L, Mohlberg H, Hermann K, Amunts K, Zilles K (2008): Probabilistic maps, morphometry, and variability of cytoarchitectonic areas in the human superior parietal cortex. Cereb Cortex 18:2141–2157. [DOI] [PMC free article] [PubMed] [Google Scholar]
- Smith SM, Fox PT, Miller KL, Glahn DC, Fox PM, Mackay CE, Filippini N, Watkins KE, Toro R, Laird AR, Beckmann CF (2009): Correspondence of the brain's functional architecture during activation and rest. Proc Natl Acad Sci U S A 106:13040–13045. [DOI] [PMC free article] [PubMed] [Google Scholar]
- Szwed M, Dehaene S, Kleinschmidt A, Eger E, Valabregue R, Amadon A, Cohen L (2011): Specialization for written words over objects in the visual cortex. Neuroimage 56:330–344. [DOI] [PubMed] [Google Scholar]
- Takao H, Hayashi N, Ohtomo K (2011): White matter asymmetry in healthy individuals: A diffusion tensor imaging study using tract‐based spatial statistics. Neuroscience 193:291–299. [DOI] [PubMed] [Google Scholar]
- Thiebaut de Schotten M, Cohen L, Amemiya E, Braga LW, Dehaene S: Learning to read improves the structure of the arcuate fasciculus. Cereb Cortex (in press). [DOI] [PubMed] [Google Scholar]
- Thiebaut de Schotten M, Ffytche DH, Bizzi A, Dell'Acqua F, Allin M, Walshe M, Murray R, Williams SC, Murphy DG, Catani M (2011): Atlasing location, asymmetry and inter‐subject variability of white matter tracts in the human brain with MR diffusion tractography. Neuroimage 54:49–59. [DOI] [PubMed] [Google Scholar]
- Torta DM, Cauda F (2011): Different functions in the cingulate cortex, a meta‐analytic connectivity modeling study. Neuroimage 56:2157–2172. [DOI] [PubMed] [Google Scholar]
- Turkeltaub PE, Eickhoff SB, Laird AR, Fox M, Wiener M, Fox P (2012): Minimizing within‐experiment and within‐group effects in activation likelihood estimation meta‐analyses. Hum Brain Mapp 33:1–13. [DOI] [PMC free article] [PubMed] [Google Scholar]
- Ungerleider LG, Haxby JV (1994): 'What' and 'where' in the human brain. Curr Opin Neurobiol 4:157–165. [DOI] [PubMed] [Google Scholar]
- van Essen DC (2004): Organization of visual areas in macaque and human cerebral cortex In: Chalupa LM, Werner JS, editors. The Visual Neurosciences. Cambridge: MIT Press; pp 507–521. [Google Scholar]
- Vandenberghe R, Price C, Wise R, Josephs O, Frackowiak RS (1996): Functional anatomy of a common semantic system for words and pictures. Nature 383:254–256. [DOI] [PubMed] [Google Scholar]
- Vigneau M, Jobard G, Mazoyer B, Tzourio‐Mazoyer N (2005): Word and non‐word reading: What role for the Visual Word Form Area? Neuroimage 27:694–705. [DOI] [PubMed] [Google Scholar]
- Vuilleumier P, Armony JL, Driver J, Dolan RJ (2001): Effects of attention and emotion on face processing in the human brain: An event‐related fMRI study. Neuron 30:829–841. [DOI] [PubMed] [Google Scholar]
- Wager TD, Lindquist MA, Nichols TE, Kober H, Van Snellenberg JX (2009): Evaluating the consistency and specificity of neuroimaging data using meta‐analysis. Neuroimage 45:S210–221. [DOI] [PMC free article] [PubMed] [Google Scholar]
- Weiner KS, Grill‐Spector K (2010): Sparsely‐distributed organization of face and limb activations in human ventral temporal cortex. Neuroimage 52:1559–1573. [DOI] [PMC free article] [PubMed] [Google Scholar]
- Weiner KS, Grill‐Spector K (2013): Neural representations of faces and limbs neighbor in human high‐level visual cortex: Evidence for a new organization principle. Psychol Res 77:74–97. [DOI] [PMC free article] [PubMed] [Google Scholar]
- Weiner KS, Grill‐Spector K (2012): The improbable simplicity of the fusiform face area. Trends Cogn Sci 16:251–254. [DOI] [PubMed] [Google Scholar]
- Willems RM, Peelen MV, Hagoort P (2010): Cerebral lateralization of face‐selective and body‐selective visual areas depends on handedness. Cereb Cortex 20:1719–1725. [DOI] [PubMed] [Google Scholar]
- Wilms M, Eickhoff SB, Hömke L, Rottschy C, Kujovic M, Amunts K, Fink GR (2010): Comparison of functional and cytoarchitectonic maps of human visual areas V1, V2, V3d, V3v, and V4(v). Neuroimage 49:1171–1179. [DOI] [PubMed] [Google Scholar]
- Winawer J, Horiguchi H, Sayres RA, Amano K, Wandell BA (2010): Mapping hV4 and ventral occipital cortex: The venous eclipse. J Vis 10:1. [DOI] [PMC free article] [PubMed] [Google Scholar]
- Zhao J, Liu J, Li J, Liang J, Feng L, Ai L, Lee K, Tian J (2011): Intrinsically organized network for word processing during the resting state. Neurosci Lett 487:27–31. [DOI] [PubMed] [Google Scholar]