

Abstract
We compare the functional spectrum of protein evolution in two separate animal lineages with respect to two hypotheses: (1) rates of divergence are distributed similarly among functional classes within both lineages, indicating that selective pressure on the proteome is largely independent of organismic-level biological requirements; and (2) rates of divergence are distributed differently among functional classes within each lineage, indicating species-specific selective regimes impact genome-wide substitutional patterns. Integrating comparative genome sequence with data from tissue-specific expressed-sequence-tag (EST) libraries and detailed database annotations, we find a functional genomic signature of rapid evolution and selective constraint shared between mammalian and nematode lineages despite their extensive morphological and ecological differences and distant common ancestry. In both phyla, we find evidence of accelerated evolution among components of molecular systems involved in coevolutionary change. In mammals, lineage-specific fast evolving genes include those involved in reproduction, immunity, and possibly, maternal–fetal conflict. Likelihood ratio tests provide evidence for positive selection in these rapidly evolving functional categories in mammals. In contrast, slowly evolving genes, in terms of amino acid or insertion/deletion (indel) change, in both phyla are involved in core molecular processes such as transcription, translation, and protein transport. Thus, strong purifying selection appears to act on the same core cellular processes in both mammalian and nematode lineages, whereas positive and/or relaxed selection acts on different biological processes in each lineage.
A central question in biology concerns the tempo and mode of genetic changes brought about by deterministic versus stochastic processes (Fisher 1930; Haldane 1932). What types of selective forces are responsible for accelerated and conservative rates of evolution between species? Do similar forces act across diverse lineages as distinct as phyla? From recently completed genome-sequencing projects, it has been demonstrated that most multi-cellular organisms contain a similar complement of genes and gene families, owing, in part, to a common cellular biology. From this perspective, selection, at least at the molecular level, may be expected to act homogeneously across functionally similar genes in widely disparate taxa. Alternatively, it may be expected that because different species occupy divergent niches, selection might act differently on the same biological modules, thus producing no obvious trends across major taxonomic groups. A lack of general patterns may also result if random processes are the dominant cause of evolutionary change (Kimura 1968).
With the completion of genomes for human, mouse, rat, and two nematode species, Caenorhabditis elegans and Caenorhabditis briggsae (The C. elegans Sequencing Consortium 1998; Lander et al. 2001; Waterston et al. 2002; Stein et al 2003; Rat Genome Sequencing Project Consortium 2004), the introduction of controlled gene function vocabularies (Ashburner et al. 2000), the development of a growing cache of expressed sequence tag (EST) data from a wide assortment of organs and tissues (Boguski et al. 1993), and advances in phylogenetic and computational methods (Altschul and Lipman 1990; Goldman and Yang 1994; Yang 1997), we are in an unprecedented position to systematically assay general evolutionary genomic patterns across multi-cellular taxa.
Here we integrate a comparative and functional genomic approach to identify both rapidly and slowly evolving genes in two animal phyla in a biological context. Each species pair, human–mouse and C. elegans–C. briggsae, belongs to a different metazoan phylum, Vertebrata and Nematoda, respectively, but possess similar divergence times (∼80–90 million years ago [Mya]; Coghlan and Wolfe 2002; Springer et al. 2003), and the phyla themselves share a common ancestor ∼550 Mya (Fig. 1). Our results suggest that coevolutionary processes are common targets for rapid evolutionary change at the molecular level in both mammalian and nematode lineages. Furthermore, there is evidence of major adaptive differences between these lineages: As a functional class, transcription factors are overrepresented in the fastest evolving subset of the nematode genome, whereas genes involved in reproduction, immunity, and signal transduction are significantly overrepresented among mammalian genes. Evolutionary conflict appears to play a particularly important role in mammalian divergence as evidenced by a significant enrichment of rapidly evolving and positively selected genes involved in host defense and loci putatively involved in genomic conflict. In contrast, across both metozoan phyla, genes involved in basic cellular processes such as protein biosynthesis, cell growth, and certain components of signal transduction are significantly overrepresented among conserved genes when assayed by rates of amino acid substitution or the absence of insertion/deletion (indel) mutations.
Figure 1.
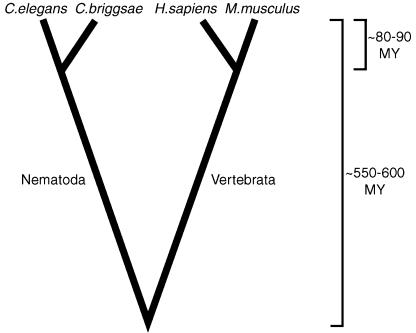
Evolutionary relationship and divergence time estimates of Homo sapiens, Mus musculus, Caenorhabditis elegans, and Caenorhabditis briggsae. Mammalian divergence estimates are based on Springer et al. (2003). Nematode divergence estimates are based on Coghlan and Wolfe (2002).
RESULTS
Nonsynonymous Substitution and Insertion/Deletion Mutations
After removing orthologs with excessively high synonymous substitution rates and excessive transition/transversion ratios (see Methods), we retained 7300 full protein-coding orthologs between Homo sapiens and Mus musculus and 7530 full proteincoding orthologs between C. elegans and C. briggsae. Recent estimates of the total number of protein-coding genes found in the human and mouse genomes are 30,000–40,000 (McPherson et al. 2001; Mural et al. 2002) and ∼20,000 in nematodes (The C. elegans Sequencing Consortium 1998); thus, our survey samples a significant fraction of each of the four genomes. The total number of aligned mammalian and worm nucleotides used in our analysis exceeds 20 million bp with coding sequences spanning an average of 1388.1 and 1439.4 nt, respectively (Table 1).
Table 1.
Nematode and Mammal Protein Divergence
| Mammals | Nematodes | |
|---|---|---|
| Number of orthologs | 7300 | 7530 |
| Analyzed aligned sequence | 10,133,025 bp | 10,838,643 bp |
| Mean size of aligned CDS | 1388.1 bp | 1439.4 bp |
| Nonsynonymous substitution (dN) | ||
| All sequences | 0.0876 (0.103) | 0.0989 (0.0800) |
| Top 10% (n = 730, 753) | 0.322 (0.147) | 0.2707 (0.105) |
| Lower 10% (n = 730, 753) | 0.00332 (0.00239) | 0.00154 (0.00689) |
| Insertion/deletion (%) | ||
| All sequences | 7.946 (13.780) | 6.409 (13.876) |
Mean values are shown for each category. Standard deviations are indicated in parentheses.
Sequence divergence was measured in two ways—differences in nucleotide identity and differences in insertion/deletions (indels) between aligned sequences. First, we estimated the rate of synonymous (dS) and nonsynonymous (dN) substitution using maximum likelihood (Yang 2002). Divergence estimates were made using a codon substitution model that takes into account possible biases such as codon preference and nucleotide composition (Yang and Nielsen 2000; Dunn et al. 2001). Among humans and mice, a substantive amount of variation in evolutionary rates between loci is evident, consistent with previous surveys (Li and Graur 1997; Makalowski and Boguski 1998). The mean nonsynonymous rate of substitution is 0.088, indicating that, on average, less than one-tenth of each protein sequence differs between mouse and man (Table 1). In terms of silent site divergence, the mean synonymous substitution rate across all orthologs is 0.681, indicative of the large phylogenetic distance between these two species (Li et al. 1990). Between C. elegans and C. briggsae, mean amino acid divergence is similar to that found between man and mouse (dN = 0.099), whereas mean silent site divergence was much higher (dS = 1.760).
A second measure of divergence is based on the number of indels found between aligned orthologs. Indels here refer to both internal insertion or deletion of amino acids and 5′ or 3′ insertion/truncation. Our results indicate that indels represent a major component of metazoan protein divergence. Indels are found in a significant fraction of the total human–mouse and nematode protein-coding alignments, with a mean indel fraction of 7.9% and 6.4% per gene, respectively (Table 1). The indel distribution over all mammalian orthologs includes a large subset of sequences (32.9%) that contains no indels (n = 2403), whereas in nematodes, only 18.0% of orthologs lack indels (n = 1352). Because deletions are three times more common than insertions in the human genome (Zhang and Gerstein 2003), most of the indels found between human and mouse are likely the result of deletion events.
Functional Analysis of Rapidly Evolving Genes
Using the upper 10% fastest evolving genes in terms of dN (see Methods) in both the mammalian (n = 730) and nematode (n = 753) lineages, we first used GeneMerge (Castillo-Davis and Hartl 2003a) to identify the annotated functions of fast evolving genes and to determine if any particular functional categories were statistically overrepresented. Database annotations for human in all three categories designated by the Gene Ontology Consortium (Ashburner et al. 2000)—molecular function, biological process, and cellular component— were used as input for GeneMerge.
We find that both phyla contain a significant overrepresentation of many gene functions in all three Gene Ontology (GO) categories, even after correcting for multiple tests (Tables 2 and 3). In Tables 2 and 3, note that the entire hierarchy of GO terms for each gene was used when assessing functional overrepresentation; therefore, nested categories are reported that often contain the same sets of genes. Genes that contribute to each GO term are available in the Supplemental material. Bonferroni-corrected P-values are given unless otherwise noted.
Table 2.
Functional Classification of Rapidly and Slowly Evolving Nematode Genes
| GO description (hierarchical biological function) | Fraction | P-value | GO term |
|---|---|---|---|
| Rapidly evolving genes (upper 10%) | |||
| Regulation of transcription, DNA-dependent | 45/753 | 4.27E-005 | GO:0006355 |
| Regulation of transcription | 45/753 | 5.72E-005 | GO:0045449 |
| Transcription, DNA-dependent | 45/753 | 7.63E-005 | GO:0006351 |
| Nucleobase, nucleoside, nucleotide and nucleic acid metabolism | 53/753 | 0.036752 | GO:0006139 |
| Slowly evolving genes (lower 10%) | |||
| Embryogenesis and morphogenesis | 107/753 | 9.30E-018 | GO:0007345 |
| Physiological processes | 268/753 | 4.04E-012 | GO:0007582 |
| Protein biosynthesis | 48/753 | 1.82E-011 | GO:0006412 |
| Cellular process | 132/753 | 4.89E-011 | GO:0009987 |
| Biosynthesis | 63/753 | 5.25E-011 | GO:0009058 |
| Small GTPase-mediated signal transduction | 23/753 | 7.89E-011 | GO:0007264 |
| Cell growth and/or maintenance | 94/753 | 3.33E-008 | GO:0008151 |
| Intracellular protein transport | 15/753 | 9.92E-006 | GO:0006886 |
| Development | 89/753 | 1.31E-005 | GO:0007275 |
| Metabolism | 189/753 | 2.17E-005 | GO:0008152 |
| Protein metabolism | 92/753 | 3.01E-005 | GO:0019538 |
| Cell organization and biogenesis | 20/753 | 8.09E-005 | GO:0016043 |
| Transport | 68/753 | 0.000318 | GO:0006810 |
| Reproduction | 43/753 | 0.000377 | GO:0000003 |
| Nucleosome assembly | 8/753 | 0.001020 | GO:0006334 |
| Intracellular signaling cascade | 30/753 | 0.001910 | GO:0007242 |
| Signal transduction | 38/753 | 0.002579 | GO:0007165 |
| Two-component signal transduction system (phosphorelay) | 7/753 | 0.002746 | GO:0000160 |
| Main pathways of carbohydrate metabolism | 11/753 | 0.003427 | GO:0006092 |
| Energy derivation by oxidation of organic compounds | 12/753 | 0.004455 | GO:0015980 |
| Energy pathways | 12/753 | 0.004455 | GO:0006091 |
| DNA packaging | 8/753 | 0.010077 | GO:0006323 |
| Establishment and/or maintenance of chromatin architecture | 8/753 | 0.010077 | GO:0006325 |
| Chromatin assembly/disassembly | 8/753 | 0.010077 | GO:0006333 |
| Cell communication | 40/753 | 0.012676 | GO:0007154 |
| mRNA splicing | 5/753 | 0.016747 | GO:0006371 |
Upper and lower 10% is scaled according to dN. Note the entire hierarchy of Gene Ontology terms for each gene was used when assessing functional overrepresentation; therefore, categories often contain the same sets of genes. All P-values are Bonferroni-corrected.
Table 3.
Functional Classification of Rapidly and Slowly Evolving Mammalian Genes
| GO description (hierarchical biological function) | Fraction | P-value | GO term |
|---|---|---|---|
| Rapidly evolving genes (upper 10%) | |||
| Immune response | 100/577 | 3.77E-040 | GO:0006955 |
| Response to external stimulus | 120/577 | 2.19E-029 | GO:0009605 |
| Response to pest/pathogen/parasite | 61/577 | 2.76E-023 | GO:0009613 |
| Response to stress | 66/577 | 2.08E-019 | GO:0006950 |
| Humoral immune response | 34/577 | 6.13E-017 | GO:0006959 |
| Antimicrobial humoral response | 24/577 | 4.84E-013 | GO:0019730 |
| Heterophilic cell adhesion | 20/577 | 9.58E-010 | GO:0007157 |
| Response to wounding | 27/577 | 2.68E-006 | GO:0009611 |
| Cell-surface-receptor-linked signal transduction | 55/577 | 9.80E-005 | GO:0007166 |
| Innate immune response | 20/577 | 0.000357 | GO:0045087 |
| Inflammatory response | 19/577 | 0.001230 | GO:0006954 |
| Cellular defense response | 10/577 | 0.006852 | GO:0006968 |
| Lymphocyte activation | 7/577 | 0.008820 | GO:0046649 |
| Pregnancy | 8/577 | 0.009790 | GO:0007565 |
| Cell—cell adhesion | 23/577 | 0.011196 | GO:0016337 |
| Acute-phase response | 6/577 | 0.012574 | GO:0006953 |
| Apoptosis | 27/577 | 0.020652 | GO:0006915 |
| Slowly evolving genes (lower 10%) | |||
| Protein biosynthesis | 55/699 | 1.17E-010 | GO:0006412 |
| Protein metabolism | 140/699 | 5.76E-010 | GO:0019538 |
| Intracellular protein transport | 44/699 | 5.89E-009 | GO:0006886 |
| Small GTPase-mediated signal transduction | 30/699 | 1.85E-007 | GO:0007264 |
| Ubiquitin-dependent protein catabolism | 25/699 | 4.81E-006 | GO:0006511 |
| Protein targeting | 18/699 | 0.000128 | GO:0006605 |
| Nucleobase, nucleoside, nucleotide, nucleic acid metabolism | 122/699 | 0.000133 | GO:0006139 |
| Biosynthesis | 69/699 | 0.000284 | GO:0009058 |
| Nucleocytoplasmic transport | 13/699 | 0.000461 | GO:0006913 |
| mRNA processing | 17/699 | 0.000491 | GO:0006397 |
| Metabolism | 265/699 | 0.001011 | GO:0008152 |
| Regulation of translation | 12/699 | 0.018670 | GO:0006445 |
| Protein—nucleus import, docking | 5/699 | 0.033283 | GO:0000059 |
| mRNA splicing | 10/699 | 0.039416 | GO:0006371 |
| RNA metabolism | 23/699 | 0.045205 | GO:0016070 |
Upper and lower 10% is scaled according to dN. Note the entire hierarchy of Gene Ontology terms for each gene was used when assessing functional overrepresentation; therefore, categories often contain the same sets of genes. All P-values are Bonferroni-corrected.
Among worms, proteins involved in DNA-dependent transcriptional regulation are among the fastest evolving annotated genes in the nematode genome (P < 4 × 10⁻⁵; Table 2). Of the 753 fastest evolving genes, 45 belong to this category. In fact, nematode proteins localized to the nucleus are significantly enriched in the highly diverged class (P = 0.011), which includes mainly transcription factors (Supplemental material). This pattern contrasts with the localization of rapidly evolving mammalian genes to extracellular spaces (P < 4.51 × 10⁻¹⁰) and the plasma membrane (P < 4 × 10⁻³; Supplemental material). Such mammalian genes are mainly involved in host immune-response and receptor-mediated signal transduction (Table 3). Of the upper 10% most rapidly evolving mammalian proteins with annotation information, 104 of the 730 are characterized as immune/defense response genes (P < 1 × 10-41). A similar enrichment has been recently reported using domain information as a proxy for function, without suggesting statistical significance (Waterston et al. 2002). Interestingly, genes involved in pregnancy are also significantly overrepresented among rapidly evolving mammalian genes and include adrenomedullin, angiotensinogen I, indoleomine 2,3-dioxygenase, IgF receptor, neurokinin B, oviductin, and a prolactin precursor (P = 0.0098; Table 3).
Because database annotations are neither comprehensive nor necessarily unbiased in their coverage of gene function, we further probed gene function in mammals by determining the expression specificity of genes relative to 12 major organs and tissues using ∼500,000 mouse expressed sequence tags (ESTs) compiled from dbEST (Boguski et al. 1993); the sources included brain, kidney, heart, testis, lymph, spleen, liver, thymus, ovary/uterus, lung, colon, and muscle and included only normal, adult cDNA libraries. Genes with significant alignments to one or more of the 12 tissues were clustered after normalization using a self-organizing tree algorithm (Herrero et al. 2001) to assign expression specificity (see Methods).
The number of genes assigned to each tissue was variable; brain, kidney, and thymus contained the largest number of tissue-specific genes (n = 628, 576, and 445, respectively), whereas heart possessed the least (n = 27), and colon none (n = 0). This difference may indicate an actual disparity in the number of genes expressed in each tissue type or may reflect differences in tissue library quality and/or preparation methods. A correlation was found between cDNA library size and number of genes assigned to each tissue cluster but was not statistically significant (R2 = 0.49, P = 0.107).
We found a large variance in dN in almost all tissue clusters, likely a result of the sensitive threshold used in the EST alignment process, which was optimized to identify rare transcripts. Although there is significant overlap in confidence intervals for mean protein divergence for genes expressed in different mouse tissues, general trends are still apparent. First, we find that the genes with the highest divergence are those that are coexpressed in the thymus and spleen (dN = 0.142, 95% CI [0.107, 0.177]; Fig. 2; 95% confidence intervals determined by nonparametric bootstrap resampling with 1000 replicates). An accelerated mean rate of amino acid substitution is also seen in genes that are coexpressed in the ovary and uterus (dN = 0.122, 95% CI [0.093, 0.151]; Fig. 2). Interestingly, genes that are thymus- or testis-specific seem to evolve faster (dN = 0.058, 95% CI [0.044, 0.072]) than genes that are coexpressed in these same tissues (Fig. 2; Supplemental material).
Figure 2.
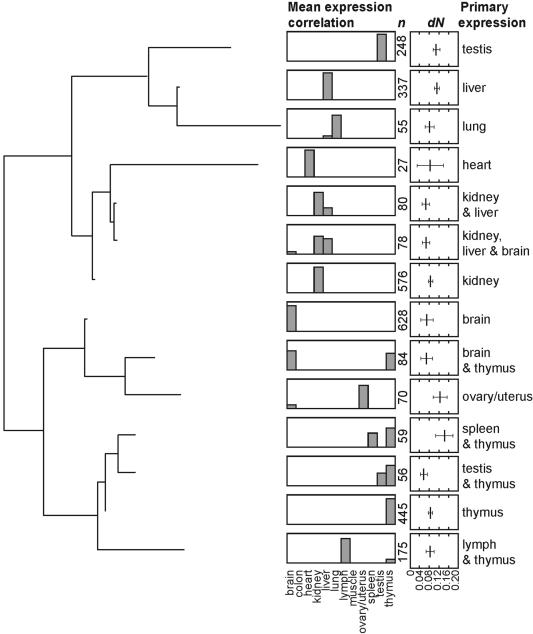
Tissue-specific gene expression SOTA tree and associated protein divergence estimates for genes expressed in each cluster. Histograms show the mean correlation coefficient for each tissue within a cluster and ranges from 0 to 1. Divergence is given in terms of dN; bars indicate 95% confidence intervals for each cluster as determined by nonparametric bootstrap replication, 1000 replicates.
Positive Versus Relaxed Selection in Rapidly Evolving Genes
Exceptionally rapid evolution of genes may be caused by relaxed selection or positive selection or both. To clarify the selective nature of the rapid divergence observed here, we used orthologous sequences from another murine species, Rattus norvegicus, to perform phylogenetic tests for positive selection (Yang 2002) in the mammalian lineage. Unfortunately, no suitable outgroup is yet available for nematodes. Of 2140 rat–mouse–human orthologs, 636 genes exhibited significant heterogeneity in dN/dS along the protein with one or more site classes possessing dN/dS > 1 (P < 0.01; model M0/M3; Methods). At least 606 of these genes show a significant signature of positive selection after correcting for multiple tests (P < 0.05; Methods); therefore, we examine the whole set here. This set of putatively positively selected genes exhibited a significant overrepresentation of gene functions similar to the 10% fastest evolving subset (Supplemental material). In fact, seven of the top 10 most significantly enriched molecular functions identified in the fast evolving set were enriched (P < 0.05, uncorrected) in the putative positively selected set, including the categories signal transduction, hematopoietin/interferon-class (D200-domain) cytokine receptor activity, interleukin receptor, cytokine binding, and transmembrane protein (Supplemental material). Additionally, among biological processes, immune response, response to wounding, and cell–cell adhesion appear significantly enriched (P < 0.05, uncorrected) in both the fast evolving and putative positively selected subsets (Table 3; Supplemental material). Similar results were found for cellular component annotations (Supplemental material).
To test more rigorously for positive selection among mammalian genes, we carried out a more conservative (Anisimova et al. 2001) likelihood ratio test (LRT) for positive selection for all 2140 human–mouse–rat orthologs: model M7 versus M8 (Yang 2002; Methods). This test compares the likelihood of the data under model M7 in which dN/dS among sites is constrained between 0 and 1, against model M8 in which an additional category of sites with dN/dS > 1 is allowed. If the log-likelihood of the model allowing dN/dS > 1 (positive selection) is significantly greater, adaptive evolution may be inferred. Although inferring positive selection at single amino acid sites under likelihood can be problematical (Anisimova et al. 2001; Suzuki and Nei 2002), simulation studies have shown that the LRT of M7 versus M8 is a robust test of positive selection, even for small phylogenies (Fig. 3; Anisimova et al. 2001; R. Nielsen, pers. comm.).
Figure 3.
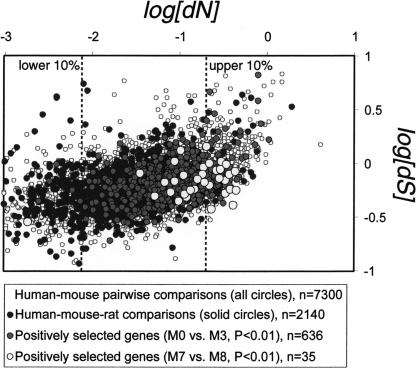
Scatterplot of dN versus dS for pairwise human–mouse comparison (all circles). Pairwise values of dN versus dS of the subset of genes tested for positive selection using rat sequences are shown as solid circles. Dark circles indicate genes putatively under positive selection according to the M0/M3 LRT criterion (P < 0.01). Light circles indicate genes putatively under positive selection according to the more conservative M7/M8 LRT criterion (P < 0.01).
Using this latter test, we find 36 loci with significant signatures of Darwinian selection (Table 4). Although this number is close to the number of expected false positives (30 loci are expected at P < 0.05; Methods), almost all of the functional categories that were significantly enriched among the 636 putatively positively selected genes above were represented among the 36 loci (Supplemental material). A significant proportion of these genes are immune-related (P = 0.005, uncorrected) and are involved in the adaptive response to pathogenic invasion (Trinchieri 2003), including T-cell surface glycoprotein CD4, carcinoembryonic antigen-related cell adhesion molecule 1, high affinity immunoglobulin epsilon receptor α-subunit, and the tumor necrosis factor ligand superfamily member 4. Eight of the 36 genes localize to the plasma membrane, including the previous four genes, suggesting that significant amounts of Darwinian selection in mammals takes place at the cellular border (Supplemental material).
Table 4.
Functional Characterization of Positively Selected Genes in Mammals
| Symbol | Locus Link ID | Highest dN/dSa | dNb | Description |
|---|---|---|---|---|
| CD86 | 942 | 21.9 | 0.46 | CD86 antigen |
| FCER1A | 2205 | 23.5 | 0.39 | Fc fragment of IgE |
| SPAM1 | 6677 | 99.9 | 0.38 | Sperm adhesion molecule 1 isoform 1 |
| TGM4 | 7047 | 79.2 | 0.35 | Transglutaminase 4 (prostate) |
| AKAP12 | 9590 | 82.9 | 0.30 | Kinase (PRKA) anchor protein |
| IAN4L1 | 55340 | 14.4 | 0.30 | Immune-associated nucleotide 4 like 1 |
| BRCA2 | 675 | 58.9 | 0.29 | Breast cancer 2 |
| CEACAM1 | 635 | 9.39 | 0.34 | Carcinoembryonic antigen-related cell adhesion |
| LAMP2 | 3920 | 10.5 | 0.24 | Lysosomal-associated membrane precursor |
| LGALS2 | 3957 | 21.8 | 0.22 | Lectin, galactoside-binding (galectin 2) |
| LGALS9 | 3965 | 26.9 | 0.20 | Galectin 9 |
| ITGAX | 3687 | 10.4 | 0.19 | Cell surface glycoprotein CD11c precursor |
| LOC222674 | NA | 42.4 | 0.17 | HLA class II histocompatibility antigen |
| COL5A3 | 50509 | 75.9 | 0.14 | Collagen, type V, α 3 preproprotein |
| ROS1 | 6098 | 30.1 | 0.12 | Proto-oncogene c-ros-1 protein precursor |
| AKR1D1 | 6718 | 41.6 | 0.12 | Steroid-5-β-reductase |
| CTSS | 1520 | 2.8 | 0.15 | Cathepsin S |
| NDUFV3 | 4731 | 9.3 | 0.44 | NADH dehydrogenase (ubiquinone) flavoprotein 3 |
| TSAP6 | 55240 | 71.8 | 0.09 | Dudulin 2; tumor suppressor pHyde |
| PLCE1 | 51196 | 12.6 | 0.08 | Pancreas-enriched phospholipase C |
| CAPN5 | 726 | 22.5 | 0.04 | Calpain 5 |
| RHCE | 6006 | 2.0 | 0.34 | Rh blood group antigen Evans |
| HF1 | 3075 | 63.7 | 0.27 | H factor 1, binds adrenomedullin |
| FMO1 | 2326 | 50.4 | 0.30 | Flavin-containing monooxygenase 1 |
| PGR | 5241 | 77.9 | 0.11 | Progesterone receptor |
| TIMELESS | 8914 | 5.3 | 0.09 | Timeless homolog |
| PCCA | 5095 | 7.91 | 0.05 | Similar to propionyl-coenzyme A carboxylase |
| SLC7A1 | 6541 | 9.5 | 0.07 | Solute carrier family 7 |
| THBD | 7056 | 6.7 | 0.21 | Thrombomodulin |
| TNTSF4 | 7292 | 6.3 | 0.42 | Tumor necrosis factor (ligand) superfamily |
| CMKLR1 | 1240 | 2.6 | 0.01 | Chemokine-like receptor 1 |
| AKT3 | 10000 | 3.6 | 0.0019 | Protein kinase B γ |
| CD4 | 920 | 3.1 | 0.38 | CD4 antigen (p55) |
| IBSP | 3381 | 9.0 | 0.19 | Similar to bone sialoprotein |
| CASP8 | 841 | 4.84 | 0.23 | Caspase 8 isoform B |
| MACF1 | 23499 | 8.82 | NA | Microfilament and actin cross-linking factor |
Largest site class with dN/dS > 1 as among human—mouse—rat orthologs under M8 model (Yang 2002)
dN as estimated from human—mouse pairwise comparisons
Functional Analysis of Slowly Evolving Genes
Slowly evolving genes in both the mammalian and nematode lineages (10% lowest dN) exhibited a significant overrepresentation of genes involved in core molecular processes such as protein biosynthesis, translational regulation, mRNA splicing, and small GTPase-mediated signal transduction (Tables 2 and 3). Protein biosynthesis, protein metabolism and modification, protein transport, and ubiquitin-dependent protein degradation are all overrepresented among slow evolving genes in mammals (all P ≪ 1 × 10⁻⁴). Likewise in the nematode lineage, protein biosynthesis, protein transport, and protein metabolism and modification are significantly overrepresented (all P ≪ 1 × 10⁻⁴). Genes involved in the regulation of transcriptional processing are also conserved in both lineages. In mammals, 17 of 730 conserved genes are involved in mRNA processing (P ≪ 4 × 10⁻⁴), and in worms, 5 of 7 out of 753 conserved orthologs are similarly involved in this process (P = 0.05). More general biological processes that are overrepresented among conserved genes in both mammalian and nematode lineages, respectively, include metabolism (265/730, P = 0.01; 189/753, P ≪ 1 × 10⁻⁴) and cell growth and maintenance (151/730, P = 0.001; 94/753, P ≪ 1 × 10⁻⁴). Finally, whereas signal transducers are overrepresented among rapidly evolving mammalian genes, one component of signal transduction, GTPase-mediated signal transduction, contains genes that are extremely conserved in both the mammalian (30/730, P ≪ 1 × 10⁻⁴) and nematode lineages (23/753, P ≪ 1 × 10⁻⁴).
Considering that genes under strong purifying selection may also be sensitive to insertion/deletion mutations in addition to amino acid replacements, we repeated our functional analysis using genes that show low levels of indel mutation, namely, the 2403 mammalian and 1352 nematode orthologs in which indels were completely absent. With this second measure of sequence conservation, functional analysis using database annotations once again reveals an enrichment of genes involved in core molecular processes in both mammalian and nematode lineages (Supplemental material). Enriched functional categories common to orthologs without indels and the 10% most conserved subset include protein biosynthesis, protein transport, and GTPase-mediated signal transduction. Additionally, we observed an overrepresentation of slow evolving proteins localized to the cytoplasm in general and the mitochondrial inner membrane and ribosome in particular, in both lineages (Supplemental material). Interestingly, among genes with no indel mutations, the mammalian lineage showed an overrepresentation of genes localized to the Golgi apparatus: 62 of the 105 genes known to be localized to this organelle (P < 2 × 10⁻⁴). The nematode lineage showed no such enrichment, although it should be noted that only 12 worm genes are known to be localized to the Golgi apparatus.
Probing the function of slow-evolving genes using the EST-based tissue expression data, we find that genes coexpressed in the thymus and testis exhibit the lowest mean level of protein evolution (dN = 0.058, 95% CI [0.044, 0.072], n = 56; Fig. 2). Genes expressed primarily in the brain represent the largest tissue-specific expression cluster and were found to have, on average, the second lowest level of nonsynonymous substitution (dN = 0.065, 95% CI [0.056, 0.073], n = 628; Fig. 2). Of these 628 genes, 86 (17%) are found among the 10% slowest-evolving genes in the genome (n = 734), whereas only 30 (5%) are found among the 10% fastest evolving subset (n = 734), indicating a significant concordance between the annotation data and the EST data (P < 0.001 by χ2, 2 × 2 contingency table). At the same time, brain-specific genes exhibit a very large variance in rates of protein evolution. The particularly high variance is further illustrated by the observation that two genes from the brain-expressed cluster are among the 36 orthologs identified as under positive selection according to the conservative M7/M8 likelihood ratio test (Yang 2002).
DISCUSSION
Our main objective was to compare the functional categories of protein evolution in two distinct animal lineages in order to test two hypotheses. The first hypothesis is that rates of divergence are distributed similarly among various functional classes within mammalian and nematode lineages, indicating that selective pressures on the proteome are largely independent of organismic-level biological requirements. Alternatively, rates of divergence may be distributed differently among various functional classes within different phyla, implying that lineage-specific selective regimes do have an impact on proteome-wide substitutional patterns. Our results indicate that strong purifying selection acts on the same core cellular processes in both mammalian and nematode lineages, whereas positive and/or relaxed selection acts on different biological processes in each lineage. At the same time, the protein categories with accelerated evolution observed in both lineages occur primarily among components of molecular systems susceptible to coevolutionary change.
Rapid Protein Divergence and Coevolution
Rapid evolutionary change appears to affect different types of molecular functions and biological processes in each lineage. In worms, genes involved in transcriptional regulation, primarily DNA-binding transcription factors, are overrepresented among fast evolving genes in the genome. In mammals, a diversity of processes is overrepresented among fast evolving genes, including signal transduction, immunity, and pregnancy. What might these process have in common? One similarity is that all of these genes are components of systems where (potentially) specific molecular interactions must occur, either protein–protein interactions, protein–DNA interactions, or protein–ligand interactions. Such systems are prime candidates for either passive or active coevolution among their members, which may result in an acceleration of protein divergence. For example, within a genome, genetic drift and compensatory mutation among interacting proteins may result in a passive mode of coevolutionary change (Carter and Wagner 2002). Between genomes, accelerated evolution may result from a genetic “arms race” between host and pathogen (Fitch et al. 1991; Gray and Gill 1993), between or among the sexes because of sexual selection (Singh and Kulathinal 2000; Wyckoff et al. 2000; Swanson and Vacquier 2002; Torgerson et al. 2002), or between mother and fetus because of genomic conflicts (Haig 1993, 1996).
Passive coevolution has been experimentally demonstrated for at least one locus, bicoid, in which a transcription factor and its cis-acting DNA-binding site coevolve in a lineage-specific manner, most likely because of a combination of genetic drift and compensatory mutation (Shaw et al. 2002). Such coevolutionary drift may act to increase rates of protein evolution in transcription factors because it will occur differently in different lineages, particularly in organisms with large population sizes and short generation times (Carter and Wagner 2002). Indeed, in worms, which have both large population sizes and short generation times, we find that 58 of the 892 fastest evolving genes in the genome are involved in DNA-dependent transcriptional regulation (P = 2 × 10⁻⁶), and 46 of these are known to be transcription factors (P = 0.0001). (A larger population size and shorter generation time of worms may also account for the almost threefold higher synonymous divergence of nematodes relative to the mammalian lineage with nonsynonymous divergence remaining similar.) Although the mammalian data do not show such an enrichment for transcription factors, receptors and ligands involved in signal transduction are overrepresented among the fastest evolving genes between human and mouse, and these may be similarly subject to passive coevolution (Table 3).
Active coevolution between genomes may also drive accelerated evolution in mammals because of the presence of genetic conflict between host and pathogen. Among the fastest evolving genes in the human genome, we find an enrichment of disease-resistance genes (Table 3), many of which show evidence for positive selection (Table 4). In fact, nearly one-fifth of the top 10% fastest evolving genes in mammals are immune-related (Table 3). Whereas previous studies have demonstrated a handful of immune-related loci, such as MHC Class I and II, diverge rapidly by natural selection (Hughes and Nei 1988, 1989), or have qualitatively identified immune-related loci as fast evolving (Waterston et al. 2002), the present study identifies host-defense genes as the most statistically significant fraction of the human genome undergoing rapid evolution, appearing to be mediated, in many cases, by positive Darwinian selection. The relationship between rapid evolution and immune function is further supported by the EST-based gene expression data. Thymus and spleen coexpress genes important for fighting infection, and this particular cluster exhibits the highest mean rate of protein evolution of all tissue/organ expression clusters. This finding is consistent with the observation that fast evolving genes are immunerelated as observed using annotation data alone. Of the 59 genes present in the thymus–spleen expression cluster, only three (5%) are found among the 10% most conserved subset, whereas 16 (27%) are found in the 10% most diverged subset. At the same time, genes expressed specifically in the thymus, lymph, or both, exhibit only an intermediate level of mean protein divergence (Supplemental material).
Whereas host–parasite interactions are thought to drive the rapid evolution of disease-resistance genes, conflict between or among the sexes, including sperm competition and sexual conflict (Swanson and Vacquier 2002), is thought to drive accelerated rates of protein evolution in reproductive proteins. Spermspecific proteins involved in penetration of the egg vitelline envelope have been shown to undergo rapid evolution in marine invertebrates (Metz and Palumbi 1996; Swanson and Vacquier 1998), and the rapid evolution of other sperm-related proteins has been demonstrated in mammals including humans (Wyckoff et al 2000; Torgerson et al. 2002). Here, among genes identified to be evolving via positive selection using the M7/M8 likelihood ratio test, we find the sperm adhesion molecule, SPAM1, which is involved in meditating sperm binding to the zona pellucida (Lathrop et al. 1990) and penetration of the cumulus cell layer surrounding the egg (Lin et al. 1994; Table 4). Recently, SPAM1 has also been implicated in transmission segregation distortion in mice (Zheng et al. 2001), raising the possibility that this locus may too be involved in meiotic drive and genomic conflict.
One type of genomic conflict involves an evolutionary conflict between maternal and paternal genomes caused by competing selective optima between the sexes (Trivers 1974; Rice 1984), particularly in species with maternal development of young (viviparity) and polyandry (Haig 1993, 1996). Genes involved in mediating maternal–fetal interactions, in particular, those involved in the allocation of nutrients to the developing fetus via the maternal blood supply, are thought to be candidates for intense maternal–fetal genomic conflict. Among the fastest evolving genes in the mammalian genome, we find a significant overrepresentation of genes involved in pregnancy (P = 0.007; Table 3), including the oviductal glycoprotein oviductin, known to play a role in fertilization (Lok et al. 2002), and the Fc fragment of the fetal IgG protein involved in conferring maternal-to-neonatal immunity. Prolactin and its target, the prolactin receptor, involved in milk production, are also found in this subset. The four remaining genes are implicated in the control of fetal nutrient allocation: adrenomedullin is a potent hypotensive agent and vasodilator that controls fluid and electrolyte concentration in the blood (DiIorio et al. 2003), angiotensinogen I is involved in increasing maternal blood pressure (Cross 2003), and neurokinin B is a potent vasodilator (Page et al. 2000) that is activated in response to increasing fetal needs. Neurokinin B, angiotensinogen I, and another rapidly evolving pregnancy gene, indoleamine 2,3-dioxygenase, have been implicated in preeclampsia (Page et al. 2000; Procopciuc et al. 2002)—pregnancy-induced hypertension, proposed to be the outcome of an imbalanced genomic conflict (Haig 1993, 1996).
These results, taken together, suggest that the dynamic evolutionary interplay between coevolving proteins is a potent force driving rapid evolution in mammalian genomes, whether between parasite and host as seen in disease-response genes, between competing genotypes involved in reproduction, or between mother and fetus because of genomic conflict. In contrast, the passive coevolution of DNA-binding proteins and their corresponding DNA-binding sites may explain the rapid evolution of transcription factors in the nematode lineage, perhaps reflecting their large population size and short generation time. In both cases however, coevolutionary processes play a central role in accelerated protein evolution within the genomes of animals in each lineage.
Shared Constraints Across Phyla
Despite the fact that nematodes and mammals have not shared a common ancestor for more than 550 million years, representative pairs of species in each lineage that diverged from each other ∼80–90 Mya show similar functional genomic patterns of purifying selection. Genes involved in the core cellular processes of transcription, translation, protein transport, and GTPase-mediated signaling are highly conserved in both lineages, a pattern that is robust when examined from the point of view of amino acid substitution rates or insertion/deletion mutations. Why?
One possibility is that such proteins are so critical to the biology of every cell that almost any genetic perturbation has considerable deleterious consequences. If so, changes, however slight, will be eliminated, especially if they affect the process of development, where genetic perturbations have many downstream consequences (Riedl 1978; Arthur 1988; Raff 1996). There is some genetic evidence for developmental constraint against genetic perturbations. For example, genes vital for embryogenesis appear to evolve more slowly than those not vital for embryogenesis in C. elegans, based on genome-wide RNAi data (Castillo-Davis and Hartl 2003b), and there is a paucity of duplicate genes among genes expressed during early development (Castillo-Davis and Hartl 2002).
Here we find that genes involved in “embryogenesis and morphogenesis” (GO0007345) constitute the most significantly overrepresented category among slowly evolving nematode genes. Mammals do not share this enrichment. This discrepancy may be due to differences in the annotation density of genes involved in development in these two lineages: In C. elegans, 735 genes are annotated as involved in embryogenesis and morpho-genesis versus only 119 genes in human. This is not surprising because defects in embryogenesis caused by specific genetic mutations are easier to identify in nematodes.
If we examine the molecular function of the 119 slowly evolving nematode genes involved in embryogenesis and morphogenesis, we find some overlap with the slow evolving core cellular machinery discussed above: 19 genes are structural constituents of the ribosome, eight show GTP-binding activity, and five show translation elongation factor activity. The remainder, however, exhibit a diversity of molecular functions (Supplemental material). Thus, it appears that only some genes involved in core cellular processes are slowly evolving because of their crucial role in development. The remainder may simply be under strong postembryonic purifying selection. Although mutations in genes involved in core molecular processes may not have a visible impact on embryogenesis or morphogenesis as currently assayed, such mutations are likely to have considerable pleiotropic consequences that negatively affect adult fitness.
Conclusions
An understanding of how evolutionary processes have shaped organisms involves an analysis of patterns of divergence at the molecular level. We find that slowly evolving proteins are found in the same functional classes within the mammalian and nematode lineages. Genes involved in core cellular processes such as transcription, translation, and protein transport are highly conserved in both lineages, indicating strong selection pressure on these functions. Additionally, in worms, where annotated developmental genes are more numerous, we find an overrepresentation of genes crucial for embryogenesis and morphogenesis among slowly evolving genes. Because there is little overlap between the set of genes involved in core molecular processes and those that have a visible impact on embryogenesis, it is likely the former evolve slowly because of strong, postembryonic selection.
At the opposite end of the divergence spectrum, we observe that fast evolving proteins are distributed heterogeneously among functional classes in mammalian and nematode lineages, indicating that lineage-specific selective regimes primarily affect fast evolving proteins in animal genomes. Such rapidly evolving genes are largely components of passive or active coevolving systems, either within or between genomes. Sexual selection, maternal–fetal conflict, and host–parasite interactions act to shape the fastest evolving portions of the mammalian genome. On the other hand, passive coevolution between transcription factors and their DNA-binding sites seems to account for the fastest evolving portion of the genome in nematodes, most likely facilitated by the large population size and short generation time of these organisms. These results point to a complex and reciprocal relationship between genome and organismal evolution, whereby selection, gene function, and the process of development interact to produce unique but coherent patterns of divergence across the proteome in different animal lineages. Further studies should reveal to what extent these patterns hold across all metazoan phyla.
METHODS
Protein Sequence Analysis
Unique full coding sequences (CDS) from the genomes of H. sapiens (McPherson et al. 2001), M. musculus (Waterston et al. 2002), and R. norvegicus (Rat Genome Sequencing Project Consortium 2004) were obtained from GenBank (http://www.ncbi.nlm.nih.gov). C. elegans (The C. elegans Sequencing Consortium 1998) and C. briggsae (Sanger Institute and Genome Sequencing Center, Washington University, St. Louis, 2003, unpubl.) CDS were obtained from WormBase (http://wormbase.org). No alternative splice forms were included. The method of reciprocal best hits (Tatusov et al. 1997) using BLASTP was used to establish sets of orthologs among human, mouse, and rat and between the two nematode species (matches were deemed significant if E < 10-20).
Orthologs were globally aligned by CLUSTALW (Thompson et al. 1994; default parameters) using amino acid translations, followed by back-translations into nucleotides. Maximum likelihood estimates of nonsynonymous substitution (dN) and synonymous substitution (dS) between pairwise alignments were calculated using a codon-based model of sequence evolution (PAML; Yang 2002) with the dN, dS, and transition/transversion ratio (κ) estimated as free parameters and codon frequencies estimated from the data at each codon position (F3 × 4 model; Goldman and Yang 1994; Yang 2002). Based on the results of simulations using random sequence pairs, orthologs with dS > 3 or κ > 10 were excluded from the analysis, as these values indicate the sequences are likely misidentified as orthologous (>90% of random gene pairs have dS > 3 and κ > 10; data not shown).
Because highly expressed genes may be subject to codon bias, particularly in nematodes (Duret and Mouchiroud 1999; Castillo-Davis and Hartl 2002), and may result in underestimates of the synonymous substitution rate even with likelihood methods (Dunn et al. 2001), we used dN as the principal indicator of protein divergence to categorize fast and slow evolving orthologs. However, similar results were found using the ratio dN/dS (data not shown).
Likelihood ratio tests for positive selection among human, mouse, and rat lineages were performed by comparing twice the difference in log-likelihood between models M0 and M3 and also M7 and M8 in PAML v3.13 (Yang 2002). For either test, positive selection was inferred if both 2(ln L1 - ln L2) ≥ 9.21, corresponding to P < 0.01 (∼χ2 df = 2), and dN/dS was greater than unity in at least one of the site classes. To examine the impact of multiple tests, we estimated the probability of obtaining more than k false positives (FP) using the binomial distribution:
 |
where n is the number of genes tested, k is the number of false positives, p is the expected rate of FPs, and q = (1 - p). If we expect an FP rate of 1%, then p = 0.01. Because 2140 genes were examined, n = 2140. If we demand that P < 0.05, then k = 30, and thus 30 genes are expected to show a signature of positive selection by chance alone at this stringency. Insertion/deletion events were quantified in terms of the indel fraction, defined as the total number of amino acid gaps between the two orthologs divided by the total length of the alignment.
Annotation-Based Functional Analysis
The statistical enrichment of various functional classes among slow and fast evolving genes was evaluated using GeneMerge (Castillo-Davis and Hartl 2003a; http://www.oeb.harvard.edu/hartl/lab/publications/GeneMerge.html) with the informatics resources of the Gene Ontology Consortium (Ashburner et al. 2000; http://www.geneontology.org). GenBank protein IDs were matched with TrEMBL (http://us.expasy.org) IDs used in the Gene Ontology database; some matches could not be found, resulting in slightly different numbers used in the functional analysis. Bonferroni-corrected results after assaying the entire hierarchy within each GO category (molecular function, biological process, and cellular component) are reported unless otherwise noted.
EST-Based Functional Analysis in Mammals
We used the extensive set of mouse ESTs to further characterize rapidly evolving and constrained genes in mammals. EST data were obtained from cDNA libraries available at NCBI (http://www.ncbi.nlm.nih.gov). A total of 470,176 ESTs from 12 normal adult tissues representing 87 separate cDNA libraries were collected, and alignments were evaluated against each of 7300 mouse genes using BLASTN v2.1.2 (Altschul et al. 1997). Repeat-Masker (A.F.A. Smit and P. Green, unpubl.; ftp://ftp.genome.washington.edu/RM/RepeatMasker.html) was used to filter out repetitive sequences. Gene-to-EST alignments >100 bp and >90% identity with E < 10-20 were considered significant. Genes with significant hits to ESTs (n = 4396) were then normalized and clustered into tissue-specific groups using a Self Organizing Tree Algorithm (SOTA) with a linear correlation coefficient and a variability threshold of 80% (Herrero et al. 2001). Clusters represent genes that have similar expression patterns across tissues. Large terminal clusters of genes (n ≥ 20) were reclustered using the original EST data, resulting in a data set of 2642 clustered genes. Mean divergence estimates were then calculated for each cluster with confidence intervals estimated by means of nonparametric bootstrap resampling with 1000 replicates.
As a biological check on the validity of our clustering methodology, we used GeneMerge (Castillo-Davis and Hartl 2003a) (1) to determine the known functions, if any, of genes classified as tissue-specific for each tissue and (2) to ask whether there was a statistically significant overrepresentation of particular functions in each tissue. Database annotations for human genes in all three categories designated by the Gene Ontology Consortium (Ashburner et al. 2000) were used with GeneMerge. Bonferroni-corrected P-values are reported unless otherwise noted.
We found good agreement between the EST-based tissue-specific gene expression clustering and expected biological and molecular functions for individual tissues. For example, brain-specific transcripts showed an overrepresentation of genes involved in the γ-aminobutyric acid signaling pathway (P < 0.004) and synaptic transmission (P < 0.03), whereas heart tissue showed an overrepresentation of genes involved in muscle development (P < 0.0002). Likewise, thymus exhibited an overrepresentation of genes involved in immune response (P = 0.009, uncorrected), and kidney an overrepresentation of genes involved in sodium ion transport (P = 0.0008, uncorrected) and intracellular protein transport (P = 0.002, uncorrected). Of the 10 genes known to be involved in spermatogenesis within the 2642 clustered genes, six were found to be testis-specific according to our methods (P < 0.004). Liver-expressed genes included genes involved in steroid biosynthesis (P = 0.002, uncorrected), xenobiotic metabolism (P = 0.009, uncorrected), gluconeogenesis (P = 0.01, uncorrected), and bile acid metabolism (P = 0.01, uncorrected).
Genes that are significantly expressed in more than one tissue showed a more diverse enrichment of gene function. For example, genes coexpressed in the kidney and liver showed an overrepresentation of genes involved in the tricarboxylic acid cycle (P < 0.01) and amino acid biosynthesis (P < 0.04), whereas genes coexpressed in lymph and thymus exhibited an overrep-resentation of genes involved in protein amino acid dephosphorylation, cellular defense response, and mitosis (P < 0.05 for all, uncorrected).
Acknowledgments
We thank all members of the Hartl lab for their friendly support and Guillaume Achaz for valuable comments. We also thank the Sanger Institute and the Genome Sequencing Center at Washington University, St. Louis and Lincoln Stein for providing unfinished C. briggsae sequence. Special thanks to the Bauer Center for Genomics Research at Harvard University and Gordon Kindlmann at the University of Utah Scientific Computing and Imaging Institute for computational resources. R.J.K. is financially supported by a postdoctoral fellowship from the Natural Sciences and Engineering Research Council of Canada.
The publication costs of this article were defrayed in part by payment of page charges. This article must therefore be hereby marked “advertisement” in accordance with 18 USC section 1734 solely to indicate this fact.
Article and publication are at http://www.genome.org/cgi/doi/10.1101/gr.2195604.
Footnotes
[Supplemental material is available online at www.genome.org. The following individuals kindly provided reagents, samples, or unpublished information as indicated in the paper: the Sanger Institute and the Genome Sequencing Center at Washington University, St. Louis; and L. Stein.]
References
- Altschul, S.F. and Lipman, D.J. 1990. Protein database searches for multiple alignments. Proc. Natl. Acad. Sci. 87: 5509-5513. [DOI] [PMC free article] [PubMed] [Google Scholar]
- Altschul, S.F., Madden, T.L., Schaffer, A.A., Zhang, J., Zhang, Z., Miller, W., and Lipman, D.J. 1997. Gapped BLAST and PSI-BLAST: A new generation of protein database search programs. Nucleic Acids Res. 25: 3389-3402. [DOI] [PMC free article] [PubMed] [Google Scholar]
- Anisimova, M., Bielawski, J.P., and Yang, Z. 2001. Accuracy and power of the likelihood ratio test in detecting adaptive molecular evolution. Mol. Biol. Evol. 18: 1585-1589. [DOI] [PubMed] [Google Scholar]
- Arthur, W. 1988. A theory of the evolution of development. John Wiley & Sons, Chichester, UK.
- Ashburner, M., Ball, C.A., Blake, J.A., Botstein, D., Butler, H., Cherry, J.M., Davis, A.P., Dolinski, K., Dwight, S.S., Eppig, J.T., et al. 2000. Gene ontology: Tool for the unification of biology. The Gene Ontology Consortium. Nat. Genet. 25: 25-29. [DOI] [PMC free article] [PubMed] [Google Scholar]
- Boguski, M.S., Lowe, T.M., and Tolstoshev, C.M. 1993. dbEST: Database for “expressed sequence tags.” Nat. Genet. 4: 332-333. [DOI] [PubMed] [Google Scholar]
- The C. elegans Sequencing Consortium. 1998. Genome sequence of the nematode C. elegans: A platform for investigating biology. Science 282: 2012-2018. [DOI] [PubMed] [Google Scholar]
- Carter, A.J. and Wagner, G.P. 2002. Evolution of functionally conserved enhancers can be accelerated in large populations: A populationgenetic model. Proc. R Soc. Lond. B Biol. Sci. 269: 953-956. [DOI] [PMC free article] [PubMed] [Google Scholar]
- Castillo-Davis, C.I. and Hartl, D.L. 2002. Genome evolution and developmental constraint in Caenorhabditis elegans. Mol. Biol. Evol. 19: 728-735. [DOI] [PubMed] [Google Scholar]
- ———. 2003a. GeneMerge-post-genomic analysis, data mining, and hypothesis testing. Bioinformatics 19: 891-892. [DOI] [PubMed] [Google Scholar]
- ———. 2003b. Conservation, relocation and duplication in genome evolution. Trends Genet. 19: 593-597. [DOI] [PubMed] [Google Scholar]
- Coghlan, A. and Wolfe, K.H. 2002. Fourfold faster rate of genome rearrangement in nematodes than in Drosophila. Genome Res. 12: 857-866. [DOI] [PMC free article] [PubMed] [Google Scholar]
- Cross, J.C. 2003. The genetics of pre-eclampsia: A feto-placental or maternal problem? Clin. Genet. 64: 96-103. [DOI] [PubMed] [Google Scholar]
- DiIorio, R., Marinoni, E., Letizia, C., and Cosmi, E.V. 2003. Adrenomedullin in perinatal medicine. Regul. Pept. 112: 103-113. [DOI] [PubMed] [Google Scholar]
- Dunn, K.A., Bielawski, J.P., and Yang, Z. 2001. Substitution rates in Drosophila nuclear genes: Implications for translational selection. Genetics 157: 295-305. [DOI] [PMC free article] [PubMed] [Google Scholar]
- Duret, L. and Mouchiroud, D. 1999. Expression pattern and, surprisingly, gene length shape codon usage in Caenorhabditis, Drosophila, and Arabidopsis. Proc. Natl. Acad. Sci. 96: 4482-4487. [DOI] [PMC free article] [PubMed] [Google Scholar]
- Fisher, R.A. 1930. The genetical theory of natural selection. Clarendon Press, Oxford, UK.
- Fitch, W.M., Leiter, J.M.E., Li, X.Q., and Palese, P. 1991. Positive Darwinian evolution in human Influenza-a viruses. Proc. Natl. Acad. Sci. 88: 4270-4274. [DOI] [PMC free article] [PubMed] [Google Scholar]
- Goldman, N. and Yang, Z. 1994. A codon-based model of nucleotide substitution for protein-coding DNA sequences. Mol. Biol. Evol. 11: 725-736. [DOI] [PubMed] [Google Scholar]
- Gray, G.D. and Gill, H.S. 1993. Host genes, parasites and parasitic infections. Intl. J. Parasitology 23: 485-494. [DOI] [PubMed] [Google Scholar]
- Haig, D. 1993. Genetic conflicts in human pregnancy. Q Rev. Biol. 68: 495-532. [DOI] [PubMed] [Google Scholar]
- ———. 1996. Altercation of generations: Genetic conflicts of pregnancy. Am. J. Reprod. Immunol. 35: 226-232. [DOI] [PubMed] [Google Scholar]
- Haldane, J.B.S. 1932. The causes of evolution. Longmans and Green, London.
- Herrero, J., Valencia, A., and Dopazo, J. 2001. A hierarchical unsupervised growing neural network for clustering gene expression patterns. Bioinformatics 17: 126-136. [DOI] [PubMed] [Google Scholar]
- Hughes, A.L. and Nei, M. 1988. Pattern of nucleotide substitution at major histocompatibility complex class-I loci reveals overdominant selection. Nature 335: 167-170. [DOI] [PubMed] [Google Scholar]
- ———. 1989. Nucleotide substitution at major histocompatibility complex class-II loci—Evidence for overdominant selection. Proc. Natl. Acad. Sci. 86: 958-962. [DOI] [PMC free article] [PubMed] [Google Scholar]
- Kimura, M. 1968. Evolutionary rate at the molecular level. Nature 217: 624-626. [DOI] [PubMed] [Google Scholar]
- Lander, E.S., Linton, L.M., Birren, B., Nusbaum, C., Zody, M.C., Baldwin, J., Devon, K., Dewar, K., Doyle, M., FitzHugh, W., et al. 2001. Initial sequencing and analysis of the human genome. Nature 409: 860-892. [DOI] [PubMed] [Google Scholar]
- Lathrop, W.F., Carmichael, E.P., Myles, D.G., and Primakoff, P. 1990. cDNA cloning reveals the molecular structure of a sperm surface protein PH-20, involved in sperm–egg adhesion and the wide distribution of its gene among mammals. J. Cell Biol. 111: 2939-2949. [DOI] [PMC free article] [PubMed] [Google Scholar]
- Li, W.H. and Graur, D. 1997. Molecular evolution. Sinauer Associates Inc., Sunderland, MA.
- Li, W.H., Gouy, M., Sharp, P.M., O'Huigin, C., and Yang, Y.W. 1990. Molecular phylogeny of Rodentia, Lagomorpha, Primates, Artiodactyla, and Carnivora and molecular clocks. Proc. Natl. Acad. Sci. 87: 6703-6707. [DOI] [PMC free article] [PubMed] [Google Scholar]
- Lin, Y., Mahan, K., Lathrop, W.F., Myles, D.G., and Primakoff, P. 1994. A hyaluronidase activity of the sperm plasma membrane protein PH-20 enables sperm to penetrate the cumulus cell layer surrounding the egg. J. Cell Biol. 125: 1157-1163. [DOI] [PMC free article] [PubMed] [Google Scholar]
- Lok, I.H., Briton-Jones, C.M., Yuen, P.M., and Haines, C.J. 2002. Variable expression of oviductin mRNA at different stages of human reproductive cycle. J. Assist. Reprod. Genet. 19: 19569-19576. [DOI] [PMC free article] [PubMed] [Google Scholar]
- Makalowski, W. and Boguski, M.S. 1998. Evolutionary parameters of the transcribed mammalian genome: An analysis of 2,820 orthologous rodent and human sequences. Proc. Natl. Acad. Sci. 95: 9407-9412. [DOI] [PMC free article] [PubMed] [Google Scholar]
- McPherson, J.D., Marra, M., Hillier, L., Waterston, R.H., Chinwalla, A., Wallis, J., Sekhon, M., Wylie, K., Mardis, E.R., Wilson, R.K., et al. 2001. A physical map of the human genome. Nature 409: 934-941. [DOI] [PubMed] [Google Scholar]
- Metz, E.C. and Palumbi, S.R. 1996. Positive selection and sequence rearrangements generate extensive polymorphism in the gamete recognition protein bindin. Mol. Biol. Evol. 13: 397-400. [DOI] [PubMed] [Google Scholar]
- Mural, R.J., Adams, M.D., Myers, E.W., Smith, H.O., Miklos, G.L., Wides, R., Halpern, A., Li, P.W., Sutton, G.G., Nadeau, J., et al. 2002. A comparison of whole-genome shotgun-derived mouse chromosome 16 and the human genome. Science 296: 1661-1671. [DOI] [PubMed] [Google Scholar]
- Page, N.M., Woods, R.J., Gardiner, S.M., Lomthaisong, K., Gladwell, R.T., Butlin, D.J., Manyonda, I.T., and Lowry, P.J. 2000. Excessive placental secretion of neurokinin B during the third trimester causes pre-eclampsia. Nature 405: 797-800. [DOI] [PubMed] [Google Scholar]
- Procopciuc, L., Jebeleanu, G., Surcel, I., and Puscas, M. 2002. Angiotensinogen gene M235T variant and pre-eclampsia in Romanian pregnant women. J. Cell. Mol. Med. 6: 383-388. [DOI] [PMC free article] [PubMed] [Google Scholar]
- Raff, R.A. 1996. The shape of life. University of Chicago Press, Chicago.
- Rat Genome Sequencing Project Consortium. 2004. Genome sequence of the Brown Norway rat yields insights into mammalian evolution. Nature 428: 493-521. [DOI] [PubMed] [Google Scholar]
- Rice, W.R. 1984. Sex chromosomes and the evolution of sexual dimorphism. Evolution 38: 735-742. [DOI] [PubMed] [Google Scholar]
- Riedl, R. 1978. Order in living organisms. Wiley, New York.
- Shaw, P.J., Wratten, N.S., McGregor, A.P., and Dover, G.A. 2002. Coevolution in bicoid-dependent promoters and the inception of regulatory incompatibilities among species of higher Diptera. Evol. Dev. 4: 265-277. [DOI] [PubMed] [Google Scholar]
- Singh, R.S. and Kulathinal, R.J. 2000. Sex gene pool evolution and speciation: A new paradigm. Genes Genet. Syst. 75: 119-130. [DOI] [PubMed] [Google Scholar]
- Springer, M.S., Murphy, W.J., Eizirik, E., and O'Brien, S.J. 2003. Placental mammal diversification and the Cretaceous–Tertiary boundary. Proc. Natl. Acad. Sci. 100: 1056-1061. [DOI] [PMC free article] [PubMed] [Google Scholar]
- Stein, L.D., Bao, Z., Blasiar, D., Blumenthal, T., Brent, M.R., Chen, N., Chinwalla, A., Clarke, L., Clee, C., Coghlan, A., et al. 2003. The genome sequence of Caenorhabditis briggsae: A platform for comparative genomics. PLoS Biol. 1: E45. [DOI] [PMC free article] [PubMed] [Google Scholar]
- Suzuki, Y. and Nei, M. 2002. Simulation study of the reliability and robustness of the statistical methods for detecting positive selection at single amino acid sites. Mol. Biol. Evol. 19: 1865-1869. [DOI] [PubMed] [Google Scholar]
- Swanson, W.J. and Vacquier, V.D. 1998. Concerted evolution in an egg receptor for a rapidly evolving abalone sperm protein. Science 281: 710-712. [DOI] [PubMed] [Google Scholar]
- ———. 2002. The rapid evolution of reproductive proteins. Nat. Rev. Genet. 3: 137-144. [DOI] [PubMed] [Google Scholar]
- Tatusov, R.L., Koonin, E.V., and Lipman, D.J. 1997. A genomic perspective on protein families. Science 278: 631-637. [DOI] [PubMed] [Google Scholar]
- Thompson, J.D., Higgins, D.G., and Gibson, T.J. 1994. CLUSTALW: Improving the sensitivity of progressive multiple sequence alignment through sequence weighting, position-specific gap penalties and weight matrix choice. Nucleic Acids Res. 22: 4673-4680. [DOI] [PMC free article] [PubMed] [Google Scholar]
- Torgerson, D.G., Kulathinal, R.J., and Singh, R.S. 2002. Mammalian sperm proteins are rapidly evolving: Evidence of positive selection in functionally diverse genes. Mol. Biol. Evol. 19: 1973-1980. [DOI] [PubMed] [Google Scholar]
- Trinchieri, G. 2003. Interleukin-12 and the regulation of innate resistance and adaptive immunity. Nat. Rev. Immunol. 3: 133-146. [DOI] [PubMed] [Google Scholar]
- Trivers, R. 1974. Parent–offspring conflict. Am. Zoologist 14: 249-264. [Google Scholar]
- Waterston, R.H., Lindblad-Toh, K., Birney, E., Rogers, J., Abril, J.F., Agarwal, P., Agarwala, R., Ainscough, R., Alexandersson, M., An, P., et al. 2002. Initial sequencing and comparative analysis of the mouse genome. Nature 420: 520-562. [DOI] [PubMed] [Google Scholar]
- Wyckoff, G.J., Wang, W., and Wu, C.I. 2000. Rapid evolution of male reproductive genes in the descent of man. Nature 403: 304-309. [DOI] [PubMed] [Google Scholar]
- Yang, Z. 1997. PAML: A program package for phylogenetic analysis by maximum likelihood. Comput. Appl. Biosci. 15: 555-556. [DOI] [PubMed] [Google Scholar]
- ———. 2002. Phylogenetic analysis by maximum likelihood (PAML) version 3.0. http://abacus.gene.ucl.ac.uk/software/paml.html.
- Yang, Z. and Nielsen, R. 2000. Estimating synonymous and nonsynonymous rates under realistic evolutionary models. Mol. Biol. Evol. 17: 32-43. [DOI] [PubMed] [Google Scholar]
- Zhang, Z. and Gerstein, M. 2003. Patterns of nucleotide substitution, insertion and deletion in the human genome inferred from pseudogenes. Nucleic Acids Res. 31: 5338-5348. [DOI] [PMC free article] [PubMed] [Google Scholar]
- Zheng, Y., Deng, X., and Martin-DeLeon, P.A. 2001. Lack of sharing of SPAM1 (Ph20) among mouse spermatids and transmission ratio distortion. Biol. Reprod. 64: 1730-1738. [DOI] [PubMed] [Google Scholar]
WEB SITE REFERENCES
- ftp://ftp.genome.washington.edu/RM/RepeatMasker.html; RepeatMasker.
- http://abacus.gene.ucl.ac.uk/software/paml.html; PAML.
- http://us.expasy.org; TrEMBL.
- http://wormbase.org; WormBase.
- http://www.geneontology.org; Gene Ontology.
- http://www.ncbi.nlm.nih.gov; GenBank, NCBI.
- http://www.oeb.harvard.edu/hartl/lab/publications/GeneMerge.html; GeneMerge.