Abstract
The mapping of Hox clusters and many duplicated genes in zebrafish indicated an extra whole-genome duplication in ray-fined fish. However, to reconstruct the preduplication chromosomes (proto-chromosomes), the comparative genomic studies of more distantly related teleosts are essential. Medaka and zebrafish are ideal for this purpose, because their lineages separated from their last common ancestor ∼140 million years ago. To reconstruct ancient vertebrate chromosomes, including the chromosomes of the vertebrate ancestor of humans from 450 million years ago, we mapped 818 genes and expressed sequence tags (ESTs) on a single meiotic backcross panel obtained from inbred strains of the medaka, Oryzias latipes. Comparisons of linkage relationships of orthologous genes among three species of vertebrates (medaka, zebrafish, and human) indicate the number and content of the chromosomes of the last common ancestor of ray-fined fish and lobe-fined fish (including humans), and the extra whole genome duplication event in the ray-fin lineage occurred in the common ancestor of perhaps all teleosts.
About 25,000 teleost species, corresponding to more than half of all vertebrate species, have adapted to a wide variety of marine and freshwater habitats (Nelson 1994). Gene duplication is thought to be important in the generation of the genetic diversity that determines the adaptability of a species to a changing environment (Ohno 1970). Additional ancient genome duplication has been proposed in ray-fined fishes based on comparative studies showing that many genes and gene clusters exist for which two copies are present in bony fishes compared with only one in other vertebrates (Wittbrodt et al. 1988; Amores et al. 1998; Postlethwait et al. 2000; Aparicio et al. 2002; Taylor et al. 2003).
Small freshwater fishes are important model systems for analyzing gene functions in vertebrates. Zebrafish is one of the most successful model systems due to the ease of genome-wide screening for mutants showing specific phenotypes (Driever et al. 1996; Haffter et al. 1996) and recent progress in zebrafish genomics, which facilitated the identification of the mutated genes based on chromosomal position or candidate approaches (Geisler et al. 1999; Shimoda et al. 1999; Kelly et al. 2000; Talbot and Hopkins 2000). Comparative genomics of zebrafish have revealed that large conserved chromosome segments are retained between zebrafish and human, and that a genome-wide duplication may have happened in the ancestor of zebrafish (Postlethwait et al. 1998, 2000; Barbazuk et al. 2000; Woods et al. 2000). In addition, there appears to have been an excess of chromosome fissions over chromosome fusions in the mammalian lineage using zebrafish as an outgroup (Ehrlich et al. 1997; Postlethwait et al. 2000). However, these studies leave several questions still unresolved (Postlethwait et al. 2000). For example, when precisely did the genome duplication event happen in rayfined fish phylogeny? What fractions of the duplicated genes are retained? Did the karyotypes of teleosts and tetrapods evolve by the same mechanisms? To clarify these questions, comparisons of distantly related fish species to each other and to tetrapod outgroups are essential. Medaka—a model organism from the Far East (Wittbrodt et al. 2002)—is one such species. It has recently been shown that the spectrum and phenotypes of induced mutations in medaka is often different from those found in zebrafish (Ishikawa 2000; Loosli et al. 2000), indicating that work with both species is necessary to draw firm conclusions about ancestral gene functions. The last common ancestor of medaka and zebrafish lived ∼140 million years ago, and this ancestor is believed to be the common ancestor of almost all euteleosts (Nelson 1994; Hedges and Kumar 2002; Wittbrodt et al. 2002). Here we report a linkage map covering >1200 loci, and map information is publicly available at our Web site, M base (http://mbase.bioweb.ne.jp/~dclust/ml_base.html). In this study we compared the linkage relationships of orthologous gene pairs in medaka, zebrafish, and human to address some of the questions listed above.
RESULTS AND DISCUSSION
Medaka Gene Map
Although the last medaka linkage map published consisted of 633 markers, the number of coding loci reported was small, only 75 ESTs and four phenotypic loci (Naruse et al. 2000). This gene map density is insufficient to provide anchor loci for position-based cloning or for the genome-wide comparison of orthologous genes among different vertebrate species. To develop appropriate resources for positional cloning of the many new interesting medaka mutants (Ishikawa 2000; Loosli et al. 2000) and the genome-wide comparison of linkage relationships among vertebrate species, we have carried out a large-scale EST analysis and gene mapping project. Here we report the mapping of a total of 818 genes and ESTs that BLASTX searches indicate to be orthologs of specific human genes. We found that the total map length of all linkage groups (LGs) is ∼1400 cM in male meiosis. If the total genome size of medaka is 800 Mb (Uwa and Iwata 1981; Lamatsch et al. 2000), the estimated physical length of each LG would range from 19 to 59 Mb. The current map density is about one marker per Mb (one every 1.75 cM). This is sufficient to identify a DNA marker linked to any genetic traits within 0.9 cM, equivalent to ∼514 kb on average.
Comparisons of the marker distributions of anonymous DNA markers such as random amplified polymorphic DNAs (RAPDs), amplified fragment length polymorphisms (AFLPs), gene, and EST markers indicate that distributions of genes are not equal in all LGs. For example, the gene density of LG2 is 4.3 times lower than that of LG 22 (Table 1). A linkage map of medaka and the genotypes of each individual of the typing panel is available on our Web site, M base, and the Genome Research Web site as Supplemental Tables 1 and 2.
Table 1.
Distribution of Mapped Markers in Each Medaka Linkage Group
| Medaka linkage group | No. mapped EST & gene | No. anonymous DNA markera | Ratiob | Estimated physical length (Mb) | Longest segment (cM) |
|---|---|---|---|---|---|
| 1 | 33 | 41 | 0.80 | 59 | 53.3 |
| 2 | 21 | 40 | 0.53 | 58 | 43.6 |
| 3 | 32 | 38 | 0.84 | 55 | 45.6 |
| 4 | 28 | 37 | 0.76 | 53 | 104.4 |
| 5 | 51 | 29 | 1.76 | 42 | 70.6 |
| 6 | 26 | 25 | 1.04 | 36 | 53.5 |
| 7 | 49 | 24 | 2.04 | 35 | 45.6 |
| 8 | 44 | 24 | 1.83 | 35 | 80.5 |
| 9 | 34 | 23 | 1.48 | 33 | 70.9 |
| 10 | 38 | 23 | 1.65 | 33 | 65.6 |
| 11 | 42 | 22 | 1.91 | 32 | 59.1 |
| 12 | 37 | 21 | 1.76 | 30 | 80.8 |
| 13 | 34 | 21 | 1.62 | 30 | 31.8 |
| 14 | 34 | 21 | 1.62 | 30 | 57.9 |
| 15 | 29 | 21 | 1.38 | 30 | 59.6 |
| 16 | 44 | 20 | 2.20 | 29 | 75 |
| 17 | 39 | 18 | 2.17 | 26 | 64.1 |
| 18 | 19 | 18 | 1.06 | 26 | 61.4 |
| 19 | 34 | 17 | 2.00 | 25 | 52.4 |
| 20 | 28 | 16 | 1.75 | 23 | 79.5 |
| 21 | 38 | 14 | 2.71 | 20 | 76.1 |
| 22 | 41 | 14 | 2.93 | 20 | 26.6 |
| 23 | 21 | 14 | 1.50 | 20 | 43.6 |
| 24 | 23 | 13 | 1.77 | 19 | 52 |
| Total | 819 | 554 | 1.48 | 800 | 1401.5 |
Number of AFLP markers, RAPD markers, and other STS markers
Ratio of number of mapped EST and gene markers and numbers of anonymous markers
Comparison of Gene Maps
Synteny Conservation Among Medaka, Zebrafish, and Human
We used 818 orthologous gene pairs between medaka and human to compare the syntenic relationships of medaka and human genomes. Figure 1 shows the distribution of mapped medaka gene orthologs in human chromosomes in this study. The distribution patterns of mapped human genes in each human chromosome published in the NCBI human genome database (http://www.ncbi.nlm.nih.gov/genome/guide/human/) and that of medaka gene orthologs are not significantly different from random except for human chromosomes (Hsa) 12, 13, 17, and 18 (Hsa 12, 13: P < 0.01 with χ2 test; Hsa17, 18: P < 0.05 with χ2 test), which confirms that these mapped medaka genes are rather randomly sampled from the human genome. Figure 2A shows an oxford grid comparing the medaka and human genomes. This pattern shows that even though the distribution is scattered, it is not random (P < 6 × e–145 with χ2 test), and clusters of orthologous gene pairs are frequently observed as in zebrafish (Barbazuk et al. 2000; Woods et al. 2000). For example, medaka LG1, a sex chromosome, exhibits clusters of pairs from Hsa 4, 17, and 19. Medaka and human share 104 conserved syntenic segments involving at least three orthologous gene pairs in the data set. Between zebrafish and human, 125 regions of conserved synteny are observed under the same criteria (Barbazuk et al. 2000; Woods et al. 2000). Thus, the degree of synteny conservation between human and either medaka or zebrafish is almost the same. Figure 2B shows an oxford grid for medaka and zebrafish (the gene name depicted as the human gene symbol; medaka LG, zebrafish LG and human chromosome locations used for this analysis were listed in a Supplemental Table 1). With 255 gene pairs, we were able to observe the clusters of orthologous gene pairs in the medaka/zebrafish oxford matrix. For example, if the criteria of conserved syntenic segment is at least five orthologous gene pairs located on the same LG, we could observe conserved syntenic segments between medaka/zebrafish for LG1/LG1, LG3/LG7, LG7/LG23, LG8/LG3, LG10/LG14, LG11/LG19, LG12/LG21, LG13/LG15, LG16/LG16, LG17/LG2, LG19/LG12, LG21/LG9, LG22/LG17, LG23/LG4, and LG24/LG20. In our recent analysis, ∼41% (31 out of 75) of newly assigned orthologous gene pairs were mapped to regions of conserved synteny. This shows that a significant proportion of chromosome segments is conserved between medaka and zebrafish even though they have been separated from their last common ancestor for ∼140 million years (Hedges and Kumar 2002).
Figure 1.
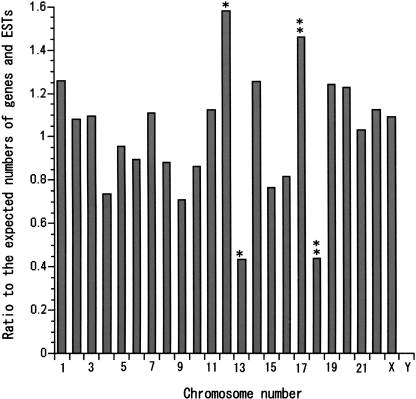
Ratio of the observed and expected medaka orthologs of human genes in human chromosomes. The distribution pattern of 818 human orthologs is similar to that of 45,910 human genes in each human chromosome except Hsa 12, 13, 17, and 18. This indicates that the mapped medaka genes orthologous to human have been selected rather randomly. Mapped human orthologs are more frequently observed in Hsa 12 and 17 and less frequently observed in Hsa 13 and 18, indicating the mammalian-specific expansion of gene number in Hsa 13 and 18 and reduction of gene number in Hsa 12 and 17.
Figure 2.
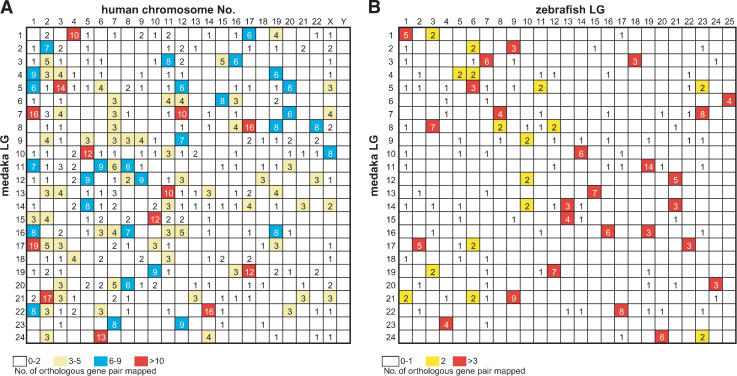
This Oxford grid display is a matrix of cells comparing the number of orthologous genes on chromosomes of two species. Each cell represents two chromosomes, one from each species. The chromosomes of one species are arrayed as columns, with the chromosome numbers and species' name at the top of the grid. The second species' chromosomes are shown in rows, with the chromosome numbers and species' name appearing on the left side of the grid. Numbers in cells indicate the numbers of orthologous genes mapped human–medaka comparison (A) and medaka–zebrafish comparison (B). Details of mapped genes are listed in Supplemental Table 1.
Ancestral Proto-Chromosomes
HOX genes are master genes for patterning the anterior/posterior axis in both vertebrates and invertebrates. They are clustered in four chromosomes in mammals and seven linkage groups in medaka and zebrafish (Amores et al. 1998; Naruse et al. 2000). The human HOXB cluster is on Hsa17, and the two medaka HoxB clusters are located on LG8 and LG19. Comparative gene mapping showed extensive shuffling of gene orders since the divergence of the medaka and human lineages (Fig. 3). A large conserved block of Hsa17 loci (including HoxB) has been maintained in vertebrates (Postlethwait et al. 2000; Voss et al. 2001). After sorting these genes by human chromosome numbers and assigning colors to each human chromosome, it became clear that LG8 and LG19 showed similar color patterns, both having blocks not only of Hsa 17 but also of Hsa 16, 19, and 22. This indicates that genes currently on these human chromosomes share the same ancestral chromosome. Zebrafish LG3 and LG12 show a similar situation for conserved syntenic blocks with human. On the other hand, medaka LG19 and zebrafish LG12 have large syntenic blocks derived from Hsa 10. Lack of syntenic segment derived from Hsa 10 in medaka LG8 and zebrafish LG3 does not seems to be by accident, because these syntenic blocks are relatively large, occupying >27% of mapped genes in medaka LG19 and 40% of mapped genes in zebrafish LG12. The most probable explanation of this pattern is modification from translocation or deletion after duplication of chromosomes in the common ancestor of medaka and zebrafish. We apply the same analysis to other linkage groups of medaka and zebrafish. Surprisingly, we can see a similar relationship for most medaka and zebrafish linkage groups (Fig. 4). Because of the early divergence of medaka and zebrafish lineages, these results indicate that most teleost fish genomes probably consist of paired chromosomes, each pair derived from a single common proto-chromosome.
Figure 3.
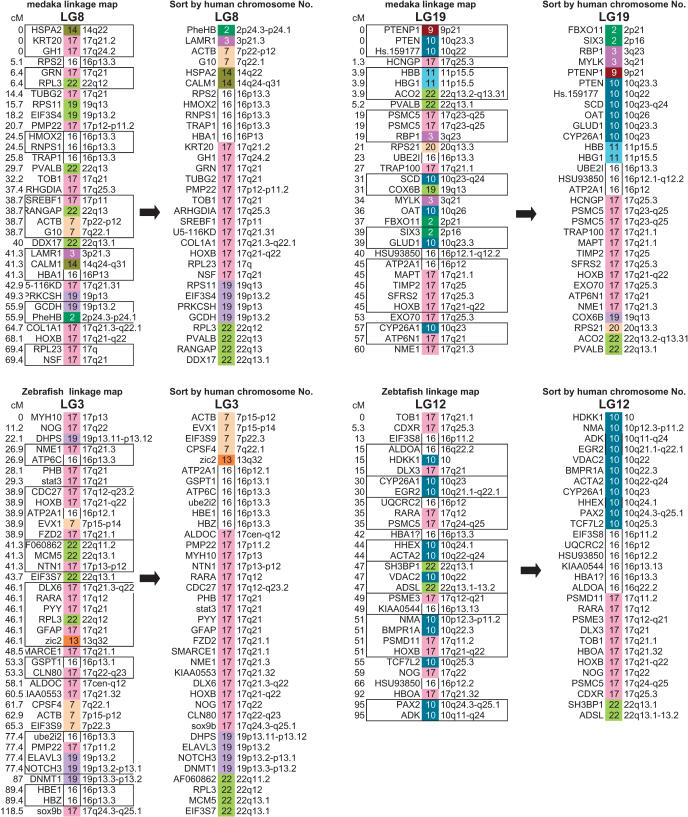
The medaka linkage map of LG8 and LG19 and the orthologous zebrafish chromosomes, LG3 and LG12. Both pairs have HoxB clusters, and the orthologs are sorted according to human chromosome order. The linkage data for zebrafish was obtained from Heat Shock Diploid Cross, Maps and Data, in the Stanford Zebrafish Genome Project (http://zebrafish.stanford.edu/genome/Frontpage.html). The locations of 23 human chromosomes are distinguished by 23 colors, and the location of human orthologous genes are indicated by color and human chromosome numbers. Markers in boxes showed no recombination. Gene order was scrambled by apparent inversions occurring since the medaka and human divergence. After sorting (canceling the effects of inversions), similar domain structures are observed both in LG8 and LG19, indicating that these chromosomes arose from the duplication of a single ancestral chromosome. The markers which have two possible locations in the same LG are not used in this figure but are used in Figure 4.
Figure 4.
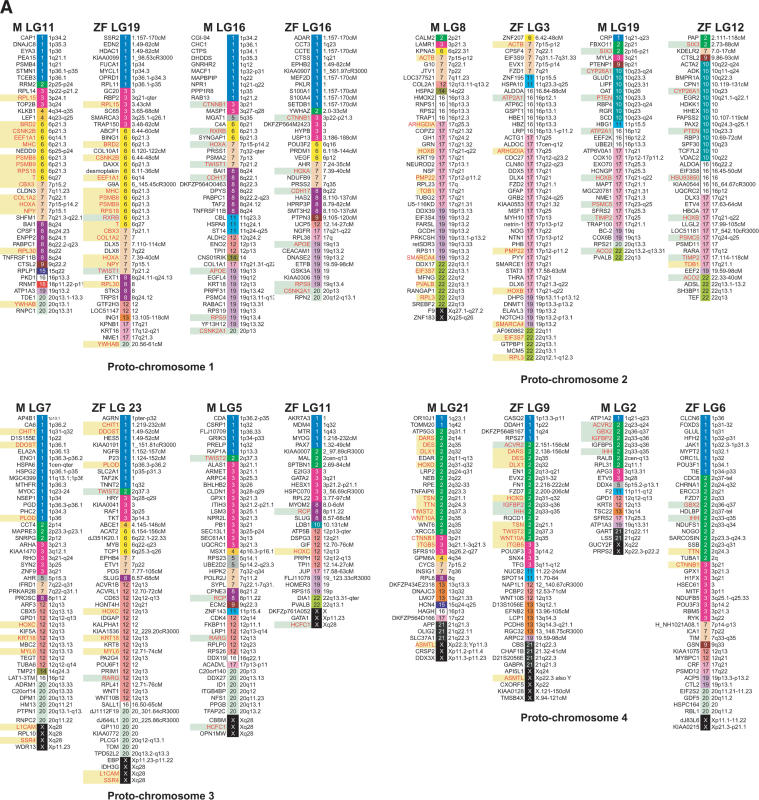
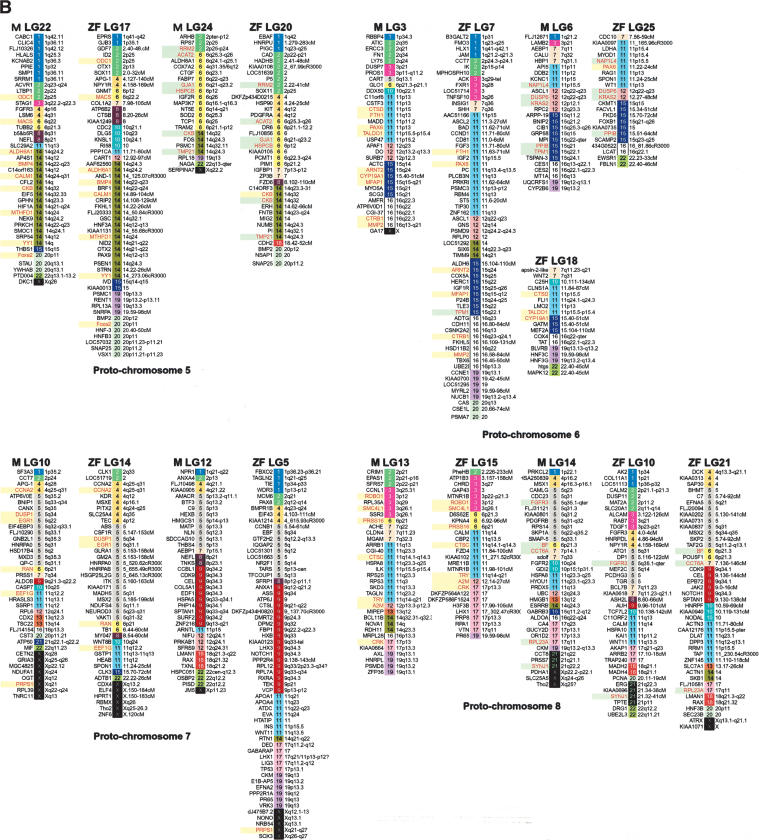
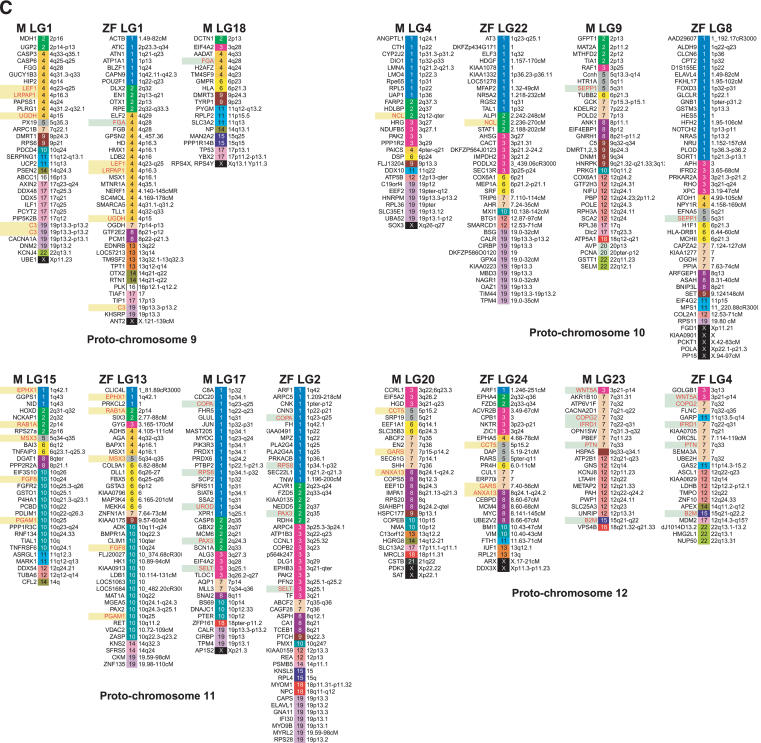
A genome-wide comparison of medaka and zebrafish linkage groups with their human orthologous genes. Although there were three exceptions, most LGs in both species showed pair-wise combinations with similar color patterns. Genes in red indicate orthologous gene pairs in LGs sharing a putative ancestral proto-chromosome. Green and yellow boxes indicate sets of orthologous gene pairs observed in putative orthologous regions in medaka and zebrafish. Zebrafish mapping information and orthologous relationships to human genes were mainly obtained from Woods et al. (2000), Barbazuk et al. (2000), and LocusLink (http://www.ncbi.nlm.nih.gov/LocusLink/; revised November 24, 2003).
There are three apparent exceptions to this generalization. The LG1 of zebrafish appear to lack paired LGs (see proto-chromosome 9 in Fig. 4). This indicates the deletion of an entire chromosome in the a ancestor of zebrafish. Another explanation for the case of zebrafish LG1 is that the paralogous chromosome has been redistributed to other chromosomes by translocation and is no longer substantially intact and not distinguished by this analysis. In zebrafish there are at least eight loci on LG1 that appear to be duplicated, and three of these duplicates are on zebrafish LG9 and two on zebrafish LG13. This evidence indicates that the redistribution to other chromosomes is more feasible than is the deletion of an entire chromosome. Medaka LG3 and 6 and zebrafish LG7, 18, and 25 show similar color patterns based on the human chromosomes (see proto-chromosome 6 in Fig. 4). Medaka LG3 and zebrafish LG7 shared six orthologous genes, and medaka LG3 and zebrafish LG18 also shared three orthologous genes (Fig. 2; Supplemental Table 1). Medaka LG6 and zebrafish LG25 shared four orthologous gene pairs. The Pax 6 gene in medaka LG3 has two duplicates in zebrafish, pax6a and pax6b, and these mapped to LG7 and LG25 in zebrafish, and the Tmp1 gene in medaka LG6 mapped to LG7 in zebrafish. This evidence indicates that medaka LG3, medaka LG6, zebrafish LG7, zebrafish LG18, and zebrafish LG25 have had a common ancestral proto-chromosome. This indicates that there may have been fission after the scrambling of gene order in the zebrafish lineage. Medaka LG13 and 14 and zebrafish LG10, 15, and 21 also show similar color patterns (see proto-chromosome 8 in Fig. 4). Two genes (Fgfr3 and Synj1) and three genes (Bf, Cct6A, and Rpl23A) in medaka LG14 were located on zebrafish LG10 and LG21, respectively. These results indicate the common origin of medaka LG14, zebrafish LG10, and zebrafish LG21. These results indicate fission after scrambling of the gene order in the zebrafish lineage, but in terms of conserved synteny, zebrafish LG21 also shared the conserved synteny with medaka LG12 with five orthologous gene pairs (Fig. 2; Supplemental Table 1). One possible explanation for these observations is that a relatively large chromosome segment translocated between ancestral medaka LG14 and LG12. To clarify the details of chromosomal changes after divergence of medaka and zebrafish, we need more information on map position of the orthologous genes, especially co-orthologs between medaka and zebrafish. As suggested above, two chromosomes appear to have experienced fission, and one of the duplicates of one chromosome may have disappeared by deletion of an entire chromosome or extensive translocation to other chromosomes in the zebrafish lineage. This evidence may have led to the difference in chromosome numbers between medaka and zebrafish: 24 versus 25.
Whole Genome Duplication and the Chromosome Number in the Last Common Ancestor of Ray-Fined Fish and Lobbed-Fined Fish
Extra “fish” Hox clusters have been reported in teleosts occupying relatively different taxonomic positions (Amores et al. 1998; Naruse et al. 2000; Malaga-Trillo and Meyer 2001). Medaka has two HoxA, two HoxB, one HoxC, and two HoxD clusters (Naruse et al. 2000), and zebrafish has two HoxA, two HoxB, two HoxC, and one HoxD clusters (Amores et al. 1998). Phylogenetic analysis based on Hox gene sequences shows that the zebrafish has two orthologs of mammalian HOXC6 (Amores et al. 1998). From these results, a common ancestor of medaka and zebrafish, which is the common ancestor of all teleosts, should have eight Hox clusters (two for each four Hox clusters). Independent duplications in each Hox cluster are not feasible, indicating a genome-wide duplication in the common ancestor of teleosts. Analysis of the fugu genome assembled from whole genome shotgun sequences revealed six co-orthologous segments for the human 12q region, the site of HOXC6 (Aparicio et al. 2002). A result of our genome-wide comparison of orthologous genes' locations among medaka, zebrafish, and human, along with the evidence given above, strongly indicates that the genome amplification is not partial, but involved the whole genome, and occurred before the last common ancestor of euteleosts.
As shown in Supplemental Figure 1, the chromosome number distribution in teleosts is quite narrow: 58% of all teleosts (334 out of 580 species) examined have 48 or 50 chromosomes (see Animal Genome Size Database, http://www.genomesize.com). Combining evidence of the relatively stable chromosome number (24 or 25 chromosomes in the haploid set) of teleosts and the whole genome duplication event in the last common ancestor of teleosts, these results indicate that the last common ancestor of ray-fined fish and lobe-fined fish (including tetrapods) may have had ∼12 chromosomes in the haploid set, as previously suggested (Postlethwait et al. 2000). The content of vertebrate proto-chromosomes can be identified by the comparison of conserved syntenic genes between distantly related teleost species like medaka and zebrafish (Table 2). Fortunately, the medaka genomic shotgun sequencing project is currently underway, and ∼0.9 fold genome coverage sequences are currently available on the National Bio-Resource Project medaka genome project Web site (http://shigen.lab.nig.ac.jp/medaka/genome/indexen.html). Comparison of the assembled genome sequences of medaka and zebrafish with each other and with human, mouse, and chicken will clarify the content of vertebrate proto-chromosomes on the sequence level.
Table 2.
Hypothetical Proto-Chromosomes in Vertebrates and Location of Major Segement
|
Major segments
|
|||
|---|---|---|---|
| Protochromosome | medaka LG | zebrafish LG | human chromosome |
| 1 | 16 | 16 | 1, 3, 6, 7, 8 |
| 1 | 11 | 19 | 1, 6, 7, 8, 19 |
| 2 | 8 | 3 | 16, 17, 19, 22 |
| 2 | 19 | 12 | 10, 16, 17, 22 |
| 3 | 7 | 23 | 1, 3, 12, X |
| 3 | 5 | 11 | 1, 3, 12, X |
| 4 | 2 | 6 | 2, 3, X |
| 4 | 21 | 9 | 2, 3, 13, 21, X |
| 5 | 22 | 17 | 2, 14, 20 |
| 5 | 24 | 20 | 2, 6, 14 |
| 6 | 3 | 7, 18 | 11, 15, 16 |
| 6 | 6 | 25 | 11, 15, 16 |
| 7 | 10 | 14 | 4, 5, 11, X |
| 7 | 12 | 5 | 5, 9, 11 |
| 8 | 13 | 15 | 3, 11, 17 |
| 8 | 14 | 10, 21 | 5, 11, 17 |
| 9 | 1 | 1 | 2, 4, 17 |
| 9 | 18 | ||
| 10 | 4 | 22 | 1, 2, 3, 19 |
| 10 | 9 | 8 | 7, 8, |
| 11 | 15 | 13 | 1, 6, 10 |
| 11 | 17 | 2 | 1, 2, 3, 19 |
| 12 | 20 | 24 | 3, 7, 8, X |
| 12 | 23 | 4 | 3, 7, 12 |
Boldface indicates the pair of orthologous chromosomes with at least three orthologous gene pairs mapped between medaka and zebrafish.
Differential Gene Silencing in the Duplicated Chromosomes
We also observed the differential loss of duplicated genes in duplicated chromosomes. For example, RPL15, MHC, PSMB8, PSMB9, CSNK2B, EEF1A1, T, CBX3, NPY, RPS16, COL1A2, RPL30 YWHAB, and HOXA genes were mapped to LG11 in medaka and to LG19 in zebrafish, whereas HOXA, APOE, CTNNB1, RPS9, CDH17, CTNNB1, and CSNK2A1 genes were mapped to LG16 in medaka and LG16 in zebrafish (see proto-chromosome 1 in Fig. 4). This indicates that after chromosome duplication, gene losses occurred on each paralogous chromosome independently before the divergence of teleosts, and that medaka LG11 and zebrafish LG19 are orthologous and medaka LG16 and zebrafish LG16 are orthologous. However, the RXRB and TWIST1 genes, located on medaka LG16 mapped to LG19 in zebrafish. This indicates that after duplication, one copy of RXRB and TWIST1 was lost in the medaka lineage, and the other copy of RXRB and TWIST1 was lost in the zebrafish lineage. Similar patterns of differential gene loss are observed in medaka LG8/LG19 and zebrafish LG3/LG12, in medaka LG7/LG5 and zebrafish LG11/LG23, and in medaka LG21/LG2 and zebrafish LG9/LG6 (Fig. 4). Another explanation of this phenomenon is the simple possibility that another copy of the duplicated gene remains to be found in one or both of the two species. Even so, these results indicate that these LGs have common ancestral proto-chromosomes.
Because many genes in fish are present as single copy, proponents of the whole-genome duplication hypothesis postulate that many of the duplicated versions of genes must have degenerated since the initial duplication event. However, one would expect medaka and zebrafish to have different sets of genes if subfunctionalization and neofunctionalization occurred independently in the two lineages (Force et al. 1999) because degeneration would have sometimes affected different genes in the two fish lineages. Such differential gene losses and lineage-specific degeneration of the duplicated genes may be important in understanding the different spectrum of phenotypes found in mutation screens in medaka and zebrafish (Ishikawa 2000; Loosli et al. 2000).
Teleosts Chromosome Evolution
As mentioned previously, the haploid chromosome number of teleosts is relatively stable at ∼25 (Supplemental Fig. S; Animal Genome Size Database, http://www.genomesize.com), indicating the karyotype of the original teleost (Ojima 1983). Fishes with ∼100 chromosomes, similar to some salmonids and carps, were apparently the result of recent independent genome duplications within various lineages. In mammals, there are four peaks of the chromosome number, 38 (4.7%), 42 (8.5%), 44 (8.1%), and 48 (8.8%). As shown in a Supplemental Figure 1 available online at www.genome.org, the chromosome number distribution in teleosts is quite narrow, in contrast with the broadly distributed chromosome number in mammals. Our comparative genomic analysis of medaka and zebrafish with reference to the human gene map indicates that karyotype evolution in teleosts occurred mainly by inversion and occasionally by translocation, not by frequent fusion and/or fission of chromosomes observed in mammalian chromosome evolution (Ehrlich et al. 1997).
METHODS
EST Analysis and Gene Map Construction
Seven cDNA libraries were constructed from cultured cells, liver, ovary, and brain of adult HNI inbred medaka. The 5′ ends of ∼10,000 cDNA clones were sequenced (http://mbase.bioweb.ne.jp/~dclust/medaka_top.html). After a BLASTX search (Altschul et al. 1997) to Protein Information Resource (PIR) or the NCBI non-redundant sequence database (nr), ESTs that have significant homology (P < e–15) with proteins of different species were selected as sequences for primer design. PCR primers were designed from EST sequences by Vector NTI Suite version 5 (Infomax). Restriction fragment length polymorphisms (RFLPs) in PCR amplified fragments from AA2 and HNI genomic DNA as templates were searched with mainly four- or five-cutter restriction enzymes (DdeI, FokI, HaeIII, HinfI, MnlI, MspI, RsaI, and MseI). About one-third of primers designed were successfully used for mapping. Results showed a high level of polymorphism between the AA2 and HNI inbred strains. Production of the male meiotic mapping panel was described previously (Naruse et al. 2000). Segregation analysis and order of the genes were analyzed by MAPMAKER (Apple Macintosh Version 2), as described previously (Naruse et al. 2000). Marker names, assigned linkage groups, corresponding human gene symbols, zebrafish LG, human chromosome locations, primer sequences, and types of polymorphisms are listed in Supplemental Table 1.
Comparison of Linkage Relationships
Medaka genes and ESTs were assigned to putative human and zebrafish orthologs by the combination of BLASTX and BLASTN searches (a maximum P value of e–20). Zebrafish mapping information and orthologous relationships to human genes were mainly obtained from Woods et al (2000) and Barbazuk et al. (2000), which are the latest peer-reviewed zebrafish gene maps available. Linkage data of zebrafish used in Figures 2 through 4 were obtained from http://cmgm.stanford.edu/~tallab/HeatShock99/ and the latest version of LocusLink database (http://www.ncbi.nlm.nih.gov/LocusLink/). Genes and ESTs with identified human orthologs are color-coded and numbered according to the chromosomal position of the human ortholog and sorted by chromosome numbers. These procedures cancel the shuffling of gene order by chromosome inversions occurring after the divergence of teleosts and human lineages and clarify the segmental origins of orthologous gene pairs between teleosts and human.
Acknowledgments
We thank T. Kitagawa, T. Jindo, and H. Takada for medaka EST information. This work is supported by a Grant-in-Aid from the MEXT, Japan as the Priority Area no. 813, and R01RR10715 and R01DK55378.
The publication costs of this article were defrayed in part by payment of page charges. This article must therefore be hereby marked “advertisement” in accordance with 18 USC section 1734 solely to indicate this fact.
Article and publication are at http://www.genome.org/cgi/doi/10.1101/gr.2004004. Article published online before print in April 2004.
Footnotes
[Supplemental material is available online at www.genome.org.]
References
- Altschul, S.F., Madden, T.L., Schaffer, A.A., Zhang, J., Zhang, Z., Miller, W., and Lipman, D.J. 1997. Gapped BLAST and PSI-BLAST: A new generation of protein database search programs. Nucleic Acids Res. 25: 3389-3402. [DOI] [PMC free article] [PubMed] [Google Scholar]
- Amores, A., Force, A., Yan, Y.L., Joly, L., Amemiya, C., Fritz, A., Ho, R.K., Langeland, J., Prince, V., Wang, Y.L. et al. 1998. Zebrafish hox clusters and vertebrate genome evolution. Science 282: 1711-1714. [DOI] [PubMed] [Google Scholar]
- Aparicio, S., Chapman, J., Stupka, E., Putnam, N., Chia, J.M., Dehal, P., Christoffels, A., Rash, S., Hoon, S., Smit, A., et al. 2002. Whole-genome shotgun assembly and analysis of the genome of Fugu rubripes. Science 297: 1301-1310. [DOI] [PubMed] [Google Scholar]
- Barbazuk, W.B., Korf, I., Kadavi, C., Heyen, J., Tate, S., Wun, E., Bedell, J.A., McPherson, J.D., and Johnson, S.L. 2000. The syntenic relationship of the zebrafish and human genomes. Genome Res. 10: 1351-1358. [DOI] [PMC free article] [PubMed] [Google Scholar]
- Driever, W., Solnica-Krezel, L., Schier, A.F., Neuhauss, S.C., Malicki, J., Stemple, D.L., Stainier, D.Y., Zwartkruis, F., Abdelilah, S., Rangini, Z., et al. 1996. A genetic screen for mutations affecting embryogenesis in zebrafish. Development 123: 37-46. [DOI] [PubMed] [Google Scholar]
- Ehrlich, J., Sankoff, D., and Nadeau, J.H. 1997. Synteny conservation and chromosome rearrangements during mammalian evolution. Genetics 147: 289-296. [DOI] [PMC free article] [PubMed] [Google Scholar]
- Force, A., Lynch, M., Pickett, F.B., Amores, A., Yan, Y.L., and Postlethwait, J. 1999. Preservation of duplicate genes by complementary, degenerative mutations. Genetics 151: 1531-1545. [DOI] [PMC free article] [PubMed] [Google Scholar]
- Geisler, R., Rauch, G.J., Baier, H., van Bebber, F., Brobeta, L., Dekens, M.P., Finger, K., Fricke, C., Gates, M.A., Geiger, H., et al. 1999. A radiation hybrid map of the zebrafish genome. Nat. Genet. 23: 86-89. [DOI] [PubMed] [Google Scholar]
- Haffter, P., Granato, M., Brand, M., Mullins, M.C., Hammerschmidt, M., Kane, D.A., Odenthal, J., van Eeden, F.J., Jiang, Y.J., Heisenberg, C.P. et al. 1996. The identification of genes with unique and essential functions in the development of the zebrafish, Danio rerio. Development 123: 1-36. [DOI] [PubMed] [Google Scholar]
- Hedges, S.B. and Kumar, S. 2002. Vertebrate genome compared. Science 297: 1283-1285. [DOI] [PubMed] [Google Scholar]
- Ishikawa, Y. 2000. Medakafish as a model system for vertebrate developmental genetics. Bioessays 22: 487-495. [DOI] [PubMed] [Google Scholar]
- Kelly, P.D., Chu, F., Woods, I.G., Ngo-Hazelett, P., Cardozo, T., Huang, H., Kimm, F., Liao, L., Yan, Y.L., Zhou, Y., et al. 2000. Genetic linkage mapping of zebrafish genes and ESTs. Genome Res. 10: 558-567. [DOI] [PMC free article] [PubMed] [Google Scholar]
- Lamatsch, D.K., Steinlein, C., Schmid, M., and Schartl, M. 2000. Noninvasive determination of genome size and ploidy level in fishes by flow cytometry: Detection of triploid Poecilia formosa. Cytometry 36: 91-95. [DOI] [PubMed] [Google Scholar]
- Loosli, F., Koster, R.W., Carl, M., Kuhnlein, R., Henrich, T., Mucke, M., Krone, A., and Wittbrodt, J. 2000. A genetic screen for mutations affecting embryonic development in medaka fish (Oryzias latipes). Mech. Dev. 97: 133-139. [DOI] [PubMed] [Google Scholar]
- Malaga-Trillo, E. and Meyer, A. 2001. Genome duplications and accelerated evolution of Hox genes and cluster architecture in teleost fishes. Am. Zool. 41: 676-686. [Google Scholar]
- Naruse, K., Fukamachi, S., Mitani, H., Kondo, M., Matsuoka, T., Kondo, S., Hanamura, N., Morita, Y., Hasegawa, K., Nishigaki, R., et al. 2000. A detailed linkage map of medaka, Oryzias latipes: Comparative genomics and genome evolution. Genetics 154: 1773-1784. [DOI] [PMC free article] [PubMed] [Google Scholar]
- Nelson, J.S. 1994. Fishes of the world, 3rd ed. John Wiley, New York.
- Ohno, S. 1970. Evolution by gene duplication. Springer, Heidelberg, Germany.
- Ojima, Y. 1983. Fish cytogenetics. Suiko-sha, Tokyo, Japan.
- Postlethwait, J.H., Yan, Y.L., Gates, M.A., Horne, S., Amores, A., Brownlie, A., Donovan, A., Egan, E.S., Force, A., Gong, Z., et al. 1998. Vertebrate genome evolution and the zebrafish gene map. Nat. Genet. 18: 345-349. [DOI] [PubMed] [Google Scholar]
- Postlethwait, J.H., Woods, I.G., Ngo-Hazelett, P., Yan, Y.L., Kelly, P.D., Chu, F., Huang, H., Hill-Force, A., and Talbot, W.S. 2000. Zebrafish comparative genomics and the origins of vertebrate chromosomes. Genome Res. 10: 1890-1902. [DOI] [PubMed] [Google Scholar]
- Shimoda, N., Knapik, E.W., Ziniti, J., Sim, C., Yamada, E., Kaplan, S., Jackson, D., de Sauvage, F., Jacob, H., and Fishman, M.C. 1999. Zebrafish genetic map with 2000 microsatellite markers. Genomics 58: 219-232. [DOI] [PubMed] [Google Scholar]
- Talbot, W.S. and Hopkins, N. 2000. Zebrafish mutations and functional analysis of the vertebrate genome. Genes & Dev. 14: 755-762. [PubMed] [Google Scholar]
- Taylor, J.S., Braasch, I., Frickey, T., Meyer, A., and Van de Peer, Y. 2003. Genome duplication: A trait shared by 22,000 species of ray-finned fish. Genome Res. 13: 382-390. [DOI] [PMC free article] [PubMed] [Google Scholar]
- Uwa, H. and Iwata, A. 1981. Karyotype and cellular DNA content of Oryzias javanicus (Oryziatidae, Pisces). Chromosome Inf. Serv. 31: 24-26. [Google Scholar]
- Voss, S.R., Smith, J.J., Gardiner, D.M., and Parichy, D.M. 2001. Conserved vertebrate chromosome segments in the large salamander genome. Genetics 158: 735-746. [DOI] [PMC free article] [PubMed] [Google Scholar]
- Wittbrodt, J., Meyer, A., and Schartl, M. 1988. More genes in fish? BioEssay 20: 511-515. [Google Scholar]
- Wittbrodt, J., Shima, A., and Schartl, M. 2002. Medaka: A model organism from the Far East. Nat. Rev. Genet. 3: 53-64. [DOI] [PubMed] [Google Scholar]
- Woods, I.G., Kelly, P.D., Chu, F., Ngo-Hazelett, P., Yan, Y.L., Huang, H., Postlethwait, J.H., and Talbot, W.S. 2000. A comparative map of the zebrafish genome. Genome Res. 10: 1903-1914. [DOI] [PMC free article] [PubMed] [Google Scholar]
WEB SITE REFERENCES
- http://mbase.bioweb.ne.jp/~dclust/ml_base.html; M base medaka genome database.
- http://www.ncbi.nlm.nih.gov/genome/guide/human/); the NCBI human genome database.
- http://shigen.lab.nig.ac.jp/medaka/genome/indexen.html; the National Bio-Resource Project medaka genome project Web site.
- http://www.ncbi.nlm.nih.gov/LocusLink/; NCBI LocusLink database.
- http://zebrafish.stanford.edu/genome/Frontpage.html; Stanford Zebrafish Genome Project Web site.
- http://zfin.org/cgi-bin/webdriver?MIval=aa-ZDB&_home.apg; The Zebrafish Information Network.
- http://www.genomesize.com/; Animal Genome Size Database.


