

Abstract
The interaction between transcription factors and their DNA binding sites is key to understanding gene regulation. By performing a genome-wide study of the evolutionary dynamics in yeast promoters, we provide a first global view of the network of selection forces in the evolution of transcription factor binding sites. This analysis gives rise to new models for binding site activity, identifies families of related binding sites, and characterizes the functional similarities among them. We discovered rich and highly optimized selective pressures operating inside and around these families. In several cases, this organization reveals that a single transcription factor has multiple functional modes. We demonstrate how such functional heterogeneity is related to the binding site's affinity and how it is exploited in transcription programs.
Cis-acting transcription regulation is mediated by transcription factors that bind short specific sequences upstream of the regulated genes. Each transcription factor recognizes a specific collection of similar sequences, sometime referred to as variants of a consensus. Such small variations were hypothesized to play a key role in transcription control (Kalir et al. 2001; Cowles et al. 2002). If such binding site fine-tuning is indeed functionally important, it must be manifest in the evolutionary forces that affect substitutions among group members. Here we obtained improved understanding of the function of binding sites by analyzing the selective pressures on substitutions of their sequences.
To characterize the evolutionary forces shaping binding site evolution, we focused on single-base changes between octamers, which we call here substitutions between motifs. Note that the space of such substitutions is very large: each of the 48 motifs has 24 neighbors, i.e., motifs that differ from it via a substitution in a single base. We used the established phylogenetic tree (Clifton et al. 2001) and the sequences of four yeast species (Clifton et al. 2003; Kellis et al. 2003), and computed the ancestral sequences of all possible motifs in each of the 4150 aligned yeast promoters. This huge collection of phylogenies (about 2,000,000) allows us to infer normalized substitution rates among all pairs of motifs. Each such rate (denoted by ρ) encodes the level of selective pressure acting on that substitution: Rare substitutions are hypothesized to be under negative selection, and pairs that are frequently interchanged are under neutral (or in extreme cases positive) selection. We also estimated similarly the conservation rate of each motif. We organized this large repertoire as a selection network, where all possible motifs are the nodes and neighbor motifs are connected by arcs, weighted according to their substitution rates. Validations of the estimated rates confirm their high specificity.
The most prominent structure that we detected in the selection network is the partition into families. A family is a set of motifs, each of which is connected to one or more neighbor motifs in the set by high-rate arcs, and all of those motifs are separated from the rest of the network by low-rate arcs. Hence, a family constitutes a “functional island” (or a cluster) of motifs, which are conserved (because substitutions that cross the family boundary are selected against) and have similar function (being observed as frequent substitutes of each other). Some of the identified families appear in Figure 1 and on the Web site (www.cs.tau.ac.il/~rshamir/promoter_evo/); a complete annotated list is given in Supplemental Table S1. We functionally annotated all families using gene expression, transcription factor ChIP binding profiles, and gene GO annotations. The vast majority of families are well supported by significant correlation in at least one of these data sources (Fig. 2). We note that only regions of the selection network in which rate estimations are robust can be clustered reliably, and we focus on these. Functional collections of motifs that are relatively rare may be detected as several smaller clusters or singletons that cannot be robustly assembled or separated.
Figure 1.
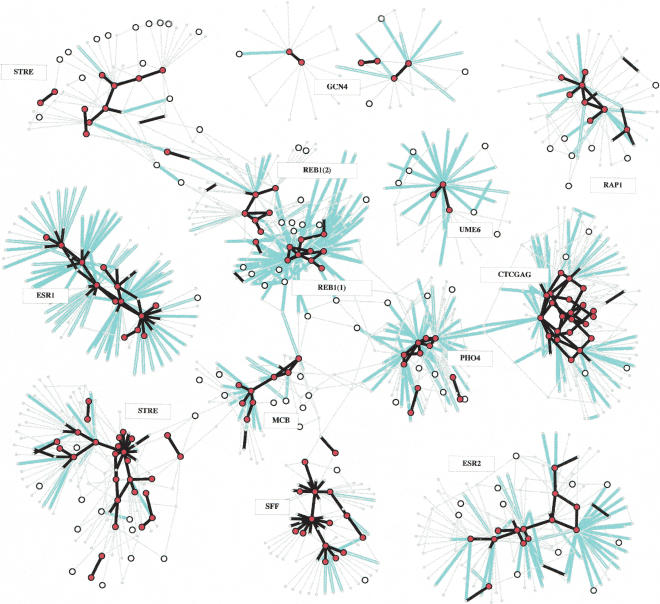
Partial view of the selection network. Motifs are represented as circles; motifs that have conservation rate >0.2 at 2 SD are drawn as large circles, motifs with conservation rate >0.2 at 3 SD are shown as large filled circles. Substitutions are shown as color-coded arcs. Black, nonnegative substitution rate (ρ > 0 and ρ > -0.5 at 2 SD); cyan, negative rates (ρ < -0.5 at 2 SD). A family in the selection network is a cluster of motifs that are interconnected via high or neutral substitution rate arcs. Low-rate substitution arcs separate families. Arc directions are not shown for readability, but 91% of the negative rate arcs point from a family motif to a motif outside the family. We annotated each family by a consensus motif, and by the names of the transcription factors that match that consensus (if such are known). Many known transcription factors are identified as families of motifs, some of which are shown in this figure. Families can be further analyzed for intricate intrafamily relations. Certain transcription factors (e.g., Reb1) correspond to more than one family due to multiple functionalities, as discussed later. Transcription factors with binding sites that are less frequent in the genomes (e.g., Gcn4) have larger variance on rate estimations, and thus are harder to cluster robustly. An interactive version of this figure is available on our Web site.
Figure 2.

Functional enrichment of genes associated with motif families. Each point represents a motif family. For each family, the set of genes that contain a motif from the family in their promoter was identified. The P-value of the best match to a ChIP experimental profile (x-coordinate) and the highest coregulation achieved in a collection of gene expression experiments (y-coordinate) were computed. The vast majority of true motif clusters (green) are strongly supported by functional data, and are well separated from the respective P-values computed with the same motif clusters but randomly shuffled promoter-gene association (red).
The way we define and create motif families does not follow the common approach of identifying groups of binding sites by conservation and consensus. Here, instead, it is the substitution rates between motifs that determine the families. Using this approach, we can identify motifs that were previously hidden by nearby stronger consensus sites. For example, the motifs cluster CTCGAG (Fig. 1) consists of motif variants that resemble the known PHO4/CBF1 cluster CACGTG but are well separated from it by negatively selected substitutions. The sets of genes with motifs from each of those clusters have totally different expression profiles (t-test, P < 0.0002). The TCTCGAGA motif set manifests a striking down-coregulation (P < 10-11) in gal80 and gal1 knockout strains grown without galactose (Ideker et al. 2001), supporting its possible role in transcription regulation. An additional example of a putative family is GGTRATGR, with a possible role in the regulation of ribosome biogenesis (P < 10-23). More examples can be found in Supplemental Table S1.
The representation of binding sites as families of motifs is a powerful and informative tool for analyzing their regulatory function. By studying intra- and interfamily substitution rates in the selection network, one can also reveal multimodality of some transcription factors. To illustrate this, we examined the region of the selection network corresponding to the Reb1 motifs (Fig. 3). Most Reb1 motifs form a large family of densely connected variants of a consensus. Interestingly, in addition to the large family, a well separated smaller Reb1 family is also observed. Although many motifs in one family differ by one nucleotide from some motifs in the other family, there are very low substitution rates on all of these interfamily arcs. Such a pattern is unlikely to appear at random (P < 10-4, see Methods). Both families show strong association (P < 10-60 for each) with the Reb1 ChIP profile (Lee et al. 2002), but expression of genes with binding sites from the two clusters differs (t-test, P < 0.01). The combination of evolutionary and functional genomics evidence leads to the hypothesis that each family represents a distinct mode of Reb1 operation. Reb1 is an autoregulating transcription factor, and it was shown that several autoregulatory binding sites are present in its promoter (Wang and Warner 1998). The two strongest of these sites contain the motifs GCCCATT (binding affinity kd = 25 nM) and TCCCATT (kd = 70 nM), which also appear as major hubs in the two families. The direct binding affinity measurements of the two variants provide a possible mechanistic explanation for the functional diversity of the two families: The large family, containing the first autoregulatory motif, is composed of sites with higher Reb1 affinity levels (lower kd), and is capable of activation or repression in lower transcription factor concentrations. The smaller family, containing the second auto-regulatory motif, is composed of sites with lower Reb1 affinities, which respond only when Reb1 attains high concentrations. Reb1 may thus operate in two distinct modes, which are stabilized via autoregulation.
Figure 3.

Multimodality of the Reb1 transcription factor. A part of the selection network containing motifs that are associated with Reb1 is shown in greater detail. All nodes represent variants of the Reb1 consensus. Note that in this figure, all selection network arcs, including those with low confidence, are plotted, and reverse complement motifs are not combined. (A) Reb1 motifs. (B) Reb1 reverse complementing motifs. Black arcs represent high substitution rate (low selective pressure). Blue arcs represent low substitution rate (high selective pressure). A clear two-family structure emerges, where low-rate arcs are separating a large Reb1 family from a smaller one. The structure is mirrored in the reverse complement motifs. The Reb1 promoter (C) contains two autoregulatory sites, each located in a different family, with distinct binding site affinities (Ideker et al. 2001). This raises the hypothesis of two distinct Reb1 modes of operation, each activating a different group of motifs in specific concentration. Note that nodes in the network are octamers and that the Reb1 consensus is a septamer.
To further study the relation between binding affinity levels and transcription factor functional diversity, we analyzed in detail the Leu3 binding site. Leu3 binding affinity was measured for 50 different variants of the palindromic consensus decamer CC GGTACCGG (Liu and Clark 2002). Because Leu3 motif variants are quite rare in the genome, we extracted 455 weakly conserved loci containing decamer neighbors of motifs for which Leu3 kd measurements are available. We then estimated substitution rates between them as described above. Figure 4 shows a clear multifamily structure in the Leu3 selection network. We observe one high-affinity family (consisting of the palindromic consensus) and two reverse complementing, low-affinity families. The estimated exponential rate of substitution is 0.17 between high-affinity sites, and 0.01 from high- to low-affinity sites (breaking the family boundaries, Fig. 4B). The highly significant rate difference (P < 0.01) supports the hypothesis that the two families represent distinct functional modes of Leu3 regulation and that evolution conserved not only functionality (ability to bind Leu3) but also the more intricate level of activation. Motifs in both affinity domains are conserved at similar rates (Supplemental Fig. S5), indicating that both families are functional. Furthermore, motifs with kd levels that fall in-between the high- and low-affinity families appear infrequently in promoters (Fig. 4C), raising the hypothesis that sites with ambiguous affinity are selected against, and that evolution imposed a discrete bimodal structure on Leu3 sites, by selecting only sites that fall clearly in one of the two families.
Figure 4.

The effect of binding site affinity on Leu3 multimodality. (A) Cluster structure in a fragment of the Leu3 selection network. Black nodes, high-affinity (kd < 50 nM) motifs; white, low-affinity (kd > 170 nM); small gray, unknown affinity. Arcs connect neighbors with high substitution rate. Arcs with low substitution rates are not shown. As only motifs with measured affinities and their neighbors are presented, some real families may appear fragmented. Note that no component contains both high- and low-affinity nodes. (B) Rate of substitution as a function of affinity change within and between the families. Substitutions with similar effect on log(kd) are grouped together, and their joint rate is plotted. The rates of substitution between high-affinity sites and from high- to low-affinity sites differ significantly (P < 0.01). (C) Motif abundance box-plots for different affinity intervals. Both nonfunctional motifs (undetectable kd-s) and medium-affinity motifs (50 nM < kd < 170 nM) have very low abundances compared to motifs in the high- and low-affinity intervals, which were also identified as families in the selection network. This may indicate that medium-affinity motifs are selected against to avoid ambiguity of site modality and to increase transcriptional program robustness.
Even without using the rich structure of the selection network, one can analyze known binding sites at an unprecedented level of detail by simply observing the substitution rates among and around them. Given a particular octamer, we summarize the selective pressures acting on it in a matrix, which gives the rate of each single-base substitution in the motif, thereby showing how deleterious each substitution at each position is. The resulting motif-specific substitution matrix (MSSM) representation (Fig. 5) is not to be confused with standard, frequency-based position-specific scoring matrices (or position weight matrices) generated by various motif-finding schemes (e.g., Bailey and Elkan 1994; Stormo 2000; Moses et al. 2003): Here the information in the matrix reflects the evolutionary forces (and thus the function) of only that particular motif, and is unbiased by its variants. This is crucial when trying to differentiate between the functions of sites related to the same transcription factor. Our Web site provides a genome-wide collection of MSSMs.
Figure 5.

Selection on the ESR1 consensus. The color-coded matrices specify substitution rates from the motif to its neighbors (upper MSSM) and vice versa (lower MSSM). Rows in the matrices represent nucleotides; columns stand for positions in the octamer. The number inside the cell indicates the substitution rate when the neighbor has the nucleotide associated with the row in the position associated with the column, and all other motif nucleotides are unchanged. Blue and cyan cells indicate low rates (ρ < 0 at 2 SD and 0.5 SD, resp.); red and pink cells indicate high rates (ρ > 0 at 2 SD and 0.5 SD, resp.). For example, the substitution of T with C at position 4 (GCGATGAG →GCGACGAG, upper matrix, cell C4) has the rate -3.4. The SDs of the rate estimations are given in parentheses. Most substitutions that perturb the ESR1 consensus have a very low rate, with few exceptions that appear not to disrupt functionality. On the other hand, several substitutions that lead to the consensus appear with high rates, suggesting the possibility of motif optimization toward the preferable binding site.
The selection network encodes directional information: the substitution rates from motif A to its neighbor B and from B to A are not necessarily equal. This can be exploited to study relations between motifs within the same family. For example, analysis of substitutions leading to and from the known ESR1 (or PAC) consensus motif reveals significant antisymmetry (Fig. 5): Substitutions that change the consensus motif are strongly selected against, but in many cases, substitutions in the opposite direction are not under negative selection and manifest very high rates. These cases suggest a process of evolutionary motif optimization, in which variants of a preferable site are evolving toward an optimized function. To examine the prevalence of motif optimization in the selection network, we computed the fraction of substitutions from low- (below 1.4) to high-conservation rate (above 1.4) motifs that have above-average rates, and compared it to the fraction obtained in a control set containing substitutions among nonconserved motifs. The former rate was significantly higher (0.28 vs. 0.23, P < 10-10, G-test of independence). We conclude that motif optimization may be an important evolutionary force in yeast promoter evolution. As rapid neutral evolution of binding sites was shown before to be theoretically possible (Stone and Wray 2001), the fixation of mutations in trans may be followed by fast adaptation in cis. Additional examples of antisymmetric substitutions are available in our Web site.
Cross-species sequence comparison is an effective methodology for detecting signals in genomic sequences (Waterston et al. 2002). According to the predominant paradigm, a collection of genomes is used to annotate sequence regions as “conserved” or “not conserved.” Conservation based methods were used to identify regulatory loci in yeast promoters and to organize them around consensus motifs (Cliften et al. 2001, 2003; Kellis et al. 2003; Moses et al. 2003). The dynamics of evolutionary changes, however, carries much richer information on the functional role of sequence elements. The selection network constitutes a new way of understanding regulatory elements. It reveals transcription factor functional roles at a broader and finer level than was previously possible (Gasch et al. 2000; Lee et al. 2002). Our results show that regulatory elements in yeast are delicately optimized to enable complex, yet accurate, regulatory networks. We anticipate that a similar methodology will be of great value in the upcoming analysis of higher eukaryotes and mammal genomes.
METHODS
Estimating Substitution Rates
We used promoter alignments of the four sensu stricto species (S. cerevisiae, S. mikatae, S. kudriavzevii, and S. bayanus) provided by Kellis et al. (2003) and the established phylogenetic relations among them. Branch distances were estimated using the Jukes and Cantor's (1969) one-parameter model based on data from Cliften et al. (2001). We analyzed all aligned octamers in each of the aligned promoters (up to 1000 bp upstream of the gene, about 2 million loci in total). For each ungapped alignment of octamers, we computed the distributions of octamers in each ancestral node using maximum parsimony. We then tallied the frequencies of inferred single-base substitutions from each octamer to each neighbor on each branch and called the accumulated sum the observed substitution count. Multiple substitution events on the same branch were ignored. We chose octamers because common yeast binding sites have a typical length of 6–12 bp. Similar analysis could be performed using other motif sizes or gapped motifs.
The strongest effect found in the evolution of the analyzed sequences, confirming a well known phenomenon, was a strong transition-transversion asymmetry. As a result, substitution rates had to be normalized first to infer functional relations among motifs. To account for nonuniform single-nucleotide mutation rates, we estimated a full 16-parameter model for each phylogenetic branch and used it to predict the total number of octamer substitutions that should have been observed if no selective pressure was effective. This number is denoted as the predicted substitution count. The normalized substitution rate between two neighbor motifs, denoted by ρ, is the logarithm of the ratio between the inferred and the predicted substitutions counts. The normalized rate of substitution from a motif to itself was defined as the conservation rate.
Corroboration of Inferred Rates
Because we compiled information for numerous motifs, most of which are not likely to encode for a function, the noise level in the analysis could be high, so we sought validation of our methodology. As active binding sites appear on both strands of the promoter's DNA, and our analysis was done on a single (5′) strand only, we could compare the substitution rates obtained for each motif with those of its reverse complement, which were obtained independently. Indeed, a very strong correlation can be shown (Supplemental Fig. S1). High correlation was also observed in the conservation rates (Supplemental Fig. S2). In general, both conservation and substitution rates have a normal-like distribution (Supplemental Fig. S3), as expected given the inherent level of noise in the analysis. Still, Supplemental Figure S3 shows clear bias toward high conservation rate and low substitution rate, which reflects selective pressures.
We used the correlation between rates of reverse complementing substitutions to estimate rates confidence intervals. Given a motif s, we denote its reverse complement as sc. We assume that reverse-complementing motifs have similar biological function and so the selective pressure on pairs of substitutions s1-s2 and s1c-s2c should be the same. Because we estimate the rate parameters for all such pairs independently, we may recover the estimation variance using the difference distribution for reverse complementing substitutions. We partitioned the substitutions into groups that fall into the same range of predicted count (bin), and reconstructed this distribution of reverse complement rate difference in each bin (Supplemental Fig. S4). Larger predicted counts correspond to larger samples and consequently, lower variance. The variance for rates estimations equals half of the difference variance. Supplemental Figure S4 shows the differences distributions for several prediction bins. We used these empirical distributions to compute standard deviations (SD) for the rate estimations on all the arcs in the selection network.
Selection Network Analysis
To enable a global view of the selection network, we combined information on reverse complementing substitutions, and recomputed the rate ρ as the logarithm of the ratio between sums of observed and predicted counts. Conservation rates were similarly combined. Each family (i.e., cluster) in the selection network corresponds to a set of conserved motifs (conservation rate > 0.2 at 2 SD) that form a connectivity component in the sub-network including only high-confidence nonnegative-rate arcs (ρ > 0 and ρ > -0.5 at 2 SD). We annotated each component by computing the consensus of the motifs in it and comparing it to known yeast transcription factor consensus sequences (Kellis et al. 2003). To visualize the network, we added for each component all neighbor motifs and all arcs between neighbor motifs in different clusters. To generate a Motif-Specific Substitution Matrix (MSSM) for a given motif, we used the rate estimations for all of the substitutions from the motif. We represented these rates in a matrix in which each entry corresponds to a specific one-nucleotide substitution. The matrix representation thus completely characterizes the selective forces on loci bearing the motif.
Motif Families' Functional Analysis
To annotate motif clusters in the selection network, we extracted for each motif family the genes whose promoters (up to 600 bp 5′) contained a perfect match to at least one octamer in the family. Using each of the reported transcription factor ChIP profiles from Lee et al. (2002), we tested for independence (hypergeometric P-value) of the cluster's genes with the sets of conservative (P < 0.001) and permissive (P < 0.01) transcription factor targets. We also tested coregulation of the cluster's genes in gene expression data (for data sources see Supplemental Table S2). To this end, we identified, for each of the expression conditions, the sets of up- (expression over 1 SD above the average) and down- (expression under 1 SD below the average) regulated genes and computed their P-values of independence from the cluster's genes. GO analysis was performed similarly. We corrected all P-values for multiple testing using the conservative Bonferroni factor. Additional information on the annotation process can be found in the Supplemental material.
Reb1 Analysis
We selected the relevant Reb1 motifs by taking 80 octamers with highest matching probability to the Transfac Reb1 position weight matrix M00307 (Matys et al. 2003). To gain the maximal amount of information, we plotted all selection network arcs, even where confidence intervals were large. This process generates larger clusters than those detected in the global analysis (Fig. 3). To ensure that the Reb1 cluster pattern is nonrandom, we tested the probability of detecting two separated clusters of the observed size in a random graph with the same number of nonnegative-rate arcs as in the original one.
Leu3 Analysis
For each of the 50 motifs with known affinity value (Liu and Clarke 2002), we also added to the list its reverse complement and assumed that they have equal affinities. This added 49 distinct motifs in total. We identified 455 weakly conserved loci, in which at least 3 out of the 5 sequenced sensu stricto species (Cliften et al. 2003; Kellis et al. 2003) contain one of the 99 variants with known affinity, or a neighbor of such a variant. We searched the promoters of S. castellii and S. kluyveri and added matching loci when found (about 15% success for each). Because Leu3 motifs are sparse, we estimated substitution rates based on an exponential distribution.
To test the rate difference between substitutions among high-affinity sites and those changing high- to low-affinity sites, we assumed an exponential model and used a standard generalized likelihood ratio test. The null hypothesis assumes that all substitutions appear with equal rates. The alternative hypothesis allows different rates for the two types of substitutions (high-high and high-low). P-values were generated using resampling.
Acknowledgments
This study was supported in part by the Israel Science Foundation (Grant 309/02). I.G-V. was supported by a Colton Fellowship. A.T. was supported in part by a scholarship in Complexity Science from the Yeshaia Horvitz Association.
The publication costs of this article were defrayed in part by payment of page charges. This article must therefore be hereby marked “advertisement” in accordance with 18 USC section 1734 solely to indicate this fact.
Article and publication are at http://www.genome.org/cgi/doi/10.1101/gr.2064404.
Footnotes
[Supplemental material is available online at www.genome.org.]
References
- Bailey, T.L. and Elkan, C. 1994. Fitting a mixture model by expectation maximization to discover motifs in biopolymers. Proc. Int. Intel. Syst. Mol. Biol. 2: 28-36. [PubMed] [Google Scholar]
- Cliften, P.F., Hillier, L.W., Fulton, L., Graves, T., Miner, T., Gish, W.R., Waterston, R.H., and Johnston, M. 2001. Surveying Saccharomyces genomes to identify functional elements by comparative DNA sequence analysis. Genome Res. 11: 1175-1186. [DOI] [PubMed] [Google Scholar]
- Cliften, P., Sudarsanam, P., Desikan, A., Fulton, L., Fulton, B., Majors, J., Waterston, R., Cohen, B.A., and Johnston, M. 2003. Finding functional features in Saccharomyces genomes by phylogenetic footprinting. Science 301: 71-76. [DOI] [PubMed] [Google Scholar]
- Cowles, C.R., Hirschhorn, J.N., Altshuler, D., and Lander, E.S. 2002. Detection of regulatory variation in mouse genes. Nat. Genet. 32: 432-437. [DOI] [PubMed] [Google Scholar]
- Gasch, A.P., Spellman, P.T., Kao, C.M., Carmel-Harel, O., Eisen, M.B., Storz, G., Botstein, D., and Brown, P.O. 2000. Genomic expression programs in the response of yeast cells to environmental changes. Mol. Biol. Cell 11: 4241-4257. [DOI] [PMC free article] [PubMed] [Google Scholar]
- Ideker, T., Thorsson, V., Ranish, J.A., Christmas, R., Buhler, J., Eng, J.K., Bumgarner, R., Goodlett, D.R., Aebersold, R., and Hood, L. 2001. Integrated genomic and proteomic analyses of a systematically perturbed metabolic network. Science 292: 929-934. [DOI] [PubMed] [Google Scholar]
- Jukes, T.H. and Cantor, C.R. 1969. Evolution of protein molecules. In Mammalian protein metabolism (ed. H.N. Munro), pp. 21-132. Academic Press, New York.
- Kalir, S., McClure, J., Pabbaraju, K., Southward, C., Ronen, M., Leibler, S., Surette, M.G., and Alon, U. 2001. Ordering genes in a flagella pathway by analysis of expression kinetics from living bacteria. Science 292: 2080-2083. [DOI] [PubMed] [Google Scholar]
- Kellis, M., Patterson, N., Endrizzi, M., Birren, B., and Lander, E.S. 2003. Sequencing and comparison of yeast species to identify genes and regulatory elements. Nature 423: 241-254. [DOI] [PubMed] [Google Scholar]
- Lee, T.I., Rinaldi, N.J., Robert, F., Odom, D.T., Bar-Joseph, Z., Gerber, G.K., Hannett, N.M., Harbison, C.T., Thompson, C.M., Simon, I., et al. 2002. Transcriptional regulatory networks in Saccharomyces cerevisiae. Science 298: 798-804. [DOI] [PubMed] [Google Scholar]
- Liu, X. and Clarke, N.D. 2002. Rationalization of gene regulation by a eukaryotic transcription factor: Calculation of regulatory region occupancy from predicted binding affinities. J. Mol. Biol. 323: 1-8. [DOI] [PubMed] [Google Scholar]
- Matys, V., Fricke, E., Geffers, R., Gossling, E., Haubrock, M., Hehl, R., Hornischer, K., Karas, D., Kel, A.E., Kel-Margoulis, O.V., et al. 2003. TRANSFAC: Transcriptional regulation, from patterns to profiles. Nucleic Acids Res. 31: 374-378. [DOI] [PMC free article] [PubMed] [Google Scholar]
- Moses, A.M., Chiang, D.Y., Kellis, M., Lander, E.S., and Eisen, M.B. 2003. Position specific variation in the rate of evolution in transcription factor binding sites. BMC Evol. Biol. 3: 19. [DOI] [PMC free article] [PubMed] [Google Scholar]
- Stone, J.R. and Wray, G.A. 2001. Rapid evolution of cis-regulatory sequence via local point mutations. Mol. Biol. Evol. 18: 1764-1770. [DOI] [PubMed] [Google Scholar]
- Stormo, G.D. 2000. DNA binding sites: Representation and discovery. Bioinformatics 16: 16-23. [DOI] [PubMed] [Google Scholar]
- Wang, K.L. and Warner, J.R. 1998. Positive and negative autoregulation of REB1 transcription in Saccharomyces cerevisiae. Mol. Cell. Biol. 18: 4368-4376. [DOI] [PMC free article] [PubMed] [Google Scholar]
- Waterston, R.H., Lindblad-Toh, K., Birney, E., Rogers, J., Abril, J.F., Agarwal, P., Agarwala, R., Ainscough, R., Alexandersson, M., An, P., et al. 2002. Initial sequencing and comparative analysis of the mouse genome. Nature 420: 520-562. [DOI] [PubMed] [Google Scholar]
WEB SITE REFERENCES
- http://www.cs.tau.ac.il/~rshamir/promoter_evo/; Web site of interactive material related to this paper, including the selection network and MSSMs.