Abstract
The insight provided by fMRI, particularly BOLD fMRI, has been critical to the understanding of human brain function. Unfortunately, the application of fMRI techniques in clinical research has been held back by several factors. In order for the clinical field to successfully apply fMRI, two main challenges posed by aging and diseased brains need to be overcome: (1) difficulties in signal measurement and interpretation, and (2) partial voluming effects (PVE). Recent work has addressed the first challenge by developing fMRI methods that, in contrast to BOLD, provide a direct measurement of a physiological correlate of function. One such method is Arterial Spin Labeling (ASL) fMRI, which provides images of cerebral blood flow (CBF) in physiologically meaningful units. Although the problems caused by PVE can be mitigated to some degree through the acquisition of high spatial resolution fMRI data, both hardware and experimental design considerations limit this solution. Our team has developed a PVE correction (PVEc) algorithm that produces CBF images that are theoretically independent of tissue content and the associated PVE. The main drawback of the current PVEc method is that it introduces an inherent smoothing of the functional data. This smoothing effect can reduce the sensitivity of the method, complicating the detection of local changes in CBF, such as those due to stroke or activation. Here, we present results from an improved PVEc algorithm (ssPVEc), which uses high-resolution structural space information to correct for the tissue-driven heterogeneity in the ASL signal. We tested the ssPVEc method on ASL images obtained on patients with asymptomatic carotid occlusive disease during rest and motor activation. Our results showed that the sensitivity of the ssPVEc method (defined as the average T-value in the activated region) was at least 1.5 times greater than that of the original, functional space, fsPVEc, for all patients.
I. Introduction
Although functional fMRI, especially BOLD fMRI, has been essential to the advancement of our understanding of brain function, most of the understanding comes from studies conducted on healthy brains. Overall, BOLD fMRI has been ineffective for clinical research because the BOLD signal is produced by a complex interaction between multiple physiological parameters and is interpreted using assumptions derived from the healthy brain. These assumptions are not expected to hold in the clinical realm. Furthermore, BOLD fMRI’s susceptibility to 1/f noise makes it unsuitable for detecting slow-varying changes in function. This limits BOLD’s applications and renders it inadequate for longitudinal studies such as those tracking disease progression or response to therapy [1].
Alternate fMRI modalities, such as arterial spin labeling (ASL) fMRI, can provide a direct measurement of a given physiological correlate of function, cerebral blood flow (CBF) for ASL, and therefore could prove more useful to clinical researchers than BOLD fMRI [2]. ASL is particularly attractive compared to BOLD and other CBF measurement techniques because it is (1) completely noninvasive, (2) largely unaffected by 1/f noise, and (3) able to provide an absolute measurement of CBF with higher spatial resolution than the nuclear medicine methods [1].
One of the main disadvantages of ASL, especially for applications in aging and disease, is its non-linear dependence on partial voluming effects (PVE). Our group has developed an algorithm that corrects for PVE in ASL imaging and has shown its applicability in elderly populations [3, 4]. The PVE correction (PVEc) algorithm works on the assumption that for a given tissue type at a given voxel, CBF is identical to the CBF of the nearby voxels within a predefined kernel [3]. Using this assumption of uniformity, sufficient information can be gathered from the surrounding kernel to enable estimation of a voxel’s ASL signal via a linear regression algorithm. The number of equations included in the linear regression is directly dependent on the size of the predefined kernel and the spatial resolution of the ASL data [3]. The main challenge of applying PVEc ASL is that, while the quality of the regression estimate increases with the kernel size, the smoothing effect of the kernel on the ASL signal also increases [5]. In other words, increasing the size of the PVEc kernel weakens the assumption of tissue CBF uniformity while making the estimation more robust.
Although the CBF uniformity assumption holds well for detecting baseline CBF, the smoothing effect of larger kernels complicates the detection of spatially localized changes in CBF, such as those due to activation or disease. To compensate for this effect, Chappell et al. modified the PVEc algorithm to work in the time rather than the space domain [5]. While the Chappell method alleviates the spatial smoothing effect, it requires data taken over longer acquisition times, which can be challenging in clinical settings.
Here we propose an improved PVEc algorithm with higher spatial specificity than the current PVEc method. This is accomplished by using high-resolution brain tissue segmentation data to enable the use of more equations for linear regression, i.e., allowing the PVEc algorithm to operate in the structural space, and also by extending the kernel into the third dimension. We refer to this method as structural space (ssPVEc) to contrast it with the original PVEc method, which we refer to as functional space, fsPVEc. To demonstrate the utility of this method for clinical applications, we compared ssPVEc with fsPVEc ASL on data acquired on patients with carotid occlusive disease where an asymmetry in the ASL signal is expected.
Despite the significant challenges in applying image-processing techniques to brains from older patients with severe atrophy, we found that the sensitivity of the ssPVEc method for detecting changes in CBF due to bilateral motor activation was superior to that of fsPVEc.
II. Methods
A. Image Acquisition
Functional ASL images and high-resolution 3D T1-weighted (MPRAGE) images were acquired on 5 patients with carotid occlusive disease as described by Marshall et al. [6]. CBF images were obtained using pseudo-continuous ASL (pCASL) with background suppression [2].
Images were acquired with the following parameters: Structural T1-weighted MPRAGE image: TE = 3ms, TR=6.7ms, in plane resolution .9 × .9 mm2, slice thickness = .9 mm, 120 slices. pCASL: TE = 14 ms, TR = 4s, in plane resolution 3.4 × 3.4 mm2, slice thickness = 8 mm/1 mm gap, flip angle = 90°, labeling duration = 2.0 s, post-labeling delay (PLD) = 1.5s, PLD was adjusted for slice timing of 50ms/slice as PLDn = 1.5 + (n-1) × .05, n = slice number.
Patients were asked to perform bilateral opening and closing of the fist paced at 1Hz. For each patient, each condition (baseline/activation) contained 15 ASL images for a total of 60 ASL images (30/condition).
B. Image Processing
In order to compare fsPVEc with ssPVEc, for each patient, data were processed in the functional, low-resolution space (3.4 × 3.4 × 9 mm3) and high-resolution structural space (0.9 × 0.9 × 0.9 mm3), respectively.
For ssPVEc, the lower resolution functional images needed to be placed into the high-resolution structural image space. To accomplish this, the mean image of all the control ASL images was co-reregistered to the structural using SPM8 [7]; the same transformation was then applied to each frame of the functional ASL data. For fsPVEc, each patient’s structural image was co-registered to the mean of that patient’s ASL baseline control images.
To enable the study of patients with cortical atrophy, we devised a method to clean images by removing all non-brain features from both structural and functional data. First, tissue probability maps were generated for gray matter (GM), white matter (WM), and CSF using SPM08’s brain segmentation algorithm [7]. A brain tissue mask was created by thresholding the sum of all three tissue posterior probability maps to include only voxels comprised of at least 50% brain tissue (PGM+PWM+PCSF ≥ 0.5). This method, which we refer to as de-skulling was performed on both the structural and functional data prior to coregistration.
The ssPVEc algorithm allowed for linear regression in 3-dimensions, and was run using a kernel size of 9 × 9 × 3 voxels (resulting in 243 equations available to the linear regression algorithm); the fsPVEc algorithm was run using 9 equations drawn from a kernel size of 3 × 3 × 1 voxels. The option for a 3-dimensional kernel also allowed for better comparison between high and low resolution data because the depth of the kernel in millimeters could be made roughly equal across both modalities.
C. Data Analysis
The PVEc algorithm was run in both ‘fs’ and ‘ss’ spaces on all functional ASL images. For each patient, the activation regions of interest (actROI) was defined on each hemisphere and for each PVEc space as any contiguous group of voxels (n > 50) surviving the a priori selected statistical threshold of T ≥ 3, testing for non-zero change in the ASL signal:
ΔASL = (ASLactivation – ASLbaseline).
For each patient, this analysis was performed in the patient’s native image space.
III. Results
A. Quality of cross-modality image coregistration
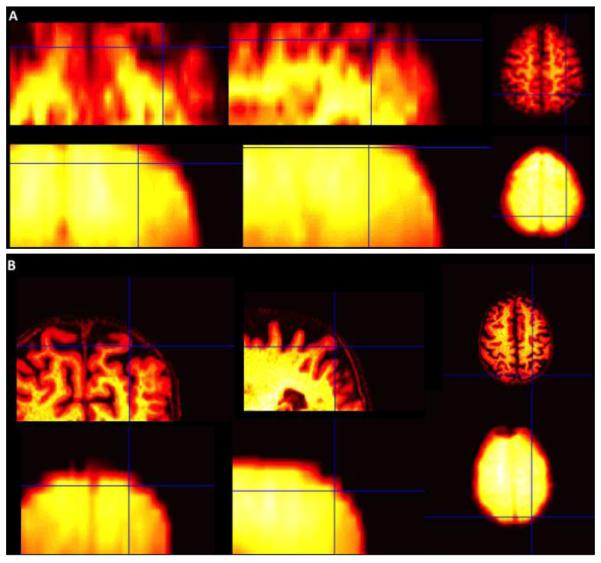
In PVEc ASL, CBF is computed by combining the tissue information obtained from the high-resolution structural images with the signal from the low-resolution functional ASL images. In the previous fsPVEc studies, the high-resolution structural image was down-sampled to the low-resolution functional space [3]. In contrast, the ssPVEC algorithm presented here is based on up-sampling the functional images to the high-resolution structural space as described in Methods. To give a sense of the coregistration quality in the primary motor cortex for both PVEc methods, we show results from a patient with substantial frontal lobe atrophy, (Fig.1).
Fig 1.

(A) Coregistration of the structural (1st row) with background suppressed pCASL images (2nd row) in the low-resolution functional space (fs). (B) Same procedure as in (A), using the high-resolution structural space (ss).
B. Comparison of ASL CBF images obtained from ssPVEc and fsPVEc
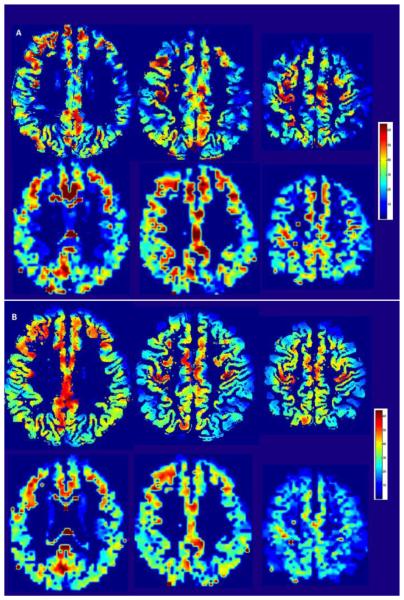
Fig. 2A shows single time-point ASL images (selected at random from the patient in Fig.1) for the ssPVEc and fsPVEc methods (1st and 2nd rows, respectively). Images in Fig.2B represent CBF ASL averaged over 30 time-points, which was the number of time-points per condition. It is important to note that these images were obtained from the same acquired data – the only difference lies in the PVEc method that was used in post-acquisition image processing. The image quality of the data from the other 4 patients was superior to the one shown in Fig.2, which was selected as a patient with severe atrophy.
Fig 2.
(A): Single time-point pCASL CBF images from the same patient computed in the structural space using ssPVEc (top) and in the functional space using fsPVEc (bottom). (B) Same as 2A but the CBF images were averaged over 30 time-points of the activation condition. (The color bar is in units of CBF mL/100g*min.
C. The ssPVEc method showed higher sensitivity in detecting motor-activation changes in CBF than the fsPVEc
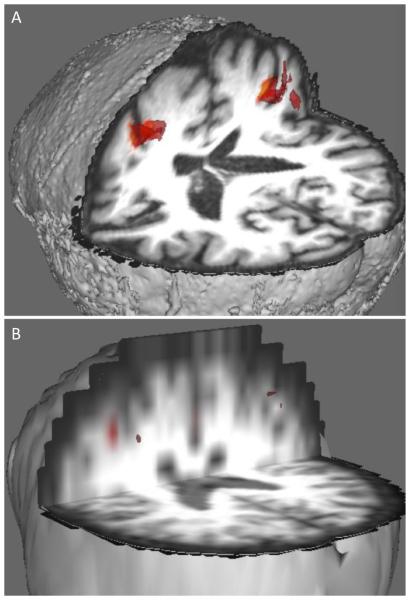
The average T-values in the activated regions (as defined in Methods) were on average 1.5x larger for the ssPVEc method compared to the fsPVEc. Fig.3 shows the activated ROIs (defined as contiguous voxels (n > 50) that survived the T > 3 statistical threshold) for both ssPVEc and fsPVEc in a representative patient. The ssPVEc was able to detect activation in the occluded hemisphere that was missed by the fsPVEc, presumably due to the smoothing effect of the larger kernel and the lower quality of the regression algorithm.
Fig. 3.
Statistical T-maps for the ΔASL = (ASLact - ASLrest) contrast overlaid on the structural images for ssPVEc (A) and for fsPVEc (B).
It is worth noting that for the patient shown in Figs. 1 & 2, no voxels survived the statistical threshold for the fsPVEc method. In contrast, the ssPVEc, was able to detect a change in ASL signal in the unoccluded hemisphere while no voxels were detected in the occluded hemisphere.
IV. Conclusions and Discussion
The results presented here suggest that applying the PVEc method on the ASL images registered to the high-resolution structural image might be more effective for analyzing activation data on patients than the original PVEc methods, which were used in the low-resolution functional space [3, 5]. The motor activation detected with the new, ssPVEc, method had higher T-values. For all patients, the average T-values for the activated motor ROI (defined as contiguous voxels (n > 50) surviving the T ≥ 3 threshold) were 1.5 ≥ times higher than those obtained using the ssPVEc method. The total number of voxels in the activated ROI was also higher for the ssPVEc for all patients. (Results similar to Fig.3 were obtained from all patients.)
The conclusions from this work should be drawn only in relation to the effectiveness of the technique. In other words, the results of this study apply only to the validation of the new ssPVEc technique and should not be interpreted as clinical findings, and also that this study did not include any attempts to correct for other confounds in ASL imaging such as arterial transit time, presence of collateral flow, and other MRI and clinical correlates of CBF. Because of these limitations, we chose not to perform any group analyses on the data or transform the images into the MNI space. The amount of variability in both MR and physiological parameters across asymptomatic patients with carotid occlusive disease would invalidate any group analysis for such small sample size. Validation of this method using a larger patient population with varying atrophy morphologies is necessary.
Finally, because of the lack of ground truth in experimental data, additional work is needed to provide an objective metric of PVEc’s performance. For example, the increase in the observed sensitivity of ssPVEc could be empirically measured independent of experimental confounds by using simulated ASL data.
Acknowledgment
This work was funded by NINDS R01-NS076277 (RSM, RML).
REFERENCES
- [1].Borogovac A, et al. Arterial Spin Labeling fMRI: Advantages, Theoretical Constraints and Experimental Challenges in Neurosciences. International Journal of Biomedical Imaging. 2012 doi: 10.1155/2012/818456. [DOI] [PMC free article] [PubMed] [Google Scholar]
- [2].Alsop DC, et al. Recommended implementation of arterial spin-labeled perfusion MRI for clinical applications: A consensus of the ISMRM perfusion study group and the European consortium for ASL in dementia. Magnetic Resonance in Medicine. 2015;73:102–116. doi: 10.1002/mrm.25197. [DOI] [PMC free article] [PubMed] [Google Scholar]
- [3].Asllani I, et al. Regression algorithm correcting for partial volume effects in arterial spin labeling MRI. Magnetic Resonance in Medicine. 2008;60:1362–1371. doi: 10.1002/mrm.21670. [DOI] [PubMed] [Google Scholar]
- [4].Asllani I, et al. Separating function from structure in perfusion imaging of the aging brain. Human Brain Mapping. 2009;30:2927–2935. doi: 10.1002/hbm.20719. [DOI] [PMC free article] [PubMed] [Google Scholar]
- [5].Chapell M. Partial volume correction of multiple inversion time arterial spin labeling MRI data. Magnetic Resonance in Medicine. 2011;65:1173–83. doi: 10.1002/mrm.22641. [DOI] [PubMed] [Google Scholar]
- [6].Marshall RS, et al. Static and dynamic cerebral autoregulation dissociate in asymptomatic carotid artery disease. Stroke, Suppl1 ATP181-ATP181. 2015 [Google Scholar]
- [7].Friston KJ. Statistical Parametric Mapping. Academic Press. 2007 [Google Scholar]


