

Abstract
Comprehensive genome scans involving many thousands of SNP assays will require significant amounts of genomic DNA from each sample. We report two successful methods for amplifying whole-genomic DNA prior to SNP analysis, multiple displacement amplification, and OmniPlex technology. We determined the coverage of amplification by analyzing a SNP linkage marker set that contained 2320 SNP markers spread across the genome at an average distance of 2.5 cM. We observed a concordance of >99.8% in genotyping results from genomic DNA and amplified DNA, strongly indicating the ability of both methods used to amplify genomic DNA in a highly representative manner. Furthermore, we were able to achieve a SNP call rate of >98% in both genomic and amplified DNA. The combination of whole-genome amplification and comprehensive SNP linkage analysis offers new opportunities for genetic analysis in clinical trials, disease association studies, and archiving of DNA samples.
The analysis of single nucleotide polymorphisms (SNPs) in the human genome promises to enhance our understanding of the significance of human genetic variation and to advance significantly the area of pharmacogenetics (Roses 2002). There is an emerging number of cases in which individual SNPs or linked groups of SNPs are significantly correlated with a disease (Li et al. 2002; Zhou et al., 2002; Smith et al. 2003; Wang and Hegele 2003), or are associated with the effectiveness of a drug treatment (Hijikata et al. 2001; Wang et al. 2001). Therefore, the overall goal in the area of pharmacogenetics is to establish statistically significant correlations between SNPs and disease or the outcome of treatment regimes. An increasingly complex SNP panel is needed to scan thousands to millions of SNPs to identify those that alone or together with other SNPs relate to the development of diseases or to the effectiveness of treatments. Additionally, patients may choose to have their genotype profile evaluated to predict their susceptibility to disease or to decide on an optimal treatment regime. The number of assays required for SNP genotyping of large patient pools or entire populations requires a scalable genotyping platform that can provide accurate SNP calls in a cost-effective manner.
Much of human genetics research depends on availability of good-quality DNA. DNA extraction from whole blood or generated cell lines poses a significant cost and time investment. Recently, several whole-genome amplification (WGA) techniques have been presented as capable of amplifying DNA from trace quantities and with less error than traditional PCR. Potential advantages of WGA include amplifying DNA from nanogram amounts, amplifying DNA from Guthrie cards, and large cost and time savings compared with alternatives such as generating cell lines from individuals.
PCR-based methods for WGA include degenerate oligonucleotide primed PCR (DOP-PCR; Telenius et al. 1992; Cheung and Nelson 1996) and primer extension PCR (PEP; Zhang et al. 1992). These methods may generate nonspecific amplification artifacts (Cheung and Nelson 1996), provide incomplete coverage of loci (Paunio et al. 1996; Dean et al. 2002), and produce short products (<3 kb) that cannot be used in many applications (Telenius et al. 1992).
Recently, two new methods for WGA have been developed. The first, termed multiple-displacement amplification (MDA), uses the highly processive φ29 DNA polymerase and random exonuclease-resistant primers in an isothermal amplification reaction (Dean et al. 2002). This method is based on strand-displacement synthesis (Lizardi et al. 1998; Lage et al. 2003), and was originally developed for amplifying large circular DNA templates such as plasmids and BAC DNAs (Dean et al. 2001). MDA-generated DNA products are >10 kb in length. The performance of MDA was assessed for a variety of applications including SNP and STR analysis (Hosono et al. 2003; O.A. Alsmadi, C.J. Bornarth, S. Song, M. Wisniewski, J. Du, J.P. Brockman, A.F. Faruqi, S. Hosono, Z. Sun, Y. Du, et al. in prep.), restriction fragment length polymorphism (RFLP), and comparative genome hybridization (CGH; Dean et al. 2002; Lage et al. 2003).
The second method, OmniPlex, converts randomly fragmented genomic DNA into a library of inherently amplifiable DNA fragments of defined size. This library can be effectively amplified several thousandfold with the help of a high-fidelity DNA polymerase. The library can be reamplified to achieve a final amplification of over a millionfold without degradation of representation (Langmore 2002).
The goal of this study was to determine whether both of these new WGA techniques would result in the production of the large amounts of DNA necessary for large-scale genotyping, to assess genome coverage, and to determine whether the amplified DNA, in comparison to the original genomic DNA, would produce accurate genotyping calls. Duplicates of five human DNA samples derived from lymphoblasts were amplified by each method. The resulting 20 amplified samples and the original genomic DNA samples were genotyped using a linkage panel of 2320 SNPs distributed throughout the genome. Fidelity of amplification was assessed by the correlation of SNP calls from genomic and amplified DNA
RESULTS
Sample Dissemination
Five individual sample DNAs from the Coriell Cell Repositories' CEPH subcollection were adjusted to a concentration of about 10 ng/μL and distributed into vials containing a total of 10 μL (∼100 ng) of DNA. Duplicate vials from each DNA were coded to eliminate any cues to their association and packaged in dry ice for shipment. Each participant of this study received a total of 10 DNA samples containing ∼100 ng DNA to be whole-genome amplified. Sample DNA was quantified using the PicoGreen Assay (Ahn et al. 1996) and amplified as described in the subsequent sections.
Multiple Displacement Amplification
MDA is a cascading, strand-displacement reaction using random hexamers and φ29 DNA polymerase (Dean et al. 2002; Hosono et al. 2003). The 20 human genomic DNA samples were amplified in an overnight (16-h) incubation at 30°C, and the amplified product was analyzed by agarose gel electrophoresis. All 10 amplification reactions gave DNA products with average lengths >10 kb (Fig. 1) and concentrations ranging from 0.75 to 0.80 μg/μL (Table 1A). The amplified DNA was analyzed for genome coverage in the SNP genotyping assay described below.
Figure 1.
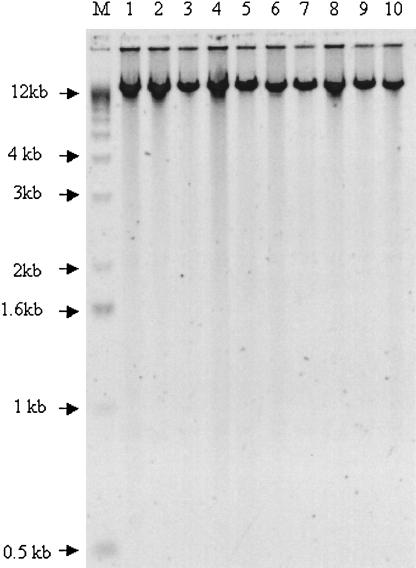
Amplification products after MDA amplification. All 10 amplified genomic DNA samples were loaded onto an agarose gel, separated by electrophoresis, and imaged after staining with SYBR Green (Molecular Probes).
Table 1A.
Multiple Displacement Amplification
| Sample | Amplified amount (μg) | Sample | Amplified amount (μg) |
|---|---|---|---|
| 1 | 77 | 4 | 77 |
| 2 | 75 | 8 | 79 |
| 3 | 79 | 9 | 78 |
| 5 | 76 | 7 | 77 |
| 6 | 75 | 10 | 76 |
Amplification of Coriell CEPH DNA by multiple displacement amplification (MDA). The 10 samples were amplified using MDA. The left and right columns represent the same sample provided as blind duplicates. Comparison of the duplicates indicates that amplification was similar between all samples, irrespective of potential variance of sample concentration.
OmniPlex Amplification
OmniPlex Libraries were successfully created from each sample and amplified. Table 1B summarizes the amplification results and Figure 2A shows fluorescence profiles that monitor the amplification process in real time during WGA. At 15 cycles, when amplification was stopped, 25–75 μg was produced after an average amplification of 400-fold. Subsequent tests using 3–4 additional cycles of PCR have demonstrated an increased DNA plateau of 200 μg (400 ng/μL) after an average amplification of 2000-fold (data not shown).
Table 1B.
OmniPlex Amplification
| Sample | Amplified amount (μg) | Sample | Amplified amount (μg) |
|---|---|---|---|
| 1 | 41.5 | 4 | 39.0 |
| 2 | 25.0 | 8 | 34.0 |
| 3 | 30.0 | 9 | 46.5 |
| 5 | 75.0 | 7 | 72.5 |
| 6 | 27.5 | 10 | 26.5 |
Amplification of Coriell CEPH DNA by OmniPlex WGA. The 10 samples were amplified using OmniPlex WGA. The left and right columns represent the same sample provided as blind duplicates. Comparison of the duplicates indicates that amplification was similar between duplicates, with most of the variation arising from sample-to-sample differences in the amount of starting DNA.
Figure 2.

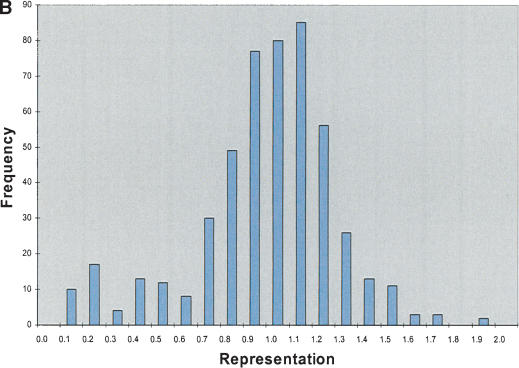

STS analysis of OmniPlex amplified DNA. (A) Amplification curves for 1 well of each of the 10 samples of DNA. Fluorescence intensities after each cycle of PCR in the Bio-Rad ICycler were normalized to the maximum intensity. Duplicate samples share the same symbol. (B) Representative histogram of the representation of 103 STS sites within all 10 of the amplified DNA samples. The value for each STS was divided by the average STS value for that sample and the representation was subsequently calculated by taking the average values for the duplicate samples. Greater than 90% of sites were within a factor of 2 of the mean amplification. The total number of comparisons was 500. (C) Histogram of ratios of each 103 STS to each other for the five different DNA sources. Duplicate samples were averaged and the values were normalized to a copy number of 2 by dividing by the average ratio for each STS pair over the 10 samples and multiplying by two. Total number of ratios is 20,930 and 95.2% of the ratios were between 1.5 and 2.5 copies.
The reproducibility of OmniPlex library production and amplification is reflected in the fact that the duplicates produced very similar concentrations of DNA. The increased DNA production in samples 5 and 7 is attributed to the one-cycle shift in the amplification curves for these two samples, suggesting that the starting DNA concentration was double that of the other samples. The variation in the DNA production in Table 1B is related to the variation in the starting amounts of DNA in the five Coriell samples and to the fact that PCR was stopped after only 15 cycles, which was insufficient to reach saturation. Thus, an OmniPlex library was successfully created and amplified from each DNA sample. Subsequent results show reproducible creation and amplification of OmniPlex libraries from variable starting amounts of DNA from 5 to 200 ng (J.H. Pinter, in prep.).
Figure 2B is a histogram of the representation, determined by real-time PCR, of 103 STS sites in the amplified DNA from every sample. For all samples, >90% of sites were within a factor of 2 of the mean amplification. If OmniPlex WGA reproducibly amplifies the same sites in different libraries, the amplified DNA can be used to determine gene copy number. To test the reproducibility of amplification of specific sites, the real-time PCR data were used in a pairwise comparison of each STS with all other STSs for all libraries. Figure 2C depicts a histogram of the ratios of the STS concentrations for every library, normalized to the average ratio from all 10 amplified samples (multiplied by two to simulate chromosome copies). On the basis of the tight distribution of these ratios, it is apparent that the amplified OmniPlex DNA maintains relative copy number information. Specifically, >95% of the 20,930 hypothetical gene copy numbers were between 1.5 and 2.5, indicating that loss or addition of one gene copy is readily distinguishable.
Genotyping
Samples amplified by the two independent methods were transferred to a bar-coded plastic 96-well conical microtiter plate and sent to Illumina, Inc. for genotyping. Both the MDA and the OmniPlex-amplified DNAs and the corresponding unamplified genomic DNAs were genotyped using the Illumina linkage panel version 1 containing 2320 SNPs distributed across the genome (Fig. 3; The Illumina linkage panel has recently been enlarged to >4600 SNPs.) All chromosomes except the Y-chromosome were represented, at an average distance of 2.5 cM between SNPs. The average minor allele frequency was 0.37 for the SNP linkage panel used in this study. The results from both studies are summarized in Tables 2A, 2B, 3A, and 3B, in which we compare the concordance of each sample with its duplicate and the concordance of amplified versus original genomic DNA (Table 2A,B). We report as well the overall call rate and overall concordance of genotyping calls between amplified and unamplified DNA (Table 3A,B). Using a quality measure (GenCall score >0.1) to limit the call rate to 98%–99%, the genotypes were 99.86% (MDA) and 99.89% (OmniPlex) concordant for common calls between the native and independently amplified DNA. We examined the data carefully to see whether low call rates or errors showed a pattern related to particular SNP loci, or to amplified DNA samples. Only one locus from the Omniplex-amplified samples failed to give any calls, and none from the MDA-amplified samples. Four loci differed in call rate between native and amplified samples by >20% for the MDA study, and 13 loci in the Omniplex study. There were three loci in the Omniplex study for which the amplified samples had a higher call rate by >20% compared with native samples. Where calls were made, concordance was similar even when call rate differed, and there was no pattern or clustering of the locations of these loci. In summary, the data indicate that the genotyping assay called genotypes as well on the amplified DNA as on the unamplified DNA. In cases where the amplified DNA appeared to genotype better than genomic DNA, this is likely to be a function of increased material at particular SNPs, as DNA concentration is a major determinant of the assay's success (Fan et al. 2003).
Figure 3.
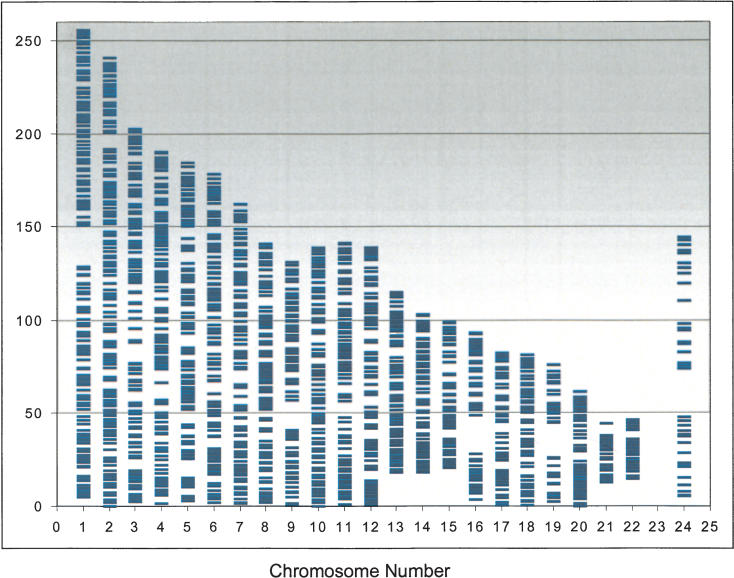
Graphical representation of SNP distribution over human chromosomes of the SNP linkage panel used in this study. A total of 2320 SNP markers are spread across the genome, excepting the Y-chromosome, at an average distance of 2.5 cM.
Table 2A.
Multiple Displacement Amplification
| gDNA source | gDNA concordance (%) | WGA concordance (%) | gDNA:WGA concordance (%) |
|---|---|---|---|
| 1 and 4 | 100 | 99.64 | 99.73 |
| 2 and 8 | 99.96 | 99.74 | 99.80 |
| 3 and 9 | 99.98 | 99.93 | 99.96 |
| 5 and 7 | 99.98 | 99.93 | 99.96 |
| 6 and 10 | 100 | 99.69 | 99.86 |
Genotyping concordance between genomic and MDA amplified DNA. Values in the gDNA column are concordance rates between each replicate pair (two samples). Values in the WGA column are concordance rates between the amplified products of a gDNA replicate pair (two samples). Values in the gDNA:WGA column are the average concordance of four comparisons of gDNA with amplification product, where both gDNA samples are compared to both related amplification products. Assays with GenCall scores >0.1 are included (assay call rate >98%).
Table 2B.
OmniPlex Amplification
| gDNA source | gDNA concordance (%) | WGA concordance (%) | gDNA:WGA concordance (%) |
|---|---|---|---|
| 1 and 4 | 100 | 99.96 | 99.88 |
| 2 and 8 | 99.99 | 99.91 | 99.86 |
| 3 and 9 | 100 | 99.93 | 99.92 |
| 5 and 7 | 99.98 | 99.96 | 99.88 |
| 6 and 10 | 99.99 | 99.97 | 99.92 |
Genotyping concordance between genomic and OmniPlex amplified DNA. Values in the gDNA column are concordance rates between each replicate pair (two samples). Values in the WGA column are concordance rates between the amplified products of a gDNA replicate pair (two samples). Values in the gDNA:WGA column are the average concordance of four comparisons of gDNA with amplification product, where both gDNA samples are compared with both related amplification products. Assays with GenCall scores >0.1 are included (assay call rate >98%).
Table 3A.
Summary of Call Rates and Genotyping Concordance for Genomic and MDA Amplified DNA
|
Genotyping summary (Gen Call score >0.1)
| |||
|---|---|---|---|
| Genomic DNA | MDA DNA | ||
| Assays Run | 23,200 | 23,200 | |
| Calls Made | 22,808 | 22,720 | |
| Call Rate | 98.31% | 97.93% | |
| Concordance | 99.86% | ||
Ten samples were analyzed at 2320 sites each. All data were pooled, as there was no significant difference in number of calls made or concordance between samples.
Table 3B.
Summary of Call Rates and Genotyping Concordance for Genomic and OmniPlex Amplified DNA
|
Genotyping summary (GenCall score >0.1)
| |||
|---|---|---|---|
| Genomic DNA | OmniPlex DNA | ||
| Assays Run | 23,200 | 23,200 | |
| Calls Made | 23,004 | 23,030 | |
| Call Rate | 99.16% | 99.27% | |
| Concordance | 99.89% | ||
Ten samples were analyzed at 2320 sites each. All data were pooled, as there was no significant difference in number of calls made or concordance between samples.
DISCUSSION
WGA is a necessary prerequisite to genotyping when limited human genomic DNA is available. This need will become more pressing as genotyping of hundreds of thousands of SNP loci becomes routine. To permit large-scale SNP calling, as in this study, WGA techniques have to be free of representational bias, because any sequence or regional bias would compromise SNP calls. All previous WGA methods examined either a small number of SNP loci (45 or less) after WGA of human DNA (Dean et al. 2002; Lovmar et al. 2003), or used a lower resolution method such as array comparative genomic hybridization (Lage et al. 2003). We therefore decided to test two recently developed methods to amplify the whole genome from human test samples, namely multiple displacement amplification (Molecular Staging, Inc.) and OmniPlex amplification (Rubicon Genomics). We assessed any potential bias in amplification by performing a comprehensive genome analysis with a SNP linkage marker set containing 2320 SNP markers spread across the genome at an average distance of 2.5 cM. We then compared the concordance and percentage of successful SNP calls between whole-genome amplified DNA with that of unamplified DNA from the same sample. A concordance of 99.9% was observed in the genotyping results between unamplified genomic DNA and amplified DNA product, demonstrating the complete coverage of the genome with minimal amplification bias. Although the two WGA methods use different strategies to amplify DNA, the outcome of this study shows that both perform exceptionally well for the purpose of amplifying DNA for SNP genotyping. The finding that there are no significant differences in reproducibility and concordance values between the two different methods of WGA is striking. It suggests that both methods are well suited for the representative amplification of genomic DNA. The choice of method will therefore depend on the intended application. The MDA method has the advantage that it can generate a large amount and large fragments of amplified genomic DNA in one step. This material can then be used in further rounds of reamplification. The OmniPlex method has the advantage that it enables the creation of whole-genome DNA libraries from degraded as well as intact DNA samples. These can be archived and repeatedly reamplified.
The MDA method results in consistent DNA yields regardless of the starting DNA amounts. The method can also be easily adapted for amplifying genomic DNA directly from clinical samples such as whole blood, buccal swabs, and blood spots, eliminating the need for DNA purification prior to amplification (Hosono et al. 2003). The amplified DNA is highly representative of the original genomic DNA template with minimal bias between different loci. Of 47 single copy loci tested, none was represented at <0.5 or >3 copies per genome in the amplified DNA (Hosono et al. 2003). DNA amplified by this method has also been used to develop a comprehensive microarray representing a human chromosome for analysis of DNA copy number variation. The array accurately diagnosed deletions, amplifications, locus instability, and translocation breakpoints important in cancer and genetic disease (Buckley at al. 2002).
Further analysis of the OmniPlex whole-genome amplified product by real-time PCR using 103 human STS sites demonstrated that the amplified material was highly representative, with >90% of sites being within a factor of 2 of the mean. In addition, the amplified DNA seemed suitable for determination of gene copy number—a test that is significant for the understanding of genome instabilities that are important in cancer. The success of these two assays mirrors preliminary results indicating the equivalence of OmniPlex amplified DNA with genomic DNA for purposes of genotyping using TaqMan, single-base extension, and other homogeneous and surface-bound SNP assays (J.H. Pinter, in prep.).
Additional evidence regarding the utility of OmniPlex technology for the analysis of DNA copy number has been demonstrated by the amplification of single-copy sorted chromosomes (Gribble et al. 2004). In this study, single-copy sorted chromosomes were amplified with a 92% success rate and used to determine the composition and breakpoints of aberrant chromosomes by chromosome painting and array-CGH. The ability of OmniPlex technology to amplify material from a single sorted chromosome allows the analysis of chromosomal abnormalities even when a pure chromosomal preparation cannot be obtained by sorting.
The fidelity and lack of bias of both methods allow the immortalization of DNA in vitro. WGA has significant time and cost benefits over immortalizing and storing leukocytes, the current method of choice for creating large amounts of patient DNA. Both methods will have broad applications in the areas of forensics and prenatal diagnostics, where DNA samples are limited. Finally, the amplification schemes used here also enable the production of sufficiently large quantities of whole-genome amplified DNA for genome-wide linkage disequilibrium studies involving hundreds of thousands of SNP assays.
METHODS
Chemicals and Reagents
Oligonucleotides and Sentrix Arrays were obtained from Illumina, Inc. The REPLI-g kit (Molecular Staging, Inc.) was used to amplify genomic DNA samples by MDA. All chemicals and other reagents were obtained from Sigma-Aldrich.
DNA Sample Source and Preparation
A panel of five human genomic DNA samples was obtained from Coriell Cell Repositories. The samples corresponded to the CEPH subcollection and were derived from lymphoblast cell lines. DNA samples 1 and 4 corresponded to Coriell CEPH DNA NA12559, samples 2 and 8 to NA07057, samples 3 and 9 to NA07009, samples 5 and 7 to NA12148, and samples 6 and 10 to NA07006. DNA sample concentration was adjusted to 1 ng/μL, and samples were frozen. Samples were distributed without their identity being revealed, and only after successful genotyping were duplicates identified.
Multiple Strand Displacement Method
The multiple displacement amplification method uses exonuclease-resistant random hexamers and the φ29 Polymerase in an isothermal (31°C) reaction. Samples were quantified using the PicoGreen Assay (Ahn et al. 1996). A total of 10 ng of human genomic DNA was placed into a 96-well PCR plate in a total volume of 100 μL containing 37 mM Tris-HCl (pH 7.5), 50 mM KCl, 10 mM MgCl2, 5 mM (NH4)2SO4, 1.0 mM dNTPs, 50 μM exonuclease-resistant random hexamer, 1 U/mL of yeast pyrophosphatase, and 800 U/mL of φ29 DNA polymerase. Reaction mixtures were incubated for 16 h at 30°C in a PCR thermocycler system (Applied Biosystems) and terminated by heating to 65°C for 3 min. The amplification products were quantified by PicoGreen and found to have been amplified about 7500-fold (see Table 1A). The crude mixture was used directly for genotyping.
Omniplex Genomic DNA Sample Preparation
OmniPlex Technology amplifies the whole genome en masse using universal primers. Information regarding the protocols and reagents for the OmniPlex WGA process and its availability for research use can be accessed on line at www.rubicongenomics.com. A brief description of the protocol used in this study follows. The 10 dilute Coriell CEPH DNA samples in 10 μL of TE (10 mM Tris, 1 mM EDTA at pH 8), nominally containing 100 ng of genomic DNA, were diluted with 100 μL TE-Lo (10 mM Tris, 0.1 mM EDTAat pH 8.0), heated to 65°C for 2 min, vortexed for 15 sec, heated to 65°C for 2 min, and centrifuged 12 min at 16,000g. The concentrations of the samples were not identical as assayed by two independent methods, using real time PCR and PicoGreen staining. This may have been a consequence of storage for several months in dilute solution. The DNA samples were subsequently randomly fragmented and converted into OmniPlex in vitro libraries, having random genomic DNA of 1.5 kb average size, flanked by universal adaptors that are 20 bases long. Each OmniPlex Library was added to 400 μL of master reaction containing 1 μM universal primers having the sequence GTAATAC GACTCACTATA (IDT), 1× Titanium taq (Clontech), 200 nM dNTP (Clontech), all in 1× Titanium taq buffer (Clontech). Twenty 25-μL aliquots from each OmniPlex library were transferred into a 96-well plate and amplified using PCR by denaturing at 95°C for 3.5 min, followed by 15 thermal cycles (94°C, 15 sec/65°C, 2 min). One well from each sample was supplemented with 0.25 μL of SYBR Green I (Amersham; 1:1000 dilution) and 0.25 μL Fluorescein Calibration Dye (Amersham; 1:1000 dilution) in order to monitor the amplification. All aliquots from each DNA sample were then pooled, purified using Qiaquick columns (QIAGEN), and resuspended in 500 μL of 10mM Tris (pH 8.5). The final DNA concentration was determined by spectrophotometric analysis. Real-time PCR was then used to determine the final representation of 103 sequence tagged sites (STS) comprising coding, noncoding, and repetitive elements randomly chosen from the human UniSTS database and verified to amplify as single bands. Concentrations of each of the STS loci in the amplified samples were standardized by simultaneous amplification of 10, 1, and 0.1 ng amounts of fragmented DNA isolated from blood. Appropriate standard curves were generated using the ICycler (BioRad) software to determine the concentrations of each STS site in the amplified DNA samples.
SNP Genotyping Assay
We used a highly multiplexed genotyping assay based on allele-specific extension of oligos hybridized directly to genomic DNA (Fan et al. 2003). Three probes are designed for each identified SNP locus. The two 5′ probes are complementary to the genomic DNA for about 20 bases and are allele specific, terminating at the site of the targeted polymorphism and differing at that site. After a short gap 3′ to the SNP site, the third probe, termed the locus-specific probe, is also complementary to the genomic DNA for about 20 bases. All three oligonucleotide probes have a universal PCR primer site tail. The locus-specific probe also contains a unique address sequence between the complementary region and the primer tail that targets the complementary oligonucleotide probe to a particular bead type. The three probes from up to 1152 different SNP loci are pooled and hybridized to a small sample of genomic DNA. Hybridized allele-specific probes whose 3′ ends are complementary to the dimorphic base at the SNP position are extended by a DNA polymerase efficiently, whereas allele-specific probes whose 3′ ends mismatch the base at the SNP position will not be extended efficiently. The extended products from the allele-specific probes terminate adjacent to the 5′ phosphate of the locus-specific probe and are ligated to the locus-specific probe. These full-length copies provide the template for PCR amplification using Cy3- and Cy5-labeled primers (for the allele-specific probe) and a biotin-labeled primer (for the locus-specific probe). After PCR amplification, products are bound to streptavidin paramagnetic particles and the dye-labeled strand is isolated.
Array Hybridization
Sentrix array matrices (Illumina) were used to read out the genotypes. The Sentrix array matrix consists of 96 separate arrays, each with 49,777 individual light-conducting fiber strands fused together into a hexagonally packed bundle (Oliphant et al. 2002). Each individual fiber bundle is ∼1.4 mm across. The optical fiber strands are chemically etched to create a microscopic well at the end of each strand. The wells are filled with 3-micron diameter silica beads. Each bead has over 500,000 identical copies of an oligonucleotide hybridization probe covalently attached. These probes were selected so that they do not cross-hybridize with each other or with sequences in the human genome. More than 1500 different bead types are pooled together. When assembled on fiber bundles, this bead library forms a universal array of capture elements that hybridize to complementary sequences in SNP assays. The random distribution of >1500 unique bead types among 49,777 fibers per bundle results in a redundancy of ∼30 beads of each type per bundle. Consequently, each SNP genotype determination is the result of data averaged from multiple beads, significantly reducing the possibility of error. Due to the random location of each bead, it is necessary to decode the array to map the locations of each bead type. Arrays are decoded during manufacturing by sequential hybridization steps with different fluorescently labeled decoder oligonucleotides (Gunderson et al. 2004). The decoding process identifies and quality controls all beads used for an assay and generates array-specific location coordinates.
Array Imaging
Sentrix arrays were imaged on a fluorescence imaging system with a resolution of <1 μm (Barker et al. 2003).
Data Analysis
We used a proprietary sample and laboratory management system, in which each sample is given a unique identifier and is tracked throughout the process by real-time interaction with a LIMS database. The LIMS tracks genotype calls as they are automatically produced from color and intensity values for each SNP locus. A quality score, the GenCall score, is calculated for each SNP call, reflecting the degree of separation between homozygote and heterozygote clusters for that SNP and the placement of the individual call within a cluster. GenCall scores have been shown to correlate with the accuracy of the genotyping call (Oliphant et al. 2002; Fan et al. 2003). Concordance of allele calls was calculated for the duplicate genomic samples and duplicate amplified samples. For the comparison of genomic to amplified DNA, each of the duplicate genomic DNA's allele calls was compared with both of the corresponding amplified DNA allele calls, and the four comparisons were averaged together.
Acknowledgments
We thank our colleagues at GlaxoSmithKline, Illumina, Molecular Staging, and Rubicon for their help and input, and for directly and indirectly contributing to this study. We thank Dr. Jeanne Loring and Dr. Michael Egholm for critical readings of the manuscript.
The publication costs of this article were defrayed in part by payment of page charges. This article must therefore be hereby marked “advertisement” in accordance with 18 USC section 1734 solely to indicate this fact.
Article and publication are at http://www.genome.org/cgi/doi/10.1101/gr.1949704.
References
- Ahn, S.J., Costa, J., and Emanuel, J.R. 1996. PicoGreen quantitation of DNA: Effective evaluation of samples pre- or post-PCR. Nucleic Acids Res. 24: 2623-2625. [DOI] [PMC free article] [PubMed] [Google Scholar]
- Barker, D.L., Theriault, G., Che, D., Dickinson, T., Shen, R., and Kain, R. 2003. Self-assembled random arrays: High-performance imaging and genomics applications on a high-density microarray platform. Proc. SPIE 4966: 1-11. [Google Scholar]
- Buckley, P.G., Mantripragada, K.K., Benetkiewicz, M., Tapia-Paez, I., Diaz De Stahl, T., Rosenquist, M., Ali, H., Jarbo, C., De Bustos, C., Hirvela, C., et al. 2002. A full-coverage, high-resolution human chromosome 22 genomic microarray for clinical and research applications. Hum. Mol. Genet. 11: 3221-3229. [DOI] [PubMed] [Google Scholar]
- Cheung, V.G. and Nelson, S.F. 1996. Whole genome amplification using a degenerate oligonucleotide primer allows hundreds of genotypes to be performed on less than one nanogram of genomic DNA. Proc. Natl. Acad. Sci. 93: 14676-14679. [DOI] [PMC free article] [PubMed] [Google Scholar]
- Dean, F.B., Nelson, J.R., Giesler, T.L., and Lasken, R.S. 2001. Rapid amplification of plasmid and phage DNA using Phi 29 DNA polymerase and multiply-primed rolling circle amplification. Genome Res. 11: 1095-1099. [DOI] [PMC free article] [PubMed] [Google Scholar]
- Dean, F.B., Hosono, S., Fang, L., Wu, X., Faruqi, A.F., Bray-Ward, P., Sun, Z., Zong, Q., Du, Y., Du, J., et al. 2002. Comprehensive human genome amplification using multiple displacement amplification. Proc. Natl. Acad. Sci. 99: 5261-5266. [DOI] [PMC free article] [PubMed] [Google Scholar]
- Fan, J.-B., Oliphant, A., Shen, R., Kermani, B.G., Garcia, F., Gunderson, K.L., Hansen, M., Steemers, F., Butler, S.L., Deloukas, P., et al. 2003. Highly parallel SNP genotyping. Cold Spr. Harb. Symp. Quant. Biol. LXVIII, (in press). [DOI] [PubMed]
- Gribble, S., Ng, B.L., Prigmore, E., Burford, D.C., and Carter, N.P. 2004. Chromosome paints from single copies of chromosomes. Chromosome Res. 12: 143-151. [DOI] [PubMed] [Google Scholar]
- Gunderson, K.L., Kruglyak, S., Graige, M.S., Garcia, F., Kermani, B., Zhao, C., Che, D., Dickinson, T., Wickham, E., Bierle, J., et al. 2004. Decoding randomly ordered DNA arrays. Genome Res. (this issue). [DOI] [PMC free article] [PubMed]
- Hijikata, M., Mishiro, S., Miyamoto, C., Furuichi, Y., Hashimoto, M., and Ohta, Y. 2001. Genetic polymorphism of the MxA gene promoter and interferon responsiveness of hepatitis C patients: Revisited by analyzing two SNP sites (-123 and -88) in vivo and in vitro. Intervirology 44: 379-382. [DOI] [PubMed] [Google Scholar]
- Hosono, S., Faruqi, A.F., Dean, F.B., Du, Y., Sun, Z., Wu, X., Du, J., Kingsmore, S.F., Egholm, M., and Lasken, R.S. 2003. Unbiased whole genome amplification directly from clinical samples. Genome Res. 13: 954-964. [DOI] [PMC free article] [PubMed] [Google Scholar]
- Lage, J.M., Leamon, J.H., Pejovic, T., Hamann, S., Lacey, M., Dillon, D., Segraves, R., Vossbrinck, B., Gonzalez, A., Pinkel, D., et al. 2003. Whole genome analysis of genetic alterations in small DNA samples using hyperbranched strand displacement amplification and array-CGH. Genome Res. 13: 294-307. [DOI] [PMC free article] [PubMed] [Google Scholar]
- Langmore, J.P. 2002. Rubicon Genomics, Inc. Pharmacogenomics 3: 557-560. [DOI] [PubMed] [Google Scholar]
- Li, P., Wood, T., and Thompson, J.N. 2002. Diversity of mutations and distribution of single nucleotide polymorphic alleles in the human α-L-iduronidase (IDUA) gene Genet. Med. 4: 420-426. [DOI] [PubMed] [Google Scholar]
- Lizardi, P.M., Huang, X., Zhu, Z., Bray-Ward, P., Thomas, D.C., and Ward, D.C. 1998. Mutation detection and single-molecule counting using isothermal rolling-circle amplification. Nat. Genet. 19: 225-232. [DOI] [PubMed] [Google Scholar]
- Lovmar, L., Fredriksson, M., Liljedahl, U., Sigurdsson, S., and Syvänen, A.-C. 2003. Quantitative evaluation by minisequencing and microarrays reveals accurate multiplexed SNP genotyping of whole genome amplified DNA. Nucleic Acids Res. 31: e129. [DOI] [PMC free article] [PubMed] [Google Scholar]
- Oliphant, A., Barker, D.L., Stuelpnagel, J.R., and Chee, M.S. 2002. BeadArray™ technology: Enabling an accurate, cost-effective approach to high-throughput genotyping. BioTechniques 32: S56-S61. [PubMed] [Google Scholar]
- Paunio, T., Reima, I., and Syvanen, A.C. 1996. Preimplantation diagnosis by whole-genome amplification, PCR amplification, and solid-phase minisequencing of blastomere DNA. Clin. Chem. 42: 1382-1390. [PubMed] [Google Scholar]
- Roses, A.D. 2002. Genome-based pharmacogenetics and the pharmaceutical industry. Nat. Rev.: Drug Discovery 1: 541-549. [DOI] [PubMed] [Google Scholar]
- Smith, J.D., James, D., Dansky, H.M., Wittkowski, K.M., Moore, K.J., and Breslow, J.L. 2003. In silico quantitative trait locus map for atherosclerosis susceptibility in apolipoprotein E-deficient mice. Arterioscler. Thromb. Vasc. Biol. 23: 117-122. [DOI] [PubMed] [Google Scholar]
- Telenius, H., Carter, N.P., Bebb, C.E., Nordenskjold, M., Ponder, B.A., and Tunnacliffe, A. 1992. Degenerate oligonucleotide-primed PCR: General amplification of target DNA by a single degenerate primer. Genomics 13: 718-725. [DOI] [PubMed] [Google Scholar]
- Wang, J. and Hegele, R.A. 2003. Genomic basis of cystathioninuria (MIM 219500) revealed by multiple mutations in cystathionine γ-lyase (CTH). Hum. Genet. 112: 404-408. [DOI] [PubMed] [Google Scholar]
- Wang, V.W., Bell, D.A., Berkowitz, R.S., and Mok, S.C. 2001. Whole genome amplification and high-throughput allelotyping identified five distinct deletion regions on chromosomes 5 and 6 in microdissected early-stage ovarian tumors. Cancer Res. 61: 4169-4174. [PubMed] [Google Scholar]
- Zhang, L., Cui, X., Schmitt, K., Hubert, R., Navidi, W., and Arnheim, N. 1992. Whole genome amplification from a single cell: Implications for genetic analysis. Proc. Natl. Acad. Sci. 89: 5847-5851. [DOI] [PMC free article] [PubMed] [Google Scholar]
- Zhou, X., Tan, F.K., Reveille, J.D., Wallis, D., Milewicz, D.M., Ahn, C., Wang, A., and Arnett, F.C. 2002. Association of novel polymorphisms with the expression of SPARC in normal fibroblasts and with susceptibility to scleroderma. Arthritis Rheum. 46: 2990-2999. [DOI] [PubMed] [Google Scholar]
WEB SITE REFERENCES
- www.rubicongenomics.com; Contains information on Omniplex DNA Amplification Kits.