Abstract
Ultrasound elastography (UE) has been widely used as a “digital palpation” tool to characterize tissue mechanical properties in the clinic. UE benefits from the capability of noninvasively generating 2-D elasticity encoded maps. This spatial distribution of elasticity can be especially useful in the in vivo assessment of tissue engineering scaffolds and implantable drug delivery platforms. However, the detection limitations have not been fully characterized and thus its true potential has not been completely discovered. Characterization studies have focused primarily on the range of moduli corresponding to soft tissues, 20kPa–600kPa. However, polymeric biomaterials used in biomedical applications such as tissue scaffolds, stents, and implantable drug delivery devices can be much stiffer. In order to explore UE’s potential to assess mechanical properties of biomaterials in a broader range of applications, this work investigated the detection limit of UE strain imaging beyond soft tissue range. To determine the detection limit, measurements using standard mechanical testing and UE on the same polydimethylsiloxane samples were compared and statistically evaluated. The broadest detection range found based on the current optimized setup is between 47kPa and 4MPa which exceeds the modulus of normal soft tissue suggesting the possibility of using this technique for stiffer materials’ mechanical characterization. The detectable difference was found to be as low as 157 kPa depending on sample stiffness and experimental setup.
Keywords: Ultrasound elastography, Mechanical, biomaterial characterization, nondestructive, noninvasive, elasticity
3. Introduction
Mechanical properties are one of the physical properties of biomaterials that have gained growing recognition for their capability of regulating cell and tissue response20, 21. Such responses include mesenchymal stem cells (MSCs) demonstrating different morphologies when cultured on substrates with varying moduli6, muscle cells, epithelial cells, and endothelial cells showing increased proliferation on stiffer substrates1, 2, 11, and neurons showing greater proliferation on softer substrates1, 5. In addition, varying elasticity of a cell substrate was found to improve the non-viral gene delivery in murine pre-osteoblasts17. These above examples suggest that the capability to measure the mechanical properties of biomaterials is essential for development of drug delivery platforms and tissue engineering scaffolds. Currently available methods for mechanical property evaluation involve direct mechanical measurements, which require animal sacrifice and sample destruction, hence many animals and samples need to be prepared for a time course experiment. Ideally, a non-invasive tool with the capability of measuring the mechanical properties of the same sample over time needs to be developed. Ultrasound elastography has been found to be a valuable non-invasive and, importantly, nondestructive tool to characterize tissue mechanical properties, the changes of which may be related to various pathological conditions such as vascular disease3, 4, cancer9, 12, 14, 15, 32 and chronic liver diseases30. This is due to the fact that soft tissue elasticity depends on tissue composition such as collagen, fat, etc. and the macroscopic and microscopic structure of these compositions. In research the noninvasive and nondestructive nature of UE can be extremely helpful. This is because by using UE, the amount of animals used can be reduced without sacrificing them. Longitudinal analysis of a single sample over time is capable because samples won’t be destructed during measurements. In addition, broad batch to batch and animal to animal variations can be reduced.
The elasticity estimation using the UE method is based on certain simplifications and assumptions26. Strictly speaking, tissue is inelastic. It does not meet the definition of an elastic material, which requires a linear relationship between stress and strain. Soft tissues exhibit viscoelastic properties such as hysteresis, stress relaxation, and creep8. For time scales shorter than the characteristic time of fluid motion, simplifications and assumptions such as uniaxial applied stress and linearity between acting force and tissue deformation can be applied to approximate this biomechanical problem8, 10, 22, 25, 26. The above simplifications and assumptions may also be applied when assessing the mechanical properties of biomaterials such as hydrogels, cell containing tissue scaffolds16, 31, drug delivery implants33, etc. Because the majority of these biomaterials absorb water or body fluid when interacting with human tissue, the materials exhibit viscoelastic properties13, 27, 29. Different methods have been developed to assess the mechanical properties of biological tissue. Among them, transient elastography has advantages such as non-dependence on the boundary conditions and providing direct shear modulus measurements. However, the high speed shear wave reflected from harder samples make it difficult to differentiate the shear wave from the bulk wave, thus limiting the capability of transient elastography to detect stiff samples7.
In this study, we are focusing on a quasi-static method (strain imaging). In strain imaging, the sample is subject to an external compressive stress, typically freehand compression by clinicians, and the ultrasound system tracks and measures the local deformation induced by this stress. Due to the quasi-static nature of the applied stress, the generalized viscoelastic equation of motion (1) can be a simplified Hookean equation (2). Since ω=0 and x is a constant, the velocity and accelerations vanish8.
| (1) |
Where M, R and K are inertial, viscous, and stiffness controlled terms respectively, x is displacement, F0 is amplitude of force, and ω is vibrational frequency.
| (2) |
In order to track and measure the local responsive deformation of the tissue, either an A-line cross-correlation method23 or a tissue Doppler method can be used19.
To the best of the authors’ knowledge, the only characterization studies7, 24 done with strain imaging focused on moduli within the range of soft tissues from 20kPa, a typical value of soft tissues such as liver or breast18, to 600kPa, a typical value for harder tissues such as arteries28. In the study conducted by Fromageau et al.7, a modulus to modulus comparison was made between the strain imaging method and a standard mechanical tension test. Young’s modulus estimation from strain imaging was obtained by calculating the slope of stress-strain curve in which the strain distribution was acquired using strain imaging, and stress was found from the recorded force applied over a known area7.
In this study, the Young’s modulus of polydimethylsiloxane (PDMS) samples was measured using unconfined compression mechanical testing as a gold-standard reference. In order to test strain imaging’s capability of differentiating samples with various moduli within and beyond the soft tissue range, PDMS samples from 47kPa to 4MPa were prepared and tested using both standard mechanical testing and strain imaging. A custom made stage was used to introduce uniform compression conditions to samples at the same time during strain imaging. The detection limit was determined by statistically evaluating a direct strain to modulus comparison between strain imaging and the unconfined compression test. The applied compressive and the mechanical properties of the material surrounding the sample were varied and found to affect the detection limit.
4. Materials and Methods
PDMS Sample Fabrication
PDMS samples of varying elastic moduli were made using the Sylgard 184 Silicone Elastomer Kit (Fisher Scientific, Waltham MA) by varying the concentration of curing agent and curing time. Samples ranged between 2.5–12% wt % of curing agent and 1 h to 1.5 h curing time (Table 1). 3% of Carbon black (Fisher Scientific, Waltham MA) was added to the elastomer solutions as a scattering agent. PDMS solutions were mixed and degassed in vacuo for 10 minutes before being poured into a petri dish to a thickness of 2.5 mm and cured in an oven at 60°C for the designated time. Once cured, a 3 mm biopsy punch was used to cut out samples in a disc shape for use in mechanical and UE testing. In order to reduce the effect of sample shape, and therefore boundary conditions, on the scan result of strain imaging, three samples were manufactured within each modulus group. Both strain imaging and standard mechanical test were performed on the same samples.
Table 1.
Measured elastic modulus of PDMS samples with different curing agent ratio and curing time.
| Sample Number |
Curing agent Ratio |
Curing Time (hr) |
Elastic Modulus (kPa) |
|---|---|---|---|
| 1 | 2.50% | 1.5 | 47±3 |
| 2 | 3.00% | 1.5 | 302±9 |
| 3 | 3.50% | 1.5 | 459±23 |
| 4 | 4.00% | 1 | 667±71 |
| 5 | 4.00% | 1.5 | 854±16 |
| 6 | 4.50% | 1.5 | 1211±35 |
| 7 | 6.00% | 1.5 | 1645±40 |
| 8 | 9.00% | 1.5 | 2229±22 |
| 9 | 9.50% | 1.5 | 2935±196 |
| 10 | 10% | 1.5 | 3297±237 |
| 11 | 11% | 1.5 | 3722±114 |
| 12 | 12% | 1.5 | 4224±314 |
Curing agent ratio= curing agent/elastomer base. (n=3 for each curing agent ratio)
Phantom Preparation
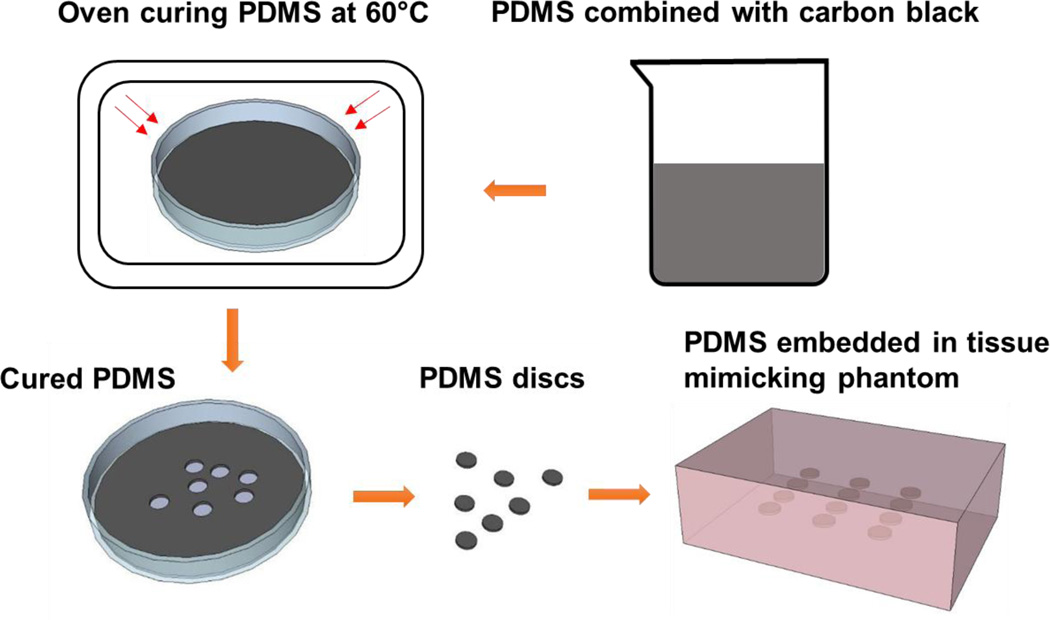
Stock solutions with a ratio of acrylamide to bis-acrylamide of 37.5:1 (Fisher Scientific, Waltham MA) and acrylamide concentration from 4% to 32% (w/v) in 1× PBS solution were prepared to fabricate tissue mimicking phantoms of different moduli. Titanium dioxide was added as a scattering agent to more clearly define the boundaries between the phantom and samples when performing ultrasound elastography. The polyacrylamide solutions were crosslinked by free radical polymerization using 1.7% and 0.1% (v/v) of tetramethyl ethylenediamine (TEMED, Fisher Scientific, Waltham MA) and ammonium persulfate (APS, Fisher Scientific, Waltham MA), respectively. The phantoms were manufactured in plastic molds with two polyacrylamide gel layers. 100 ml of the above mixture was stirred and poured into the plastic phantom mold to form the first layer. After the first layer gelled, the PDMS samples were placed and lined up on the gelled polyacrylamide. The second 100 ml acrylamide mixture was then poured on top of the first layer, embedding the PDMS samples. The complete PDMS embedded phantom fabrication process can be seen in Figure 1.
Figure 1.
PDMS sample fabrication process. PDMS elastomer and curing agent were combined with carbon black. The mixture was poured into a petri dish to obtain a 2.5mm thickness layer. The mixture was then cured in the oven at designated temperature. The PDMS discs were made using a 5mm biopsy punches. The disc shape PDMS samples were embedded in the middle of the tissue mimicking phantom for strain imaging scans and mechanical testing. The tissue mimicking phantoms were about 2 cm thick.
Mechanical Testing
PDMS samples
The Young’s modulus of the PDMS samples was determined by unconfined compressive mechanical testing using a rheometer (Rheometrics RSAII, NJ). Samples were loaded with increasing compressive nominal strain. Thereby, nominal strain ε and nominal stress ơ are defined as
| (4) |
| (5) |
with L and L0 being the heights in the loading direction of the deformed and the un-deformed sample, respectively, and with F and A being the force at the interface in the loading direction and the cross-sectional area of the interface perpendicular to the loading direction, respectively. A strain rate of 0.01/s was used. Testing time was optimized for each sample in order to obtain at least 30% strain. The Young’s modulus was determined by the strain-stress curve generated from the instrument. To assure consistent contact between the compressing probe and PDMS sample, a threshold of 0.1 N was used to generate the stress-strain measurement. Measurements with associated force less than 0.1 N were discarded. The measurements with strain greater than 20% were also removed due to high deformation of the PDMS samples. A first order polynomial fit was used to determine the linear region of the stress strain curve for modulus calculation. The Young’s modulus (E) was determined by finding the slope of the linear region of the stress strain curve (Eq (6)).
| (6) |
Polyacrylamide Hydrogels
To find the optimal phantom composition and therefore modulus, acrylamide samples were made using the method listed previously. Samples were made in various percentages ranging from 4% to 32% acrylamide (v/v). The Young’s modulus of these polyacrylamide samples was then measured using the punch out and mechanical testing procedure described previously.
Strain imaging
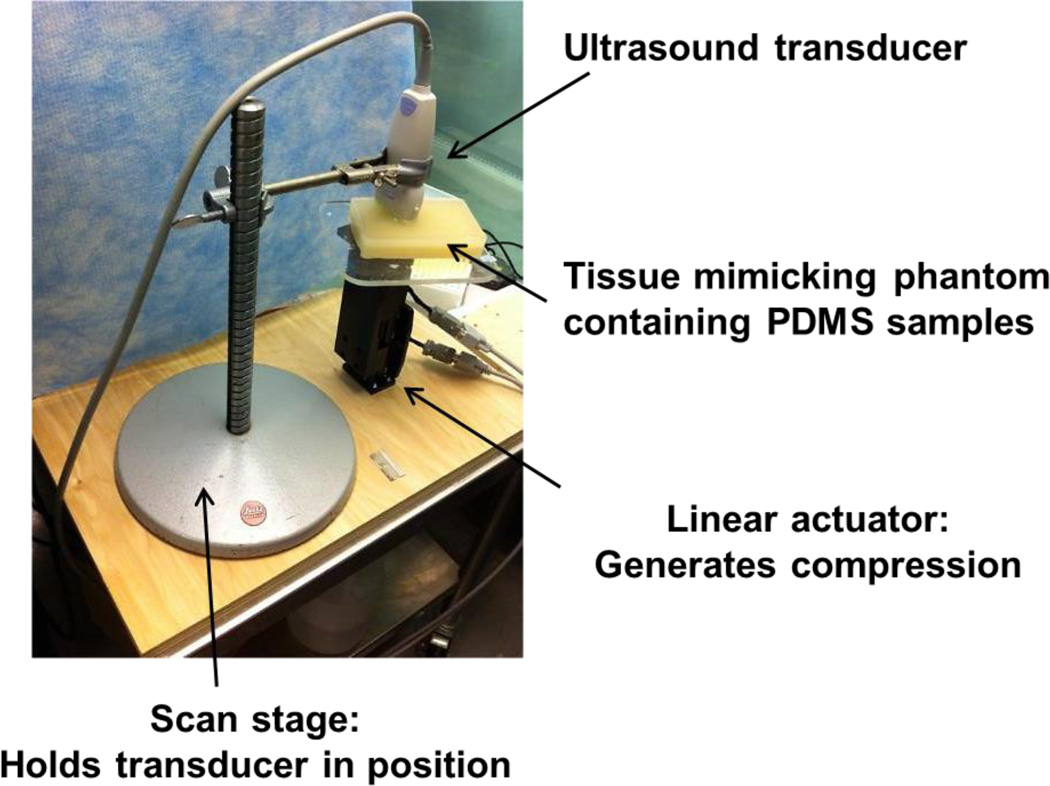
Strain imaging was performed using a Toshiba clinical ultrasound system, AplioXG SSA-790A (Toshiba Medical Imaging Systems, Otawara-Shi, Japan), with a linear array transducer centered at 12 MHz. To perform the measurements the ultrasound transducer was fixed to a laboratory designed stage, and a linear actuator was used to induce uniform strain. This computer programmable linear actuator provided repeatable displacement. Since the ultrasound transducer was fixed, samples between transducer and linear actuator were compressed by pushing up from below. Figure 2 illustrates the UE scan setup. In order to ensure contact between transducer and polyacrylamide phantom, a 10% pre-strain in reference to thickness of the phantom was applied. During the scan, a compression cycle composed of 3 compressions and 3 dilations was induced. A time frame Tissue Doppler Tracking (TDT) algorithm was used to calculate axial strain19. Color Doppler Imaging (CDI) frequency was set at 8.8 while velocity scale was 0.3 cm/s to accommodate the maximum value of the velocity profile. Velocity smoothing was used to optimize the strain calculation. After the scan, a color coded strain map was generated and superimposed on top of the B-mode image. The regions of interest (ROI) were chosen based solely on the B-mode images to remove potential operator dependent bias. The color map range was chosen to be the same for all recorded data. The size of the ultrasound transducer allowed for testing of 4 PDMS samples per scan. Therefore a total of 12 samples were separated into 3 groups. PDMS samples embedded in two tissue mimicking phantoms of different moduli (stiff and soft) were scanned with UE to examine the effect of the surrounding environment on the detection limit of the strain imaging technique. Different degrees of compression (1 mm and 3 mm) were applied by the distance controlled linear actuator to also investigate its role in the detection limit of this UE technique.
Fig. 2.
Ultrasound elastography scan setup.
Statistics
Unless otherwise noted, all data is presented as mean ± standard deviation. The strain output from strain scans in response to uniform compression conditions was evaluated using one way analysis of variance (ANOVA) then subjected to Tukey’s HSD (honestly significant difference) test. The alpha value was set at 0.05 with significance defined as P<0.05. The P value for each individual comparison was calculated using a t-test with Bonferroni's correction. In order to avoid batch effect, the statistical analysis was performed on the group of four samples, which were scanned simultaneously.
5. Results
Mechanical tests
Acoustic scattering PDMS samples
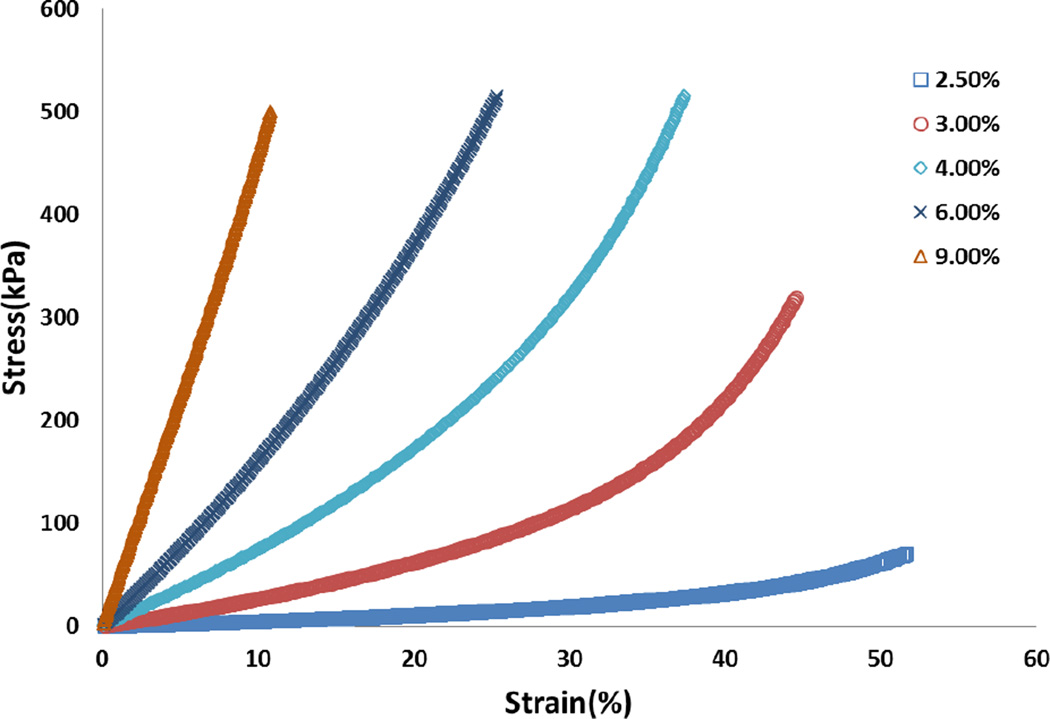
As described above, twelve groups of PDMS discs (n=3, 5.0 mm diameter, 2.5 mm height) were fabricated for use in both standard compressive mechanical testing and strain imaging. For samples tested in unconfined compression a nonlinear relationship between stress and strain was found (Figure 3). Therefore Young’s moduli of the samples were calculated using the linear region of the stress-strain curve as earlier described. The mechanical testing results are summarized in Table 1. The reproducibility of the mechanical properties of PDMS samples was also evaluated and found to be satisfactory, with an average standard deviation of 3.44 %.
Figure 3.
Representative strain-stress curve of PDMS samples. Curing agent ratio: 2.5%, 3%, 4%, 6% and 9%. (Detail formulation see Table 1)
Polyacrylamide tissue mimicking phantoms
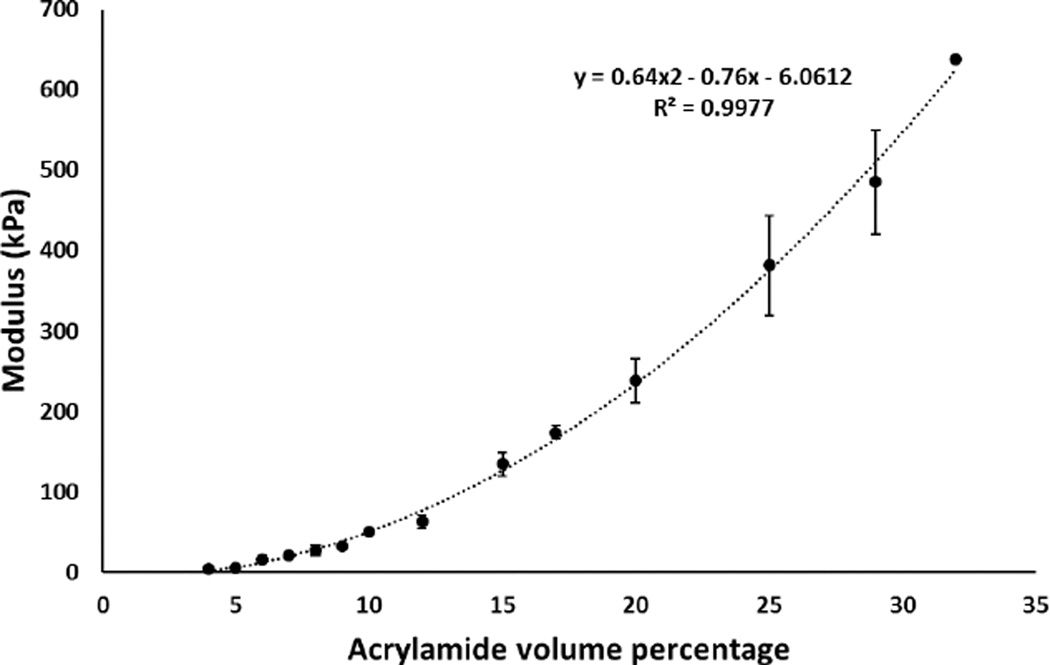
The same analysis was done on the strain-stress curves of the polyacrylamide phantom materials. The elastic moduli of phantoms with varying acrylamide concentration are shown in Figure 4. The range of moduli was found to be 4 to 650 KPa using mechanical testing. 10% and 15% acrylamide concentrations were chosen to manufacture phantoms with tissue relevant Young’s moduli, namely normal breast tissue (50k Pa) and cancerous breast tissue (100 kPa), respectively.
Figure 4.
Elastic modulus of polyacrylamide tissue mimicking phantom samples tested by unconfined compressive mechanical testing.
Ultrasound Elastography (UE)
The PDMS samples were scanned using both strain imaging and B-mode imaging simultaneously. The accumulated strain in reference to the original geometry of each sample was imaged together with B-mode scan. The resulting color-coded strain maps were superimposed onto the B-mode scan image (Figure 5). In this figure, the top row is a pure B-mode image and the bottom row is a strain map superimposed on the B-mode image. The color scale bar on the right of Figure 5 indicates the accumulated strain; deep blue to dark red color is indicating strain from low to high. A general decrease of strain was observed on PDMS samples from sample 1 to sample 12 (with increasing modulus) while an increased strain was observed on the surrounding phantom highlighted in the white box in Figure 5.
Figure 5.
B-mode image and UE color coded strain map of 12 PDMS samples, the images are demonstrating the cross-sectional area of the PDMS samples.
Strain data and statistics evaluation
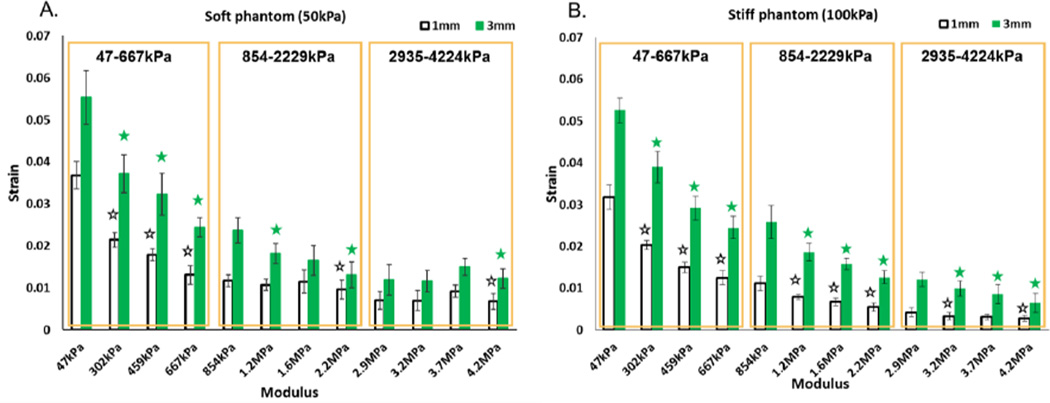
The strain data is presented in Figure 6. As expected with increasing sample modulus, a decreased strain was observed with strain imaging. The average strain was greater under 3 mm displacement as compared to 1 mm displacement. In Figure 6, the boxes depict the soft (47–667 kPa), medium (854–2229 kPa), and stiff (2935–422 4kPa) groups of PDMS samples that were scanned simultaneously. The Young’s modulus range of each group is also highlighted. A one way ANOVA followed by Tukey’s HSD (honest significant difference) test was used to compare average strain of PDMS samples within each group. The statistically significant differences decreased with increasing PDMS samples stiffness. For example, three, one and one comparison was found to be statistically significant in soft, medium and hard PDMS sample group, respectively, when performing strain imaging in soft phantom with 1mm compression (Figure 6A). The statistically significant differences were found to be different when using different phantom stiffness and compressions. Within soft phantoms, 5/9 and 6/9 comparisons were found to be statistically significant with 1 mm and 3 mm compression, respectively (Figure 6A). In contrast 8/9 and 9/9 statistically significant differences were found in the stiff phantom with 1 mm and 3 mm compression, respectively (Figure 6B).
Figure 6.
Strain results from UE. A) Soft phantom (E=50kPa); B) Stiff phantom (E=100kPa). The boxes are illustrating three groups in which four PDMS samples are scanned together. The elastic modulus range is highlighted in each box. Statistically significant differences between successive samples (i.e. Sample 2 compared to Sample 1) were evaluated using a Tukey HSD test and are annotated with stars.
The comparison P-values were calculated via a one way ANOVA with Bonferroni’s correction and are presented in Table 2. More statistically significant differences were seen from scans done in stiff phantoms when compared to soft phantoms. Interestingly, P values were found to be smaller when comparing 3 mm to 1 mm compression in both phantom environments. The modulus differences between successive pairs of samples is summarized in Table 2. The average modulus differences were calculated to be 206 ± 49 kPa, 458 ± 115kPa and 430 ± 70kPa for modulus range 47–667 kPa, 854–2229kPa and 2935–4224kPa, respectively.
Table 2.
P values when comparing between successive pairs of PDMS samples.
| Soft phantom (50kPa) | Stiff phantom (100kPa) | ||||||
|---|---|---|---|---|---|---|---|
| E range (kPa) | Comparison | 1mm | 3mm | ΔE (kPa) | 1mm | 3mm | ΔE (kPa) |
| 47–667 | 1–2 | <0.0001 | <0.0001 | 255 | <0.0001 | <0.0001 | 255 |
| 2–3 | <0.0001 | <0.0001 | 157 | <0.0001 | <0.0001 | 157 | |
| 3–4 | <0.0001 | <0.0001 | 208 | <0.0001 | <0.0001 | 208 | |
| 854–2229 | 5–6 | 0.0531 | <0.0001 | 357 | <0.0001 | <0.0001 | 357 |
| 6–7 | 0.8975 | 0.0505 | 434 | <0.0001 | <0.0001 | 434 | |
| 7–8 | 0.001 | 0.0005 | 584 | <0.0001 | <0.0001 | 584 | |
| 2935–4224 | 9–10 | 0.4713 | 0.3560 | 362 | <0.0001 | <0.0001 | 362 |
| 10–11 | 0.9999 | 0.9998 | 425 | 0.1733 | 0.0022 | 425 | |
| 11–12 | 0.0010 | 0.0017 | 502 | 0.0026 | 0.0011 | 502 | |
| Sum(p<0.05) | 5 | 6 | 8 | 9 | |||
ΔE is indicating the elastic modulus difference between the two comparing samples and E range is indicating the highest and lowest elastic modulus value of the each scan group. Total number of comparisons with P<0.05 is summarized at bottom of the table. P value is calculated using t-test with Bonferroni's correction.
Modulus and Strain Correlation
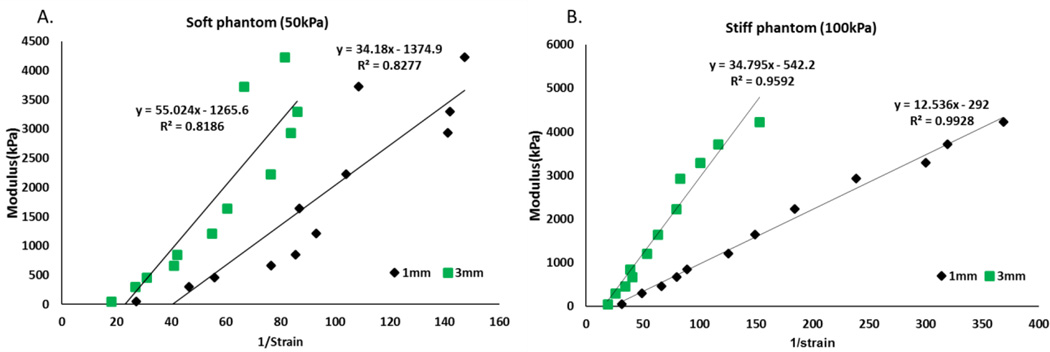
To evaluate the capability of strain imaging for differentiating samples with various moduli, Young’s modulus and 1/strain were correlated using a linear regression model fitted using the least squares approach. The correlation result is shown in Figure 7. A linear relationship between elastic modulus and 1/strain was observed. Scan results taken in stiff phantoms showed a stronger correlation with R2=0.9844 and R2=0.9644 for 1 mm and 3 mm compression condition respectively. A weaker linear relationship was seen in soft phantoms with R2= 0.8276 and R2=0.8186 for 1 mm and 3 mm compression respectively.
Figure 7.
Elastic modulus and 1/strain correlations in both phantoms. Left) Soft phantom; Right) Stiff phantom.
6. Discussion
As discussed in the introduction, strain estimation in this study is based on the assumption that the viscoelastic properties of PDMS samples can be neglected due to the fact that the characteristic time in strain imaging is shorter than the relaxation time of PDMS. The prepared PDMS samples have a modulus range between 47kPa–4MPa, which covers most soft tissues and also exceeds soft tissue stiffness range. By statistically comparing strain imaging data to standard mechanical testing data, it was found that the detection limit of strain imaging can exceed the soft tissue range, up to 4MPa, with detectable difference as low as 157kPa depending on sample stiffness and experimental setup. Phantom stiffness and compression conditions were both found to effect the detection limit. A concentration-dependent stiffness change of the polyacrylamide tissue mimicking phantom was also observed. 50 kPa and 100 kPa were selected to examine the effect of environment mechanical properties on the detection limit of the strain imaging technique. 50 kPa and 100 kPa were also relevant to soft tissue modulus, mimicking breast tissue and cancerous breast tissue respectively (Figure 4).
In strain imaging scans, a decreased strain was observed from sample 1 to 12 in both types of tissue mimicking phantom setups as well as under both compression conditions due to the fact that stiffer PDMS materials have a smaller degree of deformation response when experiencing the external compression force. It is important to notice that the statistical analysis was performed on four samples as a group, which were scanned simultaneously by strain imaging. This is to avoid the batch effect of the samples that were not scanned at the same time. The PDMS samples with lower modulus, ranging from 47 kPa to 667 kPa, were more clearly differentiated by strain imaging, as all three comparing differences were statistically significant. However, stiffer samples in the range of 854–2229 kPa and 2935–4224 kPa were more difficult to differentiate, as only one difference was found to be statistically significant in these two groups. Nonetheless, phantom stiffness and compression conditions were both found to affect the detection limit. When comparing strain results between the two tissue mimicking phantom setups, more statistically significant differences were found in the stiffer phantom environment (Figure 6 and Table 2), which suggests a better capability to differentiate sample stiffness, thus an improved detection limit. This finding can be explained by a Hookean model of three springs, phantom, PDMS sample and phantom, in series. The PDMS samples will experience a greater deformation under the same total displacement when the spring constant of the phantom increases. This increased deformation produces a higher strain in the PDMS sample that can be picked up by ultrasound strain imaging, thus improving the detection limit. However, very similar strain values were observed when comparing stiff phantom data to soft phantom data (Figure 6). We attribute this to the fact that most of the PDMS samples were much stiffer than both soft and stiff phantom material, and the thickness of PDMS samples was much smaller than the phantom thickness. Thus, most of the strain was still taken by the compliant phantom materials. An improved detection limit was also found by applying a greater compression. This is because the total displacement of both phantom and PDMS sample was increased by the higher compression. And thus, the deformation of PDMS samples can be increased and more easily detected by strain imaging. Combining both methods in the above discussion, the detection limit of ultrasound strain imaging can reach the range of 47 kPa - 4 MPa with optimized scan setup. This detection limit exceeds the range of the soft tissue, suggesting the possibility of using this technique for the characterization of mechanical properties of stiffer biomaterials.
A linear relationship was observed between Young’s modulus and 1/strain with a high correlation coefficient in both soft phantom (R2=0.8186 R2=0.8277) and stiff phantom (R2=0.9928 R2=0.9592), suggesting the possibility of using strain to quantitatively reflect the mechanical properties of test samples by controlling the testing conditions. The correlations with the stiff phantom were found to be better than the soft phantom. This suggests that environment mechanical property affects the capability of strain imaging to detect stiffness differences. Surrounding environment with higher modulus seems to be preferable. One of the challenges associated with detecting very stiff materials is the possible high stress that needs to be exerted on the tissue surface in order to produce detectable strain in the sample. This could lead to significant patient discomfort and thus prevent the technique from being applied clinically. In future study, an in depth investigation of the stress generated on the transducer-subject interface during the scan needs to be carried out to generate conclusive results.
The capabilities of applying ultrasound strain imaging to the evaluation of biomaterials with a wide range of stiffness has been evaluated by comparing strain imaging results to standard mechanical test results. The detection limit of this technique was found to be as high as 4 MPa, which exceeds the soft tissue stiffness, suggesting the possibility that this technique can indeed be appropriate for assessing mechanical properties of biomaterials. The detectable difference was found to be as low as 157 kPa depending on sample stiffness and experimental setup. Testing setup such as phantom stiffness as well as compression conditions were examined and recommend to improve the detection limit strain imaging.
Acknowledgments
This work was supported by the National Institute of Biomedical Imaging and Bioengineering of the National Institutes of Health under award numbers R01EB016960 and T32-EB007509. Views and opinions of, and endorsements by the author(s) do not reflect those of the National Institutes of Health. The authors would like to thank Dr. Bo Hu and Dr. Chen-yuan Chung for their help with statistical analysis and mechanical analysis respectively in this paper.
Footnotes
Conflict of Interest
The authors declare no conflicts of interest.
Contributor Information
Haoyan Zhou, Email: hxz143@case.edu.
Monika Goss, Email: mag150@case.edu.
Christopher Hernandez, Email: cxh404@case.edu.
Joseph M. Mansour, Email: Jmm12@case.edu.
Agata Exner, Email: Agata.exner@case.edu.
References
- 1.Ali MY, Chuang CY, Saif MT. Reprogramming cellular phenotype by soft collagen gels. Soft Matter. 2014;10:8829–8837. doi: 10.1039/c4sm01602e. [DOI] [PMC free article] [PubMed] [Google Scholar]
- 2.Ataollahi F, Pramanik S, Moradi A, Dalilottojari A, Pingguan-Murphy B, Wan Abas WA, Abu Osman NA. Endothelial cell responses in terms of adhesion, proliferation, and morphology to stiffness of polydimethylsiloxane elastomer substrates. J Biomed Mater Res A. 2015;103:2203–2213. doi: 10.1002/jbm.a.35186. [DOI] [PubMed] [Google Scholar]
- 3.de Korte CL, Pasterkamp G, van der Steen AF, Woutman HA, Bom N. Characterization of plaque components with intravascular ultrasound elastography in human femoral and coronary arteries in vitro. Circulation. 2000;102:617–623. doi: 10.1161/01.cir.102.6.617. [DOI] [PubMed] [Google Scholar]
- 4.de Korte CL, van der Steen AF, Cepedes EI, Pasterkamp G, Carlier SG, Mastik F, Schoneveld AH, Serruys PW, Bom N. Characterization of plaque components and vulnerability with intravascular ultrasound elastography. Phys Med Biol. 2000;45:1465–1475. doi: 10.1088/0031-9155/45/6/305. [DOI] [PubMed] [Google Scholar]
- 5.Engler AJ, Griffin MA, Sen S, Bonnemann CG, Sweeney HL, Discher DE. Myotubes differentiate optimally on substrates with tissue-like stiffness: pathological implications for soft or stiff microenvironments. J Cell Biol. 2004;166:877–887. doi: 10.1083/jcb.200405004. [DOI] [PMC free article] [PubMed] [Google Scholar]
- 6.Engler AJ, Sen S, Sweeney HL, Discher DE. Matrix elasticity directs stem cell lineage specification. Cell. 2006;126:677–689. doi: 10.1016/j.cell.2006.06.044. [DOI] [PubMed] [Google Scholar]
- 7.Fromageau J, Gennisson JL, Schmitt C, Maurice RL, Mongrain R, Cloutier G. Estimation of polyvinyl alcohol cryogel mechanical properties with four ultrasound elastography methods and comparison with gold standard testings. IEEE Trans Ultrason Ferroelectr Freq Control. 2007;54:498–509. doi: 10.1109/tuffc.2007.273. [DOI] [PubMed] [Google Scholar]
- 8.Fung Y-c. Biomechanics: Mechanical Properties of Living Tissues. Springer; 1993. [Google Scholar]
- 9.Giovannini M, Hookey LC, Bories E, Pesenti C, Monges G, Delpero JR. Endoscopic ultrasound elastography: the first step towards virtual biopsy? Preliminary results in 49 patients. Endoscopy. 2006;38:344–348. doi: 10.1055/s-2006-925158. [DOI] [PubMed] [Google Scholar]
- 10.Greenleaf JF, Fatemi M, Insana M. Selected methods for imaging elastic properties of biological tissues. Annu Rev Biomed Eng. 2003;5:57–78. doi: 10.1146/annurev.bioeng.5.040202.121623. [DOI] [PubMed] [Google Scholar]
- 11.Griffin MA, Sen S, Sweeney HL, Discher DE. Adhesion-contractile balance in myocyte differentiation. J Cell Sci. 2004;117:5855–5863. doi: 10.1242/jcs.01496. [DOI] [PubMed] [Google Scholar]
- 12.Han Z, Zhou Z, Shi X, Wang J, Wu X, Sun D, Chen Y, Zhu H, Magi-Galluzzi C, Lu ZR. EDB Fibronectin Specific Peptide for Prostate Cancer Targeting. Bioconjug Chem. 2015;26:830–838. doi: 10.1021/acs.bioconjchem.5b00178. [DOI] [PubMed] [Google Scholar]
- 13.Hatakeyama T, Hatakeyama H, Nakamura K. Non-Freezing Water-Content of Monovalent and Divalent Cation Salts of Polyelectrolyte Water-Systems Studied by Dsc. Thermochimica Acta. 1995;253:137–148. [Google Scholar]
- 14.Hoyt K, Castaneda B, Zhang M, Nigwekar P, di Sant'agnese PA, Joseph JV, Strang J, Rubens DJ, Parker KJ. Tissue elasticity properties as biomarkers for prostate cancer. Cancer Biomark. 2008;4:213–225. doi: 10.3233/cbm-2008-44-505. [DOI] [PMC free article] [PubMed] [Google Scholar]
- 15.Huang S, Ingber DE. Cell tension, matrix mechanics, and cancer development. Cancer Cell. 2005;8:175–176. doi: 10.1016/j.ccr.2005.08.009. [DOI] [PubMed] [Google Scholar]
- 16.Kim K, Jeong CG, Hollister SJ. Non-invasive monitoring of tissue scaffold degradation using ultrasound elasticity imaging. Acta Biomater. 2008;4:783–790. doi: 10.1016/j.actbio.2008.02.010. [DOI] [PMC free article] [PubMed] [Google Scholar]
- 17.Kong HJ, Liu J, Riddle K, Matsumoto T, Leach K, Mooney DJ. Non-viral gene delivery regulated by stiffness of cell adhesion substrates. Nature Materials. 2005;4:460–464. doi: 10.1038/nmat1392. [DOI] [PubMed] [Google Scholar]
- 18.Krouskop TA, Wheeler TM, Kallel F, Garra BS, Hall T. Elastic moduli of breast and prostate tissues under compression. Ultrason Imaging. 1998;20:260–274. doi: 10.1177/016173469802000403. [DOI] [PubMed] [Google Scholar]
- 19.Lerner RM, Huang SR, Parker KJ. "Sonoelasticity" images derived from ultrasound signals in mechanically vibrated tissues. Ultrasound Med Biol. 1990;16:231–239. doi: 10.1016/0301-5629(90)90002-t. [DOI] [PubMed] [Google Scholar]
- 20.Levental I, Georges PC, Janmey PA. Soft biological materials and their impact on cell function. Soft Matter. 2007;3:299–306. doi: 10.1039/b610522j. [DOI] [PubMed] [Google Scholar]
- 21.Mitragotri S, Lahann J. Physical approaches to biomaterial design. Nature Materials. 2009;8:15–23. doi: 10.1038/nmat2344. [DOI] [PMC free article] [PubMed] [Google Scholar]
- 22.Ophir J, Alam SK, Garra B, Kallel F, Konofagou E, Krouskop T, Varghese T. Elastography: ultrasonic estimation and imaging of the elastic properties of tissues. Proc Inst Mech Eng H. 1999;213:203–233. doi: 10.1243/0954411991534933. [DOI] [PubMed] [Google Scholar]
- 23.Ophir J, Cespedes I, Ponnekanti H, Yazdi Y, Li X. Elastography: a quantitative method for imaging the elasticity of biological tissues. Ultrason Imaging. 1991;13:111–134. doi: 10.1177/016173469101300201. [DOI] [PubMed] [Google Scholar]
- 24.Oudry J, Lynch T, Vappou J, Sandrin L, Miette V. Comparison of four different techniques to evaluate the elastic properties of phantom in elastography: is there a gold standard? Phys Med Biol. 2014;59:5775–5793. doi: 10.1088/0031-9155/59/19/5775. [DOI] [PubMed] [Google Scholar]
- 25.Parker KJ, Doyley MM, Rubens DJ. Imaging the elastic properties of tissue: the 20 year perspective. Phys Med Biol. 2011;56:R1–R29. doi: 10.1088/0031-9155/56/1/R01. [DOI] [PubMed] [Google Scholar]
- 26.Sarvazyan A, Hall TJ, Urban MW, Fatemi M, Aglyamov SR, Garra BS. An Overview of Elastography - an Emerging Branch of Medical Imaging. Curr Med Imaging Rev. 2011;7:255–282. doi: 10.2174/157340511798038684. [DOI] [PMC free article] [PubMed] [Google Scholar]
- 27.Sarvestani AS, He X, Jabbari E. Effect of osteonectin-derived peptide on the viscoelasticity of hydrogel/apatite nanocomposite scaffolds. Biopolymers. 2007;85:370–378. doi: 10.1002/bip.20659. [DOI] [PubMed] [Google Scholar]
- 28.Selzer RH, Mack WJ, Lee PL, Kwong-Fu H, Hodis HN. Improved common carotid elasticity and intima-media thickness measurements from computer analysis of sequential ultrasound frames. Atherosclerosis. 2001;154:185–193. doi: 10.1016/s0021-9150(00)00461-5. [DOI] [PubMed] [Google Scholar]
- 29.Weber N, Pesnell A, Bolikal D, Zeltinger J, Kohn J. Viscoelastic properties of fibrinogen adsorbed to the surface of biomaterials used in blood-contacting medical devices. Langmuir. 2007;23:3298–3304. doi: 10.1021/la060500r. [DOI] [PubMed] [Google Scholar]
- 30.Yeh WC, Li PC, Jeng YM, Hsu HC, Kuo PL, Li ML, Yang PM, Lee PH. Elastic modulus measurements of human liver and correlation with pathology. Ultrasound Med Biol. 2002;28:467–474. doi: 10.1016/s0301-5629(02)00489-1. [DOI] [PubMed] [Google Scholar]
- 31.Yu J, Takanari K, Hong Y, Lee KW, Amoroso NJ, Wang Y, Wagner WR, Kim K. Non-invasive characterization of polyurethane-based tissue constructs in a rat abdominal repair model using high frequency ultrasound elasticity imaging. Biomaterials. 2013;34:2701–2709. doi: 10.1016/j.biomaterials.2013.01.036. [DOI] [PMC free article] [PubMed] [Google Scholar]
- 32.Zhi H, Ou B, Luo BM, Feng X, Wen YL, Yang HY. Comparison of ultrasound elastography, mammography, and sonography in the diagnosis of solid breast lesions. J Ultrasound Med. 2007;26:807–815. doi: 10.7863/jum.2007.26.6.807. [DOI] [PubMed] [Google Scholar]
- 33.Zhou H, Hernandez C, Goss M, Gawlik A, Exner AA. Biomedical Imaging in Implantable Drug Delivery Systems. Curr Drug Targets. 2015;16:672–682. doi: 10.2174/1389450115666141122211920. [DOI] [PMC free article] [PubMed] [Google Scholar]


