

Abstract
Comparative genomics techniques are used in bioinformatics analyses to identify the structural and functional properties of DNA sequences. As the amount of available sequence data steadily increases, the ability to perform large-scale comparative analyses has become increasingly relevant. In addition, the growing complexity of genomic feature annotation means that new approaches to genomic visualization need to be explored. We have developed a Java-based application called Sockeye that uses three-dimensional (3D) graphics technology to facilitate the visualization of annotation and conservation across multiple sequences. This software uses the Ensembl database project to import sequence and annotation information from several eukaryotic species. A user can additionally import their own custom sequence and annotation data. Individual annotation objects are displayed in Sockeye by using custom 3D models. Ensembl-derived and imported sequences can be analyzed by using a suite of multiple and pair-wise alignment algorithms. The results of these comparative analyses are also displayed in the 3D environment of Sockeye. By using the Java3D API to visualize genomic data in a 3D environment, we are able to compactly display cross-sequence comparisons. This provides the user with a novel platform for visualizing and comparing genomic feature organization.
When dealing with biological data, the method by which the data is presented affects the inferences that a trained observer can make. This is especially true when dealing with sequence and annotation data. Users are presented with a wide variety of predicted and experimentally supported annotations from which hypotheses on the structure and function of the sequence can be inferred. Common inferences include whether or not the sequence contains a gene, and if so, what are the sequence features that predict likely function. To analyze these, researchers have had available many genome browsers, some of which target specific organisms (Ashburner and Drysdale 1994; Stein et al. 2001) or groups of organisms, such as Ensembl (Hubbard et al. 2002) and the UCSC Genome Browser (Karolchik et al. 2003). These browsers are extremely well maintained and offer extensive annotation. However, each browser is designed to reflect information in the context of a limited number of sequences. To address questions such as whether a sequence shares similarities with several other sequences, most genome browsers require the user to open several independent browser windows. This complicates the perusal of annotation information. Motivated by a desire to perform comparative genomics analyses in an integrated environment, we have designed a software application named Sockeye that allows a user to simultaneously visualize and manipulate both small and large sets of sequences and their annotations.
The integrated environment of Sockeye removes the organismal boundaries common in genomics browsers at a time when comparative genomics analyses are positioned to answer questions related to gene regulation and the evolution of structure and function in the genome (Ureta-Vidal et al. 2003). Users of Sockeye are able to analyze large sets of functionally linked sequences, sequences containing genes that are coexpressed, and sequences that are orthologous across multiple species. These sequences can be imported with user-defined annotation or Ensembl-curated information, allowing researchers to compare conserved structures. Loaded sequences can be exported, aligned, or discarded. Furthermore, by allowing a user to import custom annotation, Sockeye can facilitate comparative analyses across sequences from any source. For example, we have used this functionality of Sockeye to compare the genome sequence of the SARS virus against the protein complement of other similar coronaviruses (Marra et al. 2003).
The nature of genome browsing in Sockeye is different from existing browsers. Instead of representing data as two-dimensional (2D) images, in which annotation is labeled above and below the sequence, we have developed a three-dimensional (3D) environment in which annotation can exploit a third dimension. A 3D environment is conducive to comparative analyses in which sequence, organism classification, and annotation take up individual dimensions. In particular, a third dimension (z-axis) is well suited to displaying the magnitude of an associated score when a sequence annotation is predicted in silico. Each annotation in Sockeye is displayed as an individual 3D model mapped to a user-defined size and coloring scheme. Each 3D model is specified in a user-configurable XML format file. This allows a user to specify an extensive number of individual annotation objects from only a small collection of 3D primitives (spheres, cylinders, cones, etc.). We propose that the large combination of differential coloring and modeling schemes within a 3D environment will allow researchers to quickly visualize and identify potentially important conservation patterns in multiple sequence data sets.
Sockeye allows users to execute and visualize sequence alignments. Alignment visualization tools such as PipMaker (Schwartz et al. 2000), although capable of rapidly creating high-quality images, require set-up of annotation and sequence files. Sockeye integrates the process of obtaining sequence and annotation data. Furthermore, alignment visualization tools such as PipMaker, VISTA (Mayor et al. 2000), and synplot (Gottgens et al. 2001) offer limited links between alignment results and annotation data (VISTA allows users to view the UCSC site in their Internet browser). Sockeye provides its alignment results with rich annotations such as low complexity repeats and ESTs. Sockeye also allows a user to simultaneously visualize several different alignments and easily view their underlying gaps. This allows a user to compare results from an individual algorithm with different input parameters, or from several different alignment algorithms (Fig. 1). The focus of Sockeye on providing users with the ability to run genomic analyses, such as alignments, is the primary difference between it and the Apollo project (Lewis et al. 2002). Apollo is designed to give a user extensive information for analyzing previously run alignments in order to identify new genomic annotations, such as genes. Sockeye allows a user to perform analyses as required in order to examine the relationships between sets of sequences, for instance, when searching for functional noncoding elements.
Figure 1.
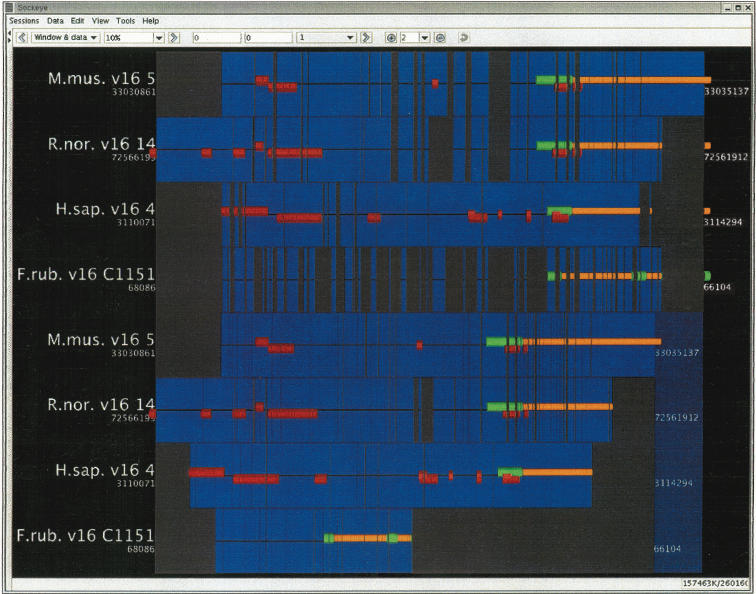
Multiple alignment visualization. Sockeye is simultaneously showing alignments for regions around the first exon of the Huntington's Disease gene (HD) from LAGAN (top four sequence tracks) and ClustalW (bottom four sequence tracks). The sequence tracks in order are (1) mouse, (2) rat, (3) human, (4) Fugu, (5) mouse, (6) rat, (7) human, and (8) Fugu. For the LAGAN algorithm, the start of translation of the HD gene in each species aligns perfectly. For the ClustalW algorithm, the start of translation for the first exon of the Fugu ortholog is misaligned. The Ensembl exon annotation includes the untranslated region. Ensembl-curated repeats are shown in red; gaps are shown in gray. This image shows how Sockeye can be used for comparative genomics and comparative algorithmics.
The use of 3D in any type of data visualization and analysis application has advantages and disadvantages. 3D data visualization has been successfully used for engineering design and for geological and meteorological modeling, but it is relatively unexplored in genomics. The success of 3D applications in genomics has been restricted to those used for protein structure analysis (Sayle and Milner-White 1995; Tate et al. 2001; Martz 2002) and gene expression mapping (Kim et al. 2001). Several new applications have emerged to bring 3D visualization to genomic data analysis. The most notable are the University of Calgary's Java3D CAVE application (Sensen 2002) and the complementary Stichting Academisch Rekencentrum Amsterdam's Saragene CAVE (Bohannon 2002), both of which use specialized hardware environments, the cost of which is prohibitive for the majority of researchers. In addition, a more significant disadvantage with 3D applications in general has been that most researchers find it difficult to make quantitative assessments of 3D data as the environment can either enhance or detract from certain characteristics based on an individual's choice of projection. We have aimed to mitigate this problem by providing the user with access to the full range of controls available in most genomic browsers for navigating along sequences and zooming in and out.
One of the fundamental challenges of developing genomic tools and databases is providing the computational interface for research biologists. To approach this, we have focused on providing analysis algorithms to experimentalists without requiring a steep learning curve in applying the algorithm or onerous prerequisite installations. Sockeye allows a user to navigate homologies and align sequences in an integrated environment. Qualitative assessments of sequence similarities can rapidly be made, and sequences can be viewed, copied, or exported. Our goal has been to provide the user with an easy system for locating and extracting interesting targets from comparative genomics analyses for subsequent laboratory and computational study.
RESULTS
Sockeye Design
The central theme of Sockeye development has been to construct a generalizable and portable software application capable of analyzing and comparing the characteristics of several Ensembl-based genome annotations simultaneously.
To facilitate comparative genome analysis, Sockeye is designed to connect and retrieve all major eukaryotic genomes for which a publicly-available Ensembl annotation exists. A user is currently served annotations of Homo sapiens, Mus musculus, Rattus norvegicus, Caenorhabditis elegans, Caenorhabditis briggsae, Danio rerio, Fugu rubripes, Drosophia melanogaster and Anopheles gambiae through connections to public Ensembl MySQL servers. The 3D environment of Sockeye is designed to allow the user to simultaneously browse and visualize these annotations. This allows the user to easily view detailed comparisons of genomic structure across multiple organisms. In addition, to provide genomic annotation in highest possible context, the user is able to connect to relevant external Web sites for gene annotations. Sockeye currently connects to WormBase, Human MapViewer (Wheeler et al. 2001), and LocusLink (Maglott et al. 2000).
The design of Sockeye facilitates combining comparative genomics and comparative algorithmics. Sockeye connects to the Chinook DBAS (Distributed Bioinformatics Application Server) using both Web services and Java RMI technology (S. Montgomery and S. Jones, in prep.). This service allows a user to run a suite of alignment programs without requiring local installation. The current implementation supports ClustalW (Chenna et al. 2003) and LAGAN (Brudno et al. 2003) alignments through Sockeye (Table 1). Future versions will integrate additional algorithms.
Table 1.
Alignment Algorithms Accessible Through Sockeye
| LAGAN | Pairwise alignment algorithm (Brudno et al. 2003). Aligns several megabytes in minutes. |
| Multi-LAGAN | Multiple alignment algorithm (Brudno et al. 2003). Requires as input the phylogenetic tree. |
| ClustalW | Multiple alignment algorithm (Thompson et al. 1994). Infers a phylogenetic tree. |
Data Structure: Storing and Managing Retrieved Annotations
The fundamental challenges of storing and managing the visualization of genomic annotations are primarily attributed to the complexity of the information and large volume of available data. To meet these challenges, Sockeye creates simple annotation objects called TrackFeatures. These objects are based on Biojava's current version of the GFF specification (Mangalam 2002). In Sockeye, they represent everything from genes to SNPs. The value of this approach is that Sockeye uses only a minimal amount of memory for an annotation. Because of this design, Sockeye, for example, allows the simultaneous visualization of all the genes on the six C. elegans chromosomes on a P4 workstation with 256 Mb of RAM.
Sockeye: A Graphical User Interface (GUI) Perspective
On initial start-up, the user sees the sequence track selection tree, the feature selection tree, several navigation controls, and the 3D viewport with one empty sequence track visible (Fig. 2). Before any of these components become useful, sequence tracks must be loaded, queried, or imported. A user can use the sequence track selection tree in the upper-left corner to select sequence track specific operations, for example, reversing the strandedness of the visible sequence track, toggling the visibility of the sequence track, or lining-up labeled regions. Each sequence track in the sequence track selection tree contains detailed information about its sources; this information can be accessed through the right-mouse button. The feature selection tree allows the user to select which genomic annotations are visible. For example, a user who selects “multitranscript” from the “Gene and gene prediction” branch will be able to see a floating sphere above the first exon of a gene that contains more than one spliceoform. From these 3D objects, the user can subsequently view the splicing structure of these transcripts or view the distribution of these types of genes across a sequence contig or chromosome.
Figure 2.
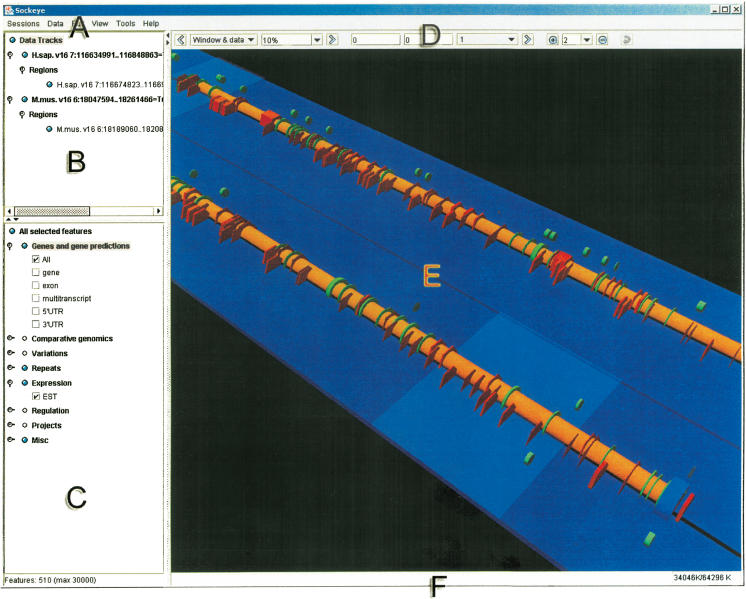
Sockeye GUI layout. (A) The menu. (B) The sequence track selection tree. From this component, a user can show/hide and obtain detailed information for loaded sequence tracks. (C) The feature selection tree. This component allows a user to show/hide annotation types. Its hierarchical structure is dynamically generated from Sockeye's XML start-up files. (D) The navigation toolbar. This component contains tools to navigate loaded sequence tracks. (E) The 3D viewport. This is where a user is able to perform analysis and visualization functions on 3D sequence tracks and annotations. (F) The status bar. This informs the user of the status of pending Ensembl queries and of memory usage.
3D Viewport
Sockeye has been designed to allow researchers to easily compare the extensive information contained across multiple genomic sequences. The 3D viewport of Sockeye is where a user is able to visualize and manipulate sequences and annotation data in 3D. Individual sequences are displayed in the viewport as a sequence track (blue plane). As a user subsequently imports additional sequences, the viewport shows these by drawing new sequence tracks adjacent to previous ones. Each sequence track is delineated by its name and start and ending coordinates in nucleotides.
The 3D viewport has been designed to give a user the flexibility in arranging and visualizing data. Once a sequence track is imported in Sockeye, either through an Ensembl database query or by loading a file, the user can zoom, pan, and rotate the position of the sequence track by using their mouse controls. The sequence track is also an active object; a user who selects the sequence track can highlight or mark individual regions for further analysis. This allows the user to easily select regions of a sequence for refined analyses such as being used for sequence alignment, for sequence export, or for copying into a new sequence track. In addition, a user is able to adjust the position of individual sequences with respect to annotations on other sequence tracks. This allows a user to import multiple sequences but adjust them to the same reference, such as the start of a particular gene. This feature has allowed us to line-up homologous genes, aiding the visual identification of upstream similarities.
Individual users can modify some of the display properties of the 3D viewport through the options dialog in the Edit menu and through menu items in the View menu. The dialog allows the user to toggle anti-aliasing and mouse-over pop-ups. The View menu allows the user to change the visible sequence track orientation between a top view and various preselected viewing angles. A user is also given the option of saving a particular 3D viewport orientation so they can return to it at a later time. This can be particularly helpful if several orientations display important information.
Integrated Support and Maintenance
A major challenge in Sockeye development is that the application had to be easy to use, and it would have to be able to adapt to the rapidly changing needs of its user community. Sockeye handles the first of these issues by containing its own context-sensitive help documentation. As well, Sockeye provides its own error tracking and feature suggestion mechanism. A user can fill in reports of erroneous behavior or desired improvements directly in the application. These reports are sent to a Sockeye issue tracker.
Sockeye users can subscribe to development (sockeye@bcgsc.bc.ca) and announcement (sockeye-announce@bcgsc.bc.ca) mailing lists from the Canada's Michael Smith Genome Sciences Centre's (CMSGSC) Sockeye page (http://www.bcgsc.bc.ca/sockeye). This Web page also includes detailed how-to documentation and an online version of the Sockeye help pages.
Version 1.0 User's Guide
See online Supplement: Sockeye Version 1.0 User's Guide at http://www.bcgsc.bc.ca/sockeye/gr2004_online_supplement.
DISCUSSION
Sockeye has been designed to leverage 3D graphics technology with tools for performing comparative genomics. We have hypothesized that such an information-rich 3D environment will allow us to quickly view the underlying characteristics of multiple sequences within a single genome or from multiple genomes. We believe that the success of this design can be demonstrated from ongoing and previous applications of Sockeye to gene regulation, gene discovery, and viral genomics studies.
The NISC Comparative Vertebrate Sequencing Data. We have used Sockeye to visualize the upstream region of the CFTR locus. BLASTn (Altschul et al. 1990) was used to anchor eachindividual species' contigs to the human genome prior. Subsequently, we used LAGAN to complete a multiple alignment of all the sequences that possessed one BLASTn match to the human CFTR locus. We were able to observe regions of similarity across 14 species.
Transcription Factor Binding Site Analysis. We have used Sockeye to visualize the locations of muscle and liver specific regulatory modules upstream of CACNL1AS in human and its ortholog, Cacna1s, in mouse. We used a LRA algorithm to scan sliding windows of 200 bp, incrementing by 5 bp, to generate GFF data that were imported into Sockeye as a distribution (Wasserman and Fickett 1998). From this data we were able to visualize the location of several tissue specific regulatory modules (Fig. 3).
Searching for new genes in C. elegans. Sockeye is being used in preliminary analyses at the CMSGSC for mapping SAGE tags to C. elegans. Because Sockeye shows EST information and C. briggsae annotation information, users have been able to find SAGE tags that map to unannotated regions of C. elegans and that also share strong homology with annotated genes in C. briggsae (G. Vatcher, pers. comm.).
SARS-CoV phylogeny. By using data generated from a BLASTX analysis of the protein complement of the nidovirales family against the SARS-CoV virus, Sockeye was able to simultaneously display the dissimilarities present between SARS-CoV and viruses in this family (Fig. 4). This analysis added further visual evidence that SARS-CoV didn't originate from a recombination of two coronaviruses and was in fact a new type of virus (http://www.bcgsc.ca/bioinfo/SARS/, CMSGSC SARS).
Figure 3.

Comparison of muscle specific regulatory modules in CACNL1AS/Cacna1s in human and mouse. Sockeye displays LRA predictions for muscle regulatory modules as a 3D grid, superimposed on genes (green exons, orange introns). Height and color intensity represent confidence that a specific region binds muscle-specific transcription factors. To obtain this image, we imported LRA score predictions as GFF and then created a distribution feature in Sockeye's import dialog.
Figure 4.

SARS-CoV analysis. These sequence tracks show a BLASTX analysis of the SARS-CoV virus against (1) avian bronchitis virus, (2) bovine coronavirus, (3) human coronavirus 229E, (4) murine hepatitis, (5) porcine epidemic diarrhea virus, and (6) transmissible gastroenteritis virus. The last sequence track is SARS-CoV annotation imported from NCBI. This image shows dissimilarities between the SARS-CoV virus and other related viruses. These dissimilarities are pronounced in the structural proteins at the 3′ end (right). The score for each BLASTX hit is represented by height for each corresponding 3D feature in Sockeye. (Inset) The top view clearly shows the nature of the alignment.
The underlying method for completing these analyses was to convert data into a format that Sockeye could read and then import them into Sockeye for visualization. In each of the above cases, we used GFF files to import new annotation. New 3D models were specified for these features in our XML configuration files, allowing us to choose colors and shapes that enhanced the visibility of the data.
Sockeye is well-positioned to handle new types of comparative genomic analysis for gene regulation studies. By allowing a user to set-up and run alignment programs from within Sockeye, we are able to perform phylogenetic footprinting analyses while keeping all Ensembl annotation in the context of the alignment. This is in contrast to most alignment applications, which require the user to run alignments and then determine if similarities overlap known annotations. By integrating this feature into Sockeye, we can easily answer whether known polymorphisms overlap putative regulatory regions and could possibly contribute to an observable phenotype. In addition, Sockeye allows the user to highlight alternative spliceoforms. This is particularly useful for genes with similar regulation mechanism such as those found in Nspl1, in which a specific spliceoform is likely regulated by an intronic promoter (Geisler et al. 1998). Furthermore, any type of prediction algorithm that can report sliding window scores or putative regulatory regions can be imported directly into Sockeye for visualization as individual features or as distribution data. This allows Sockeye to be a workbench for viewing data across functionally linked genes.
Our future plans for Sockeye include enhancing the comparative analyses that Sockeye can perform into specific types of gene regulation analyses. Sockeye currently lets a user aggregate known homologs for phylogenetic analysis. We are extending this functionality in Sockeye to include facilities to allow a user to select and compare (1) genes that are functionally related through Gene Ontology categories, (2) genes with similar expression profiles from SAGE and microarray analysis, and (3) genes and their known duplicates and pseudogenes. Furthermore, we intend to allow the user to import annotation from DAS servers; this allows a user to validate their annotations against a wider variety of publicly-available annotations.
Sockeye is distributed solely as a standalone application. The benefit of a standalone application is that Sockeye, without requiring the mirroring of external databases, can save data while connected to the Internet for perusal at a later time. In addition, by supplying XML configuration files in a standalone distribution, Sockeye allows a user to easily customize their own installation. In contrast, however, most genome browsers have been successful because they can easily deliver their content through the Internet to a user. Because Sockeye is a standalone application, it is limited by the CPU, memory, and graphics card that a user possesses. Future versions of Sockeye will alleviate these restrictions by incorporating semantic zooming. This mechanism shows information in a form appropriate for the resolution of any given track; for instance, at a certain count and resolution threshold, Sockeye will display SNPs as distributions across the track instead of discrete features. Furthermore, the querying of external MySQL servers can be slow during peak usage; some queries, depending on size, take several minutes. To alleviate this, we are switching from a “query all annotations” strategy to a strategy in which we query individual types of annotation on demand.
The Sockeye software is available for Windows (DirectX and OpenGL modes) and Linux (OpenGL mode) download at http://www.bcgsc.ca/gc/bomge/sockeye/. The Sockeye source code is available from the authors under license, at no cost, for academic use.
METHODS
Sockeye is a standalone application written in Java using JDK1.4.x and Java3D 1.3.x. The Ensembl-Java API is used for Ensembl-related data access and connection management. Biojava is used to support file importing and the handling of annotation data. Java RMI and Apache Axis Web Services are used to connect to standalone analysis programs on the CMSGSC servers. Currently, we use both the JOX (http://www.wutka.com/jox.html) and XOM (http://www.cafeconleche.org/XOM/) toolkits to parse our XML startup files and saved files, respectively. Team development occurs in both Linux and Windows via JBuilder and Eclipse. Version control is accomplished by using CVS. Sockeye has been tested in OpenGL and DirectX modes with GForce2 MX graphics accelerators. Suggested start-up RAM is 256 to 512 Mb for large data queries. We have been able to run Sockeye using 64 Mb of RAM for smaller data queries (∼1 Mb).
To facilitate development, we manage an Ensembl data mirror at db01.bcgsc.bc.ca and Web mirror at ensemb01.bcgsc.bc.ca:8082. The Ensembl data is stored in a MySQL database served from an IBM X440 server with eight 1.5-Ghz Xeon processors and 8 Gb of RAM. For presentation purposes, we have been able to mirror Ensembl and run Sockeye on a 1.8-Ghz P4 IBM ThinkPad with 60 Gb of hard-disk space and 256 Mb of RAM. The easiest method of using Sockeye is to import data from Ensembl at ensembldb.ensembl.org or db01.bcgsc.bc.ca.
We build our auto-installers for Linux and Windows operating systems by using InstallAnywhere. Installations of Sockeye require at least 80 Mb of available hard drive for Linux and 55 Mb for Windows. It is also recommended that individual users have at least 64 MB of available RAM. Sockeye comes prepackaged with the latest Java Runtime Environment and version of Java3D.
Acknowledgments
We thank many people for their contributions and input, including: Marco Marra (CMSGSC), Michael Brudno (Stanford), and Christine Dahl for valuable input in reviewing this manuscript; the entire Ensembl development team for support and hospitality; Wyeth Wasserman and David Arenillas (CMMT) for assistance with LRA; Chris Fjell, Ben Horsmann, Merhdad Oveisi, and Scott Zuyderduyn (CMSGSC) for various Java contributions; Martin Krzywinski, Sheldon McKay, and Greg Vatcher (CMSGSC) for valuable input; the staff of Canada's Michael Smith Genome Sciences Centre and the BC Cancer Agency for their technical expertise and support; and Stephan Schlecht (Software7) for HELEN JavaHelp support. We would like to especially thank Genome BC, Genome Canada and the BC Cancer Foundation for funding this research. S.J. is a Scholar of the Michael Smith Foundation for Health Research.
The publication costs of this article were defrayed in part by payment of page charges. This article must therefore be hereby marked “advertisement” in accordance with 18 USC section 1734 solely to indicate this fact.
Article and publication are at http://www.genome.org/cgi/doi/10.1101/gr.1890304.
Footnotes
[Supplemental material is available online at www.genome.org.]
References
- Altschul, S.F., Gish, W., Miller, W., Myers, E.W., and Lipman, D.J. 1990. Basic local alignment search tool. J. Mol. Biol. 215: 403-410. [DOI] [PubMed] [Google Scholar]
- Ashburner, M. and Drysdale, R. 1994. FlyBase: The Drosophila genetic database. Development 120: 2077-2079. [DOI] [PubMed] [Google Scholar]
- Bohannon, J. 2002. Bioinformatics: The human genome in 3D, at your fingertips. Science 298: 737. [DOI] [PubMed] [Google Scholar]
- Brudno, M., Do, C.B., Cooper, G.M., Kim, M.F., Davydov, E., Green, E.D., Sidow, A., and Batzoglou, S. 2003. LAGAN and Multi-LAGAN: Efficient tools for large-scale multiple alignment of genomic DNA. Genome Res. 13: 721-731. [DOI] [PMC free article] [PubMed] [Google Scholar]
- Chenna, R., Sugawara, H., Koike, T., Lopez, R., Gibson, T.J., Higgins, D.G., and Thompson, J.D. 2003. Multiple sequence alignment with the Clustal series of programs. Nucleic Acids Res. 31: 3497-3500. [DOI] [PMC free article] [PubMed] [Google Scholar]
- Geisler, J.G., Stubbs, L.J., Wasserman, W.W., and Mucenski, M.L. 1998. Molecular cloning of a novel mouse gene with predominant muscle and neural expression. Mamm. Genome 9: 274-282. [DOI] [PubMed] [Google Scholar]
- Gottgens, B., Gilbert, J.G., Barton, L.M., Grafham, D., Rogers, R., Bentley, D.R., and Green, A.R. 2001. Long-range comparison of human and mouse SCL loci: Localized regions of sensitivity to restriction endonucleases correspond precisely with peaks of conserved noncoding sequences. Genome Res. 11: 87-97. [DOI] [PMC free article] [PubMed] [Google Scholar]
- Hubbard, T., Barker, D., Birney, E., Cameron, G., Chen, Y., Clark, L., Cox, T., Cuff, J., Curwen, V., Down, T., et al. 2002. The Ensembl genome database project. Nucleic Acids Res. 30: 38-41. [DOI] [PMC free article] [PubMed] [Google Scholar]
- Karolchik, D., Baertsch, R., Diekhans, M., Furey, T.S., Hinrichs, A., Lu, Y.T., Roskin, K.M., Schwartz, M., Sugnet, C.W., Thomas, D.J., et al. 2003. The UCSC Genome Browser Database. Nucleic Acids Res. 31: 51-54. [DOI] [PMC free article] [PubMed] [Google Scholar]
- Kim, S.K., Lund, J.P., Kiraly, M., Duke, K., Jiang, M., Stuart, J.M., Eizinger, A., Wylie, B.N., and Davidson, G.S. 2001. A gene expression map for Caenorhabditis elegans. Science 293: 2087-2092. [DOI] [PubMed] [Google Scholar]
- Lewis, S.E., Searle, S.M., Harris, N., Gibson, M., Lyer, V., Richter, J., Wiel, C., Bayraktaroglir, L., Birney, E., Crosby, M.A., et al. 2002. Apollo: A sequence annotation editor. Genome Biol. 3: RESEARCH0082. [DOI] [PMC free article] [PubMed]
- Maglott, D.R., Katz, K.S., Sicotte, H., and Pruitt, K.D. 2000. NCBI's LocusLink and RefSeq. Nucleic Acids Res. 28: 126-128. [DOI] [PMC free article] [PubMed] [Google Scholar]
- Mangalam, H. 2002. The Bio* toolkits: A brief overview. Brief Bioinform. 3: 296-302. [DOI] [PubMed] [Google Scholar]
- Marra, M.A., Jones, S.J., Astell, C.R., Holt, R.A., Brooks-Wilson, A., Butterfield, Y.S., Khattra, J., Asano, J.K., Barber, S.A., Chan, S.Y., et al. 2003. The Genome sequence of the SARS-associated coronavirus. Science 300: 1399-1404. [DOI] [PubMed] [Google Scholar]
- Martz, E. 2002. Protein Explorer: Easy yet powerful macromolecular visualization. Trends Biochem. Sci. 27: 107-109. [DOI] [PubMed] [Google Scholar]
- Mayor, C., Brudno, M., Schwartz, J.R., Poliakov, A., Rubin, E.M., Frazer, K.A., Pachter, L.S., and Dubchak, I. 2000. VISTA: Visualizing global DNA sequence alignments of arbitrary length. Bioinformatics 16: 1046-1047. [DOI] [PubMed] [Google Scholar]
- Sayle, R.A. and Milner-White, E.J. 1995. RASMOL: Biomolecular graphics for all. Trends Biochem. Sci. 20: 374. [DOI] [PubMed] [Google Scholar]
- Schwartz, S., Zhang, Z., Frazer, K.A., Smit, A., Riemer, C., Bouck, J., Gibbs, R., Hardison, R., and Miller, W. 2000. PipMaker: A Web server for aligning two genomic DNA sequences. Genome Res. 10: 577-586. [DOI] [PMC free article] [PubMed] [Google Scholar]
- Sensen, C.W. 2002. Using CAVE technology for functional genomics studies. Diabetes Technol. Ther. 4: 867-871. [DOI] [PubMed] [Google Scholar]
- Stein, L., Sternberg, P., Durbin, R., Thierry-Mieg, J., and Spieth, J. 2001. WormBase: Network access to the genome and biology of Caenorhabditis elegans. Nucleic Acids Res. 29: 82-86. [DOI] [PMC free article] [PubMed] [Google Scholar]
- Tate, J.G., Moreland, J.L., and Bourne, P.E. 2001. Design and implementation of a collaborative molecular graphics environment. J. Mol. Graph. Model 19: 280-287, 369-373. [DOI] [PubMed] [Google Scholar]
- Ureta-Vidal, A., Ettwiller, L., and Birney, E. 2003. Comparative genomics: Genome-wide analysis in metazoan eukaryotes. Nat. Rev. Genet. 4: 251-262. [DOI] [PubMed] [Google Scholar]
- Wasserman, W.W. and Fickett, J.W. 1998. Identification of regulatory regions which confer muscle-specific gene expression. J. Mol. Biol. 278: 167-181. [DOI] [PubMed] [Google Scholar]
- Wheeler, D.L., Church, D.M., Lash, A.E., Leipe, D.D., Madden, T.L., Pontius, J.U., Schuler, G.D., Schriml, L.M., Tatusova, T.A., Wagner, L., et al. 2001. Database resources of the National Center for Biotechnology Information. Nucleic Acids Res. 29: 11-16. [DOI] [PMC free article] [PubMed] [Google Scholar]
WEB SITE REFERENCES
- http://www.bcgsc.bc.ca/sockeye; CMSGSC's Sockeye page.
- http://www.bcgsc.bc.ca/sockeye/gr2004_online_supplement; Sockeye version 1.0 User's Guide.
- http://www.bcgsc.ca/bioinfo/SARS/; CMSGSC SARS.
- db01.bcgsc.bc.ca; Ensembl data mirror.
- ensemb01.bcgsc.bc.ca:8082; Ensembl Web mirror.
- ensembldb.ensembl.org; Ensembl public MySQL server.
- http://www.wutka.com/jox.html; JOX toolkit.
- http://www.cafeconleche.org/XOM/; XOM toolkit.