

Abstract
Study Objectives:
Low-threshold voltage-gated T-type Ca2+ channels (T-channels or CaV3 channels) sustain oscillatory discharges of thalamocortical (TC) and nucleus Reticularis thalami (nRt) cells. The CaV3.3 subtype dominates nRt rhythmic bursting and mediates a substantial fraction of spindle power in the NREM sleep EEG. CaV3.2 channels are also found in nRt, but whether these contribute to nRt-dependent spindle generation is unexplored. We investigated thalamic rhythmogenesis in mice lacking this subtype in isolation (CaV3.2KO mice) or in concomitance with CaV3.3 deletion (CaV3.double-knockout (DKO) mice).
Methods:
We examined discharge characteristics of thalamic cells and intrathalamic evoked synaptic transmission in brain slices from wild-type, CaV3.2KO and CaV3.DKO mice through patch-clamp recordings. The sleep profile of freely behaving CaV3.2KO and CaV3.DKO mice was assessed by polysomnographic recordings.
Results:
CaV3.2 channel deficiency left nRt discharge properties largely unaltered, but additional deletion of CaV3.3 channels fully abolished low-threshold whole-cell Ca2+ currents and bursting, and suppressed burst-mediated inhibitory responses in TC cells. CaV3.DKO mice had more fragmented sleep, with shorter NREM sleep episodes and more frequent microarousals. The NREM sleep EEG power spectrum displayed a relative suppression of the σ frequency band (10–15 Hz), which was accompanied by an increase in the δ band (1–4 Hz).
Conclusions:
Consistent with previous findings, CaV3.3 channels dominate nRt rhythmogenesis, but the lack of CaV3.2 channels further aggravates neuronal, synaptic, and EEG deficits. Therefore, CaV3.2 channels can boost intrathalamic synaptic transmission, and might play a modulatory role adjusting the relative presence of NREM sleep EEG rhythms.
Citation:
Pellegrini C, Lecci S, Lüthi A, Astori S. Suppression of sleep spindle rhythmogenesis in mice with deletion of Cav3.2 and Cav3.3 T-type Ca2+ channels. SLEEP 2016;39(4):875–885.
Keywords: sleep spindles, sleep architecture, nucleus Reticularis thalami
Significance.
Sleep spindles are recurrent brain electrical oscillations typical for non-rapid-eye-movement sleep that protect the sleeping brain from external disturbance, sustain memory reinforcement in neuronal circuits and appear to be altered in several psychiatric disorders. We succeeded in suppressing sleep spindles in mice by genetically deleting the two low-voltage-gated Ca2+ channels responsible for rhythmic electrical discharges of cells in the nucleus Reticularis thalami, also known as the thalamic spindle pacemaker. Our findings help dissecting the genetic make-up of sleep rhythmogenesis and offer a mouse model to examine the pathophysiological consequences of disrupting sleep spindles.
INTRODUCTION
Low voltage-gated T-type Ca2+ channels (T-channels) enable neurons to produce low-threshold discharges that are essential for the generation of sleep rhythms, but that occur also in motor control and olfaction.1–6 Furthermore, T-channels may lead to aberrant bursting in neurons exposed to abnormal electrical activity.1,7,8 T-channels are encoded by three genes, CACNA1g, CACNA1h and CACNA1i that give rise to the subtypes CaV3.1, CaV3.2, and CaV3.3, respectively, characterized by different biophysical properties and expression patterns.9,10 T-channels are most abundant in thalamus, where they exhibit regional specificity: whereas CaV3.1 channel mRNA is restricted to excitatory thalamocortical (TC) cells, e.g., in the ventrobasal nucleus (VB), mRNA for both CaV3.2 and CaV3.3 channels is present in the nucleus Reticularis thalami (nRt),10,11 a shell of GABAergic cells modulating the information flow in the thalamocortical system.12
Genetic manipulations of CaV3 channels have yielded substantial insight into the mechanisms of oscillatory activity of neuronal cells. However, in contrast to the well-established role of T-channels in single-cell burst discharge, how these channels contribute to network rhythmic activity has only partially progressed since the generation of knock-out (KO) animals. Furthermore, in at least some cases, the relation between the cellular effects of T-channel subtype deletion and the purported role of burst discharges in EEG rhythms remains obscure. For example, CaV3.1 channels are clearly responsible for low-threshold bursting in TC cells. However, both increases and decreases in the δ power (1–4 Hz) of the NREM sleep EEG were observed in animals lacking CaV3.1 channels.13,14 Therefore, a long-standing tenet on the TC cell clock-like burst discharges as basis for the EEG δ rhythm15,16 could not yet be confirmed based on CaV3 channel genetics.
We have previously shown that the CaV3.3 subtype is the major source of low-threshold Ca2+ spikes in nRt cell dendrites.17 In CaV3.3KO mice, nRt repetitive burst discharges were strongly reduced, leading to an impaired inhibitory drive onto TC cells. Furthermore, consistent with the previously recognized implication of the nRt in sleep spindle pacemaking, EEG power in the σ frequency range (10–15 Hz) was weakened at transitions between NREM and REM sleep in CaV3.3KO animals. There were no other major changes in EEG frequency bands, which indicated a CaV3.3-specific decrease in sleep spindle rhythmogenesis.17
Although CaV3.3-deficiency led to a reduction in sleep spindles, a substantial portion of power increase remained present in the σ frequency band at NREM sleep exit, suggesting that other cellular mechanisms contributing to these thalamocortical rhythms exist. A major candidate is the CaV3.2-current that has been identified in nRt cells,18 and that appears to be the target of several modulatory extracellular and intracellular signaling molecules.19 To date, CaV3.2 channels are implicated in peripheral nociception and neuropathic pain, and might be involved in specific forms of thalamic processing, e.g., relay of nociceptive inputs.20–22 In addition, the expression of CaV3.2 channels can be modified in pathological conditions, e.g., in animal models of epilepsy.7 Whether and how CaV3.2 channels contribute to thalamic sleep rhythmogenesis has yet not been ascertained.
Here, we examined the consequences of silencing CaV3-mediated nRt rhythmogenesis on the EEG profile of mice harboring a deletion of CaV3.2 and CaV3.3 genes (CaV3.DKO). Whereas a lack of the CaV3.2 subtype alone in CaV3.2KO mice did not cause major alterations to nRt cellular properties, CaV3. DKO mice showed a fully abolished nRt low-threshold spiking and strongly impaired intrathalamic GABAergic transmission. In freely behaving CaV3.2KO mice, the EEG power spectrum during NREM sleep was indistinguishable from that of wild-type animals. By contrast, in CaV3.DKO mice, relative EEG power in the σ frequency range during NREM sleep was suppressed and accompanied by an increase in the δ frequency range. Although CaV3.DKO mice spent globally more time in NREM sleep during the light phase, NREM sleep episodes were of shorter duration compared to wild-type animals. Thus, silencing low-threshold bursts in nRt neurons not only affects spindle generation, but also alters slow wave rhythmogenesis, likely due to deficient inhibitory drive onto TC cells.
METHODS
Animal Handling and Genotyping
All procedures were approved by the Veterinary Office of the Canton de Vaud. C57Bl/6J (wild-type), homozygous CaV3.2KO and homozygous CaV3.DKO mice were maintained under a 12:12h light/dark schedule (Zeitgeber time ZT 0: 7AM for animals used for electrophysiological recordings; 9AM for polysomnographic recordings). Homozygous CaV3.2KO mice were obtained from heterozygous breeders (CaV3.2het) from the Cacna1h-KO mouse line,23 originally generated on a mixed C57Bl/6J-129S3 background that was backcrossed into the C57Bl/6J background for 4 generations and has since been backcrossed into the C57Bl/6J background for over 10 years. Homozygous CaV3.DKO mice were obtained by crossing the CaV3.2KO and the C57Bl/6J-Cacna1i-KO (CaV3.3KO) mouse line.17 First, CaV3.2het/CaV3.3het mice were generated from CaV3.2het and homozygous CaV3.3KO mice. Second, CaV3.2het/ CaV3.3het were interbred, and the obtained CaV3.2het/CaV3.3KO mice were selected as final breeders for the generation of CaV3. DKO mice. The percentage of homozygous CaV3.DKO mice at the time of genotyping (P8-12) was below Mendelian expectation (< 10%), suggesting high perinatal mortality. The genotype was determined by PCR using the following primers (5'–3') for the CACNA1h gene, following a protocol provided by Heinz Beck's laboratory at the University of Bonn: CACNA1hF: ATTCAAGGGCTTCCACAGGGTA; CACNA1hR: CATCTCAGGGCCTCTGGACCAC; CACNA1hNeo: GCTAAAGCGCATGCTCCAGACTG, yielding products of 480 bp for wild-type and 330 bp for CaV3.2KO mice. For the CACNA1i gene, primers were: CACNA1iF: CTGCTGTGGTACCCTCCTGTC; CACNA1iR: GACAGGGTACCTGCTGCATG; EN-2SA-3R: GGGTTCGTGTCCTACAACAC, yielding products of 900 bp for wild-type and 545 bp for CaV3.3KO mice.17
Electrophysiological Recordings and Analyses
Acute horizontal brain slices (300 μm-thick) were prepared at ZT 5–6 from 3–4 week-old animals of either sex, as previously described.17,24 In the recording chamber, slices were constantly superfused with oxygenated artificial CSF (ACSF) at 30–32°C containing (in mM): 125 NaCl, 25 NaHCO3, 2.5 KCl, 1.25 NaH2PO4, 1.2 MgCl2, 2 CaCl2, 25 glucose, 1.7 L(+)-ascorbic acid. Visually identified nRt and TC neurons were whole-cell patched with borosilicate glass pipettes (TW150F-4, WPI). For recordings of passive membrane properties and spike discharges, pipettes (3–5 MΩ) were filled with an intracellular solution containing (in mM): 140 KMeSO4, 10 KCl, 10 HEPES, 0.1 EGTA, 4 Mg-ATP, 0.2 Na-GTP, 10 phosphocreatine (290–300 mOsm, pH 7.25). A liquid junction potential of −10 mV was taken into account. For T-current isolation, patch pipettes (2–3 MΩ) were filled with the following solution (in mM): 135 tetramethylammonium hydroxide (TMA-OH), 40 HEPES, 10 EGTA, 2 MgCl2, 4 Mg-ATP, titrated to pH 7.2 with 100 mM hydrofluoric acid (HF). The extracellular solution was supplemented with 1 μM tetrodotoxin. A liquid junction potential of −2 mV was corrected for. T-current density and activation curve were estimated as previously described.17 For IPSC recordings in TC cells, pipettes (3–4 MΩ) were filled with (in mM): 127 CsGluconate, 10 HEPES, 2 BAPTA, 6 MgCl2, 2 Mg-ATP, 0.2 Na-GTP, 10 phosphocreatine, 2.5 QX-314 (290–300 mOsm, pH 7.25). In TC neurons voltage-clamped at −30 mV, postsynaptic responses were evoked by monopolar stimulation in the internal capsule with an ACSF-filled glass electrode, in the absence of glutamatergic blockers. IPSC charge transfer was calculated as the integral of the current trace during 1s from response onset. For EPSP recordings in nRt cells, pipettes were filled with the KMeSO4-based solution described above, and ACSF was supplemented with 0.1 mM picrotoxin and 0.01 mM glycine. Current-clamp recordings were conducted with automatic bridge-balance of pipette resistance. Glutamatergic afferents were electrically stimulated in the internal capsule with a paired-pulse protocol (50 ms interval). Inputs of cortical origin were selected based on the short-term facilitation of the postsynaptic responses,25 as assessed by the ratio of the initial slopes of voltage responses to 2nd and 1st stimuli. The probability of eliciting a low-threshold spike was estimated by the presence of a burst discharge in the 2nd response (as opposed to tonic firing or lack of discharge). At least 8 paired-pulse responses were evoked in nRt cells held at −80 mV by current injections.
Series resistance (Rs) was monitored throughout recordings by brief voltage pulses, and data were rejected for Rs changes > 25%. Data were acquired through a Digidata1320 digitizer. Signals were amplified through a Multiclamp700B amplifier (Molecular Devices), sampled at 20 kHz and filtered at 10 kHz using Clampex10 (Molecular Devices). Clampfit10 (Molecular Devices) and Igor Pro 6 (WaveMetrics) were used for data analysis.
Chemicals
All standard salts and chemicals were purchased from SigmaAldrich, except the following: KMeSO4 (ICN Biomedicals); L(+)-ascorbic acid (VWR Prolabo); Tetrodotoxin, (Latoxan); QX-314-Cl (Alomone Labs), picrotoxin (Abcam).
Polysomnographic Recordings and Analyses
Electroencephalographic (EEG/ECoG) and electromyographic (EMG) recordings were performed in male CaV3.2KO mice, CaV3.DKO mice and wild-type mice chronically implanted with electrodes for differential fronto-parietal EEG and nuchal muscle EMG, as previously described.17,26 EEG electrodes were 2 gold-plated screws (1.1 mm diameter) implanted on the right hemisphere ∼1.5 mm frontal to the bregma and ∼1.5 mm frontal to the lambda, respectively, both at ∼1.5 mm from the central fissure. Four further screws were inserted on the 2 hemispheres at symmetrical positions to stabilize the pin connector. EMG electrodes were gold wires with a diameter of 0.2 mm. The whole implant was fixed to the skull with a first layer of resin cement (RelyX, 3-M, or G-CEM, GC America Inc.) and then covered with Paladur (Heraeus Kulzer). At the time of surgery, animals were 6–9 weeks old. CaV3.DKO mice had slightly lower body weights (wild-type: 22.3 ± 0.9 g, n = 8 vs. CaV3.2KO: 21.8 ± 0.7 g, n = 8, and CaV3.DKO: 19.3 ± 0.9 g, n = 8; P = 0.058, one-way ANOVA). During one week of post-surgery recovery, mice received paracetamol (2 mg/mL) in drinking water. Animals were allowed one additional week to habituate once electrode implants were connected to the tethering cables. Polysomnographic acquisitions were performed in 48 h-long sessions with groups of 4 animals. The analog EEG and EMG signals were first amplified (gain 2000 x), and then high-pass filtered at 0.7 Hz and 10 Hz, respectively. Data were digitized at 2 kHz and down-sampled to 200 Hz through Somnologica 3.3.1 software (Embla System). Vigilance states were visually scored as wakefulness, NREM or REM sleep based on EEG/EMG signals according to well-established criteria.26 Power spectra were determined from 48-h long recordings using discrete-Fourier transformation between 0.75 to 90 Hz (0.25 Hz bins) for consecutive 4-s epochs. For spectral analysis, a given epoch was rejected when an adjacent epoch was scored to a different vigilance state or contained movement artifacts. On average, 74% ± 5% of the total waking time, 93% ± 1% of the total NREM sleep time and 75% ± 2% of the total REM sleep time were included in the spectral analysis of wild-type animals. The corresponding values for CaV3.2KO mice are 82% ± 6%, 94% ± 1%, 84% ± 1%, and, for CaV3. DKO mice, 74% ± 7%, 91% ± 1% and 76% ± 4%. Mean power spectra were calculated as the average of all artifact-free 4-s epochs of the corresponding vigilance state during both light and dark phase. Sigma power at NREM-to-REM sleep transition was determined according to previously described procedures,3,26 with % σ power expressed relative to the mean values at min 0.5–1.5 after the transition to REM sleep. Microarousals were defined as waking episodes of ≤ 16 s duration preceded and followed by at ≥ 5 and ≥ 4 NREM sleep episodes, respectively. EEG analyses were performed with customized semi-automated routines written in Matlab v8.5 R2015a (The Mathworks).
Statistical Analyses
Data are presented as mean ± SEM, with “n” indicating the number of cells for in vitro recordings, and number of animals for EEG datasets. The use of parametric or nonparametric statistical tests was based on the normal distribution of the data. One-way ANOVA and repeated measures ANOVA were performed in JMP.10 (SAS Institute Inc.), followed by post hoc Student t-test, with significance accepted for α < 0.05. Greenhouse-Geisser (G-G) correction was applied to account for violation of sphericity (Mauchly test), where necessary. Cumulative distributions of bouts of behavioral states were compared with the Kolmogorov-Smirnov test in Matlab, with a significance level of 0.01.
RESULTS
Abolishment of nRt Low-Threshold Burst Discharges in CaV3.DKO Mice
In acute brain slices from wild-type, CaV3.2KO and CaV3. DKO mice, we compared basic electrophysiological parameters of nRt neurons by means of whole-cell patch-clamp recordings (Figure 1). No overt difference between geno-types was present for values of resting membrane potential (Vrmp: wild-type, −64.6 ± 2.6 mV; CaV3.2KO, −67.9 ± 2.6 mV; CaV3.DKO, −70.9 ± 3.1 mV), cell capacitance (Cm: wild-type, 78.7 ± 7 pF; CaV3.2KO, 85.9 ± 10 pF; CaV3.DKO, 80.0 ± 5 pF), and input resistance (Ri: wild-type, 204.8 ± 31.4 MΩ; CaV3.2KO, 207.4 ± 34.2 MΩ; CaV3.DKO, 227.5 ± 24.9 MΩ) (wild-type, n = 11 cells; CaV3.2KO, n = 9; CaV3.DKO, n = 9; for all parameters P > 0.05, one-way ANOVA; Figure 1A). Current responses to hyperpolarizing voltage steps, which include activation of inwardly rectifying and HCN channels, were also comparable (Figure 1B). Moreover, tonic firing elicited by depolarizing current injections (400 ms) from a holding potential of −70 mV displayed similar input-output relationships (wild-type, n = 9; Ca V3.2KO, n = 8; Ca V3.DKO, n = 9; Figure 1C). We noticed a tendency of CaV3.DKO neurons to sustain prolonged tonic firing, whereas wild-type and CaV3.2KO often displayed strong accommodation after the first 200 ms of depolarization. We quantified spiking frequency during the second half of the 400 ms-long depolarization, and found a consistent tendency for an increase in CaV3.DKO neuron firing rate (e.g. 400 pA step: wild-type, 26.7 ± 17.8 Hz; CaV3.2KO, 26.8 ± 10.1 Hz; CaV3.DKO, 43.9 ± 11.7 Hz; P > 0.05). This is consistent with a previous study reporting on increased propensity of CaV3. DKO nRt cells to generate tonic firing during prolonged step depolarization (> 1 s).27
Figure 1.

Lack of overt changes in passive properties and tonic discharge of nRt cells of CaV3.2KO and CaV3.DKO mice. (A) Boxand-whisker plots with values of resting membrane potential (Vrmp), membrane capacitance (Cm) and input resistance (Ri) of nRt cells from wild-type (WT, n = 11), CaV3.2KO (n = 9) and CaV3.DKO (n = 9) mice. The midline in each box represents the median, the whiskers are 10th and 90th percentiles. (B) Left, representative current responses to hyperpolarizing voltage steps from −60 mV for all genotypes. Inset: protocol. Right, steady-state current (Iss) for WT (n = 10), CaV3.2KO (n = 9) and CaV3.DKO (n = 9) nRt cells over a range of voltages. (C) Top, representative tonic discharges in WT, CaV3.2KO and CaV3.DKO nRt cells elicited by positive current injections from −70 mV. Bottom, average discharge frequency of tonic action potentials (APs) during the 400 ms over a range of positive currents injected (WT, n = 9; CaV3.2KO, n = 8; CaV3.DKO, n = 9; P > 0.05). Inset: current-clamp protocol.
We next examined low-threshold spiking generated at the offset of brief hyperpolarizing current steps (Figure 2). Wild-type cells (n = 10) displayed rhythmic low-threshold Ca2+ spikes accompanied by bursts of Na+ action potentials, the number of which varied depending on the initial membrane potential. Typically, bursts discharges were best elicited at Vm values in the range between −70 mV and −55 mV. Interestingly, in nRt cells from CaV3.2KO mice, no significant change in repetitive bursting was found (P > 0.05; n = 9; Figure 2C, 2D). Inter-burst intervals measured for discharges elicited from −70 mV also did not differ between genotypes (interval between initial APs of the first and second burst: wild-type, 168 ± 16 ms, n = 6; CaV3.2KO, 181 ± 14 ms, n = 8; P > 0.05, unpaired t-test). By contrast, CaV3.DKO mice displayed a complete lack of oscillatory low-threshold spiking, as previously reported.27 Occasionally, a single action potential appeared in CaV3.DKO cells at the offset of hyperpolarizing steps applied from more depolarized membrane potentials (−50 mV, observed in 4 of 9 cells).
Figure 2.

Suppression of oscillatory low-threshold bursting in nRt cells from CaV3.DKO mice. (A) Representative traces of low-threshold bursting in WT, CaV3.2KO and CaV3.DKO nRt cells elicited at the offset of negative current injections from different membrane potentials, as indicated. (B) Expanded traces from (A) at −60 mV. Inset: current-clamp protocol. (C) Number of low-threshold Ca2+ spikes and (D) number of action potentials (APs) during the first burst in WT (n = 10), CaV3.2KO (n = 9), and CaV3.DKO (n = 9) mice.
Next, we quantified the contribution of CaV3.2 channels to isolated low-threshold Ca2+ currents (T-currents) that were elicited by increasing depolarizing steps applied to nRt cells voltage-clamped at −100 mV (Figure 3). Compared to wild-type cells, currents from CaV3.2KO cells displayed a slight prolongation of inactivation kinetics (τw, decay at −60 mV: wild-type, 58.9 ± 4.5 ms, n = 9; CaV3.2KO, 83.1 ± 10.9 ms, n = 8; P = 0.07, unpaired t-test; Figure 3A), consistent with previous data from younger (2 week-old) CaV3.2KO mice.18 Activation kinetics were equivalent (10% to 90% rise time at −60 mV: wild-type, 6.8 ± 0.6 ms, n = 9; CaV3.2KO, 6.1 ± 0.5 ms, n = 8; P > 0.05, unpaired t-test; Figure 3A). Current density and activation curve were comparable, with no significant modification in the estimated Vhalf (wild-type, −71.1 ± 1.0 mV, n = 9; CaV3.2KO, −69.8 ± 1.7 mV, n = 8; P > 0.05, unpaired t-test; Figure 3B). In CaV3.DKO mice, no detectable T-currents were generated across the entire range of voltage steps (n = 9).
Figure 3.

Elimination of low-threshold Ca2+ currents in nRt cells from CaV3.DKO mice. (A) Top, isolated low-threshold Ca2+ currents elicited by depolarizing steps from −100 mV in WT, CaV3.2KO and CaV3.DKO nRt cells. Bottom, representative traces scaled to peak and bar graphs showing mean values for decay time constant (τw, decay) and rise time (10% to 90%) from WT and CaV3.2KO (WT, n = 9; CaV3.2KO, n = 8; P > 0.05). Inset: voltage-clamp protocol. (B) T-current density for all genotypes (left) and activation curve (right) of the T-currents for WT and CaV3.2KO with estimated Vhalf (WT: −71.1 ± 1.0 mV, n = 9; CaV3.2KO: −69.8 ± 1.7 mV, n = 8; P > 0.05). In CaV3.DKO mice, no detectable T-currents were generated across the whole range of voltage steps (n = 9).
Together, deletion of CaV3.2 and CaV3.3 channels completely abolished T-currents in nRt cells, with a consequent suppression of repetitive oscillatory low-threshold discharges. The absence of the CaV3.2 subtype did not induce overt changes in the single-cell electrophysiological profile, confirming the dominant role of CaV3.3 channels in setting nRt cells responsiveness to somatic voltage fluctuations.17 However, it is also well known that the electrotonic properties of the thin nRt cell dendrites hamper proper space-clamp, which prevents the controlled activation of voltage-dependent conductances in distal compartments.28 This could be one reason for which a CaV3.2-current component went undetected in our somatic whole-cell recordings.
Impaired Intrathalamic GABAergic Transmission in CaV3.DKO Mice
We next examined the impact of CaV3.2 and CaV3.3 channel deletion on synaptic transmission and excitability within intrathalamic networks, which are both relevant for sleep rhythm generation.17,29 We first verified whether thalamocortical (TC) cells in the ventrobasal nucleus (VB) continue to generate low-threshold discharges via CaV3.1 channels13,14 when their synaptic partners in the nRt are burst-deficient. TC cells from wild-type, CaV3.2KO and CaV3.DKO mice displayed comparable responses to hyperpolarizing current injections, which reliably elicited low-threshold spikes crowned by the same number of action potentials (number of APs in bursts generated by a current injection of −250 pA: wild-type, 2.8 ± 0.4, n = 9; CaV3.2KO, 2.5 ± 0.5, n = 6; CaV3.DKO, 2.2 ± 0.4, n = 6; P > 0.05, one-way ANOVA; Figure 4A).
Figure 4.
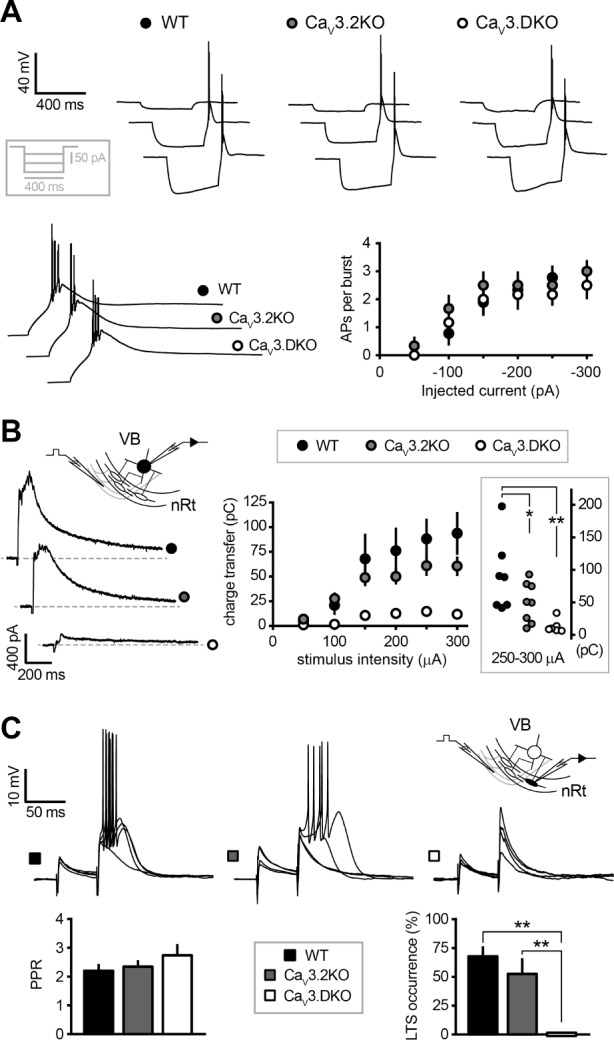
Consequences of CaV3.2 and CaV3.3 channel deletion for nRt-TC GABAergic transmission. (A) Top, representative traces of rebound bursting elicited by hyperpolarizing current injections discharges in TC neurons held at −70 mV. Inset: current-clamp protocol. Bottom left, expanded traces shown in (A) for a −150 pA step of current injection. Bottom right, the number of action potentials per burst across a range of injected current did not change between genotypes (WT, n = 9, CaV3.2KO, n = 6, CaV3.DKO, n = 6; P > 0.05). (B) Left, example traces of evoked IPSCs recorded in TC cells at −30 mV upon electrical stimulation in the internal capsule. Inset, recording configuration showing site of stimulation in the internal capsule while recording from a TC cell in the ventrobasal nucleus (VB). Right, charge transfer across a range of stimulus intensities for all genotypes showing a minor and a strong decrease in the CaV3.2KO and CaV3.DKO mice, respectively, compared to WT animals. Inset shows mean responses to higher stimulus intensities (250–300 μA) (WT, n = 7, CaV3.2KO, n = 8; CaV3.DKO, n = 7; one-way ANOVA, P < 0.05; **P < 0.01, *P < 0.05, post hoc unpaired t-test). (C) Top, examples of postsynaptic responses evoked in nRt cells at −80 mV upon stimulation of cortical afferents. Inset, recording configuration showing stimulation site in the internal capsule. Paired-pulse stimuli (50 ms interval) were delivered to select for responses of cortical origin based on short-term facilitation. Bottom, bar graphs showing mean values of paired-pulse ratio (PPR), measured from the initial slope of voltage responses, and occurrence of low-threshold spiking (LTS) on the second stimulus (WT, n = 8, CaV3.2KO, n = 7; CaV3.DKO, n = 6; one-way ANOVA, P > 0.05 for PPR and Wilcoxon test, P < 0.05 for LTS occurrence; **P < 0.01 nonparametric multiple comparison).
Low-threshold bursting of nRt generates phasic inhibitory currents in TC cells comprising a fast and a slow component, mediated by synaptic and non-synaptic GABAA receptors, respectively.29,30 In TC cells held at −30 mV using low Cl--based electrodes we evoked IPSCs by electrically stimulating the internal capsule, while leaving excitatory transmission intact, thus permitting the recruitment of nRt cell discharges by glutamatergic inputs. In wild-type mice, evoked responses in TC cells typically consisted of multiphasic “burst IPSCs” (bIPSCs) at stimulation intensities > 100 μA, with a sequence of fast events riding on a slower current envelope, previously reported to result from presynaptic burst discharge.17,29,31 Deletion of CaV3.2 channels decreased the charge transfer of bIPSCs elicited at higher intensities (250–300 μA: wild-type, 91.0 ± 21.1 pC, n = 7; Ca V3.2KO, 50.7 ± 10.7 pC, n = 8; P < 0.05 oneway ANOVA; Figure 4B). By contrast, in TC cells from CaV3. DKO, only small monophasic IPSCs lacking the waveform typical for bIPSCs could be evoked, and the charge transfer was strongly diminished (250–300 μA: CaV3.DKO, 13.5 ± 3.6 pC, n = 7; P < 0.01 compared to wild-type; Figure 4B). Finally, we examined the responsiveness of nRt cells to cortical glutamatergic inputs, which are thought to initiate spindle rhythmogenesis by activating low-threshold conductances in nRt dendrites.32,33 In current-clamped nRt cells at −80 mV, we evoked EPSPs of cortical origin by selecting responses that exhibited short-term facilitation upon paired-pulse stimulation in the internal capsule.25 Paired-pulse ratio of the initial slope of voltage responses was comparable between genotypes (wild-type, 2.2 ± 0.2, n = 8; CaV3.2KO, 2.4 ± 0.2, n = 7; CaV3. DKO, 2.7 ± 0.4, n = 6; P > 0.05 one-way ANOVA; Figure 4C). In wild-type and in CaV3.2KO mice, the second stimulus typically elicited a low-threshold burst, with an occurrence of 68% ± 8% and 52% ± 15%, respectively. In CaV3.DKO mice, no bursting was generated (P < 0.01 Wilcoxon test, compared to the other genotypes), despite the sufficient depolarization provided by the second stimulus (on average 12.5 ± 1.2 mV), which occasionally elicited a single suprathreshold action potential (in 2 of 6 cells).
Together, these data reveal a pronounced deficit in the intrathalamic GABAergic transmission in CaV3.DKO mice, which is due to an impaired capability of nRt in generating low-threshold discharges. Although the deletion of CaV3.2 channels did not appear to affect nRt repetitive bursts in response to somatic current injections, CaV3.2KO mice displayed a reduction in the charge transfer of bIPSCs. This discrepancy between somatically and synaptically elicited bursting suggests that CaV3.2 deletion affects the efficacy of excitatory inputs in recruiting nRt dendritic Ca2+ conductances.
EEG Sleep Profile of CaV3.2KO and CaV3.DKO Mice
The lack of low-threshold bursting in nRt cells from CaV3. DKO mice predicted a marked deregulation of thalamic sleep rhythmogenesis. In particular, we expected CaV3.DKO mice to exhibit deficits in sleep spindle generation, which depends on nRt bursting and on reverberatory activity within the nRt-TC loop.32,34,35 We performed polysomnographic recordings in freely behaving wild-type (n = 8), CaV3.2KO mice (n = 8), and CaV3.DKO mice (n = 8) chronically implanted with EEG/EMG electrodes and recorded under undisturbed conditions for 48 h. In the following, we describe sleep architecture and EEG power spectra during NREM sleep, REM sleep, and waking in the three genotypes.
CaV3.2KO mice spent similar amounts of time in the different vigilance states as compared to wild-type animals, except for a slight reduction in NREM sleep during the dark phase (F2.0, 21.3 = 2.8, P = 0.08; Figure 5A). During the light phase, CaV3.DKO mice spent, on average, more time in NREM sleep and less time in waking, as compared to wild-type and CaV3.2KO mice (F2.4, 25.3 = 6.6, P < 0.01). Inspection of sleep bout length revealed that NREM sleep episodes of long duration (> 252 s) occurred more frequently in CaV3.2KO mice, whereas bouts of intermediate duration (32–252 s) were predominant in CaV3.DKO mice at the expense of long episodes (F2.0, 21.3 = 12.3, P < 0.01; Figure 5B). By contrast, no alterations were found in episode length and global time spent in REM sleep (F2.6, 27.2 = 2.3, P > 0.05; Figure 5A, 5B) or in the number of transitions from NREM to REM sleep (per hour of NREM sleep: 6.0 ± 0.5 in wild-type vs. 6.7 ± 0.4 in CaV3.2KO mice, and 5.8 ± 0.4 in CaV3.DKO mice, P > 0.05). The changes in NREM sleep architecture appeared to be counterbalanced by alterations in waking episodes. Compared to wild-type and CaV3.2KO mice, CaV3.DKO mice spent more time in brief and intermediate periods of wakefulness (< 32 s, 32–124 s, F 2.1, 22.5 = 11.6, P < 0.01; Figure 6A), and, interestingly, NREM sleep episodes were more frequently interrupted by micro-arousals (per hour of NREM sleep: 13.2 ± 1.1 microarousals in wild-type vs. 8.8 ± 0.9 in CaV3.2KO mice, and 17.6 ± 0.9 in CaV3. DKO mice, P < 0.01 for both KO genotypes compared to wild-type). Thus, although CaV3.DKO mice spent globally more time in NREM sleep episodes, these were of shorter duration, and sleep was generally more disrupted by short awakenings.
Figure 5.

Comparison of the EEG sleep profile of WT, CaV3.2KO, and CaV3.DKO mice. (A) Time spent in wake, NREM and REM sleep, expressed in % of 12 h and separated for light and dark period, for WT (n = 8), CaV3.2KO (n = 8), and CaV3.DKO (n = 8) mice. During the light phase, CaV3.DKO showed an increased amount of NREM sleep, while waking was reduced (state × genotype interaction: F2.4, 25.3 = 6.6, P < 0.05; **P < 0.01, post hoc unpaired t-test). No change occurred during the dark phase (F2.0, 21.3 = 2.8, P > 0.05). (B) Cumulative distributions of NREM and REM sleep episode duration pooled for light and dark phase. Statistical significance was tested with K-S statistics (P < 0.01 between all genotypes for NREM sleep). Insets, histograms of time spent in short, intermediate and long episodes per hour of corresponding sleep (duration × genotype interaction: F2.0, 21.3 = 12.3, P < 0.01 for NREM sleep and F2.6, 27.2 = 2.3, P > 0.05 for REM sleep; *P < 0.05, **P < 0.01, post hoc unpaired t-test). (C) Mean absolute power of relevant frequency bands during NREM or REM sleep separated for light and dark phase (SWA (0.75–4 Hz), σ (10–15 Hz), and θ (5–8 Hz); one-way ANOVA, P < 0.05 and P < 0.01 for SWA of light and dark phase, respectively; *P < 0.05, **P < 0.01, post hoc unpaired t-test). (D) Normalized EEG power spectrum between 0.75 and 25 Hz for NREM (left) and REM (right) sleep. Red and orange lines on the x axes delineate intervals of frequency for CaV3.DKO mice with a significant difference compared to WT and CaV3.2KO mice, with P < 0.01 and P < 0.05, respectively, tested with post hoc unpaired t-test after repeated measures ANOVA (genotype × frequency interaction: F2.7, 27.9 = 4.5, P < 0.05 for NREM sleep and F3.2, 33.4 = 1.8, P > 0.05 for REM sleep). Dotted lines indicate frequency ranges for SWA (0.75–4 Hz), σ (10–15 Hz), and θ (5–8 Hz) bands used for the mean values presented in the bar graphs in the insets (one-way ANOVA, P < 0.05 for σ; **P < 0.01, post hoc unpaired t-test). (E) Left, examples of σ band-pass-filtered EEG recordings containing NREM-to-REM sleep transitions (occurring at time zero). Right, time course of mean EEG power in the σ band at NREM-to-REM sleep transitions in WT (n = 8), CaV3.2KO (n = 8), and CaV3.DKO (n = 8) mice during light and dark phase. Data were normalized to the mean power from 0.5 to 1.5 min after the transition to REM sleep. Shaded areas represent SEM. The dashed line at zero indicates REM sleep onset. Bar graph represents peak values of % σ power before REM sleep onset (one-way ANOVA, P < 0.01; **P < 0.01, post hoc unpaired t-test).
Figure 6.

Comparison of wake EEG profile of wild-type, CaV3.2KO, and CaV3.DKO mice. (A) Cumulative distributions of wake episode durations during both light and dark phase. Statistical significance was tested with K-S statistics (P < 0.01 between all genotypes). Inset, histogram showing time spent in short, intermediate and long episodes per hour of wake (duration × genotype: F2.1, 22.5 = 11.6, P < 0.01; *P < 0.05, **P < 0.01, post hoc unpaired t-test). (B) Mean absolute power of relevant frequency bands separated for light and dark phase (SWA (0.75–4 Hz), θ (5–8 Hz); *P < 0.05, **P < 0.01, post hoc unpaired t-test after one-way ANOVA). (C) Normalized EEG spectral power between 0.75 and 25 Hz during waking (genotype × frequency interaction: F5.6, 59.5 = 3.48, P < 0.01). Inset, mean values of normalized EEG power in the frequency range 8–20 Hz for WT, CaV3.2KO, and CaV3.DKO (one-way ANOVA, P < 0.01; **P < 0.01, post hoc unpaired t-test).
Next, we examined EEG power spectra of NREM and REM sleep. Absolute values of NREM sleep EEG power did not significantly differ between genotypes, although CaV3.DKO mice appeared to show an increase in the low-frequency range (slow-wave activity, SWA, 0.75–4 Hz) during both light and dark phase (Figure 5C).
To examine the relative contribution of specific spectral frequencies to the global EEG profile, and to account for inter-individual variations in EEG signal amplitude, we compared percentage EEG power values obtained by normalizing each frequency bin to the total power for each behavioral state (Figure 5D). Whereas wild-type and CaV3.2KO mice had largely superimposable NREM sleep power spectra, significant differences were visible in CaV3.DKO mice (F2.7, 27.9 = 4.5, P < 0.05). In particular, a marked reduction occurred across the whole σ frequency range (10–15 Hz: 0.57% ± 0.03% in wild-type vs. 0.56% ± 0.03% in CaV3.2KO mice, and 0.41% ± 0.01% in CaV3.DKO mice; P < 0.01, post hoc unpaired t-test). A compromised spindle rhythmogenesis in CaV3.DKO mice was also found when EEG power dynamics were analyzed at transitions between NREM and REM sleep, which are spindle-rich periods.17,26 In the NREM sleep epochs preceding REM sleep, σ power typically exhibits a surge, which is accompanied by a decrease in δ power, indicative of reduced sleep depth. CaV3.2KO mice displayed a partially reduced σ power surge, which, in CaV3.DKO mice, was further diminished (570 ± 43% in wild-type vs. 438 ± 15% in CaV3.DKO mice and 328 ± 15% in CaV3.DKO mice; P < 0.01, Figure 5E) and also preceded by a lower level of basal σ power. In contrast to the changes in σ power, relative EEG power in the low-frequency range was globally unaltered (0.75–4 Hz: 3.0% ± 0.1% in wild-type vs. 3.0% ± 0.2% in CaV3.DKO mice and 3.2% ± 0.1% in CaV3. DKO mice; P > 0.05, post hoc unpaired t-test). Interestingly, however, in CaV3.DKO mice a significant increase was obtained when the higher range of δ frequencies was considered (2–4 Hz: 3.2 ± 0.1% in wild-type vs. 3.2 ± 0.1% in CaV3.2KO mice and 3.6 ± 0.1% in CaV3.DKO mice, P < 0.05 for CaV3. DKO mice compared to wild-type and CaV3.2KO; post hoc unpaired t-test).
The normalized EEG power spectrum of REM sleep was not significantly altered in CaV3.2KO and CaV3.DKO mice (F3.2, 33.4 = 1.8, P > 0.05; Figure 5D). A slight increase in the higher range of δ frequencies during REM sleep seemed to gradually appear with CaV3 single and double deletion (2–4 Hz: 1.70% ± 0.11% in wild-type vs. 1.86% ± 0.13% in CaV3.2KO mice and 1.93% ± 0.03% in CaV3.DKO mice; P > 0.05). A difference in SWA was visible for absolute values of REM sleep EEG power of CaV3.DKO mice (P < 0.01 compared to wild-type, for both phases; Figure 5C).
Absolute values of waking EEG power of CaV3.DKO mice exhibited a general increase across frequency bands during both light and dark phase compared to wild-type and CaV3.2KO mice (P < 0.01 for both phases; Figure 6B). The relative contribution of the distinct frequency bands to the normalized power spectra was different (F5.6, 59.5 = 3.48, P < 0.01), in particular at frequency ranges corresponding to the α (8–12 Hz) and the β (12–20 Hz) band that displayed, on average, a significant reduction (8–12 Hz and 12–20 Hz: 0.89% ± 0.05% and 0.29% ± 0.01% in wild-type vs. 0.94% ± 0.05% and 0.28% ± 0.01% in CaV3.2KO mice, and 0.70% ± 0.02% and 0.25% ± 0.01% in CaV3.DKO mice, P < 0.01 for CaV3.DKO mice compared to wild-type and CaV3.2KO, post hoc unpaired t-test; Figure 6C).
Altogether, analysis of sleep EEG power indicates distinct contributions of CaV3.2 and CaV3.3 channels to thalamocortical rhythmogenesis. CaV3.2 single deletion did not cause major alterations to the spectral profile of NREM sleep. However, some differences in σ power dynamics were observed at transitions between NREM and REM sleep, i.e., at periods of enhanced sleep spindle rhythmogenesis. CaV3.2 and CaV3.3 double deletion induced a marked decrease in the relative contribution of the σ frequency range that was also evident in the average NREM sleep power spectrum, consistent with a constitutive impairment in sleep spindle rhythmogenesis. Additionally, the EEG power in the δ frequency range was augmented. CaV3.DKO mice spent more time in NREM sleep, but the predominance of short NREM sleep episodes together with the increase in microarousals indicates a more fragmented sleep architecture.
DISCUSSION
This work contributes to clarify the roles of Ca2+ channels for thalamic oscillations and sleep rhythms. In line with previous results, our data provide further evidence for a dominant role of CaV3.3 subtype in sustaining nRt low-threshold bursting and in activating the intrathalamic loop that underlies spindle pacemaking. In addition, our findings point at a modulatory function of the CaV3.2 subtype for nRt excitability, which might be involved in dynamically changing the strength of thalamic oscillations, e.g., by boosting sleep spindle rhythmogenesis at NREM to REM transitions. Based on these observations, we propose that the co-expression of CaV3.2 and CaV3.3 subtypes in nRt underlies distinct aspects of this pacemaker structure in rhythmogenesis. In addition, the lack of low-threshold Ca2+ currents in CaV3.DKO mice excludes a functional contribution of the CaV3.1 subtype, although molecular analyses have also identified the presence of this isoform in nRt cells.36
Our study was largely based on a comparative analysis of single KOs for CaV3.2 channels and the DKO lacking both CaV3.2 and CaV3.3 channels (Figure 7). We found that removal of CaV3.2 channels alone did not cause major alterations to nRt discharge, consistent with previous reports indicating a major contribution of CaV3.3 channels.17,18 In particular, low-threshold oscillatory bursting typical for NREM sleep rhythms, such as sleep spindles, was largely preserved in CaV3.2KO mice, and the underlying T-currents were comparable with wild-type levels.
Figure 7.

Summary of cellular and sleep data from mice with genetic deletions of CaV3 genes. (A) Low-threshold Ca2+ currents (T-currents) elicited in nRt cells by somatic depolarization are strongly reduced by CaV3.3 single and CaV3.2xCaV3.3 double ablation (CaV3.DKO). Traces show representative T-currents in all genotypes generated by a +40 mV depolarizing step from −100 mV holding potential. Mean values for T-current density (+40 mV depolarization) and for Vhalf (estimated from the whole activation curve) are specified for each genotype. (B) The repetitive low-threshold bursting elicited in nRt cells at the offset of somatic current injections is preserved in CaV3.2KO mice, strongly impaired in CaV3.3KO mice, and completely abolished in CaV3. DKO mice. Traces are representative burst discharges in all genotypes, generated by a 400-ms-long hyperpolarization of −500 pA from −60 mV. Mean values for number of action potentials (APs) within the first burst and number of repetitive low-threshold Ca2+ spikes (LTS) are reported. (C) CaV3 channels differentially contribute to the inhibitory postsynaptic currents elicited in TC cells by burst discharge (bIPSCs) of nRt cells, which is evoked by electric stimulation of glutamatergic afferents. CaV3.2 deletion partially reduces multiphasic currents, which are abolished by additional CaV3.3 ablation. Average values of inhibitory charge transfer (generated by stimuli of 250–300 μA) are reported on top of representative bIPSCs. (D) Power spectra of NREM sleep are not altered in CaV3.2KO mice. CaV3.3 deletion causes a selective reduction in the σ frequency range (10–15 Hz), which becomes more pronounced in case of CaV3.2xCaV3.3 ablation. Additionally, CaV3.DKO mice exhibit a marked increase in EEG power in the δ frequency range (2–4 Hz). Normalized NREM sleep EEG power spectrum between 0.75 and 25 Hz are shown, with shaded boxes indicating relevant intervals of frequency: SWA (0.75–4 Hz) and σ (10–15 Hz) and average values on the top. Bottom, mean values of time spent in short (< 32 s), intermediate (32–252 s), and long (> 252 s) episodes of NREM sleep and number of microarousals per hour of NREM sleep, indicating that CaV3.3 deletion is sufficient to cause deficits in sleep consolidation. In each panel, the scheme on the left represents the recording configuration, and the blue traces on the right are wild-type data superimposed on the traces from the other genotypes for comparison. (*) CaV3.3KO data are reported from reference17. The NREM sleep power spectrum is presented here with normalized % values.
We have analyzed cell excitability by applying somatic voltage steps, which might amplify the activation of proximal CaV3 channels and underestimate the contribution of distal compartments, especially in the case of the elongated dendrites of nRt neurons.37 Are CaV3.2 channels preferentially located in distal dendritic branches? T-currents in nucleated patches from younger mice were shown to display higher Ni2+ sensitivity and faster inactivation kinetics than whole-cell T-currents, indicating that, at least during development, CaV3.2 channels are mainly located at proximal sites.28
We have further characterized the capability of CaV3 channels to generate nRt discharge when synaptically recruited. Upon stimulation of glutamatergic inputs onto nRt, bIPSCs could still be evoked in TC cells of CaV3.2KO mice, although with a reduced charge transfer, whereas this form of GABAergic transmission was impaired by CaV3.3 ablation.17 Synaptic recruitment of CaV3.3 channels is hence obligatory for bIPSC generation, whereas CaV3.2 channels additionally appear to boost synaptic transmission mediated through burst discharge. A modulatory function for CaV3.2 channels, as opposed to a constitutive function of the dominating CaV3.3 channels, would be consistent with the well-documented sensitivity of the CaV3.2 channel to redox agents and to intracellular kinases19 and might be important for use-dependent regulation of thalamocortical oscillations. An interesting open question is whether distinct CaV3 channel subunits are differentially recruited by cortical and thalamic glutamatergic inputs impinging onto nRt dendrites, thus modulating the feed-forward inhibition of TC cells in a subtype-specific manner.
Whereas CaV3.3-KO nRt cells showed a residual low-threshold Ca2+ spike carried by CaV3.2 channels,17 CaV3.DKO mice displayed a complete lack of dendritic T-currents and rebound oscillatory bursting. This resulted in the abolishment of bIPSCs in TC cells, predicting disturbances in thalamic rhythms.29 The striking effects on nRt excitability and intrathalamic synaptic transmission were indeed reflected by changes in the EEG sleep profile of CaV3.DKO mice. Corroborating our previous studies on the role of CaV3.3 channels in σ power, we found again a marked decrease in the σ power surge when both CaV3 channel subtypes are lacking. Additionally, CaV3.DKO mice also showed a reduced σ band in the normalized NREM sleep power spectrum. This suggests a more pronounced impairment in sleep spindle rhythmogenesis, as compared to CaV3.3KO mice, which is consistent with the full disappearance of bIPSCs in the DKOs. Comparison of cellular and sleep data from this study and from our previous report on CaV3.3KO mice17 reveals how the progressive impairment in nRt and intrathalamic excitability caused by CaV3.2 and CaV3.3 single and double ablation is accompanied by increasing deficits in NREM sleep power characteristics (Figure 7). Notably, CaV3.3KO mice and CaV3.DKO mice present a similar rearrangement of NREM sleep bouts and a higher incidence of microarousals, as compared to wild-type and CaV3.2KO animals, indicating that CaV3.3 deletion is largely sufficient to deregulate sleep consolidation. Surprisingly, CaV3.2KO mice appear to have more consolidated NREM sleep, with bouts of longer duration less frequently interrupted by microarousals. Notably, CaV3.2KO mice spent less time in NREM sleep during the dark phase, suggesting a compensatory upregulation of NREM sleep duration during the light phase. The reason for this difference during the active phase is likely to be independent of thalamocortical rhythmogenesis. CaV3.2 channels are highly expressed in the basal ganglia circuit, in limbic and in cortical areas.10 Constitutive deletion of this channel has been reported to generate phenotypes not directly related to thalamocortical rhythmogenesis, such as elevated anxiety and impaired memory.38–40 Interestingly, concomitant deletion of CaV3.3 channels appears to override the effect of single CaV3.2 channel deletion on NREM sleep bout distribution. This indicates that the lack of the major T channel subtype for nRt rhythmogenesis imposes a dominant effect of impaired thalamocortical rhythmogenesis on sleep architecture.
In CaV3.DKO mice, the EEG-related phenotype was not specific to the σ range, but extended to EEG power between 2–4 Hz, belonging to the δ band, which was augmented. As a result, the balance between intrathalamic networks, providing the basis for sleep spindles, and thalamocortical circuitry, implicated in SWA, was affected more severely in the CaV3.DKO mice. Indeed, it has been previously shown that σ and δ power are negatively correlated during NREM sleep,41–43 which was explained by a greater extent of membrane hyperpolarization of TC cells during δ rhythm generation in deep NREM sleep that precluded spindle rhythmicity. This current work now observes such a σ-δ power opposition through genetic means and suggests that the level of nRt excitability through CaV3 channels and the resulting bIPSC generation is a decisive factor for the σ/δ ratio apparent in the EEG.
Contrary to what would be expected from studies on pharmacological blockade of GABAAR-mediated transmission in thalamic nuclei, CaV3.DKO mice did not display aberrant hypersynchronous rhythms, such as the 3 Hz spike-and-wave discharge.29,44 The emergence of these pathological oscillations was explained by a disinhibition of thalamic nuclei.44,45 Such hyperoscillations did not take place in the CaV3.DKO mice because GABAergic transmission in intrathalamic circuitry was not fully abolished, and some level of inhibition through tonic nRt discharge remained. Nevertheless, the imbalance between glutamatergic and GABAergic input onto TC cells in CaV3. DKO mice could favor intrinsic rhythmicity of TC neurons in the δ range at the expense of 10 Hz-nRt-TC reverberations.
Despite the augmented contribution of δ waves, sleep was more fragmented in CaV3.DKO mice. These mice spent globally more time in NREM sleep than wild-type animals, but in episodes of shorter duration. The concomitant increase in waking bouts of short duration and the higher occurrence of microarousals support the conclusion that CaV3.DKO mice experienced a more fragmented sleep, which is consistent with the well-established link between spindles and sleep consolidation.32 These data also support the view that manipulation of spindles can alter sleep architecture independently of δ waves, as previously reported in mice with a genetic overexpression of small-conductance type 2 K+ channels, which improved sleep quality without altering SWA.46
Altogether, deletion of the additional source of low-threshold Ca2+ spike in nRt cells aggravated the sleep phenotype of CaV3.3KO mice, indicating a role of CaV3.2 channels in boosting nRt cell excitability and rhythmogenesis. Thus, the CaV3.DKO mice might represent a valuable model to study the involvement of nRt rhythmogenesis in pathophysiology, as already reported in the case of absence epilepsy.27 The clinical relevance of CaV3.DKO mice remains a subject of further studies. Intriguingly, the deficits in sleep spindles strongly hint at the presence of a schizophrenic endophenotype.47
DISCLOSURE STATEMENT
This was not an industry supported study. This work was supported by the Swiss National Science Foundation (Ambizione grant PZ00P3_136761 to S.A. and grant 31003A-146244 to A.L.) and Etat de Vaud. The authors have indicated no financial conflicts of interest.
ACKNOWLEDGMENTS
The authors are grateful to Kevin P. Campbell for the permission of using the CaV3.2 knock-out mouse line, and to Heinz Beck for providing animal breeders. We thank Laura M.J. Fernandez for help with data analysis and Thi Dung Hau Iuliano-Dao for mouse genotyping.
REFERENCES
- 1.Beenhakker MP, Huguenard JR. Neurons that fire together also conspire together: is normal sleep circuitry hijacked to generate epilepsy? Neuron. 2009;62:612–32. doi: 10.1016/j.neuron.2009.05.015. [DOI] [PMC free article] [PubMed] [Google Scholar]
- 2.Crunelli V, Cope DW, Hughes SW. Thalamic T-type Ca2+ channels and NREM sleep. Cell Calcium. 2006;40:175–90. doi: 10.1016/j.ceca.2006.04.022. [DOI] [PMC free article] [PubMed] [Google Scholar]
- 3.Cueni L, Canepari M, Adelman JP, Lüthi A. Ca2+ signaling by T-type Ca2+ channels in neurons. Pflügers Arch. 2009;457:1161–72. doi: 10.1007/s00424-008-0582-6. [DOI] [PubMed] [Google Scholar]
- 4.Ly R, Bouvier G, Schonewille M, et al. T-type channel blockade impairs long-term potentiation at the parallel fiber-Purkinje cell synapse and cerebellar learning. Proc Natl Acad Sci U S A. 2013;110:20302–7. doi: 10.1073/pnas.1311686110. [DOI] [PMC free article] [PubMed] [Google Scholar]
- 5.Otsu Y, Marcaggi P, Feltz A, et al. Activity-dependent gating of calcium spikes by A-type K+ channels controls climbing fiber signaling in Purkinje cell dendrites. Neuron. 2014;84:137–51. doi: 10.1016/j.neuron.2014.08.035. [DOI] [PMC free article] [PubMed] [Google Scholar]
- 6.Egger V, Svoboda K, Mainen ZF. Dendrodendritic synaptic signals in olfactory bulb granule cells: local spine boost and global low-threshold spike. J Neurosci. 2005;25:3521–30. doi: 10.1523/JNEUROSCI.4746-04.2005. [DOI] [PMC free article] [PubMed] [Google Scholar]
- 7.Becker AJ, Pitsch J, Sochivko D, et al. Transcriptional upregulation of CaV3.2 mediates epileptogenesis in the pilocarpine model of epilepsy. J Neurosci. 2008;28:13341–53. doi: 10.1523/JNEUROSCI.1421-08.2008. [DOI] [PMC free article] [PubMed] [Google Scholar]
- 8.Shin HS, Cheong EJ, Choi S, Lee J, Na HS. T-type Ca2+ channels as therapeutic targets in the nervous system. Curr Opin Pharmacol. 2008;8:33–41. doi: 10.1016/j.coph.2007.12.003. [DOI] [PubMed] [Google Scholar]
- 9.Perez-Reyes E. Molecular physiology of low-voltage-activated T-type calcium channels. Physiol Rev. 2003;83:117–61. doi: 10.1152/physrev.00018.2002. [DOI] [PubMed] [Google Scholar]
- 10.Talley EM, Cribbs LL, Lee JH, Daud A, Perez-Reyes E, Bayliss DA. Differential distribution of three members of a gene family encoding low voltage-activated (T-type) calcium channels. J Neurosci. 1999;19:1895–911. doi: 10.1523/JNEUROSCI.19-06-01895.1999. [DOI] [PMC free article] [PubMed] [Google Scholar]
- 11.Liu XB, Murray KD, Jones EG. Low-threshold calcium channel subunit CaV3.3 is specifically localized in GABAergic neurons of rodent thalamus and cerebral cortex. J Comp Neurol. 2011;519:1181–95. doi: 10.1002/cne.22567. [DOI] [PubMed] [Google Scholar]
- 12.Fuentealba P, Steriade M. The reticular nucleus revisited: intrinsic and network properties of a thalamic pacemaker. Prog Neurobiol. 2005;75:125–41. doi: 10.1016/j.pneurobio.2005.01.002. [DOI] [PubMed] [Google Scholar]
- 13.Anderson MP, Mochizuki T, Xie J, et al. Thalamic CaV3.1 T-type Ca2+ channel plays a crucial role in stabilizing sleep. Proc Natl Acad Sci U S A. 2005;102:1743–8. doi: 10.1073/pnas.0409644102. [DOI] [PMC free article] [PubMed] [Google Scholar]
- 14.Lee J, Kim D, Shin HS. Lack of delta waves and sleep disturbances during non-rapid eye movement sleep in mice lacking α1G-subunit of T-type calcium channels. Proc Natl Acad Sci U S A. 2004;101:18195–9. doi: 10.1073/pnas.0408089101. [DOI] [PMC free article] [PubMed] [Google Scholar]
- 15.Dossi RC, Nuñez A, Steriade M. Electrophysiology of a slow (0.5-4 Hz) intrinsic oscillation of cat thalamocortical neurones in vivo. J Physiol. 1992;447:215–34. doi: 10.1113/jphysiol.1992.sp018999. [DOI] [PMC free article] [PubMed] [Google Scholar]
- 16.Leresche N, Jassik-Gerschenfeld D, Haby M, Soltesz I, Crunelli V. Pacemaker-like and other types of spontaneous membrane potential oscillations of thalamocortical cells. Neurosci Lett. 1990;113:72–7. doi: 10.1016/0304-3940(90)90497-w. [DOI] [PubMed] [Google Scholar]
- 17.Astori S, Wimmer RD, Prosser HM, et al. The CaV3.3 calcium channel is the major sleep spindle pacemaker in thalamus. Proc Natl Acad Sci U S A. 2011;108:13823–8. doi: 10.1073/pnas.1105115108. [DOI] [PMC free article] [PubMed] [Google Scholar]
- 18.Joksovic PM, Nelson MT, Jevtovic-Todorovic V, et al. CaV3.2 is the major molecular substrate for redox regulation of T-type Ca2+ channels in the rat and mouse thalamus. J Physiol. 2006;574:415–30. doi: 10.1113/jphysiol.2006.110395. [DOI] [PMC free article] [PubMed] [Google Scholar]
- 19.Iftinca MC, Zamponi GW. Regulation of neuronal T-type calcium channels. Trends Pharmacol Sci. 2009;30:32–40. doi: 10.1016/j.tips.2008.10.004. [DOI] [PubMed] [Google Scholar]
- 20.Bourinet E, Alloui A, Monteil A, et al. Silencing of the CaV3.2 T-type calcium channel gene in sensory neurons demonstrates its major role in nociception. EMBO J. 2005;24:315–24. doi: 10.1038/sj.emboj.7600515. [DOI] [PMC free article] [PubMed] [Google Scholar]
- 21.Liao YF, Tsai ML, Chen CC, Yen CT. Involvement of the CaV3.2 T-type calcium channel in thalamic neuron discharge patterns. Mol Pain. 2011;7:43. doi: 10.1186/1744-8069-7-43. [DOI] [PMC free article] [PubMed] [Google Scholar]
- 22.Sekiguchi F, Kawabata A. T-type calcium channels: functional regulation and implication in pain signaling. J Pharmacol Sci. 2013;122:244–50. doi: 10.1254/jphs.13r05cp. [DOI] [PubMed] [Google Scholar]
- 23.Chen CC, Lamping KG, Nuno DW, et al. Abnormal coronary function in mice deficient in α1H T-type Ca2+ channels. Science. 2003;302:1416–8. doi: 10.1126/science.1089268. [DOI] [PubMed] [Google Scholar]
- 24.Cueni L, Canepari M, Lujàn R, et al. T-type Ca2+ channels, SK2 channels and SERCAs gate sleep-related oscillations in thalamic dendrites. Nat Neurosci. 2008;11:683–92. doi: 10.1038/nn.2124. [DOI] [PubMed] [Google Scholar]
- 25.Astori S, Lüthi A. Synaptic Plasticity at Intrathalamic Connections via CaV3.3 T-type Ca2+ channels and GluN2B-containing NMDA receptors. J Neurosci. 2013;33:430–4. doi: 10.1523/JNEUROSCI.3185-12.2013. [DOI] [PMC free article] [PubMed] [Google Scholar]
- 26.Franken P, Malafosse A, Tafti M. Genetic variation in EEG activity during sleep in inbred mice. Am J Physiol. 1998;275:R1127–37. doi: 10.1152/ajpregu.1998.275.4.R1127. [DOI] [PubMed] [Google Scholar]
- 27.Lee SE, Lee J, Latchoumane C, et al. Rebound burst firing in the reticular thalamus is not essential for pharmacological absence seizures in mice. Proc Natl Acad Sci U S A. 2014;111:11828–33. doi: 10.1073/pnas.1408609111. [DOI] [PMC free article] [PubMed] [Google Scholar]
- 28.Joksovic PM, Bayliss DA, Todorovic SM. Different kinetic properties of two T-type Ca2+ currents of rat reticular thalamic neurones and their modulation by enflurane. J Physiol. 2005;566:125–42. doi: 10.1113/jphysiol.2005.086579. [DOI] [PMC free article] [PubMed] [Google Scholar]
- 29.Rovó Z, Mátyás F, Barthó P, et al. Phasic, nonsynaptic GABA-A receptor-mediated inhibition entrains thalamocortical oscillations. J Neurosci. 2014;34:7137–47. doi: 10.1523/JNEUROSCI.4386-13.2014. [DOI] [PMC free article] [PubMed] [Google Scholar]
- 30.Herd MB, Brown AR, Lambert JJ, Belelli D. Extrasynaptic GABAA receptors couple presynaptic activity to postsynaptic inhibition in the somatosensory thalamus. J Neurosci. 2013;33:14850–68. doi: 10.1523/JNEUROSCI.1174-13.2013. [DOI] [PMC free article] [PubMed] [Google Scholar]
- 31.Sun YG, Wu CS, Renger JJ, Uebele VN, Lu HC, Beierlein M. GABAergic synaptic transmission triggers action potentials in thalamic reticular nucleus neurons. J Neurosci. 2012;32:7782–90. doi: 10.1523/JNEUROSCI.0839-12.2012. [DOI] [PMC free article] [PubMed] [Google Scholar]
- 32.Astori S, Wimmer RD, Lüthi A. Manipulating sleep spindles-expanding views on sleep, memory, and disease. Trends Neurosci. 2013;36:738–48. doi: 10.1016/j.tins.2013.10.001. [DOI] [PubMed] [Google Scholar]
- 33.Lüthi A. Sleep spindles: where they come from, what they do. Neuroscientist. 2013;20:243–56. doi: 10.1177/1073858413500854. [DOI] [PubMed] [Google Scholar]
- 34.McCormick DA, Bal T. Sleep and arousal: thalamocortical mechanisms. Annu Rev Neurosci. 1997;20:185–215. doi: 10.1146/annurev.neuro.20.1.185. [DOI] [PubMed] [Google Scholar]
- 35.Steriade M. Grouping of brain rhythms in corticothalamic systems. Neuroscience. 2006;137:1087–106. doi: 10.1016/j.neuroscience.2005.10.029. [DOI] [PubMed] [Google Scholar]
- 36.McKay BE, McRory JE, Molineux ML, et al. CaV3 T-type calcium channel isoforms differentially distribute to somatic and dendritic compartments in rat central neurons. Eur J Neurosci. 2006;24:2581–94. doi: 10.1111/j.1460-9568.2006.05136.x. [DOI] [PubMed] [Google Scholar]
- 37.Warren RA, Jones EG. Maturation of neuronal form and function in a mouse thalamo-cortical circuit. J Neurosci. 1997;17:277–95. doi: 10.1523/JNEUROSCI.17-01-00277.1997. [DOI] [PMC free article] [PubMed] [Google Scholar]
- 38.Chen CC, Shen JW, Chung NC, Min MY, Cheng SJ, Liu IY. Retrieval of context-associated memory is dependent on the CaV3.2 T-type calcium channel. PLoS One. 2012;7:e29384. doi: 10.1371/journal.pone.0029384. [DOI] [PMC free article] [PubMed] [Google Scholar]
- 39.Chung NC, Huang YH, Chang CH, et al. Behavior training reverses asymmetry in hippocampal transcriptome of the CaV3.2 knockout mice. PLoS One. 2015;10:e0118832. doi: 10.1371/journal.pone.0118832. [DOI] [PMC free article] [PubMed] [Google Scholar]
- 40.Gangarossa G, Laffray S, Bourinet E, Valjent E. T-type calcium channel CaV3.2 deficient mice show elevated anxiety, impaired memory and reduced sensitivity to psychostimulants. Front Behav Neurosci. 2014;8:92. doi: 10.3389/fnbeh.2014.00092. [DOI] [PMC free article] [PubMed] [Google Scholar]
- 41.Nuñez A, Curro Dossi R, Contreras D, Steriade M. Intracellular evidence for incompatibility between spindle and delta oscillations in thalamocortical neurons of cat. Neuroscience. 1992;48:75–85. doi: 10.1016/0306-4522(92)90339-4. [DOI] [PubMed] [Google Scholar]
- 42.Uchida S, Maloney T, March JD, Azari R, Feinberg I. Sigma (12-15 Hz) and delta (0.3-3 Hz) EEG oscillate reciprocally within NREM sleep. Brain Res Bull. 1991;27:93–6. doi: 10.1016/0361-9230(91)90286-s. [DOI] [PubMed] [Google Scholar]
- 43.Vyazovskiy VV, Achermann P, Borbély AA, Tobler I. The dynamics of spindles and EEG slow-wave activity in NREM sleep in mice. Arch Ital Biol. 2004;142:511–23. [PubMed] [Google Scholar]
- 44.Castro-Alamancos MA. Neocortical synchronized oscillations induced by thalamic disinhibition in vivo. J Neurosci. 1999;19:RC27. doi: 10.1523/JNEUROSCI.19-18-j0005.1999. [DOI] [PMC free article] [PubMed] [Google Scholar]
- 45.Paz JT, Bryant AS, Peng K, et al. A new mode of corticothalamic transmission revealed in the Gria4-/- model of absence epilepsy. Nat Neurosci. 2011;14:1167–73. doi: 10.1038/nn.2896. [DOI] [PMC free article] [PubMed] [Google Scholar]
- 46.Wimmer RD, Astori S, Bond CT, et al. Sustaining sleep spindles through enhanced SK2-channel activity consolidates sleep and elevates arousal threshold. J Neurosci. 2012;32:13917–28. doi: 10.1523/JNEUROSCI.2313-12.2012. [DOI] [PMC free article] [PubMed] [Google Scholar]
- 47.Ferrarelli F, Tononi G. The thalamic reticular nucleus and schizophrenia. Schizophr Bull. 2011;37:306–15. doi: 10.1093/schbul/sbq142. [DOI] [PMC free article] [PubMed] [Google Scholar]