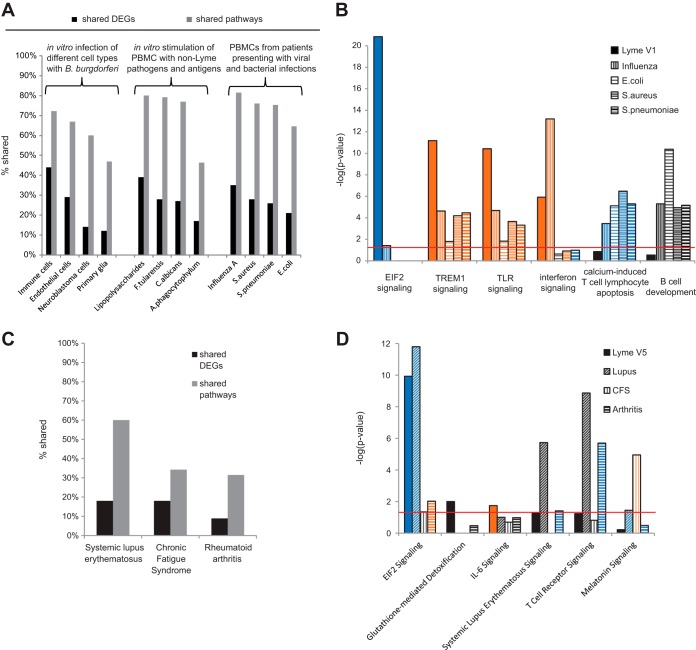
FIG 4 .
Comparison of the Lyme disease transcriptome with transcriptomes corresponding to other clinical illnesses or cell models. (A) Bar chart of the percentages of overlapping DEGs and canonical pathways between acute Lyme disease at V1 and other infectious diseases or in vitro cell culture models of infection. (B) Bar chart of the negative log of the P value of the enrichment score corresponding to selected pathways predicted to be involved in acute Lyme disease at V1 compared to other bacterial and viral infections. (C) Bar chart of the percentage of overlapping DEGs and canonical pathways between Lyme disease patients at V5 and three chronic and/or autoimmune syndromes (SLE, CFS, and RA). (D) Bar chart of the negative log of the P value of the enrichment score from selected pathways predicted to be involved in Lyme disease 6 months post-treatment (V5) compared to those from other chronic and/or autoimmune syndromes. The color scheme depicted is based on Z scores, with activation in orange, inhibition in blue, and undetermined directionality in gray. The red line represents a P value significance threshold of 0.05.

