

Abstract
Background
The purpose of this study is to investigate whether changes could be detected in dynamic contrast-enhanced (DCE) and intra-voxel incoherent motion (IVIM) MR parameters upon MR-guided high-intensity focused ultrasound (MR-HIFU)-induced hyperthermia in a rabbit Vx2 tumor model.
Methods
Five Vx2 tumor-bearing New Zealand white rabbits were treated with hyperthermia using a clinical MR-HIFU system. Data were acquired before and after hyperthermia. For the DCE analysis, the extended Tofts model was used. For the IVIM analysis, a Bayesian approach was used. Maps were reconstructed of the DCE parameters (Ktrans, kep, and vp) and IVIM parameters (Dt, fp, and Dp). Individual parameter histograms and two-dimensional cross-correlation histograms were constructed to analyze changes in the parameters after hyperthermia. Changes in median values were tested for statistical significance with the Mann-Whitney U test.
Results
The MR temperature measurements confirmed that mild hyperthermia (40 to 42 °C) was successfully achieved in all rabbits. One rabbit died during treatment and was excluded from the analysis. In the remaining four rabbits, an increase in Dt was observed. In three rabbits, an increase in Ktrans was observed, while in the other rabbits, all three DCE parameter values decreased. Mixed changes were seen for vp and fp.
Conclusions
Changes in DCE and IVIM parameters were detected after hyperthermia and were variable between the rabbits. DCE- and IVIM-MRI may be promising tools to assess tumor responses to hyperthermia. Further research in a larger number of subjects is necessary in order to assess their value for treatment response monitoring.
Keywords: Dynamic contrast-enhanced MRI, Intra-voxel incoherent motion MRI, Hyperthermia, MR-HIFU
Background
While MR-guided high-intensity focused ultrasound (MR-HIFU) has been used for ablative treatments, the technology also shows promise for the induction of local mild hyperthermia. One of the physiological effects is the improvement of tumor oxygenation, which has been reported to increase the effectiveness of radiotherapy [1, 2]. Other physiological effects are changes in blood flow and vascular permeability, which could enhance local drug delivery of chemotherapeutic agents [3, 4]. Information about tumor physiology is valuable since it is an important determinant of treatment outcomes [5, 6]. Physiological responses of tumors to hyperthermia have been extensively investigated in rodent models using invasive measurement methods [7–13]. Tumors are more sensitive to heating and stasis of the blood flow occurs at lower hyperthermic temperatures as compared with normal tissue [7, 8]. Changes in regional blood flow and permeability after hyperthermia were reported to show both inter- and intra-tumoral variations [7, 13]. The underlying mechanisms are complex and depend on several factors, e.g., the chemical microenvironment and tumor architecture [7], which make it difficult to predict tumor responses to hyperthermia. Noninvasive methods to map physiological changes would therefore be useful for investigating tumor responses to hyperthermia [14, 15].
Dynamic contrast-enhanced (DCE) magnetic resonance imaging (MRI) is a method widely used to map quantitative perfusion and permeability parameters [16, 17]. Dynamic T1-maps are acquired before, during, and after the injection of a paramagnetic contrast agent bolus. Contrast concentration-time curves are derived from the dynamic T1 maps, and perfusion parameters can be extracted by fitting a physiological model, such as the Tofts model [18, 19]. Many studies have reported on the potential of DCE-MRI as a prediction tool for treatment response of tumors to radiotherapy [20, 21], neo-adjuvant chemotherapy [22–24], and neo-adjuvant chemoradiation [25–27].
Intra-voxel incoherent motion (IVIM) MRI is a method that allows measurements of perfusion-related parameters from diffusion-weighted MR data. The non-Brownian motion of blood flowing through pseudo randomly organized capillary networks is considered as incoherent motion. This generates a “pseudo diffusion” effect and contributes to the diffusion-weighted MR signal. By using a bi-exponential description of the MR signal, parameters related to the vascularity can be extracted [28]. Although these parameters should be interpreted carefully [29, 30], the vascular contribution to measured IVIM parameters has recently been verified in healthy volunteers [31]. Recent studies showed promising results using IVIM for the characterization of various diseases of different organs, for example, cirrhotic liver [32], pancreatic carcinoma [33], locally advanced breast cancer [34], salivary gland tumors [35], brain pathologies [36], and renal tumors [37].
In this study, we investigated the potential of DCE- and IVIM-MRI to detect changes induced by hyperthermia in rabbits with Vx2 tumors, using the extended Tofts DCE-MRI model and a Bayesian approach for IVIM analysis. To this end, a clinical MR-HIFU system was used, which allows of noninvasive local hyperthermia in small animals [38–42].
Methods
Animal handling and Vx2 tumors
All experiments were approved by the University Animal Experiments Committee and were performed in agreement with The Netherlands Experiments on Animals Act (1977) and the European Convention guidelines (86/609/EC). Five female New Zealand white rabbits (2.5–3.5 kg, Charles River, France) were housed in pairs and were provided with food and ad libitum water. Vx2 tumor pieces were retrieved from donor rabbits and implanted intramuscularly in the left hind limb. The tumors grew to a volume of 10 cm3 in about 3 weeks, after which the imaging experiment was performed.
The rabbits were initially anesthetized with a subcutaneous injection of dexmedetomidine (0.125 mg/kg, Dexdomitor, Jansen Pharmaceutica N.V., Beerse, The Netherlands) and ketamine (15 mg/kg, Narketan 10, Vétoquinol S.A., Lure Cedex, France). The tumor-bearing hind limb was shaved, depilated, and covered with ultrasound gel for acoustic coupling. To prevent undesired leg movement during HIFU exposure, a sciatic nerve block was performed (bupivacaine 2 mg/kg). Then, a fluoroptic temperature probe (Luxtron, Santa Clara, CA) was placed in the muscle tissue adjacent to the tumor to allow measurements of the baseline temperature as is used for the relative MR thermometry.
A catheter (Abbocath®-T I.V. Catheter 22 g × 1.25”, Hospira Inc., Lake Forest, IL) was placed in the marginal ear vein and was connected to a Luer-lock 3-way valve, providing two inputs. One input was used for the intravenous maintenance anesthesia (one third of the initial dose per hour), which was provided using a pressure pump system up to 5 h after the initiation of anesthesia. The other input was available for intravenous injection of the MR contrast agent gadobutrol (GadoVist, 0.1 mmol/kg, Gadovist, Bayer Pharma). After the experiment, the rabbits were terminated with an overdose of sodium pentobarbital injected intravenously.
Experimental setup
A clinical MR-HIFU therapy system was used (Sonalleve V2, Philips Healthcare, Vantaa, Finland) integrated into a clinical 1.5T MRI scanner (Achieva, Philips Healthcare, Best, The Netherlands). An in-house developed animal holder as previously described by Wijlemans et al. [43] was used, which consisted of an open polymethylmethacrylate tank with an acoustic window in the bottom. A schematic overview of the setup is shown in Fig. 1a. The tank was filled with heated water up to the tumor-bearing leg, to enable acoustic coupling and to achieve a baseline temperature similar to human body temperature (37 °C). A heating blanket was placed on top of the rabbit to keep the baseline temperature stable.
Fig. 1.
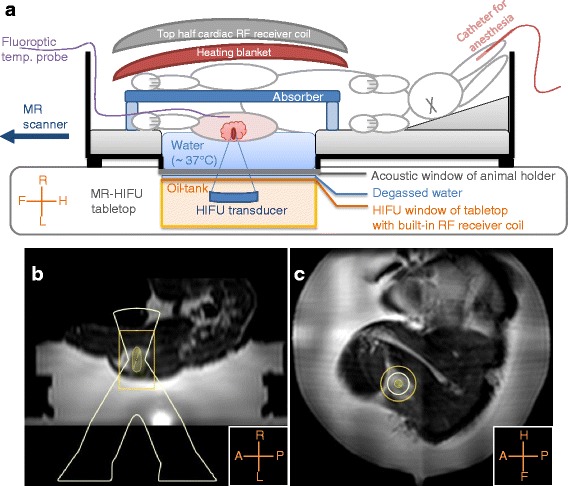
Experimental setup. A schematic overview of the experimental setup is shown in (a). The animal holder was placed with its acoustic window above the HIFU window; degassed water was used for acoustic coupling. The shaved tumor-bearing leg was positioned above the acoustic window, and a fluoroptic temperature probe was inserted in the tumor-bearing leg, in the far-field of the HIFU beam. The tank was filled with warm water (~37 °C) up to the tumor-bearing leg, and an absorber was placed between the legs. On top of the rabbit, a heating blanket and a flat 16-channel array coil was placed. In (b, c), examples of the treatment planning are shown on reconstructed sagittal and coronal images of the T2-weighted 3D turbo spin-echo acquisition
MR imaging
A four-channel RF receiver coil integrated into the MR-HIFU tabletop was used, together with a flat 16-channel array coil, which was placed on top of the heating blanket (Fig. 1a).
To plan the position of the HIFU focus, an anatomical T2-weighted 3D turbo spin-echo (TSE) sequence was used with the following scan parameter settings: echo time (TE) = 254 ms, repetition time (TR) = 1000 ms, flip angle (FA) = 90°, TSE factor = 21, acquisition bandwidth (BW) = 245.5 Hz, voxel size = 2 × 2 × 2 mm3, field of view (FOV) = 250 × 250 × 126 mm3, number of signal averages (NSA) = 2. Figure 1b, c shows examples of treatment planning on reconstructed sagittal and coronal images.
The MR thermometry scan used was a multi-slice gradient-echo planar imaging (EPI) pulse sequence with binomial water-selective RF excitation. One stack of three coronal slices and one sagittal slice were acquired, of which the centers were aligned with the HIFU focus. A saturation slab was used to suppress signal from the water tank. The scan parameter settings were as follows: TE = 20 ms, TR = 44 ms, FA = 20°, BW = 39.5 Hz, pixel size = 2.5 × 2.5 mm2, slice thickness = 7 mm, FOV = 250 × 250 mm2, NSA = 2, EPI factor = 11, and dynamic scan duration = 3.9 s. Temperatures changes were calculated on the fly using the proton resonance frequency shift method [44, 45] and added to the baseline temperature measured with the fluoroptic probe in order to reconstruct temperature images.
The baseline T1 map, required for DCE-MRI analyses, was obtained from variable flip angle (VFA) images acquired prior to contrast agent injection. The DCE-MR images and VFA images were acquired before and after hyperthermia and were orientated parallel to the tumor-bearing leg. The VFA images were acquired with a 3D spoiled gradient-echo: TE = 1.4 ms, TR = 5 ms, FA = 5°, 10°, and 15°, BW = 192 Hz, voxel size = 1.2 × 1.5 × 2 mm3, FOV = 300 × 150 × 40 mm2, and NSA = 2. For the DCE-MR images, the same scan sequence was used with dynamic keyhole settings [46], using the last scan for the high spatial frequency data, keyhole percentage = 25 %, keyhole measurements = 2, dynamic reference scan duration = 13.1 s, dynamic keyhole scan duration = 3.3 s, total scan duration = 5 min, 47 s, and FA = 15°. MR contrast agent was injected between 15 and 20 s after starting the dynamic DCE scan. The DCE-MRI scan was acquired on average 10 min (range 6.5 to 17.5 min) after the end of hyperthermia.
For IVIM-MRI, multi-slice diffusion-weighted single-shot spin-echo EPI images were acquired before and after hyperthermia. The orientation of the slices was parallel to the tumor-bearing leg and 10 b values were used. The scan parameter settings were as follows: TE = 67 ms, TR = 2500 ms, FA = 90°, BW = 15.7 Hz, pixel size = 2 × 2 mm2, slice thickness = 3 mm, FOV = 140 × 179 mm2, number of slices = 12, NSA = 6, and b = 800, 600, 400, 200, 150, 100, 75, 50, 25, 0 s/mm2. A frequency-selective adiabatic inversion pulse was used for fat suppression, with a delay time of 90 ms. The IVIM-MRI scan was acquired on average 35 min (range 26 to 43 min) after the end of hyperthermia.
MR-HIFU-induced mild hyperthermia
Mild hyperthermia (40 to 42 °C) was induced locally in all five rabbits using the clinical MR-HIFU therapy system described earlier. Sonications were performed with 60 W acoustic power at an operating frequency of 1.2 MHz, and the acoustical energy was delivered along concentric circular sub-trajectories of 4 and 8 mm diameter by electronically steering the focus, the so-called HIFU cell [47]. Mild hyperthermia was achieved by the binary feedback-loop described by Partanen et al. [48], which uses the temperature measurements provided by the MR thermometry. After initial heating to mild hyperthermic temperatures, hyperthermia was maintained by re-sonicating the sub-trajectories using a binary feedback-loop. In this study, the binary feedback-loop was slightly adapted: re-sonication was done with 80 % of the initial acoustical power instead of 50 %.
The hyperthermia protocol consisted of three hyperthermia blocks of 10 min, separated by periods of cooling. Each subsequent hyperthermia sonication started when the temperature, measured by the fluoroptic temperature probe, had decreased to the baseline temperature measured prior to heating. A hyperthermia block was considered unsuccessful and was redone after cooling down when the duration of the hyperthermia block was less than half of the intended duration, for example, due to automatic abortion by the system upon detection of large motion.
The measured hyperthermic temperatures by MR thermometry were expressed by the measures T10, T50, and T90. T50 indicates the median temperature or the temperature that was exceeded by 50 % of the target region. Similarly, T10 and T90 indicate that the temperature was exceeded by 10 and 90 % of the target region, respectively. These values were calculated over manually selected circular regions of interest (ROI) with a diameter of 10 mm at the heated area in each slice, slightly larger than the HIFU cell size. Temporal mean values were calculated for the entire hyperthermia duration, i.e., the time period between the start and end of the hyperthermia maintenance phase of the feedback algorithm of each block, for the sagittal slice and the central coronal slice.
Tumor VOIs
For all datasets, a 3D tumor volume of interest (VOI) was selected by manual delineation of the tumor region in each slice. This tumor VOI represents the volume targeted for hyperthermia. The tumor VOIs were used for the comparison of the parameters before and after hyperthermia. In the DCE datasets, the delineation was performed after the bolus passage at the 20th dynamic; in the IVIM datasets, the delineation was performed at b = 0 s/mm2.
DCE data analysis
The DCE-MRI analysis was performed in Matlab (2013b, Mathworks, Natick, MA). First, dynamic 3D concentration maps were reconstructed from the DCE data, using the T1 baseline maps obtained from the VFA data [49]. Second, arterial input functions (AIFs) were measured in the feeding artery of rabbit 5 in both the pre- and post-hyperthermia data. These representative concentration-time curves were parameterized using a gamma variate function [50]. The blood plasma volume fraction vp has been reported to be a crucial parameter for the assessment of tumor physiological response to hyperthermia and thus should be included in the analysis [14, 15]. Therefore, the extended Tofts DCE model [18, 51] was used:
| 1 |
where Ktrans is the volume transfer constant between blood plasma and the extracellular extravascular space (EES), kep is the rate constant between the EES and the blood plasma, and Cp(τ) is the concentration-time curve in the arterial blood plasma or the AIF. Equation 1 was fitted voxel-wise to the dynamic concentration maps using an iterative nonlinear least squares fit procedure, where the parameterized pre- and post-hyperthermia AIFs were used for the analysis of the pre- and post-hyperthermia data, respectively. Maps were reconstructed of Ktrans, kep, and vp.
IVIM data analysis
The IVIM-MRI analysis was performed using the data driven Bayesian modeling method described by Orton et al. [52], which has no user-defined parameters and is therefore robust and reproducible [52]. The method was implemented in Mathematica (7.0, Wolfram Research Inc., Champaign, IL), and the following bi-exponential model was used:
| 2 |
where Dt is the true diffusion, fp is the perfusion fraction, and Dp is the pseudo diffusion, induced by the vascular components. The Bayesian modeling method makes Gaussian approximations of the IVIM parameter histograms, resulting from least squares fitting of Eq. 2. These approximations are used as prior distributions to push outlier estimates with high uncertainty towards the center of the histogram [52]. To fill the prior distribution appropriately, the muscle surrounding the tumor was included and any water from the tank was excluded. Maps were reconstructed of Dt, fp, and Dp.
Detection of changes after hyperthermia
While the mean of a VOI is an often used metric for the comparison of parameter values, histograms are less arbitrary and capture heterogeneity [6, 14, 37, 53]. Histograms were made for each DCE and IVIM parameter, with ranges of 0 to 5 for Ktrans [min− 1] and kep [min− 1], 0 to 1 for vp [fraction] and fp[fraction], 0 to 3 for Dt [10− 3mm2/s], and 0 to 30 for Dp[10− 3mm2/s]. All data were distributed in 100 bins, and the bin heights were expressed in percentage of the tumor VOI volume.
For quantitative comparison, we determined the median values of all values inside the mentioned ranges (excluding the outliers). The parameter distributions were expected to be non-normal owing to tumor heterogeneity, and the pre- and post-hyperthermia data were unpaired since the tumor VOIs were delineated individually. Therefore, the Mann-Whitney U test was used, which was also performed in a region of interest in the surrounding muscle to test the significance of the changes in the median values. The region in the surrounding muscle used for the analyses was selected in the central slice through the tumor. The muscle region size was 10 × 10 voxels for DCE and 5 × 5 voxels for IVIM. The selected muscle region was smaller for IVIM than for DCE, because of the lower resolution and the limited availability of surrounding muscle tissue for which the IVIM parameters were extracted. Statistical tests were performed in Matlab (2013b, Mathworks, Natick, MA), and a p value of less than 0.001 was considered indicative of a statistically significant difference.
Two-dimensional cross-correlation histograms provide insight in the inter-relationships between parameters [34] and were made for the following combinations: vp × Ktrans, kep × Ktrans, vp × kep, fp × Dt, Dp × Dt, and fp × Dp. The same number of bins and ranges were used as for the individual parameter histograms, and the intensities were expressed in percentage of the tumor VOI volume.
To ensure that observed changes in parameter values were induced by hyperthermia, data reproducibility was tested. The IVIM scan of rabbit 1 after hyperthermia was repeated, and the results were compared. Since the DCE scans require the use of a contrast agent, a similar reproducibility test was deemed not feasible for DCE-MRI.
Results
The T2w MR images acquired during the planning phase showed that all rabbits had one tumor except for rabbit 4, which had three small contiguous tumors. Rabbit 2 had a large necrotic core in the tumor and died during the last few minutes of the hyperthermia treatment.
Tumor VOIs
In the MR images, it could be observed that all rabbits had one tumor except for rabbit 4, which had three small contiguous tumors. In rabbit 2, a large necrotic core was observed. Table 1 shows the volumes of the tumor VOIs, for which the DCE and IVIM analyses were performed. The discrepancy between the volumes delineated in the DCE and in the IVIM data can be attributed to the differences in the MR images (voxel size, contrast, geometrical distortions by EPI). Note that the volumes before and after hyperthermia were comparable.
Table 1.
Tumor VOI volume (cm3)
| Rabbit number | DCE | IVIM | ||
|---|---|---|---|---|
| Pre | Post | Pre | Post | |
| HT | HT | HT | HT | |
| 1 | 13 | 13 | 19 | 19 |
| 2 | 13 | 13 | 20 | 20 |
| 3 | 12 | 12 | 17 | 18 |
| 4 | 7 | 7 | 13 | 13 |
| 5 | 10 | 11 | 17 | 19 |
HT hyperthermia
MR-HIFU-induced mild hyperthermia
Three 10-min blocks of mild hyperthermia (40 to 42 °C) were successfully achieved in all five rabbits using MR-HIFU. In rabbit 2, one mild hyperthermia block was manually aborted because of observed motion artifacts in the MR thermometry; in rabbit 4, one mild hyperthermia block was automatically aborted because of connection loss between the MR console and the HIFU console. More details on the mild hyperthermia durations are given in Table 2. Figure 2a, b shows examples of magnitude and temperature images of the MR thermometry sequence; examples of the temporal profiles of T10, T50, and T90 of the corresponding ROIs (circles) are shown in Fig. 2c. The mean values of T10, T50, and T90 over the entire hyperthermia duration are shown in Table 3 and plotted in Fig. 2d for each rabbit. All T50 values were within the desired hyperthermic temperature range of 40 to 42 °C. In the coronal slice of rabbit 3, the mean T10 was higher than 42 °C and the mean T50 was higher than the other rabbits.
Table 2.
Details on MR-HIFU mild hyperthermia of rabbit Vx2 tumors
| Block | Rabbit 1 | Rabbit 2 | Rabbit 3 | Rabbit 4 | Rabbit 5 |
|---|---|---|---|---|---|
| HT | 8 min | 10 min | 4 min | 135 sb | 10 min |
| Cool | 5 min | 5 min | 8 min | 13 min | 11 min |
| HT | 10 min | 70 sa | 10 min | 10 min | 10 min |
| Cool | 5 min | 3 min | 9 min | 5 min | 17 min |
| HT | 10 min | 10 min | 10 min | 10 min | 10 min |
| Cool | 5 min | 5 min | |||
| HT | 10 min | 10 min | |||
| Total HT duration | 28 min | 31 min | 24 min | 32 min | 30 min |
HT hyperthermia
aManually aborted: motion artifacts in the MR thermometry observed
bAutomatically aborted: connection loss between the MR console and the HIFU console
Fig. 2.
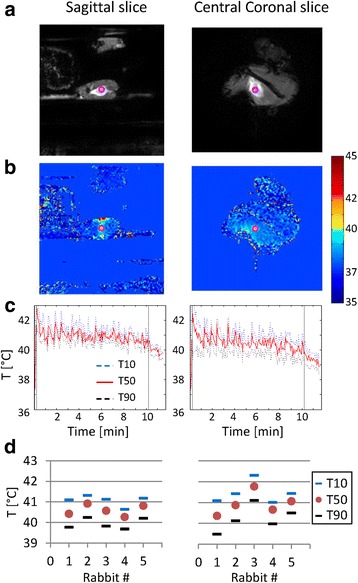
MR-HIFU-induced hyperthermia. Examples of magnitude images (a) and temperature images (b) of the MR thermometry sequence and T 10, T 50, and T 90 profiles over time (c) (rabbit 2, first hyperthermia block). In (c), the vertical lines indicate the start and end of the hyperthermia maintenance phase of the feedback algorithm. The ROIs used for the T 10, T 50, and T 90 calculation are indicated by the pink circles in the images in (a, b). In (d), the temporal mean values of T 10, T 50, and T 90 over the entire hyperthermia duration are shown per rabbit
Table 3.
Temporal mean and standard deviation (SD) of T 50, T 90, and T 10, averaged over the three hyperthermia blocks
| Rabbit | Central coronal slice | Sagittal slice | ||||
|---|---|---|---|---|---|---|
| T 50 (°C) | T 90 (°C) | T 10 (°C) | T 50 (°C) | T 90 (°C) | T 10 (°C) | |
| 1 | 40.4 | 39.5 | 41.1 | 40.4 | 39.8 | 41.1 |
| 2 | 40.9 | 40.1 | 41.4 | 40.9 | 40.2 | 41.3 |
| 3 | 41.8 | 41.1 | 42.3 | 40.6 | 39.8 | 41.1 |
| 4 | 40.7 | 40.0 | 41.0 | 40.3 | 39.7 | 40.6 |
| 5 | 41.1 | 40.5 | 41.4 | 40.8 | 40.2 | 41.2 |
| Mean (SD) | 40.9 (0.5) | 40.2 (0.6) | 41.4 (0.5) | 40.6 (0.3) | 39.9 (0.3) | 41.1 (0.3) |
Reproducibility
In Fig. 3, the results of the repeated IVIM scans of rabbit 1, acquired post-hyperthermia, are shown. The parameter maps of the central slice through the tumor (Fig. 3a) look similar, as well as the individual parameter histograms (Fig. 3b) and the cross-correlation histograms (Fig. 3c), except for some minor differences in Dt. Table 4 shows that the median Dt values showed a small but statistically significant difference of 0.14 × 10⁻³ mm2/s (p < 0.001), while no significant difference was found between the median fp (p = 0.14) and Dp values (p = 0.09).
Fig. 3.
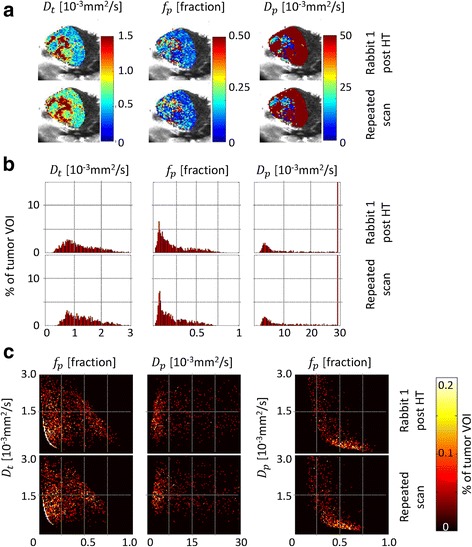
Reproducibility results. Results of the repeated IVIM scans acquired in rabbit 1 after hyperthermia. The parameter maps of the central slice through the tumor are shown in (a), the individual parameter histograms in (b), and the two-dimensional cross-correlation histograms in (c). The parameter maps in frame (a) are shown as an overlay over the corresponding magnitude image (b = 0 s/mm2)
Table 4.
Reproducibility test: median IVIM parameter values of two dynamic scans acquired in rabbit 1, post-hyperthermia (HT)
| Rabbit 1 post-HT | Repeated scan | p value | |
|---|---|---|---|
| D t [10−3 mm2/s] | 1.06 | 1.20 | <0.001 |
| f p [fraction] | 0.16 | 0.17 | 0.14 |
| D p [10−3 mm2/s] | 5.2 | 6.1 | 0.09 |
DCE and IVIM parameter maps
The DCE and IVIM parameter maps of the central slice through each tumor are displayed in Fig. 4. Please note that the region for which the IVIM analysis was performed is limited to the region included for the Bayesian prior distribution, for which any water from the tank was avoided in the delineation. Variations in the parameter maps can be observed between the rabbits, both before and after hyperthermia. Rabbit 2 died during treatment; the corresponding data were excluded from the analysis. The signal-to-noise ratio of the pre-hyperthermia IVIM data acquired in rabbit 5 was very low. We therefore decided to refrain from including IVIM data from this animal in any comparisons. Decreased values can be observed in the post-hyperthermia vp map of rabbit 3 (vp < 0.02) and in all post-hyperthermia DCE maps of rabbit 4 (vp < 0.02, Ktrans < 0.4, and kep < 0.4; Fig. 4a).
Fig. 4.
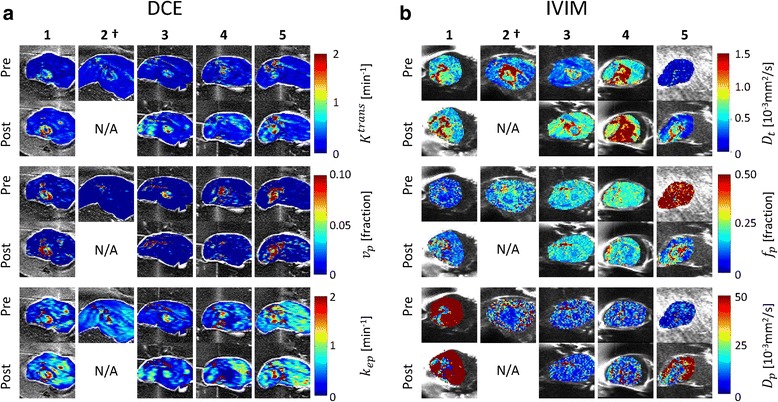
DCE and IVIM parameter maps. Pre- and post-hyperthermia DCE (a) and IVIM (b) parameter maps of the central slices through the tumor for all rabbits (1-5). The parameter maps are shown as an overlay over the corresponding magnitude image (20th dynamic for DCE and b = 0 s/mm2 for IVIM). Rabbit 2 (†) died during the treatment.
Histograms and median values
Pre- and post-hyperthermia histograms of the DCE parameters in the tumor VOIs are shown in Fig. 5a. Variations in the pre-hyperthermia histograms can be observed between the rabbits, in particular, the kep histograms. Table 5 shows the comparisons of pre- and post-hyperthermia median values of the DCE parameters and the corresponding p values, for both the surrounding muscle and the tumor VOI. In the surrounding muscle, no significant changes were found in the median values of vp in all rabbits and of kep in rabbits 1 and 4, while significant increases (p < 0.001) were found in the median values of kep in rabbits 3 and 5 and of Ktrans in all rabbits, in the order of 0.1 min−1. The changes in the tumor VOI are most obvious in rabbit 4, where all three DCE parameter histograms, as well as the median values, shifted towards lower values. For all other rabbits, the Ktrans histograms and the median Ktrans values shifted towards higher values and the changes in median values were in the order of 0.2 min−1. The median vp increased in rabbits 1 and 5 and decreased in rabbits 3 and 4. In the kep histograms of rabbits 3 and 4, clear shape changes can be observed. The median kep increased in rabbit 1 and decreased in rabbits 4 and 5. In rabbit 3, the bulk shift in the kep distribution towards lower values changed the skewness (Fig. 5a). This resulted in an increase in the median kep (Table 5), which does not reflect the observed changes in the histogram (p = 0.006).
Fig. 5.
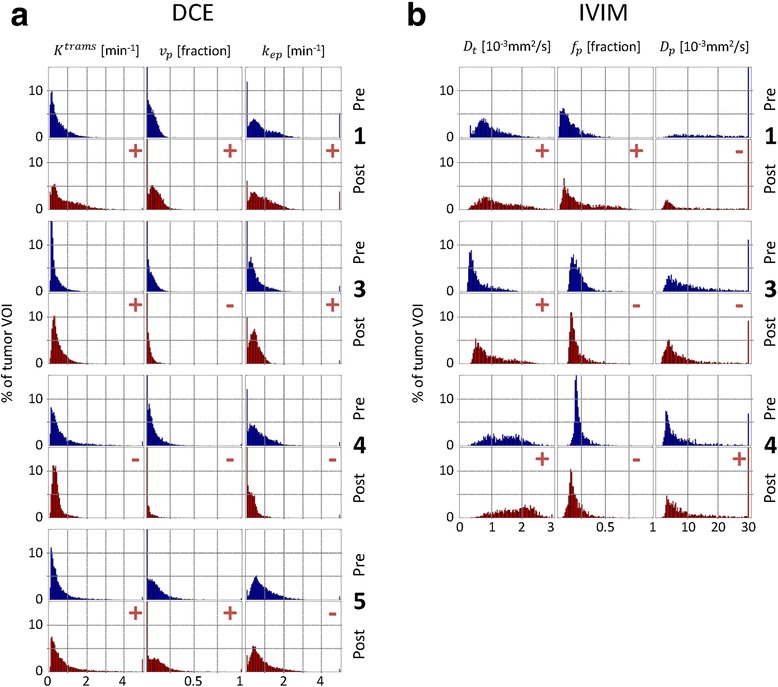
DCE and IVIM parameter histograms. Histograms of the pre- and post-hyperthermia DCE parameters (a) and of the IVIM parameters (b) in the tumor VOI of the rabbits included in the analysis. Median changes are indicated at the top right of each post-hyperthermia histogram: + increase, − decrease
Table 5.
Median DCE parameter values in the surrounding muscle and in the tumor VOI, pre- and post-hyperthermia
| Surrounding muscle | K trans [min−1] | v p [fraction] | k ep [min−1] | |||||||||
| Rabbit | Pre | Post | p | Pre | Post | p | Pre | Post | p | |||
| 1 | 0.14 | 0.30 | + | <0.001 | 0.003 | 0.001 | 0.077 | 0.65 | 0.74 | 0.004 | ||
| 3 | 0.08 | 0.20 | + | <0.001 | 0.000 | 0.000 | 0.021 | 0.26 | 0.37 | + | <0.001 | |
| 4 | 0.16 | 0.26 | + | <0.001 | 0.000 | 0.000 | 0.476 | 0.43 | 0.48 | 0.247 | ||
| 5 | 0.13 | 0.27 | + | <0.001 | 0.000 | 0.000 | 0.817 | 0.81 | 0.96 | + | <0.001 | |
| Tumor VOI | K trans [min−1] | v p [fraction] | k ep [min−1] | |||||||||
| Rabbit | Pre | Post | p | Pre | Post | p | Pre | Post | p | |||
| 1 | 0.34 | 0.68 | + | <0.001 | 0.055 | 0.085 | + | <0.001 | 0.68 | 0.80 | + | <0.001 |
| 3 | 0.14 | 0.34 | + | <0.001 | 0.043 | 0.024 | − | <0.001 | 0.36 | 0.41 | 0.006 | |
| 4 | 0.39 | 0.29 | − | <0.001 | 0.053 | 0.030 | − | <0.001 | 0.57 | 0.26 | − | <0.001 |
| 5 | 0.30 | 0.47 | + | <0.001 | 0.087 | 0.110 | + | <0.001 | 0.74 | 0.62 | − | <0.001 |
Plus signs (+) indicate significant increase after hyperthermia, and minus signs (−) indicate significant decrease after hyperthermia
Pre- and post-hyperthermia histograms of the IVIM parameters in the tumor VOIs are shown in Fig. 5b. It is notable that all pre-hyperthermia histograms look different in shape. Table 6 shows the comparisons of the pre- and post-hyperthermia median values of the IVIM parameters and the corresponding p values, for both the surrounding muscle and the tumor VOI. In the surrounding muscle, no significant changes were found in the median values of fp in all rabbits and of Dt in rabbit 1 and of Dp in rabbits 3 and 4. The significant changes in Dt in rabbits 3 and 4 were in the order of 0.2 × 10⁻³ mm2/s and in Dp in rabbit 1 was 700 × 10−3 mm2/s. For the tumor VOI, all Dt histograms shifted towards higher values after hyperthermia and the changes in the median values in rabbits 3 and 4 were in the order of 0.4 × 10⁻³ mm2/s. In the histograms and median values of fp an increase was found in rabbit 1 and a decrease in rabbits 3 and 4. The pre-hyperthermia Dp histogram of rabbit 1 shows an even distribution covering a wide range, and the median value was much larger than all other median Dp values (Table 6). The median Dp value decreased in rabbit 3 and increased in rabbit 4.
Table 6.
Median IVIM parameter values in surrounding muscle and in the tumor VOI, pre- and post-hyperthermia
| Surrounding muscle | D t [10−3 mm2/s] | f p [fraction] | D p [10−3 mm2/s] | |||||||||
| Rabbit | Pre | Post | p | Pre | Post | p | Pre | Post | p | |||
| 1 | 0.42 | 0.46 | 0.670 | 0.07 | 0.10 | 0.026 | 300 | 1000 | + | <0.001 | ||
| 3 | 0.32 | 0.60 | + | <0.001 | 0.16 | 0.18 | 0.642 | 5.6 | 5.4 | 0.509 | ||
| 4 | 0.46 | 0.55 | − | <0.001 | 0.18 | 0.16 | 0.060 | 6.6 | 8.2 | 0.497 | ||
| Tumor VOI | D t [10−3 mm2/s] | f p [fraction] | D p [10−3 mm2/s] | |||||||||
| Rabbit | Pre | Post | p | Pre | Post | p | Pre | Post | p | |||
| 1 | 0.82 | 1.06 | + | <0.001 | 0.10 | 0.16 | + | <0.001 | 13.5 | 5.2 | − | <0.001 |
| 3 | 0.40 | 0.76 | + | <0.001 | 0.19 | 0.17 | − | <0.001 | 7.6 | 5.0 | − | <0.001 |
| 4 | 1.40 | 1.82 | + | <0.001 | 0.20 | 0.16 | − | <0.001 | 4.7 | 6.0 | + | <0.001 |
Plus signs (+) indicate significant increase after hyperthermia, and minus signs (−) indicate significant decrease after hyperthermia
Cross-correlation histograms
The two-dimensional cross-correlation histograms of the DCE parameters in the tumor VOIs are displayed in Fig. 6a. The shapes of the different pre-hyperthermia cross-correlation histograms are comparable for rabbits 1, 3, and 5; for rabbit 4, the shapes are less elongated and more diffuse. After hyperthermia, the cross-correlation histograms of rabbits 1 and 5 become more diffuse, while those of rabbits 3 and 4 become more compact, particularly the vp × Ktrans and vp × kep histograms.
Fig. 6.
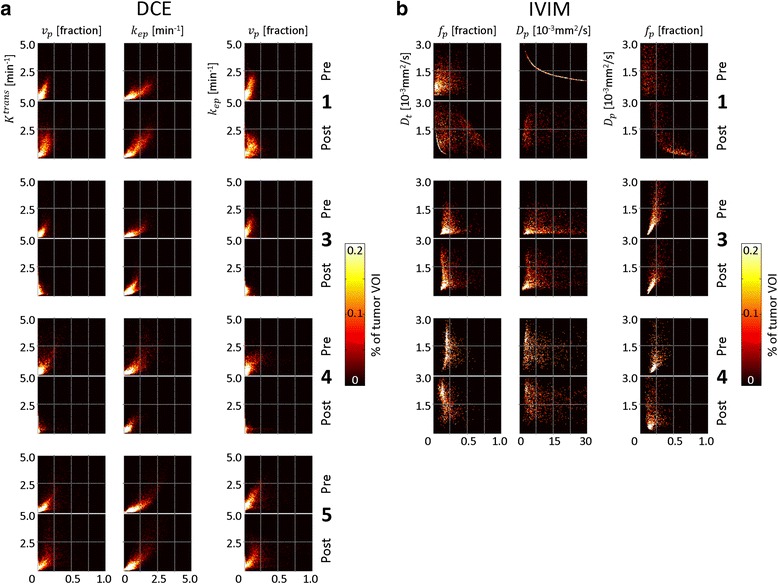
Cross-correlation histograms of DCE and IVIM parameters. Cross-correlation histograms of the pre- and post-hyperthermia DCE parameters (a) and of the IVIM parameters (b) in the tumor VOIs of the rabbits included in the analysis
The cross-correlation histograms of the IVIM parameters in the tumor VOIs are displayed in Fig. 6b. In rabbit 1, the pre-hyperthermia Dp × Dt histogram shows a strong correlation between the parameters for all voxels, which indicate systematic errors in the parameter estimation. Similarly, the post-hyperthermia fp × Dt histogram of rabbit 1 shows a strong correlation between the parameters for a large portion of the voxels. The cross-correlation histograms of rabbits 3 and 4 have similar shapes but differ in their distributions: in rabbit 4, there were more voxels with low fp values in combination with high Dt values.
Discussion
DCE-MRI and IVIM-MRI data were acquired before and after MR-HIFU-induced hyperthermia in rabbits with Vx2 tumors. The pre-hyperthermia DCE and IVIM parameter maps and histograms revealed variations between the rabbits. This implies that the group was heterogeneous in terms of DCE and IVIM parameter distributions. This heterogeneity was also observed in five other rabbits that did not receive the hyperthermia treatment and were therefore not included in this study (data not shown). The post-hyperthermia data were acquired within 1 h after hyperthermia. Although the duration of the physiological effects after applying hyperthermia is a controversial aspect [54], several studies have shown that changes in regional blood flow and permeability persisted and could be detected up to a few hours after hyperthermia [10, 12, 13]. Therefore, it is assumed that the effect of differences in timing of the image acquisitions on the parameter changes is limited, as compared to other sources. The changes in the DCE and IVIM parameters after hyperthermia varied between the rabbits and are discussed below.
Rabbit 4 had three contiguous small tumors instead of a single tumor and received a few minutes longer hyperthermia than the other rabbits. This combination may have led to a different physiological response in this rabbit as compared to the other rabbits. In the other rabbits (rabbits 1, 3, and 5), increases in Ktrans were observed after hyperthermia which were a factor 2 larger than the changes observed in the surrounding muscle. For the median kep values, only the change in rabbit 4 could be considered to be significant; the changes in the other rabbits were in the same order as those found in the surrounding muscle. The changes in the median Ktrans and kep values were in the order of 0.2 min−1, where extreme outliers were excluded to have a realistic representation of the parameter value distribution. Hijnen et al. [38] showed Ktrans changes of about 0.1 min−1 after hyperthermia in tumor-bearing mice in the non-necrotic tumor areas, which is in the same order of magnitude as the changes observed in this study. In the whole tumor, changes in the mean Ktrans and kep values were smaller (0.017 and 0.022 min−1). Discrepancies between the results may be explained by the different tumor and animal models. In addition, a different model was used for the DCE analysis, standard Tofts [55] versus extended Tofts [18], resulting in a discrepancy in the permeability and flow contributions in Ktrans [56].
The changes in vp with (p < 0.001) in the tumor VOI can be considered to be significant, as no significant changes were observed in the surrounding muscle. An increase in vp was observed in rabbits 1 and 5 and a decrease in rabbit 3. Interestingly, hyperthermic temperatures measured in the coronal slice of rabbit 3 were higher than in the other rabbits: the mean T50 was close to 42 °C and the mean T10 was higher than 42 °C. Since vp represents the blood plasma volume fraction in a voxel, it is strongly related to the size of the vessels. It is well known that tumor capillaries are hastily formed and lack the ability to actively dilate. However, tumor capillaries may passively dilate upon hyperthermia, as a result of increased blood flow in adjacent tissue or of increased cardiac output [7], which may explain the increase in vp observed in rabbits 1 and 5. At moderate hyperthermic temperatures (>42 °C), reduced tumor vessel diameters have been reported in Vx2 tumors in rabbit ear chambers [8], which may explain the observed vp decrease in rabbit 3. Dudar and Jain [8] suggested that the reduction of tumor vessel diameters may be attributed to swelling of the endothelial cells and tissue parenchyma, induced by a decreased pH in tumors during hyperthermia. The kep histogram shapes of rabbits 3 and 4 clearly changed after hyperthermia to a more compact distribution. It is notable that these are the same rabbits that showed a decrease in vp. This potential relation can be seen more clearly in the vp × kep histograms of these rabbits.
For the IVIM analysis, the reproducibility was tested by comparing a repeated IVIM scan. No significant differences were found between the fp and Dp histograms and median values (p = 0.14 and p = 0.09); the changes in Dt were significantly different and relatively small compared to the median values (13 and 12 %).
The pre-hyperthermia IVIM data of rabbit 5 had a low signal-to-noise ratio, possibly due to motion during the acquisition; hence, a reliable comparison with the post-hyperthermia data was not possible. A clear increase in Dt after hyperthermia could be seen in rabbits 1, 3, and 4. The changes in the median values were factors of 1.7, 2.6, and 3.0 times larger than the changes found in the reproducibility test and factors of 6, 1.3, and 4.7 times larger than the changes found in the surrounding muscle. This indicates that the observed changes in Dt are likely to be induced by hyperthermia. For fp, no significant changes were found in the surrounding muscle. In the tumor VOI, an increase in fp was observed in rabbit 1 and a decrease in rabbits 3 and 4, similar to the changes observed in vp. While the interpretations of fp and vp are different, signal fraction and volume fraction, respectively, the parameters are strongly related to each other as they both reflect the intra-voxel fraction of the vascular component.
The fp values in rabbit 1 are much lower than in the other rabbits, which indicate an overall small contribution of vascular components to the signal. The cross-correlation histograms of these data revealed a strong correlation between Dt and Dp, suggesting systematic errors in the parameter estimation. The low fp values are likely the reason for the systematic Dp estimation errors, inasmuch Dp cannot be estimated accurately when fp is too low [57, 58].
While the results show that changes in DCE and IVIM parameters after MR-HIFU-induced hyperthermia could be detected, the changes were found to be variable between the rabbits. The group appeared to be heterogeneous in terms of DCE and IVIM parameter distributions, and it is likely that such a start condition would result in a heterogeneous outcome. In future research, stratification of starting conditions would be desirable, which requires a larger number of subjects.
Conclusions
In this study, we have shown that DCE and IVIM parameters maps and (cross-correlation) histograms could be constructed to detect changes after MR-HIFU-induced hyperthermia in rabbit Vx2 tumors. Perfusion parameter histograms provided insight into the changes of the parameter distributions and showed that changes in most of the median values were statistically significant (p < 0.001). However, the detected changes were variable between the rabbits. The results suggest that DCE- and IVIM-MRI may be promising tools to assess tumor physiology responses to hyperthermia. Further research in a larger number of subjects is necessary to assess their value for treatment response monitoring.
Acknowledgements
The authors are indebted to thank Nico J. M. Attevelt and his colleagues from the Faculty of Veterinary Medicine, Utrecht University, for their support in the animal handling. This research was performed within the framework of CTMM, the Center for Translational Molecular Medicine (www.ctmm.nl), project HIFU-CHEM (grant 03O-301).
Footnotes
Competing interests
The authors declare that they have no competing interests.
Authors’ contributions
ML participated in the design of the current study, participated in the experiments, performed the DCE data analysis and comparison analysis, and drafted the manuscript. CO and AB participated in the experiments. MF performed the IVIM data analysis. RD, MV, and CM drafted the manuscript. CB participated in the design of the study, participated in the experiments, supervised the data analysis, and drafted the manuscript. LB participated in the design of the study, supervised the data analysis, and drafted the manuscript. All authors read and approved the final manuscript.
Contributor Information
Mie K. Lam, Email: M.K.Lam-4@umcutrecht.nl
Chris Oerlemans, Email: C.Oerlemans@umcutrecht.nl.
Martijn Froeling, Email: M.Froeling@umcutrecht.nl.
Roel Deckers, Email: R.Deckers-2@umcutrecht.nl.
Angelique D. Barten-Van Rijbroek, Email: A.Barten@umcutrecht.nl
Max A. Viergever, Email: M.Viergever@umcutrecht.nl
Chrit T. W. Moonen, Email: C.Moonen@umcutrecht.nl
Clemens Bos, Email: C.Bos@umcutrecht.nl.
Lambertus W. Bartels, Email: W.Bartels@umcutrecht.nl
References
- 1.Overgaard J, Gonzalez Gonzalez D, Hulshof MC, Arcangeli G, Dahl O, Mella O, et al. Randomised trial of hyperthermia as adjuvant to radiotherapy for recurrent or metastatic malignant melanoma. European Society for Hyperthermic Oncology. Lancet. 1995;345(8949):540–3. doi: 10.1016/S0140-6736(95)90463-8. [DOI] [PubMed] [Google Scholar]
- 2.Falk MH, Issels RD. Hyperthermia in oncology. Int J Hyperthermia. 2001;17(1):1–18. doi: 10.1080/02656730150201552. [DOI] [PubMed] [Google Scholar]
- 3.Grull H, Langereis S. Hyperthermia-triggered drug delivery from temperature-sensitive liposomes using MRI-guided high intensity focused ultrasound. J Control Release. 2012;161(2):317–27. doi: 10.1016/j.jconrel.2012.04.041. [DOI] [PubMed] [Google Scholar]
- 4.McDaniel JR, Dewhirst MW, Chilkoti A. Actively targeting solid tumours with thermoresponsive drug delivery systems that respond to mild hyperthermia. Int J Hyperthermia. 2013;29(6):501–10. doi: 10.3109/02656736.2013.819999. [DOI] [PubMed] [Google Scholar]
- 5.Jain RK. Haemodynamic and transport barriers to the treatment of solid tumours. Int J Radiat Biol. 1991;60(1-2):85–100. doi: 10.1080/09553009114551621. [DOI] [PubMed] [Google Scholar]
- 6.Li SP, Padhani AR. Tumor response assessments with diffusion and perfusion MRI. J Magn Reson Imaging. 2012;35(4):745–63. doi: 10.1002/jmri.22838. [DOI] [PubMed] [Google Scholar]
- 7.Song CW. Effect of local hyperthermia on blood flow and microenvironment: a review. Cancer Res. 1984;44(10 Suppl):4721s–30s. [PubMed] [Google Scholar]
- 8.Dudar TE, Jain RK. Differential response of normal and tumor microcirculation to hyperthermia. Cancer Res. 1984;44(2):605–12. [PubMed] [Google Scholar]
- 9.Gerlowski LE, Jain RK. Effect of hyperthermia on microvascular permeability to macromolecules in normal and tumor tissues. Int J Microcirc Clin Exp. 1985;4(4):363–72. [PubMed] [Google Scholar]
- 10.Matsuda H, Sugimachi K, Kuwano H, Mori M. Hyperthermia, tissue microcirculation, and temporarily increased thermosensitivity in VX2 carcinoma in rabbit liver. Cancer Res. 1989;49(10):2777–82. [PubMed] [Google Scholar]
- 11.Gnant MF, Noll LA, Terrill RE, Wu PC, Berger AC, Nguyen HQ, et al. Isolated hepatic perfusion for lapine liver metastases: impact of hyperthermia on permeability of tumor neovasculature. Surgery. 1999;126(5):890–9. doi: 10.1016/S0039-6060(99)70030-9. [DOI] [PubMed] [Google Scholar]
- 12.Kong G, Braun RD, Dewhirst MW. Characterization of the effect of hyperthermia on nanoparticle extravasation from tumor vasculature. Cancer Res. 2001;61(7):3027–32. [PubMed] [Google Scholar]
- 13.Li L, ten Hagen TLM, Bolkestein M, Gasselhuber A, Yatvin J, van Rhoon GC, et al. Improved intratumoral nanoparticle extravasation and penetration by mild hyperthermia. J Control Release. 2013;167(2):130–7. doi: 10.1016/j.jconrel.2013.01.026. [DOI] [PubMed] [Google Scholar]
- 14.Craciunescu OI, Thrall DE, Vujaskovic Z, Dewhirst MW. Magnetic resonance imaging: a potential tool in assessing the addition of hyperthermia to neoadjuvant therapy in patients with locally advanced breast cancer. Int J Hyperthermia. 2010;26(7):625–37. doi: 10.3109/02656736.2010.499526. [DOI] [PMC free article] [PubMed] [Google Scholar]
- 15.Ludemann L, Wust P, Gellermann J. Perfusion measurement using DCE-MRI: implications for hyperthermia. Int J Hyperthermia. 2008;24(1):91–6. doi: 10.1080/02656730701836954. [DOI] [PubMed] [Google Scholar]
- 16.Tofts PS, Berkowitz B, Schnall MD. Quantitative analysis of dynamic Gd-DTPA enhancement in breast tumors using a permeability model. Magn Reson Med. 1995;33(4):564–8. doi: 10.1002/mrm.1910330416. [DOI] [PubMed] [Google Scholar]
- 17.Sourbron SP, Buckley DL. Tracer kinetic modelling in MRI: estimating perfusion and capillary permeability. Phys Med Biol. 2012;57(2):R1–33. doi: 10.1088/0031-9155/57/2/R1. [DOI] [PubMed] [Google Scholar]
- 18.Tofts PS. Modeling tracer kinetics in dynamic Gd-DTPA MR imaging. J Magn Reson Imaging. 1997;7(1):91–101. doi: 10.1002/jmri.1880070113. [DOI] [PubMed] [Google Scholar]
- 19.Tofts PS, Brix G, Buckley DL, Evelhoch JL, Henderson E, Knopp MV, et al. Estimating kinetic parameters from dynamic contrast-enhanced T(1)-weighted MRI of a diffusable tracer: standardized quantities and symbols. J Magn Reson Imaging. 1999;10(3):223–32. doi: 10.1002/(SICI)1522-2586(199909)10:3<223::AID-JMRI2>3.0.CO;2-S. [DOI] [PubMed] [Google Scholar]
- 20.Zahra MA, Hollingsworth KG, Sala E, Lomas DJ, Tan LT. Dynamic contrast-enhanced MRI as a predictor of tumour response to radiotherapy. Lancet Oncol. 2007;8(1):63–74. doi: 10.1016/S1470-2045(06)71012-9. [DOI] [PubMed] [Google Scholar]
- 21.Larsen VA, Simonsen HJ, Law I, Larsson HB, Hansen AE. Evaluation of dynamic contrast-enhanced T1-weighted perfusion MRI in the differentiation of tumor recurrence from radiation necrosis. Neuroradiology. 2013;55(3):361–9. doi: 10.1007/s00234-012-1127-4. [DOI] [PubMed] [Google Scholar]
- 22.Li SP, Makris A, Beresford MJ, Taylor NJ, Ah-See ML, Stirling JJ, et al. Use of dynamic contrast-enhanced MR imaging to predict survival in patients with primary breast cancer undergoing neoadjuvant chemotherapy. Radiology. 2011;260(1):68–78. doi: 10.1148/radiol.11102493. [DOI] [PubMed] [Google Scholar]
- 23.Cho N, Im SA, Park IA, Lee KH, Li M, Han W, et al. Breast cancer: early prediction of response to neoadjuvant chemotherapy using parametric response maps for MR imaging. Radiology. 2014;272(2):385–96. doi: 10.1148/radiol.14131332. [DOI] [PubMed] [Google Scholar]
- 24.Li X, Arlinghaus LR, Ayers GD, Chakravarthy AB, Abramson RG, Abramson VG, et al. DCE-MRI analysis methods for predicting the response of breast cancer to neoadjuvant chemotherapy: pilot study findings. Magn Reson Med. 2014;71(4):1592–602. doi: 10.1002/mrm.24782. [DOI] [PMC free article] [PubMed] [Google Scholar]
- 25.Intven M, Reerink O, Philippens ME. Dynamic contrast enhanced MR imaging for rectal cancer response assessment after neo-adjuvant chemoradiation. J Magn Reson Imaging. 2014 doi: 10.1002/jmri.24718. [DOI] [PubMed] [Google Scholar]
- 26.Zheng D, Chen Y, Liu X, Chen Y, Xu L, Ren W, et al. Early response to chemoradiotherapy for nasopharyngeal carcinoma treatment: value of dynamic contrast-enhanced 3.0 T MRI. J Magn Reson Imaging. 2014 doi: 10.1002/jmri.24723. [DOI] [PubMed] [Google Scholar]
- 27.Park JJ, Kim CK, Park SY, Simonetti AW, Kim E, Park BK, et al. Assessment of early response to concurrent chemoradiotherapy in cervical cancer: value of diffusion-weighted and dynamic contrast-enhanced MR imaging. Magn Reson Imaging. 2014;32(8):993–1000. doi: 10.1016/j.mri.2014.05.009. [DOI] [PubMed] [Google Scholar]
- 28.Le Bihan D, Breton E, Lallemand D, Aubin ML, Vignaud J, Laval-Jeantet M. Separation of diffusion and perfusion in intravoxel incoherent motion MR imaging. Radiology. 1988;168(2):497–505. doi: 10.1148/radiology.168.2.3393671. [DOI] [PubMed] [Google Scholar]
- 29.Henkelman RM. Does IVIM measure classical perfusion? Magn Reson Med. 1990;16(3):470–5. doi: 10.1002/mrm.1910160313. [DOI] [PubMed] [Google Scholar]
- 30.Le Bihan D, Turner R. The capillary network: a link between IVIM and classical perfusion. Magn Reson Med. 1992;27(1):171–8. doi: 10.1002/mrm.1910270116. [DOI] [PubMed] [Google Scholar]
- 31.Lemke A, Laun FB, Simon D, Stieltjes B, Schad LR. An in vivo verification of the intravoxel incoherent motion effect in diffusion-weighted imaging of the abdomen. Magn Reson Med. 2010;64(6):1580–5. doi: 10.1002/mrm.22565. [DOI] [PubMed] [Google Scholar]
- 32.Luciani A, Vignaud A, Cavet M, Nhieu JT, Mallat A, Ruel L, et al. Liver cirrhosis: intravoxel incoherent motion MR imaging--pilot study. Radiology. 2008;249(3):891–9. doi: 10.1148/radiol.2493080080. [DOI] [PubMed] [Google Scholar]
- 33.Lemke A, Laun FB, Klauss M, Re TJ, Simon D, Delorme S, et al. Differentiation of pancreas carcinoma from healthy pancreatic tissue using multiple b-values: comparison of apparent diffusion coefficient and intravoxel incoherent motion derived parameters. Invest Radiol. 2009;44(12):769–75. doi: 10.1097/RLI.0b013e3181b62271. [DOI] [PubMed] [Google Scholar]
- 34.Sigmund EE, Cho GY, Kim S, Finn M, Moccaldi M, Jensen JH, et al. Intravoxel incoherent motion imaging of tumor microenvironment in locally advanced breast cancer. Magn Reson Med. 2011;65(5):1437–47. doi: 10.1002/mrm.22740. [DOI] [PMC free article] [PubMed] [Google Scholar]
- 35.Sumi M, Van Cauteren M, Sumi T, Obara M, Ichikawa Y, Nakamura T. Salivary gland tumors: use of intravoxel incoherent motion MR imaging for assessment of diffusion and perfusion for the differentiation of benign from malignant tumors. Radiology. 2012;263(3):770–7. doi: 10.1148/radiol.12111248. [DOI] [PubMed] [Google Scholar]
- 36.Federau C, O'Brien K, Meuli R, Hagmann P, Maeder P. Measuring brain perfusion with intravoxel incoherent motion (IVIM): initial clinical experience. J Magn Reson Imaging. 2014;39(3):624–32. doi: 10.1002/jmri.24195. [DOI] [PubMed] [Google Scholar]
- 37.Gaing B, Sigmund EE, Huang WC, Babb JS, Parikh NS, Stoffel D, et al. Subtype differentiation of renal tumors using voxel-based histogram analysis of intravoxel incoherent motion parameters. Invest Radiol. 2015;50(3):144–52. doi: 10.1097/RLI.0000000000000111. [DOI] [PubMed] [Google Scholar]
- 38.Hijnen NM, Heijman E, Kohler MO, Ylihautala M, Ehnholm GJ, Simonetti AW, et al. Tumour hyperthermia and ablation in rats using a clinical MR-HIFU system equipped with a dedicated small animal set-up. Int J Hyperthermia. 2012;28(2):141–55. doi: 10.3109/02656736.2011.648137. [DOI] [PubMed] [Google Scholar]
- 39.Staruch R, Chopra R, Hynynen K. Hyperthermia in bone generated with MR imaging-controlled focused ultrasound: control strategies and drug delivery. Radiology. 2012;263(1):117–27. doi: 10.1148/radiol.11111189. [DOI] [PubMed] [Google Scholar]
- 40.Ranjan A, Jacobs GC, Woods DL, Negussie AH, Partanen A, Yarmolenko PS, et al. Image-guided drug delivery with magnetic resonance guided high intensity focused ultrasound and temperature sensitive liposomes in a rabbit Vx2 tumor model. J Control Release. 2012;158(3):487–94. doi: 10.1016/j.jconrel.2011.12.011. [DOI] [PMC free article] [PubMed] [Google Scholar]
- 41.de Smet M, Hijnen NM, Langereis S, Elevelt A, Heijman E, Dubois L, et al. Magnetic resonance guided high-intensity focused ultrasound mediated hyperthermia improves the intratumoral distribution of temperature-sensitive liposomal doxorubicin. Invest Radiol. 2013;48(6):395–405. doi: 10.1097/RLI.0b013e3182806940. [DOI] [PubMed] [Google Scholar]
- 42.Staruch RM, Hynynen K, Chopra R. Hyperthermia-mediated doxorubicin release from thermosensitive liposomes using MR-HIFU: therapeutic effect in rabbit Vx2 tumours. Int J Hyperthermia. 2015;31(2):118–33. doi: 10.3109/02656736.2014.992483. [DOI] [PubMed] [Google Scholar]
- 43.Wijlemans JW, Deckers R, van den Bosch MA, Seinstra BA, van Stralen M, van Diest PJ, et al. Evolution of the ablation region after magnetic resonance-guided high-intensity focused ultrasound ablation in a Vx2 tumor model. Invest Radiol. 2013;48(6):381–6. doi: 10.1097/RLI.0b013e3182820257. [DOI] [PubMed] [Google Scholar]
- 44.De Poorter J, De Wagter C, De Deene Y, Thomsen C, Ståhlberg F, Achten E. Noninvasive MRI thermometry with the proton resonance frequency (PRF) method: in vivo results in human muscle. Magn Reson Med. 1995;33:74–81. doi: 10.1002/mrm.1910330111. [DOI] [PubMed] [Google Scholar]
- 45.Ishihara Y, Calderon A, Watanabe H, Okamoto K, Suzuki Y, Kuroda K, et al. A precise and fast temperature mapping using water proton chemical shift. Magn Reson Med. 1995;34:814–23. doi: 10.1002/mrm.1910340606. [DOI] [PubMed] [Google Scholar]
- 46.Vijayakumar S, Huang F, RD E. Improved partial k-space reconstruction technique for dynamic myocardial perfusion MRI. Conf Proc IEEE Eng Med Biol Soc. 2005;2:1419–21. doi: 10.1109/IEMBS.2005.1616696. [DOI] [PubMed] [Google Scholar]
- 47.Kohler MO, Mougenot C, Quesson B, Enholm J, Le Bail B, Laurent C, et al. Volumetric HIFU ablation under 3D guidance of rapid MRI thermometry. Med Phys. 2009;36(8):3521–35. doi: 10.1118/1.3152112. [DOI] [PubMed] [Google Scholar]
- 48.Partanen A, Yarmolenko PS, Viitala A, Appanaboyina S, Haemmerich D, Ranjan A, et al. Mild hyperthermia with magnetic resonance-guided high-intensity focused ultrasound for applications in drug delivery. Int J Hyperthermia. 2012;28(4):320–36. doi: 10.3109/02656736.2012.680173. [DOI] [PMC free article] [PubMed] [Google Scholar]
- 49.Haacke EM, Filleti CL, Gattu R, Ciulla C, Al-Bashir A, Suryanarayanan K, et al. New algorithm for quantifying vascular changes in dynamic contrast-enhanced MRI independent of absolute T1 values. Magn Reson Med. 2007;58(3):463–72. doi: 10.1002/mrm.21358. [DOI] [PubMed] [Google Scholar]
- 50.Thompson HK, Jr, Starmer CF, Whalen RE, McIntosh HD. Indicator transit time considered as a gamma variate. Circ Res. 1964;14:502–15. doi: 10.1161/01.RES.14.6.502. [DOI] [PubMed] [Google Scholar]
- 51.O'Neill BE, Vo HQ, Shao H, Karmonik C, Zhou X, Li KC. MRI-based prediction of pulsed high-intensity focused ultrasound effect on tissue transport in rabbit muscle. J Magn Reson Imaging. 2013;38(5):1094–102. doi: 10.1002/jmri.24087. [DOI] [PMC free article] [PubMed] [Google Scholar]
- 52.Orton MR, Collins DJ, Koh DM, Leach MO. Improved intravoxel incoherent motion analysis of diffusion weighted imaging by data driven Bayesian modeling. Magn Reson Med. 2014;71(1):411–20. doi: 10.1002/mrm.24649. [DOI] [PubMed] [Google Scholar]
- 53.Zhang YD, Wang Q, Wu CJ, Wang XN, Zhang J, Liu H, et al. The histogram analysis of diffusion-weighted intravoxel incoherent motion (IVIM) imaging for differentiating the Gleason grade of prostate cancer. Eur Radiol. 2015;25(4):994–1004. doi: 10.1007/s00330-014-3511-4. [DOI] [PubMed] [Google Scholar]
- 54.Horsman MR. Tissue physiology and the response to heat. Int J Hyperthermia. 2006;22(3):197–203. doi: 10.1080/02656730600689066. [DOI] [PubMed] [Google Scholar]
- 55.Tofts PS, Kermode AG. Measurement of the blood-brain barrier permeability and leakage space using dynamic MR imaging. 1. Fundamental concepts. Magn Reson Med. 1991;17(2):357–67. doi: 10.1002/mrm.1910170208. [DOI] [PubMed] [Google Scholar]
- 56.Sourbron SP, Buckley DL. On the scope and interpretation of the Tofts models for DCE-MRI. Magn Reson Med. 2011;66(3):735–45. doi: 10.1002/mrm.22861. [DOI] [PubMed] [Google Scholar]
- 57.Pekar J, Moonen CTW, van Zijl PCM. On the precision of diffusion/perfusion imaging by gradient sensitization. Magn Reson Med. 1992;23(1):122–9. doi: 10.1002/mrm.1910230113. [DOI] [PubMed] [Google Scholar]
- 58.Lam MK, Bos C, Moonen CTW, Viergever MA, Bartels LW. Precision and accuracy of intravoxel incoherent motion (IVIM) MRI: applicability in well-perfused tissues. Milan: International Society for Magnetic Resonance in Medicine; 2014. [Google Scholar]