

To the Editor
Analysis of raw reads from RNA sequencing (RNA-seq) makes it possible to reconstruct complete gene structures, including multiple splice variants, without relying on previously established annotations1–3. Downstream statistical modeling of summarized gene or transcript expression data output from these pipelines is facilitated by the Bioconductor project, which provides open-source tools for analysis of high-throughput genomics data4. However, the outputs of upstream processing tools often are aggregated across samples or are not in a format that is readily compatible with downstream Bioconductor packages. This gap has slowed rigorous statistical analysis of expression quantitative trait locus (eQTL), time-course, continuous covariates or of confounded experimental designs at the transcript level and has led to considerable controversy in the analysis of population-level RNA-seq data5. In this Correspondence, we report the development of two pieces of software, Tablemaker and Ballgown, that bridge the gap between transcriptome assembly and fast, flexible differential expression analysis (Supplementary Fig. 1).
Tablemaker uses a GTF file (the standard output from any transcriptome assembler) and spliced read alignments to produce files that explicitly specify the structure of assembled transcripts, mappings from exons and splice junctions to transcripts, and several measures of feature expression, including fragments per kilobase of transcript per million reads sequenced (FPKM) and average per-base coverage (Supplementary Note 1). Tablemaker wraps Cufflinks to estimate FPKM for each assembled transcript. After the transcriptome assembly is processed using Tablemaker, the output files (Supplementary Note 1) can be explored interactively in R using the Ballgown package. Ballgown converts Tablemaker’s assembly structure and expression estimates into an easy-to-access R object (Supplementary Fig. 2) for downstream analyses. Alternatively, the Tablemaker step can be skipped: the R object can be created based on an assembly created with StringTie6, a new, efficient assembler, or from a transcriptome whose expression estimates have been calculated with RSEM’s ‘rsem-calculate-expression’7. Ballgown can be used to visualize the transcript assembly on a gene-by-gene basis, extract abundance estimates for exons, introns, transcripts or genes, and perform linear model–based differential expression analyses (Supplementary Note 2).
The basic linear modeling strategy for differential expression testing implemented in Ballgown allows analysis of eQTL, time-course, continuous covariates or confounded experimental designs at the exon, gene or transcript level. This approach is similar to the linear modeling strategy implemented in limma8, without empirical Bayes shrinkage, and can be applied to exon or gene counts available through the Ballgown object after appropriately transforming the count data9. Alternatively, users may choose to apply the widely used Bioconductor packages for sequence count data10,11. There is no other existing statistical software that allows this level of flexibility for modeling transcript-level expression data. Count-based modeling strategies are not applicable to transcript-level data12, and Cuffdiff2 can only be applied to two-group transcript-level differential expression analysis13. EBSeq could be used in combination with RSEM as a pipeline for transcript-level differential expression analysis, but it is less efficient than linear modeling and does not handle experimental designs beyond multigroup comparison14.
Here we illustrate how to use Tablemaker and Ballgown with the Tuxedo suite, a widely used pipeline for transcript assembly, quantification and flexible differential expression analysis at transcript resolution. The Tuxedo suite process consists of aligning reads using Bowtie15 and Tophat2 (ref. 16), assembling transcripts using Cufflinks2 and carrying out differential expression analysis using Cuffdiff2 (ref. 17). This suite has been used in many projects18–20, including the ENCODE21 and modENCODE22 consortium projects. However, statistical analysis through Cuffdiff2 can only be applied to two-group differential expression analyses, is computationally demanding and produces strongly conservative estimates of statistical significance. Although several other fast and accurate tools for differential expression analysis, such as EdgeR10, DESeq11 and Voom9, are present in Bioconductor4, no software connects these tools to the estimated transcript structures and abundances that are output by such tools as the Tuxedo suite. Furthermore, per-feature read counts are not appropriate for isoform-level analysis. The reason is that isoforms from the same gene may have a high degree of overlap that would lead to ambiguous read counts. Here we integrate the Tuxedo suite with Tablemaker, Ballgown and downstream Bioconductor packages to improve the statistical accuracy, flexibility in experimental design and computational speed of RNA-seq analyses.
To show that the default methods in Ballgown can work in the absence of a differential expression signal, we downloaded and processed data from the GEUVADIS RNA sequencing project23,24 (Supplementary Note 3) and compared them with Cuffdiff2 and EdgeR10. After aligning RNA-seq reads, assembling the transcriptome and processing the results with Tablemaker, we used Ballgown to load the data into R, where we extracted a single-population subset of data to study. The populations included in the GEUVADIS study were Utah residents with Northern and Western European ancestry (CEU), Yoruba in Ibadan, Nigeria (YRI), Toscani in Italy (TSI), British in England and Scotland (GBR), and Finnish in Finland (FIN). Considering only individuals in the FIN population (n = 95), we randomly assigned subjects to one of two groups and tested all assembled transcripts for differential expression between those two groups. We compared the results from using linear models (Ballgown), Cuffdiff2 and EdgeR10 (at the exon level). We used transcript FPKM as the transcript expression measurement in Ballgown, and per-exon read counts for EdgeR. In this type of experiment, the distribution of the P values from all the transcripts should be approximately uniformly distributed, and q values25 should be large.
As expected, the transcript-level P values from the linear model tests implemented in Ballgown were approximately uniformly distributed (Fig. 1a), and all transcripts had q values of ~1, indicating that these models do not generate excess false discoveries. We compared this result to the statistical results from Cuffdiff2 (version 2.2.1, the newest release available in August 2014) on the same data set and found that the P values obtained using Cuffdiff2 were not uniformly distributed: the distribution had more mass near 1 than near 0 (Supplementary Fig. 3a). This indicates that Cuffdiff2 may be somewhat conservatively biased and calls into question the use of the q value as a multiple testing adjustment because it assumes uniformly distributed P values. When we compared Ballgown results to EdgeR, the latter called two exons differentially expressed (q < 0.05), and the exon-level P-value distribution was not uniform, having a bit of extra mass around 0.1 (Supplementary Fig. 3b).
Figure 1.
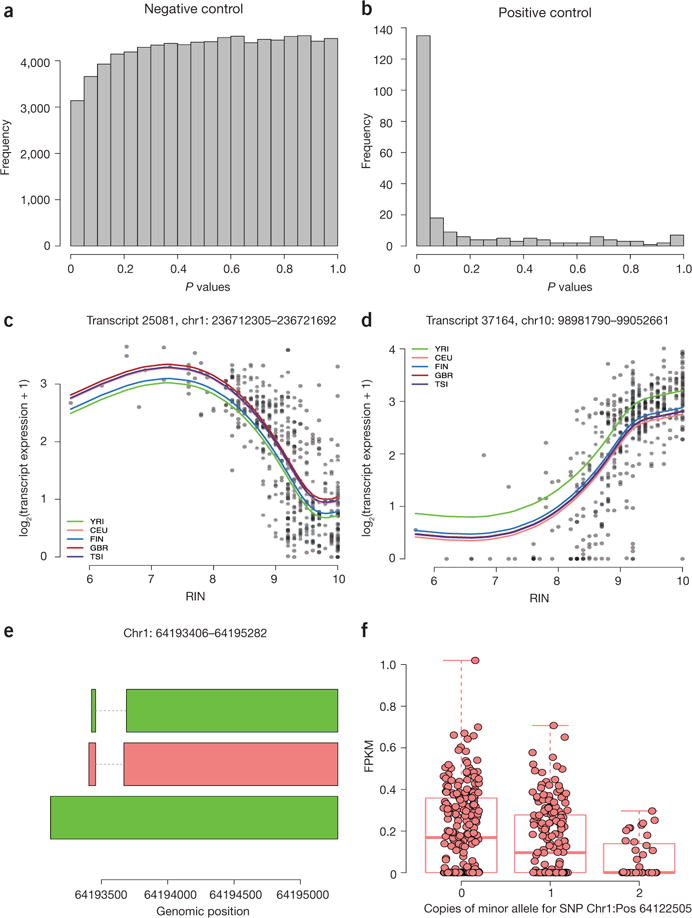
Experimental results obtained with the Ballgown framework. (a) Distribution of transcript-level P values obtained with Ballgown’s F-tests in an experiment without signal (negative control). (b) Transcript-level P-value distribution from Ballgown’s F-tests for expression differences in Y-chromosome transcripts between males and females (positive control). (c,d) Nonlinear effects of RNA quality are shown for expression of two representative transcripts: (c) transcript 25081 on chromosome 1; (d) transcript 37164 on chromosome 10. These two transcripts (FDR < 0.001) and 1,497 others showed a relationship with RNA quality (RIN) that was significantly better captured by a nonlinear trend with three degrees of freedom than a standard linear model. Colored lines shown are predicted values from a natural cubic spline fit and represent predictions for the specified population, assuming average library size. (e) Structures for an assembled transcript that does not overlap any annotated transcripts but shows a significant eQTL. (f) Boxplot of the FPKM transcripts for the middle (red) transcript from e, which shows a consistent and statistically significant eQTL.
These results show that using a well-established, count-based method gives a slightly too liberal result, that Cuffdiff2 is likely conservatively biased and that using a linear model test like the one implemented in Ballgown gives a reasonable P-value distribution without calling any transcripts differentially expressed. The linear models from Ballgown took 18 seconds to run on a standard laptop (MacBook Pro, 8 GB memory). For comparison, Cuffdiff2 took 69 hours and 148 GB of memory using four cores on a cluster node. EdgeR was also run on the laptop and took 2.5 minutes. The negative control experiment showed that Ballgown’s default statistical tests are appropriately conservative when there is no signal present in the data.
We then carried out a second experiment to investigate whether default statistical tests are capable of making discoveries when differential expression is present. For this experiment, we analyzed differential expression of Y-chromosome transcripts between males and females, a test data set in which all transcripts should be differentially expressed. We used a data set consisting of the 95 FIN individuals in the GEUVADIS RNA-seq data set (58 females, 37 males). The P-value histogram from this experiment using the linear model framework implemented in Ballgown shows a very strong signal (Fig. 1b). Of the 433 assembled transcripts on the Y chromosome, 225 had a mean FPKM >0.01 in the males. Of these 225 transcripts, 58% were called differentially expressed with a q value <0.05 and 72% with a q value <0.2. This result shows that the models in Ballgown are capable of discovering true signal in the data set. The P-value histogram for the latest Cuffdiff2 version (2.2.1) also revealed a signal (Supplementary Fig. 4), which is an improvement compared with earlier versions of Cuffdiff2 on similar Y-chromosome tests26. However, only 29 of the 433 assembled transcripts were tested using the inclusion criteria implemented in Cuffdiff2. Of these 29, 24 had q < 0.05 and 26 had q < 0.02. This suggests that Cuffdiff2 is too conservative to detect appropriate levels of differential expression in this experiment. The Y chromosome linear models from Ballgown took less than 0.1 seconds to run after Tablemaker, whereas Cuffdiff2 took 58 hours and 178 GB of memory on four cores. Note, though, that this footprint could have been substantially reduced by subsetting all BAM files and the merged assembly to only the Y chromosome, but this would have necessitated extra processing and was not required for analysis in Ballgown.
Next, we carried out experiments designed to represent realistic differential expression scenarios; usually some, but not all, transcripts are truly differentially expressed between populations. We evaluated differential expression results from Ballgown and Cuffdiff2 (versions 2.0.2 and 2.2.1) on two publicly available clinical data sets (Supplementary Note 4). The first clinical experiment27 compared lung adenocarcinoma (n = 12) and normal control samples (n = 12) from nonsmoking female patients. The second experiment28 compared cells at five developmental stages; we analyzed the data from two stages: embryonic stem cells (n = 34) and preimplantation blastomeres (n = 78). On these data sets, the P-value distributions from the linear model tests implemented in Ballgown were reasonable, as were the P-value distributions from Cuffdiff2 version 2.2.1, though Cuffdiff2 2.2.1 was more conservative: it did not identify as many transcripts as differentially expressed as Ballgown. Results from Cuffdiff2 version 2.0.2 (downloaded from the InSilico DB database29) showed noticeable conservative bias (Supplementary Fig. 5). We also carried out two simulation studies using data simulated with the Polyester package30 that demonstrated improved sensitivity and specificity estimates for Ballgown compared with Cuffdiff2 (Supplementary Note 5; Supplementary Fig. 6).
Ballgown offers researchers the flexibility to explore the effects of using alternative expression measurements for analysis. There are two major classes of statistical methods for differential expression analysis of RNA-seq: those based on RPKMs or FPKMs, as exemplified by Cufflinks; and those based on counting the reads overlapping specific regions, as exemplified by DESeq11 and edgeR11. Tablemaker outputs both FPKM estimates from Cufflinks and average coverage of each exon, intron and transcript. We investigated the effect of expression measurement using both simulated data and the GEUVADIS data set, and we confirmed that, as expected, differential expression results obtained using average coverage and using FPKM were strongly correlated (Supplementary Note 6; Supplementary Fig. 7). This suggests that coverage—an expression measurement that is easier to estimate the FPKM—is potentially a viable alternative expression metric for use in differential expression analyses.
One advantage of the Ballgown framework over Cuffdiff2 is the option either to compare any nested set of models for differential expression or to apply standard differential expression tools in Bioconductor, such as the limma package8. To demonstrate the flexibility of linear models like those in Ballgown or limma, we carried out two popular analyses that have not been possible with standard transcriptome assembly and differential expression tools: modeling of continuous covariates and eQTL analysis.
In the first analysis, we treated RNA integrity number (RIN)31 as a continuous covariate (Storey et al., 2005, ref. 32) and used Ballgown’s modeling framework to discover transcripts in the GEUVADIS data set24 whose expression levels were significantly associated with RIN (Supplementary Note 7). Of 43,622 assembled transcripts with average FPKM above 0.1, 19,203 showed a significant effect (q < 0.05) of RIN on expression, as determined using a natural cubic spline model for RIN and adjusting for population and library size33.
A previous analysis of the GEUVADIS data modeled variation in RNA-quality as a linear effect23. We fit a model with a linear RIN effect and population and library size adjustments to each transcript and identified an enrichment of transcripts with a positive correlation between FPKM values and RNA quality (Supplementary Fig. 8). To investigate the impact of using a more flexible statistical model to detect RIN artifacts, we tested whether applying a cubic polynomial fit for RIN on transcript expression was significantly better than simply including a linear term for RIN after adjusting for population. We compared the cubic and linear fits on 43,622 transcripts with average FPKM > 0.1 across all samples. We found that the cubic fit was significantly better than the linear fit (q < 0.05) for 1,499 of the 43,622 transcripts (Fig. 1c,d), suggesting that flexible nonlinear models may be helpful when measuring the relationship between quantitative covariates and transcript abundance levels.
To further illustrate the flexibility of using the postprocessed Ballgown data for differential expression analysis, we next carried out an eQTL analysis of the 464 non-duplicated GEUVADIS samples across all populations (Supplementary Note 8). We removed transcripts with an average FPKM across samples <0.1 and removed single-nucleotide polymorphisms (SNPs) with a minor allele frequency <5%, resulting in 7,072,917 SNPs and 44,140 transcripts. We constrained our analysis to search for cis-eQTLs, where the genotype and transcript pairs were within 1,000 kb of each other, resulting in 218,360,149 SNP-transcript pairs. We adjusted for the first three principal components of the genotype data34 and the first three principal components of the observed transcript FPKM data35 in the eQTL model fits. The analysis was performed in 2 hours and 3 minutes on a standard desktop computer using the MatrixEQTL package36. Visual inspection of the distribution of statistically significant results and corresponding QQ plot indicated that our confounder adjustment was sufficient to remove major sources of bias (Supplementary Fig. 9). We identified significant eQTL at the false discovery rate (FDR) 1% level for 17,276 transcripts overlapping 10,524 unique Ensembl-annotated genes. We calculated a global estimate of the number of null hypotheses and estimated that 5.8% of SNP-transcript pairs showed differential expression. In our list of significant transcript eQTLs, 57% and 78% of the SNP-transcript pairs were called significant in the original analysis of the EUR and YRI populations24, respectively. 14% of eQTL pairs were identified for transcripts that did not overlap Ensembl annotated transcripts (Fig. 1e,f).
On the basis of the above results, we conclude that the linear model differential expression testing framework built into Ballgown or limma provides computational benefits over Cuffdiff2 and EBSeq. Our timing results (Supplementary Note 9; Supplementary Fig. 10) also suggest that Ballgown is less computationally intensive than either Cuffdiff2 or EBSeq in addition to providing the flexibility and accuracy advantages detailed above. Ballgown reduces the computational burden of differential expression analysis of assembled transcriptomes without imposing a price in terms of accuracy.
Ballgown can function as a bridge between upstream assembly tools, such as Cufflinks, and downstream statistical modeling tools in Bioconductor. The Ballgown suite includes functions for interactive exploration of the transcriptome assembly, visualization of transcript structures and feature-specific abundances for each locus and post hoc annotation of assembled features to annotated features. Direct availability of feature-by-sample expression tables makes it easy to apply alternative differential expression tests or to evaluate other statistical properties of the assembly, such as dispersion of expression values across replicates or genes. The Tablemaker preprocessor writes the tables directly to disk, and they can be loaded into R with a single function call. The Ballgown and Tablemaker software packages are available from Bioconductor and GitHub (Supplementary Note 10), and code and data from the analyses presented here are available on GitHub (Supplementary Note 11).
Supplementary Material
Acknowledgments
The authors would like to thank P.A.C. ’t Hoen and T. Lappalainen for providing QC data and assistance with contacting ArrayExpress. They would also like to acknowledge C. Trapnell for helpful conversations about Cufflinks architecture and results. J.T.L., G.P. and B.L. were partially supported by US National Institutes of Health 1R01GM105705, and A.C.F. is supported by a Hopkins Sommer Scholarship.
Footnotes
Note: Any Supplementary Information and Source Data files are available in the online version of the paper.
COMPETING FINANCIAL INTERESTS
The authors declare no competing financial interests.
References
- 1.Mortazavi A, Williams BA, McCue K, Schaeffer L, Wold B. Nat Methods. 2008;5:621–628. doi: 10.1038/nmeth.1226. [DOI] [PubMed] [Google Scholar]
- 2.Trapnell C, et al. Nat Biotechnol. 2010;28:511–515. doi: 10.1038/nbt.1621. [DOI] [PMC free article] [PubMed] [Google Scholar]
- 3.Grabherr MG, et al. Nat Biotechnol. 2011;29:644–652. doi: 10.1038/nbt.1883. [DOI] [PMC free article] [PubMed] [Google Scholar]
- 4.Gentleman RC, et al. Genome Biol. 2004;5:R80. doi: 10.1186/gb-2004-5-10-r80. [DOI] [PMC free article] [PubMed] [Google Scholar]
- 5.Dermitzakis M, Getz G, Ardlie K, Guigo R, GTEx Consortium Bits of DNA. 2013 https://liorpachter.wordpress.com/author/edermitzakis/
- 6.Pertea M, et al. Nat Biotechnol. 2015;33:290–295. doi: 10.1038/nbt.3122. [DOI] [PMC free article] [PubMed] [Google Scholar]
- 7.Li B, Dewey CN. BMC Bioinformatics. 2011;12:323. doi: 10.1186/1471-2105-12-323. [DOI] [PMC free article] [PubMed] [Google Scholar]
- 8.Smyth GK. In: Bioinformatics and Computational Biology Solutions Using R and Bioconductor. Gentleman R, Carey V, Huber W, Irizarry R, Dudoit S, editors. Springer; 2005. pp. 397–420. [Google Scholar]
- 9.Law CW, Chen Y, Shi W, Smyth GK. Genome Biol. 2014;15:R29. doi: 10.1186/gb-2014-15-2-r29. [DOI] [PMC free article] [PubMed] [Google Scholar]
- 10.Robinson MD, McCarthy DJ, Smyth GK. Bioinformatics. 2010;26:139–140. doi: 10.1093/bioinformatics/btp616. [DOI] [PMC free article] [PubMed] [Google Scholar]
- 11.Anders S, Huber W. Genome Biol. 2010;11:R106. doi: 10.1186/gb-2010-11-10-r106. [DOI] [PMC free article] [PubMed] [Google Scholar]
- 12.Chen Y, McCarthy D, Robinson M, Smyth GK. edgeR: differential expression analysis of digital gene expression data User’s Guide. 2011 doi: 10.1093/bioinformatics/btp616. http://www.bioconductor.org/packages/release/bioc/vignettes/edgeR/inst/doc/edgeRUsersGuide.pdf. [DOI] [PMC free article] [PubMed]
- 13.Trapnell C, et al. Nat Protoc. 2012;7:562–578. doi: 10.1038/nprot.2012.016. [DOI] [PMC free article] [PubMed] [Google Scholar]
- 14.Leng N, et al. Bioinformatics. 2013;29:1035–1043. doi: 10.1093/bioinformatics/btt087. [DOI] [PMC free article] [PubMed] [Google Scholar]
- 15.Langmead B, Trapnell C, Pop M, Salzberg SL. Genome Biol. 2009;10:R25. doi: 10.1186/gb-2009-10-3-r25. [DOI] [PMC free article] [PubMed] [Google Scholar]
- 16.Kim D, et al. Genome Biol. 2013;14:R36. doi: 10.1186/gb-2013-14-4-r36. [DOI] [PMC free article] [PubMed] [Google Scholar]
- 17.Trapnell C, et al. Nat Biotechnol. 2013;31:46–53. doi: 10.1038/nbt.2450. [DOI] [PMC free article] [PubMed] [Google Scholar]
- 18.Lister R, et al. Science. 2013;341:1237905. doi: 10.1126/science.1237905. [DOI] [PMC free article] [PubMed] [Google Scholar]
- 19.Young RS, et al. Genome Biol Evol. 2012;4:427–442. doi: 10.1093/gbe/evs020. [DOI] [PMC free article] [PubMed] [Google Scholar]
- 20.Lister R, et al. Nature. 2011;471:68–73. doi: 10.1038/nature09798. [DOI] [PMC free article] [PubMed] [Google Scholar]
- 21.Djebali S, et al. Nature. 2012;489:101–108. doi: 10.1038/nature11233. [DOI] [PMC free article] [PubMed] [Google Scholar]
- 22.Graveley BR, et al. Nature. 2011;471:473–479. doi: 10.1038/nature09715. [DOI] [PMC free article] [PubMed] [Google Scholar]
- 23.C’t Hoen AP, Friedländer MR, Almlöf J. Nature. 2013;31:1015–1022. doi: 10.1038/nbt.2702. [DOI] [PubMed] [Google Scholar]
- 24.Lappalainen T, et al. Nature. 2013;501:506–511. doi: 10.1038/nature12531. [DOI] [PMC free article] [PubMed] [Google Scholar]
- 25.Storey JD, Tibshirani R. Proc Natl Acad Sci USA. 2003;100:9440–9445. doi: 10.1073/pnas.1530509100. [DOI] [PMC free article] [PubMed] [Google Scholar]
- 26.Frazee AC, Sabunciyan S, Hansen KD, Irizarry RA, Leek JT. Biostatistics. 2014;15:413–426. doi: 10.1093/biostatistics/kxt053. [DOI] [PMC free article] [PubMed] [Google Scholar]
- 27.Kim SC, et al. PLoS ONE. 2013;8:e55596. doi: 10.1371/journal.pone.0055596. [DOI] [PMC free article] [PubMed] [Google Scholar]
- 28.Yan L, et al. Nat Struct Mol Biol. 2013;20:1131–1139. doi: 10.1038/nsmb.2660. [DOI] [PubMed] [Google Scholar]
- 29.Coletta A, Molter C, Duqué R, Steenhoff D. Genome Biol. 2012;13:R104. doi: 10.1186/gb-2012-13-11-r104. [DOI] [PMC free article] [PubMed] [Google Scholar]
- 30.Frazee AC, Jaffe AE, Langmead B, Leek J. bioRxiv. 2014 http://biorxiv.org/content/biorxiv/early/2014/06/06/006015.full.pdf.
- 31.Schroeder A, et al. BMC Mol Biol. 2006;73 doi: 10.1186/1471-2199-7-3. [DOI] [PMC free article] [PubMed] [Google Scholar]
- 32.Storey JD, et al. PNAS. 2005;102:12837–12842. doi: 10.1073/pnas.0504609102. [DOI] [PMC free article] [PubMed] [Google Scholar]
- 33.Paulson JN, Stine OC, Bravo HC, Pop M. Nat Methods. 2013;10:1200–1202. doi: 10.1038/nmeth.2658. [DOI] [PMC free article] [PubMed] [Google Scholar]
- 34.Price AL, et al. Nat Genet. 2006;38:904–909. doi: 10.1038/ng1847. [DOI] [PubMed] [Google Scholar]
- 35.Leek JT, Storey JD. PLoS Genet. 2007;3:1724–1735. doi: 10.1371/journal.pgen.0030161. [DOI] [PMC free article] [PubMed] [Google Scholar]
- 36.Shabalin AA. Bioinformatics. 2012;28:1353–1358. doi: 10.1093/bioinformatics/bts163. [DOI] [PMC free article] [PubMed] [Google Scholar]
Associated Data
This section collects any data citations, data availability statements, or supplementary materials included in this article.