Abstract
Purpose
The goal was to amplify the effects of magnetization exchange between γ-ATP and inorganic phosphate (Pi) for evaluation of ATP synthesis rates in human skeletal muscle.
Methods
The strategy works by simultaneously inverting the 31P resonances of PCr and ATP using a wide bandwidth, adiabatic inversion RF pulse followed by observing dynamic changes in intensity of the non-inverted Pi signal versus the delay time between the inversion and observation pulses. This band inversion technique significantly delays recovery of γ-ATP magnetization and consequently the exchange reaction, Pi ↔ γ-ATP, is readily detected and easily analyzed.
Results
The ATP synthesis rate measured from high-quality spectral data using this method was 0.073 ± 0.011 s−1 in resting human skeletal muscle (N = 10). The T1 of Pi was 6.93 ± 1.90 s, consistent with the intrinsic T1 of Pi at this field. The apparent T1 of γ-ATP was 4.07 ± 0.32 s, about 2-fold longer than its intrinsic T1 due to storage of magnetization in PCr.
Conclusion
Band inversion provides an effective method to amplify the effects of magnetization transfer between γ-ATP and Pi. The resulting data can be easily analyzed to obtain the ATP synthesis rate using a 2-site exchange model.
Keywords: skeletal muscle, magnetization transfer, ATP, chemical exchange, T1 relaxation time
INTRODUCTION
There is long-standing interest in measuring ATP synthesis rates in vivo by use of 31P magnetization transfer methods (1–6). Recent studies using 31P saturation transfer (ST), one subset of magnetization transfer methods, suggest that the inorganic phosphate (Pi) ↔ ATP exchange may be sensitive to age, insulin resistance, type 2 diabetes and other metabolic disorders in skeletal muscle (7–13). ST operates by irradiation of γ-ATP with a frequency-selective RF pulse or pulse train resulting in a reduced Pi signal through chemical exchange mediated by ATPase (2). Since the Pi ↔ ATP exchange rate is relatively slow in vivo, prolonged irradiation of γ-ATP is essential to detect significant changes in Pi using ST. Some have expressed concerns that the unidirectional Pi → ATP rate measured by ST is too large when compared to rates estimated by other complimentary methods (see reviews (1,2,14) and the references therein). This disparity has been attributed to contributions from Pi ↔ ATP exchange reactions other than oxidative phosphorylation (1,14) and added effects due to small metabolite pools hidden under the ATP signals (15) that may be activated by prolonged ST pulses. To clarify this issue, an alternative method is needed that is sensitive to the slow exchange rate but insensitive to potential contaminations from exchanges that may be occurring among smaller NMR invisible pools.
Recently, we reported an approach termed exchange kinetics by inversion transfer (EKIT) that used frequency-selective inversion pulses rather than prolonged saturation pulses (16). In resting human skeletal muscle, we observed magnetization transfer between Pi and γ-ATP as expected, but surprisingly we also observed exchanges between Pi and phosphocreatine (PCr). This observation was not anticipated since the phosphate group of PCr does not exchange with Pi directly. The phenomenon was attributed to a relayed magnetization transfer effect due to sequential exchanges mediated by creatine kinase (CK) and ATPase. This suggests that PCr, a metabolite present in skeletal muscle at much higher concentrations and with a longer T1 than γ-ATP, can temporarily store the inverted magnetization and transfer it to γ-ATP. Furthermore, quite significant exchanges attributed to cross relaxation were detected between γ-ATP and the other phosphates of ATP (16). Together, these observations suggest that the small but physiologically important magnetization transfer effect between γ-ATP and Pi could potentially be amplified by co-inversion of PCr and all ATP resonances.
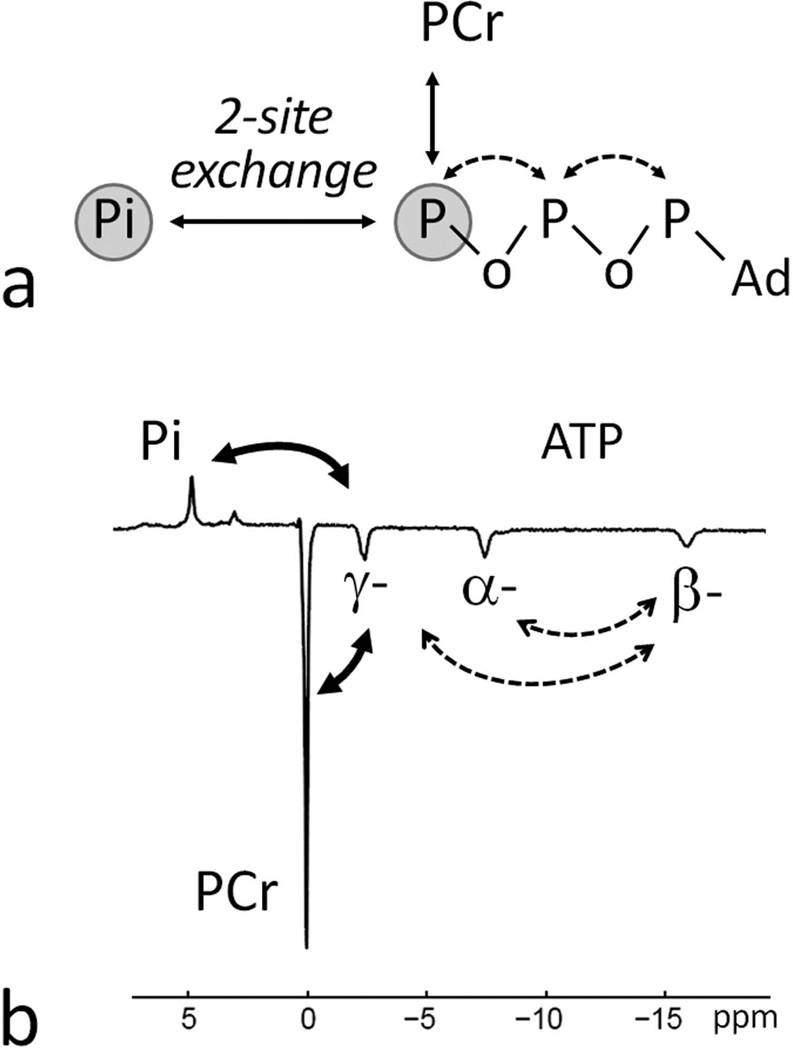
To test this concept, we used a trapezoid-shaped adiabatic pulse for inversion of all ATP resonances plus PCr without exciting Pi or the phosphodiesters (PDE). This technique termed “exchange kinetics by band inversion transfer” or EBIT, was applied to evaluate ATP synthesis rates in resting human skeletal muscle at 7T. The kinetic rate constant kPi→γATP was extracted from the 31P MRS data using a 2-site exchange model involving Pi and γ-ATP (Figure 1). The magnetization transfer effect between Pi and γ-ATP is amplified multiple times upon co-inversion of PCr and all phosphates of ATP, as compared to selective inversion of γ-ATP.
FIG. 1.
Possible 31P magnetization transfer pathways in skeletal muscle. (a) A simplified 2-site exchange model for evaluation of the ATP synthesis reaction Pi → γ-ATP using EBIT sequence with co-inversion of PCr and ATP spins. Through chemical exchange or NOE, all inverted spins contribute to the apparent exchange between Pi and γ-ATP. (b) A 7T 31P MR spectrum acquired from human calf muscle using the EBIT sequence for band inversion of PCr and ATP signals showing the pathways of magnetization transfer between inverted and non-inverted 31P signals. Abbreviation: Pi, Inorganic phosphate; PCr, phosphocreatine; ATP, adenosine triphosphate; Ad, adenosine. Chemical exchange, marked as solid arrows; dipolar cross-relaxation (NOE), marked as dashed arrows.
METHODS
Theory
For any given spin system, in the absence of an applied B1 field, the time-dependent Z-magnetization Mz (for clarity, the subscript “z” is omitted hereafter) is described by:
| [1] |
in which Mo denotes the Z-magnetization at Boltzmann thermal equilibrium at t → ∞; A is a n-by-n matrix describing the NMR properties of spin relaxation and exchange of the n-spin system. Assume the spin system undergoes a perturbation at t = 0 with an initial Z-magnetization M(0) then the magnetization of the system evolves with t by
| [2] |
For a two spin system comprised of Pi and γ-ATP in chemical exchange:
| [3] |
the 2 × 2 spin matrix A is given by:
| [4] |
For a five spin system comprised of Pi, PCr, α-, β- and γ-ATP with multiple magnetization exchange pathways (including both chemical exchanges and cross-relaxation (NOE)), one must also include equation [5],
| [5] |
so the 5 × 5 spin matrix A can be described by:
| [6] |
in which the forward and reverse pseudo first-order rate constants k (chemical exchange) and σ (cross-relaxation) are related by
| [7] |
and
| [8] |
If one considers this spin system after applying an inversion-recovery pulse sequence (180° – tD – 90° – τ), in which tD is the delay time after the inversion pulse and τ is the duration of magnetization recovery following the 90° readout pulse, then the Z-magnetization for each spin immediately following the inversion pulse is given by:
| [9] |
where fi is the coefficient of the fractional inversion (−1 ≤ f ≤ 1; f = −1 for full inversion, and f = 1 if a given spin is not affected by the inversion).
Following inversion, the Z-magnetization evolves with the delay time (tD), and equation [2] becomes equation [10]:
| [10] |
M(tD) is detected by applying a non-selective readout pulse at the end of the tD period.
Thus, for a non-inverted spin, any deviation of M(tD) from Mo reflects the exchange effects that is developed in tD period due to inversion of other spins. In this study, the normalized signal of Pi (M(tD)/Mo or mz(tD)) is plotted against the delay time tD to detect exchanges between Pi and γ-ATP after band inversion of PCr, α- β- and γ-ATP. To calculate the exchange rate constant, kPi→γ-ATP, from the mz(tD) versus tD data, a 2-site exchange model for Pi and γ-ATP was used (equations [3,4]). This was compared to the results from fitting the mz(tD) versus tD data acquired for Pi, PCr, α- β- and γ-ATP using a 5-site exchange model (Equations [5,6]).
Human Subjects
The protocol was approved by the Institutional Review Board of the University of Texas Southwestern Medical Center. Prior to the MRS study, informed written consent was obtained from all participants. Ten subjects (6 male and 4 female), aged 28 ± 4 yr and BMI 24 ± 2, participated the study. All subjects were in good general health with no history of peripheral vascular, systemic or myopathic diseases. To avoid possible exercise-associated physiological variations among subjects, all subjects were asked to refrain from any physical activity of moderate or high intensity for 24 hours prior to the study, and subjects sat at rest for 20 minutes prior to the scan. Heart rate and blood oxygen saturation levels were monitored during the scan. The study was well-tolerated by all subjects.
MRS Protocol
All subjects were positioned feet-first and supine in the MRI scanner (7T Achieva, Philips Healthcare, Cleveland, OH), with the right calf muscle positioned parallel to the magnetic field and directly on the detection coil (Philips Healthcare, Cleveland, OH). The coil was a partial volume, double-tuned 1H/31P quadrature TR coil consisting of two tilted, partially overlapping 10 cm loops for 31P detection. The center of the coil was positioned approximately 1/3 of the distance along the leg from the knee to the heel. Axial, coronal, and sagittal T2-weighted turbo spin echo images were acquired for voxel planning. Typical imaging parameters included field-of-view 180 × 180 mm (FOV), repetition time (tR) 2 s, echo time (TE) 75 ms, turbo factor 16, in-plane spatial resolution 0.6 × 0.7 mm2, slice thickness 4 mm, gap 2 mm, bandwidth 517 Hz, number of acquisitions (NA) one, and acquisition time 1.2 min. 2nd order 1H-based automatic volume shimming was applied prior to 31P spectral acquisitions.
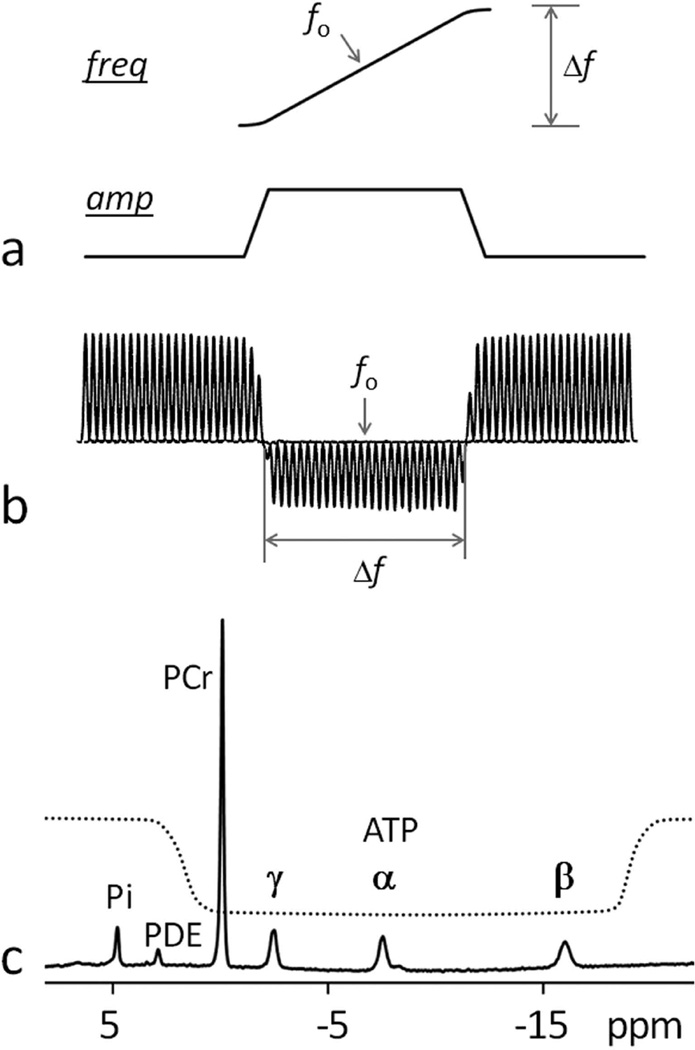
The EBIT sequence (180° – tD – 90° – τ) consisted of an adiabatic inversion pulse (Figure 2a) followed by a variable post-inversion delay time tD, a hard 90° readout pulse, and a recovery period τ, beginning with FID sampling. FID-based 31P spectra were acquired from calf muscle for each subject with a constant tR of 30 sec, 4 averages, 4 K sampling points zero-filled to 8 K prior to FT, and at 12 delay times (tD = 30, 626, 1253, 1923, 2641, 3414, 4252, 5167, 6174, 7294, 8556 and 10000 msec). The total data acquisition time for the tD series was 24 min. A fully-relaxed 31P NMR spectrum was also acquired using a single pulse without inversion for measurements, from which the concentration of each 31P metabolites was evaluated using the area of γ-ATP signal as an internal reference (5.5 mmol/kg wet weight). Intra-session data reproducibility was tested on two subjects by repeating the same EBIT sequence after re-entry into the scanner during the same scan session.
FIG. 2.
Illustration of the EBIT inversion pulse and its inversion profile. Panel (a) shows a trapezoid-shaped adiabatic pulse with inversion bandwidth Δf and center frequency fo. Panel (b) illustrates the measured excitation profile with inversion bandwidth Δf = 2500 Hz, data acquired with frequency step 100 Hz from a phosphate phantom sample in aqueous solution. In panel (c) a 31P MR spectrum acquired at 7T from human calf muscle illustrates the spectral coverage of the inversion profile. Note that PCr and ATP signals are within the inversion window while Pi and PDE signals are excluded. Abbreviation: freq, frequency; amp, amplitude; Pi, Inorganic phosphate; PCr, phosphocreatine; ATP, adenosine triphosphate; PDE, phosphodiester.
The band-inversion pulse was a short trapezoid-shaped adiabatic pulse (pulse width pw = 42 msec, including 7 msec of pre- and post-ramp time), maximal B1 11.5 µT, inversion bandwidth of 2500 Hz, and centered at 150 Hz upfield from α-ATP at −7.5 ppm. The excitation profile of the band-inversion pulse was pre-determined using a methyl phosphate phantom in aqueous solution (volume 3 liters, cylinder-shaped, 2 g/L), by stepwise shifting the center (fo) of the inversion band (bandwidth Δf = 2500 Hz) across a broad frequency region (± 3600 Hz) in 100 Hz step. A short crusher pulse (3 ms) was applied at the end of the tD period prior to the readout pulse to eliminate residual transverse magnetization. The readout pulse was 0.22 ms rectangular-shaped pulse with a nominal B1 of 59 µT, with the transmitter frequency centered at 700 Hz upfield from the resonance of PCr.
To investigate the effect of inversion bandwidth on the magnetization exchange effect between Pi and γ-ATP, a separate experiment was also conducted on two subjects by applying the same shaped inversion pulse but with varied pw and B1 level so that inversion band width Δf was changed from 2500 Hz (inverting PCr and ATP) to 700 Hz (to invert both PCr and γ-ATP) to to 400 Hz (to invert just γ-ATP). For inversion band widths of Δf 400 and 700 Hz, the B1 level was 1.85 and 3.24 µT, and the corresponding pw value was 270 and 153 ms, respectively. The center frequency was adjusted accordingly. Again, a total of 12 spectra were collected from each subject with the inversion delay time varied within a 10 sec range. The chemical shifts of all 31P metabolites were referenced to PCr at 0 ppm. Gaussian apodization (6 Hz) was applied to each FID prior to Fourier transformation using the scanner software (SpectroView, Philips Healthcare) and the kinetic data were analyzed using Matlab (Mathworks) routines.
31P Spectral Analysis
Signal post-processing, curve fitting of m(tD) ~ tD data, and statistics were done in Matlab (The Mathworks, Natick, MA). The 31P NMR data acquired at each of the 12 delay times were fitted to two different models: 1) a two-site exchange model that included only Pi and γ-ATP with kPi→ATP and T1 relaxation time of Pi and γ-ATP as unknowns; 2) a five-site model including all five spins (Pi, PCr, ATP α-, β- and γ spins) with the following unknowns kPi→ATP, kPCr→ATP, σα↔βATP, σβ↔γATP and T1 relaxation times for Pi, PCr, ATP α-, β- and γ spins. The fitting was based on Equation [10] using an exponential matrix algorithm and a nonlinear least-squares algorithm (Matlab function lsqcurvefit) to minimize the sum of squared difference between experimental and calculated Z-magnetizations, m(tD).
The delay time at which Pi signal reaches a minimum due to exchange from γ-ATP, together with the corresponding normalized magnetization for Pi and γ-ATP, were evaluated from the 2×2 matrix form of Equation [10] (Matlab function fminsearch). The fractional inversion coefficient f for the band inversion adiabatic pulse was determined from the m(tD) ~ tD curve extrapolated to tD = 0 (see Equation [10], Theory Section): −0.86 ± 0.04 (PCr), −0.65 ± 0.05 (γ-ATP), −0.60 ± 0.05 (α-ATP) and −0.48 ± 0.03 (β-ATP).
Statistical Analysis
All data are reported as mean ± standard deviation, calculated using Excel. The coefficient of variations (CV) in T1,Pi and kPi→γ-ATP were evaluated by σ(T1)/T1 and σ(k)/k, respectively.
RESULTS
Inversion profile and spectrum by EBIT sequence
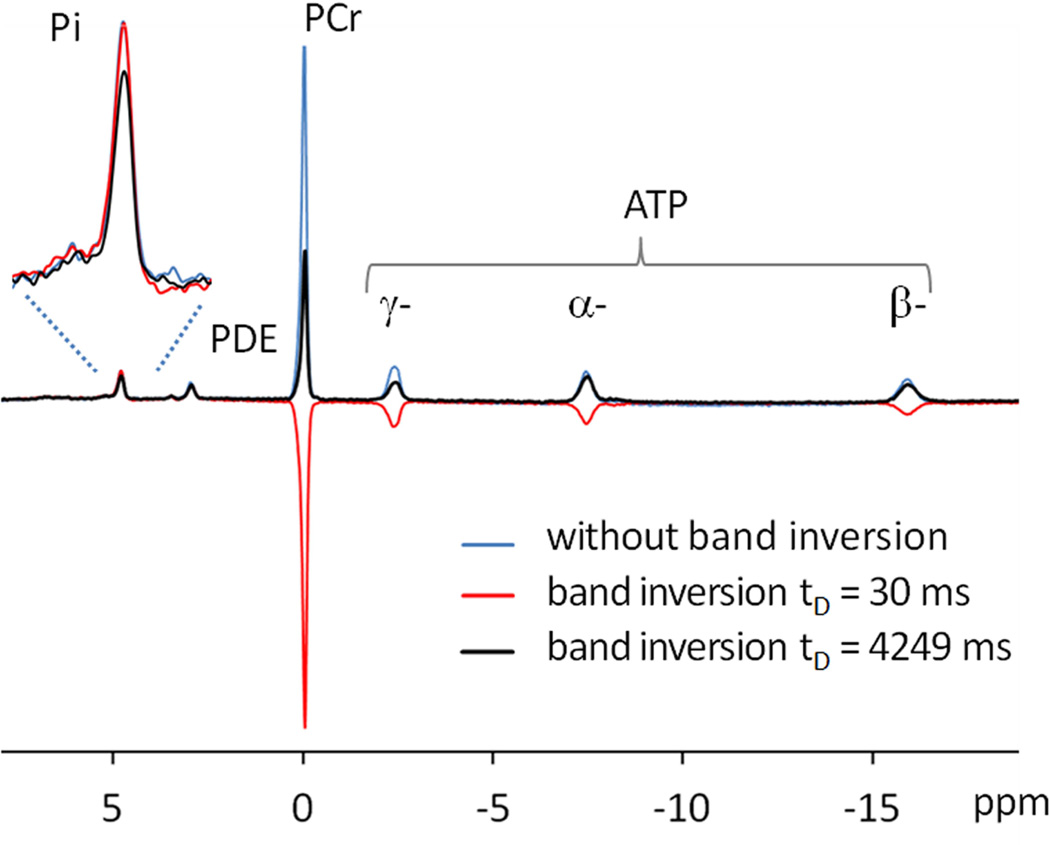
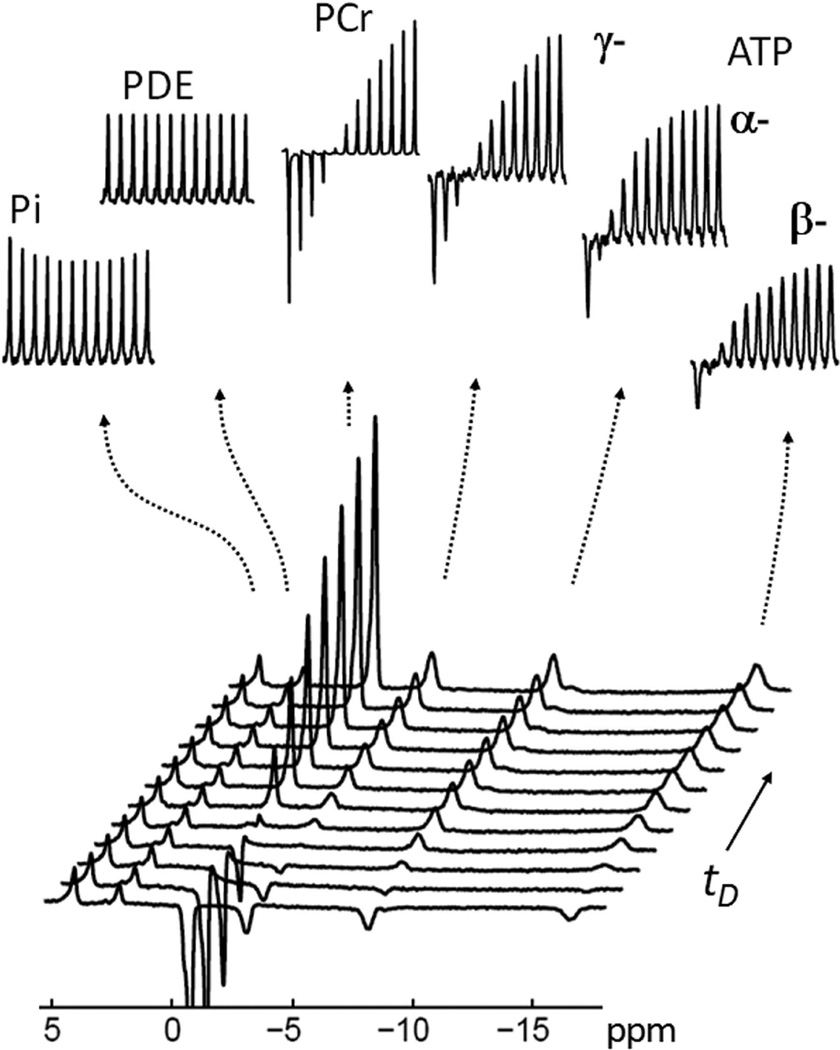
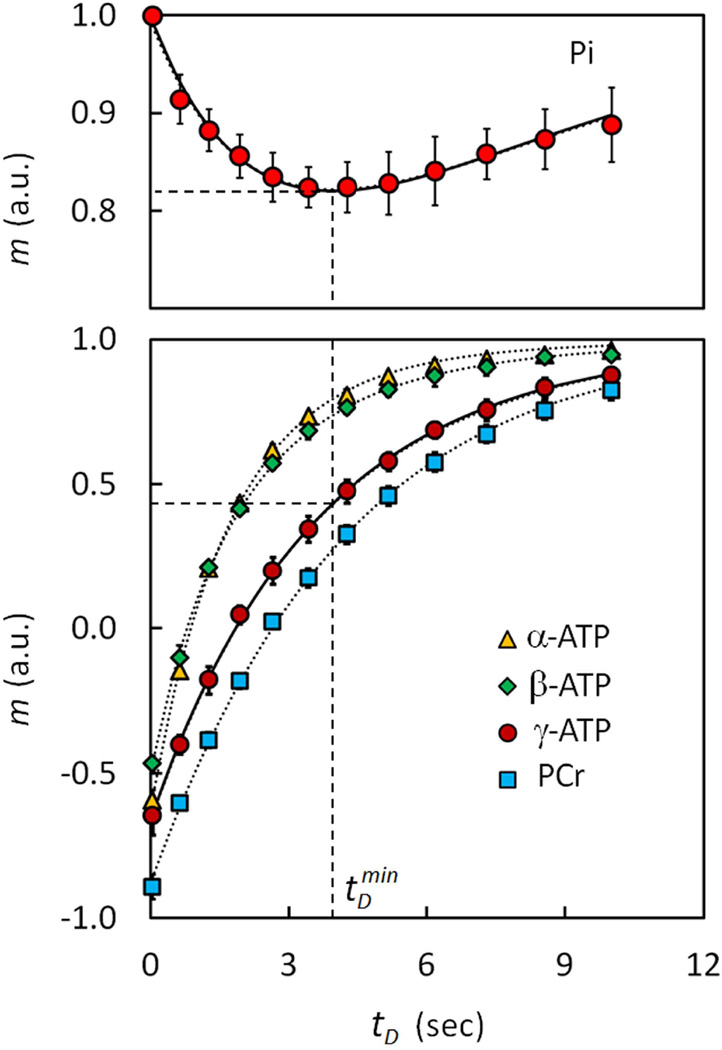
The trapezoid-shaped inversion pulse using in the EBIT sequence (illustrated in Figure 2) provides a uniform inversion pulse that spans 2500 Hz. This bandwidth proved suitable for inverting all 31P resonances from PCr to β-ATP (~ 2000 Hz at 7T) leaving the downfield Pi and phosphodiester (PDE) signals out of the inversion window (Figure 2c and Figure 3). There was no measurable difference in the intensity of Pi signal at 4.9 ppm before and immediately after the band inversion, unless the inversion delay time tD was increased (Figure 3). A typical 31P MR spectral series acquired using the EBIT sequence shown in Figure 4 was collected from resting calf muscle of a healthy male (27-year old, BMI 25 kg/m2). The Pi signal at 4.9 ppm was sensitive to the delay time tD exactly as anticipated from a classical inversion transfer experiment (Figure 4). A minimum in the intensity of Pi signal occurred with tD ~ 3.4 – 4.2 s, with a mz(tD) value of ~82%, relative to Mo (Figure 4). In contrast, the nearby PDE signal at 2.9 ppm, which is also outside of the inversion window, was constant and independent of tD (Figures 4 and 5). These spectral features were observed for all subjects in the group (N = 10, Figure 5a) with high intra-session reproducibility (Figure 5b). Unlike the 31P signals of Pi and PDE, each of the inverted signals (PCr, α-, β- and γ-ATP) recovered exponentially with tD (Figure 6). Among these 31P resonances, the α- and β-ATP signals recovered the fastest (mz(tD): ≥ 97% at tD = 10 s), while the recovery of γ-ATP and PCr signal was considerably slower (mz(tD): < 84% at tD = 10 s). Importantly, the recovery curves for γ-ATP and PCr were similar, in sharp contrast to their large differences in intrinsic T1 relaxation times (1.7 s for γ-ATP vs. 5.3 s for PCr, ref [16]).
FIG. 3.
Representative 31P MR spectra acquired from resting human calf muscle at 7 T using a single pulse without inversion (blue trace) and using EBIT sequence with delay time tD at 30 ms (red trace) and at 4249 ms (black trace). All spectra were collected with TR = 30 sec and NA = 4 with identical y-scale.
FIG. 4.
A typical 31P MR spectral series acquired with EBIT using various delay times tD. The insets show the individual stacked plots of Pi, PDE, PCr, α-, β- and γ-ATP. Note the characteristic pattern of Pi signal change versus tD upon inversion recovery of PCr, α-, β- and γ-ATP. The evolution of the Pi signal is in sharp contrast to the PDE signal which remains constant for all values of tD. The data were collected from resting calf muscle of a healthy male (27-year old, BMI 25 kg/m2). All inset signals were enlarged 4 times vertically except for PCr which was reduced twofold for easy comparison. Inversion delay times tD = 30, 626, 1253, 1923, 2641, 3414, 4252, 5167, 6174, 7294, 8556 and 10000 msec. Abbreviation: Pi, Inorganic phosphate; PCr, phosphocreatine; ATP, adenosine triphosphate; PDE, phosphodiester.
FIG. 5.
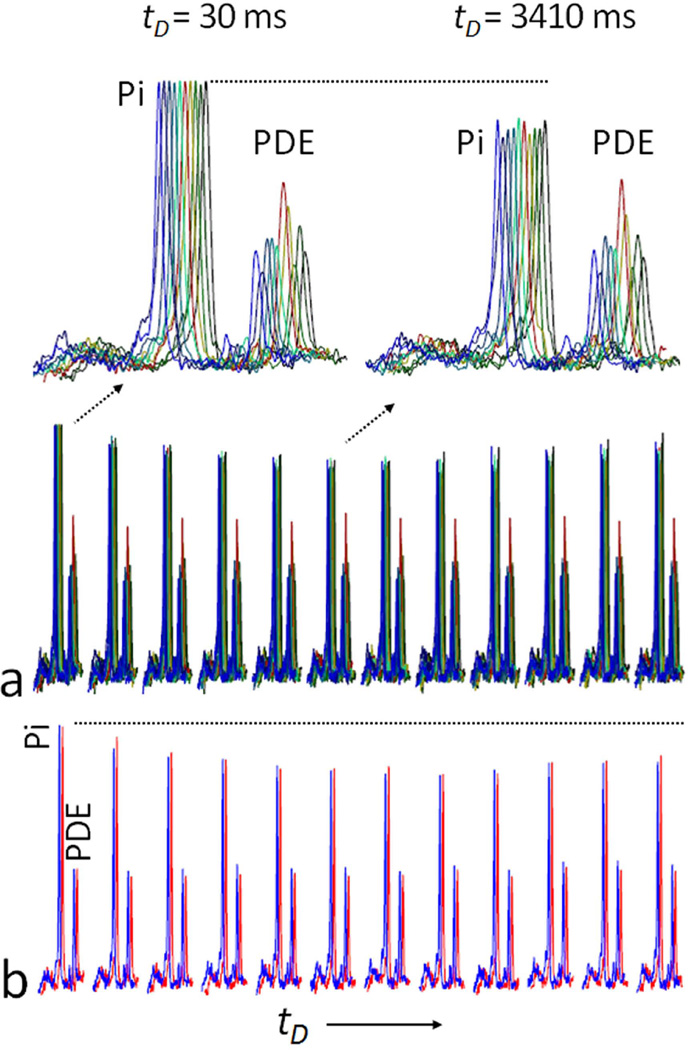
Variability in the intensity of Pi between subjects. Panel (a) shows the variation of EBIT data among all 10 subjects. After scaling to the baseline Pi signal, there was some variability in PDE among subjects. At a tD of ~ 3.4 seconds, the Pi signal was substantially reduced in all subjects with no detectable effect on PDE. Panel (b) shows one example of intra-session reproducibility of EBIT data acquisition during a repeated scans (red and blue traces) for the same subject. Inversion delay time tD = 30, 626, 1253, 1923, 2641, 3414, 4252, 5167, 6174, 7294, 8556 and 10000 msec. Abbreviation: Pi, Inorganic phosphate; PCr, phosphocreatine; ATP, adenosine triphosphate; PDE, phosphodiester.
FIG. 6.
Normalized Z-magnetizations versus delay time tD. Data are shown for Pi, PCr and ATP metabolites in resting human muscle (averaged for 10 subjects). The solid curves in the plots represent the data fitting using the 2-site model for the exchange reaction Pi ↔ γ-ATP; the dotted curves represent the fitting results using 5-site exchange model including Pi, PCr, α-, β- and γ-ATP. The recovery of γ-ATP is similar to PCr rather than to the recovery curves for α- and β-ATP. The dashed lines mark the maximum MT effect, occurring at delay time tDmin = 4.07 s. Abbreviation: Pi, Inorganic phosphate; PCr, phosphocreatine; ATP, adenosine triphosphate.
EBIT data fitting
To evaluate the rate constant, kPi→γ-ATP, each dynamic data set was fitted using a 2-site exchange model (Equations [3,4]). The fitted curves agree well with the experimental data for both Pi and γ-ATP (solid curves, Figure 6). In comparison, each EBIT data set was also fit using the 5-site exchange model including Pi, PCr, α-, β- and γ-ATP (dotted curves, Figure 6). The derived kinetic and NMR parameters for the two models are summarized in Table 1. For the group of subjects studied (N = 10 subjects), on average there is virtually no difference in kPi→γ-ATP between these two models (kPi→γ-ATP = 0.073 ± 0.011 s−1 for 2-site model vs 0.071 ± 0.010 s−1 for 5-site model). The fitted T1 relaxation times obtained for the two models were similar for Pi (6.93 ± 1.90 by 2-site model vs 6.55 ± 1.46 by 5-site model) but was significantly different for γ-ATP (4.07 ± 0.12 s by 2-site model vs 1.97 ± 0.14 s by 5-site model). The intra- and inter-subject variability in kPi→γ-ATP and T1,Pi as measured by coefficient of variation (CV) were comparable between these two models (2-site vs 5-site model: 0.12 vs 0.11 for intraCV(k); 0.15 vs 0.14 for interCV(k); 0.14 vs 0.11 for intraCV(T1), and 0.27 vs 0.22 for interCV(T1)). The maximal magnetization exchange effect by EBIT was 18.3 ± 2.0%, corresponding to a tDmin value of 4.07 ± 0.37 s by 2-site model or 3.96 ± 0.39 s by 5-site model (N = 10 subjects).
Table 1.
Rate of chemical exchange (k, s−1) and cross-relaxation (σ, s−1) and 31P T1 relaxation times (s) in resting human calf muscle by band inversion at 7T (N = 10)
| Band Inversion | ||
|---|---|---|
| 2-pool Model | 5-pool Model | |
| kPi→γ-ATP | 0.073 ± 0.011 | 0.071 ± 0.010 |
| kPCr→γ-ATP | - | 0.138 ± 0.062 |
| σγ↔β-ATP | - | 0.208 ± 0.047 |
| σα↔β-ATP | - | 0.210 ± 0.051 |
| T1 (Pi) | 6.93 ± 1.90 | 6.55 ± 1.46 |
| T1 (PCr) | - | 4.63 ± 0.35 |
| T1 (γ-ATP) | 4.07 ± 0.32 | 1.97 ± 0.14 |
| T1 (α-ATP) | - | 1.34 ± 0.07 |
| T1 (β-ATP) | - | 1.02 ± 0.05 |
Narrowband vs wideband inversion
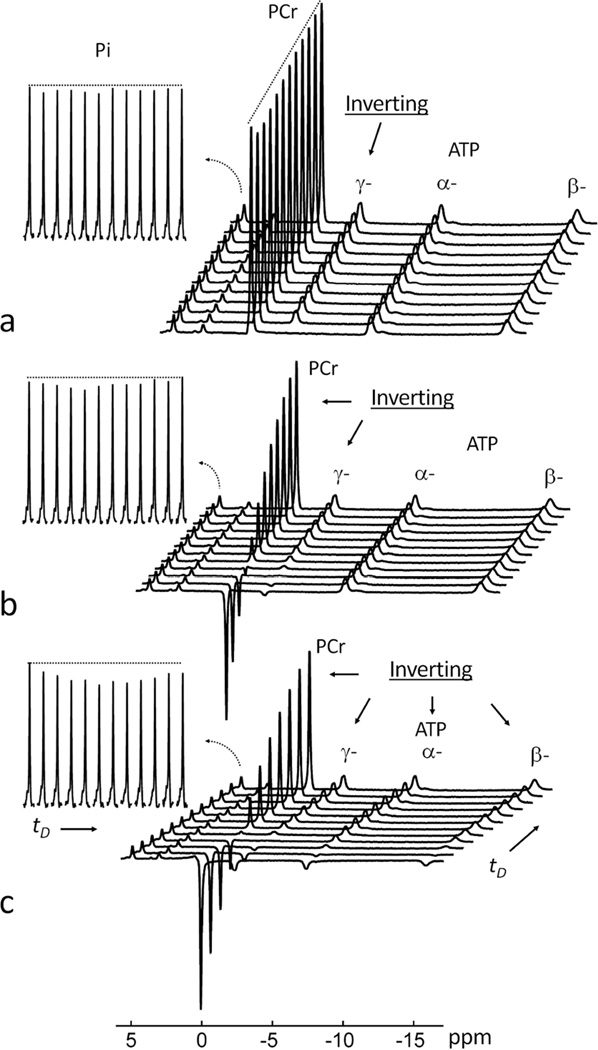
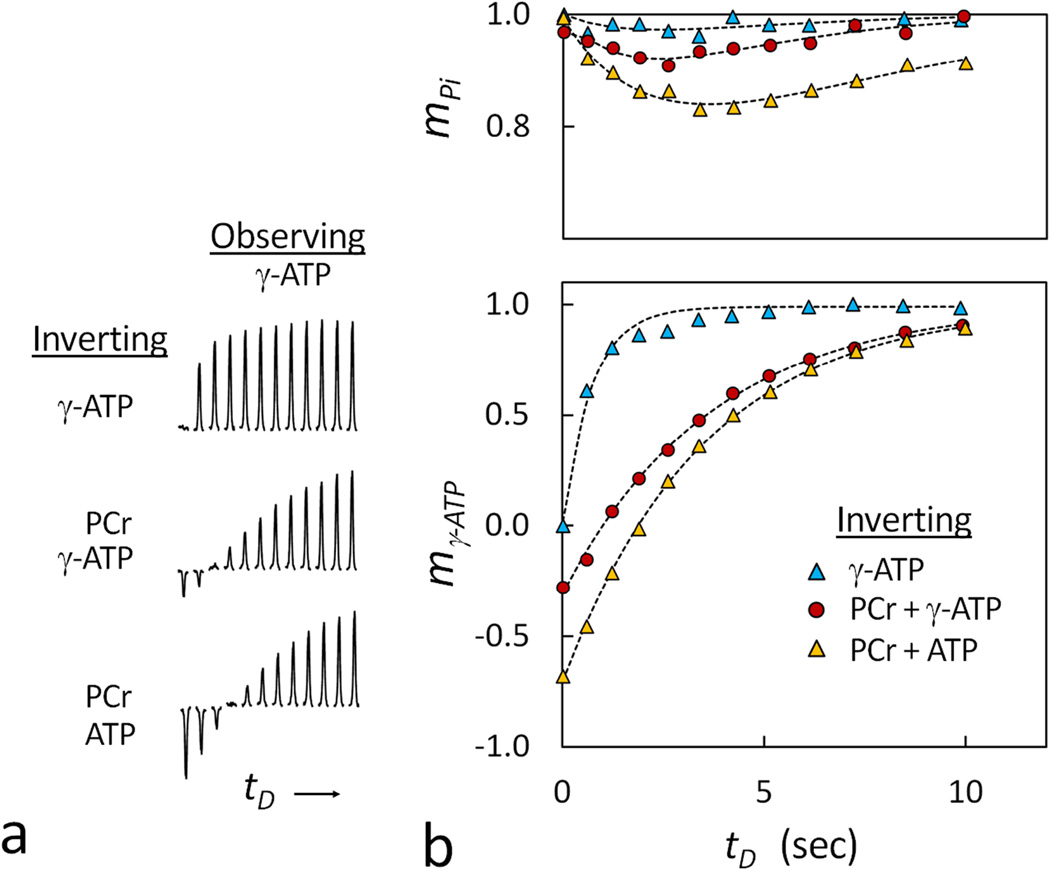
To examine the effect of inversion bandwidth on magnetization exchange (ME) between Pi and γ-ATP, the resonance of γ-ATP was inverted using three different bandwidths, Δf = 400, 700 and 2500 Hz, respectively. As shown in Figures 7 and 8, with an increase in Δf, both the magnitude of the γ-ATP fractional inversion coefficient f and ME at Pi increased (f = ~ 0%, −30% and −68%; and maximal (1 − mpi) = 3%, 8% and 16% for this particular subject). Furthermore, compared to γ-ATP inversion using narrowband (Δf = 400 Hz), the co-inversion of PCr and γ-ATP using wideband (Δf = 700 and 2500 Hz) dramatically slowed the recovery of γ-ATP (the apparent T1 = 0.66 ± 0.01 sec for Δf = 400 Hz versus 3.82 ± 0.08 sec and 3.57 ± 0.06 sec for Δf = 700 and 2500 Hz, respectively, under assumption of a mono-exponential recovery; N = 2 subjects). For the wideband inversion, the inclusion of α- and β-ATP in the inversion led to a delayed occurrence of the maximal magnetization exchange effect at Pi (tDmin = 2.6 sec for Δf = 700 Hz versus tDmin = 3.4 sec for Δf =2500 Hz, Figure 8).
FIG. 7.
The effect of the inversion bandwidth on magnetization exchange between Pi and γ-ATP at varying inversion delay times with the inversion band set to invert (a) only γ-ATP; (b) both PCr and γ-ATP; and (c) PCr, α-, β- and γ-ATP. The insets show the stacked plots of Pi, and the Pi intensity data are plotted against inversion delay time in Figure 8. Abbreviation: Pi, Inorganic phosphate; PCr, phosphocreatine; ATP, adenosine triphosphate.
FIG. 8.
(a) The stacked plots of Pi at various delay times showing the effect of the inversion bandwidth on the inversion recovery of the γ-ATP signal. (b) A comparison of ME observed at Pi upon inversion of γ-ATP (bottom) at three different inversion bandwidths. Note the much smaller magnetization exchange occurring in Pi using the narrower bandwidth (inverting only α-, β- and γ-ATP) in comparison to that using the wider bandwidths (inverting PCr and γ-ATP), and the more efficient inversion of γ-ATP when the α- and β-ATP spins are included in the wide band inversion. The raw data are from spectra in Figure 7.
DISCUSSION
Exchange-kinetics by band inversion transfer (EBIT) is presented here as a strategy to amplify the magnetization exchange effects between Pi and γ-ATP by capitalizing on the large PCr pool that is in active exchange with ATP in skeletal muscle (16,17). By simultaneous co-inversion of PCr with γ-ATP, the effect of EBIT is to slow the apparent relaxation of γ-ATP, thereby lengthening the time for buildup of ME between γ-ATP and Pi (Figures 4–8). As a tool for measuring energy metabolism, EBIT has three technically appealing features: 1) it is based on a T1 sequence readily available in clinical scanners; 2) data analysis for evaluation of the rate of ATP synthesis can be done using a simple model based on 2-site exchange between Pi and γ-ATP, circumventing the more complex 5-spin system which includes multiple exchange pathways (Figure 1); and 3) it utilizes the large pool of PCr as a magnetization buffer for γ-ATP instead of resorting to continuous RF saturation (ST), thereby lowering the SAR exposure and avoiding potential “spillover” artifacts which could gradually accumulate during a longer saturation period (18,19). Consequently, there is no need to collect control spectra with the inversion band centered on the opposite side of Pi signal as in ST. The readily-detectable 31P signal of PDE, an inert metabolite not actively involved in exchange with other high energy phosphates, provides a reliable internal reference for the effects of inversion (Figures 3–5) since the center of the band inversion is further away from Pi (4.9 ppm) than from PDE (2.9 ppm).
Moreover, as a subset of inversion transfer methods, an inherent advantage of EBIT is its larger dynamic range in Z-magnetization (theoretically Mo → -Mo for inversion transfer versus Mo → 0 for ST). In practice, the use of shaped pulses in vivo leads to a reduced inversion efficacy. Under the current experimental condition, the inversion efficacy was found to be spin-dependent, even though the inversion profile is uniform for a given spin (Figure 2). In particular, for the trapezoid-shaped adiabatic pulse with an inversion bandwidth of 2500 Hz, the order of inversion efficacy is 86% for PCr, 65% for γ-ATP, 60% for α-ATP and 48% for β-ATP (Figure 5). This suggests that inversion efficacy parallels the T2 of each spin (20), as noted previously using a hyperbolic secant-shaped inversion pulse with a narrow bandwidth of 150 Hz (16).
It has been challenging to generate a sizable reduction in Pi signal by pulsing selectively at γ-ATP (15,16,21,22) because the kinetic rate constant for conversion of Pi → γ-ATP is much slower than that for PCr → γ-ATP and the relaxation rate of Pi (1/T1,Pi) is relatively fast (~2 fold faster than kPi→γATP, Table 1). Strategies for measuring exchange between Pi → γ-ATP are quite limited, often relying on long duration (typically, 5–8 s), high power saturation pulses. In recent years, more 31P studies performed at high and ultra-high magnetic fields with the advantages of both high S/N and wide chemical shift dispersion (4,16,23–25). The longer T1 of Pi at high fields is an advantage for measuring chemical exchanges with γ-ATP. However, this is partially negated by the shorter T1 and T2 values of γ-ATP due to a larger contribution from chemical shift anisotropy (20), implying that an increased B1 power may be needed for full saturation of γ-ATP. As illustrated here, co-inversion of PCr and γ-ATP provides an effective way for EBIT to overcome the T1 shortening of γ-ATP thereby lengthen the period for the magnetization to exchange between Pi and γ-ATP.
Quantitatively, when co-inverted with PCr, γ-ATP relaxes 2.4-fold slower than its intrinsic T1 (1.70 s, ref(16)), and ~ 5–6-fold slower in comparison to when γ-ATP is selectively inverted (Figures 7 and 8). This increase in the apparent T1 of γ-ATP contributes to the observed ~ 5–6-fold enhancement in ME between γ-ATP and Pi (~ 16 – 18 % by wide-band inversion of PCr and ATP, Figures 4 – 6) as compared to the narrow-band inversion of only γ-ATP (~ 3 %, Figure 8). Conceptually, the co-inverted PCr serves as a buffer to replenish the smaller pool of inverted γ-ATP. In effect, co-inversion serves the same purpose as continuous irradiation of γ-ATP in ST, except that in ST, an external RF source is employed to continuously reduce the Mz of γ-ATP. Both α- and β-ATP spins are included with PCr and γ-ATP in band inversion. There is a strong 31P cross-relaxation effect within ATP (16,26) so inclusion of α- and β-ATP permits more efficient inversion of γ-ATP (the magnitude of fractional inversion coefficient f was increased from 30% to 68%, Figures 7 and 8), providing additional time for ME to buildup between Pi and γ-ATP (tDmin was increased by 0.8 sec, Figure 8).
Interestingly, although co-inversion of PCr, γ-ATP, α-ATP and β-ATP are critical for maximizing ME between γ-ATP and Pi, it is not obligatory to include all the inverted magnetizations in the formula for evaluation of the exchange rate constant kPi→γATP. The fitting results (Figure 6 and Table 1) demonstrate that the 2-site exchange model provides nearly identical results as the more inclusive 5-site model for measurement of kPi→γATP. This is not surprising since in the 2-site model, the effect of the three “hidden” pools (PCr, α- and β-ATP) is taken into account by the apparent T1 relaxation time of γ-ATP. As a result of this simplification, the T1 of γ-ATP obtained by fitting the data to the 2-site kinetic model (Equation [4]) represents apparent T1 rather than intrinsic T1 (4.07 s from the 2-site model vs 1.97 s from the 5-site model, Table 1). It should be noted that, for a classic 2-site inversion recovery exchange model, an analytical solution is available for the inverted and undisturbed magnetizations (27) but the mathematical expressions are rather complicated and generally nonlinear least-squares fitting of these equations must be used to evaluate the rate constant k, as demonstrated by Malloy et al. (28) and Dagani et al. (29). The present work adopted a matrix approach due to its simplicity in expression (Equations [2] and [4]), which can be solved numerically in Matlab.
With a typical S/N of 50:1 for the Pi signal, the scan time for an EBIT experiment at 7T is 24 min (for acquisition of 12 data points at varying tD’s with 4 averages), as compared to 55 min using the recently reported EKIT technique at 7T (14) and ~ 1 hr for the most widely used ST techniques (under varying acquisition conditions, ref (2)). Lengthy data acquisition times can be a limiting factor in measuring exchange kinetics in vivo (30), and efforts toward rapid collection of exchange data have been reported in vivo and in phantoms (4,30–32). Conventional steady-state ST is an alternative technique for measuring kPi→γ-ATP using two spectra (an on-resonance plus an off-resonance control) but it requires a separate measure of the T1 of Pi (2), a parameter with a relative large variation. The relatively long scan time of 30 s was used here allow for nearly full recovery of the 31P signals. Potentially, the scan time for EBIT data acquisition can be reduced, especially for those data points with short tDs. Fewer data points and/or number of averages can also shorten scan time. However, for reliable quantification of the rate of ATP synthesis and to discern small variations in kPi→γATP among different patient populations, it is essential to acquire quality data with high S/N.
The reliability and sensitivity of the EBIT approach in measurement of ME is reflected by the high reproducibility of the tD-dependent ME (Figure 5) and the significant ME effects relative to the low spectral background noise (Figures 3, 4 and 5). Admittedly, as an experiment that is based on multiple data points for evaluation of both kPi→γ-ATP and T1,Pi, EBIT likely takes more time than a typical steady-state ST experiment using two spectral data (provided that the T1 of Pi is known). In terms of variability in kPi→γ-ATP and T1,Pi, the results derived from EBIT data were similar to those reported for human calf muscle using a steady-state ST method at 7T (4). Using EBIT, a ME of ~18 % was observed in resting human skeletal muscle, comparable to a typical ST result (~ 20%) as reported by Befroy et al in their recent review (2). A more than 30% reduction of Pi signal was observed by Valkovic et al at 7T using steady-state ST (4,25). Importantly, for the group of 10 subjects studied, both the 2- and 5-site models yielded newly identical kPi→γ-ATP values (0.073 ± 0.011 s−1 by 2-site model vs 0.071 ± 0.010 s−1 by 5-site model). Similar rate constants have been reported for resting skeletal muscle by us using frequency-selective EKIT at 7T (0.05 s−1, ref(14)) and by others using ST (for example, 0.059 s−1 (soleus) and 0.057 s−1 (gastrocnemius) by Befroy et al (2)). A kPi→γ-ATP value of 0.11 s−1 was derived by Valkovič et al at 7T using steady-state ST (4,25), falling at the high end of the kPi→γ-ATP range (0.04–0.12 s−1) by ST as summarized by Kemp and Brindle (1) for muscle studies. Using the resultant kinetic constant kPi→γ-ATP and Pi concentration (2.10 mmol/kg ww), an ATP synthesis rate of 9.1 mmol/kg ww/min is derived for the reaction Pi → γ-ATP in resting human calf muscle, in agreement with the measurements reported using ST (1,3,7). Therefore, despite the fundamental difference in the mechanism by which ME is generated, both methods appear to be consistent.
It should be emphasized that the primary objective of this study was technical development of a robust IR method for measurement of the unidirectional rate of Pi → γ-ATP in vivo. The current EBIT approach is not optimized to probe both Pi ↔ γ-ATP and PCr ↔ γ-ATP reactions, since ME for this later reaction is blended with PCr T1 relaxation and therefore not as easily identified compared to ME between Pi and γ-ATP. Thus the kPCr→γATP value can only be analyzed non-intuitively by a more complex 5-site exchange model (Table 1). Furthermore, as pointed out by From and Ugurbil (14) and Kemp and Brindle (1), the resultant rate constant measured by EBIT (and by ST) may have contributions from both mitochondrial oxidative phosphorylation (through ATPase) and glycolysis (through exchanges occurring at GAPDH/phosphoglycerokinase and PFK/fructose-bis-phosphatase). Such glycolytic reactions likely contribute to the measured rate for conversion of Pi → γ-ATP because carbohydrates are known to contribute roughly 50% of total ATP energy demand for humans at rest (33). One might anticipate for muscle at rest, the contribution from glycolysis to the 31P NMR-measured Pi → γ-ATP rate would be quite low in comparison to the rate of mitochondrial ATP production (assuming O2 is not limiting). However, we observed 1H signals from both lactate and acetyl-carnitine (at 4.1 ppm and 2.12 ppm, respectively, refs (34,35)) in resting soleus muscle of normal healthy subjects (population averaged data with N = 80, ref (36)), suggesting that glycolysis compensates for limited mitochondrial oxidation perhaps due to inadequate oxygenation in mitochondrial microenvironment. This finding supports the view that the 31P NMR-measured Pi → γ-ATP rate in resting muscle exceeds estimates obtained from oxygen consumption and TCA turnover rate using tracer 13C MR methods (1,14,37). Indeed, the ATP production rate by EBIT in this study (9.1 mmol/min/kg ww) is nearly 3-fold higher than that estimated from the rate of acetyl disposal in resting human soleus muscle after moderate exercise using 1H NMR (3.2 mmol/min/kg ww, derived from data in ref (35)).
In addition to contributions from glycolytic ATP production, Balaban and Koretsky (15) suggested that small pools of metabolites, invisible in the 31P NMR spectrum due to binding to large enzyme complexes or residing in space-restricted compartments with dense protein and rich paramagnetic species, may contribute to the ST-measured Pi → γ-ATP rate due to augmentation effect of the prolonged ST irradiation. Since such species are characterized by short T2’s, they are unlikely inverted to a significant extent due to the use of the adiabatic pulse for inversion. Additionally, different from ST, there is no augment effect for small pools in EBIT since the magnetization exchanges occur in the post-inversion delay period in the absence of any applied B1 field (15). Therefore, one can expect that the EBIT-measured Pi → γ-ATP rate is essentially free from potential contamination of small NMR-invisible pools.
Under current experimental conditions, the EBIT inversion pulse is set to invert only PCr and ATP spins while leaving the downfield Pi and phosphodiester (PDE) signals out of the inversion window. This makes it possible for a reliable assignment of the tD-dependent Pi signal reduction to magnetization exchange between Pi and γ-ATP, rather than a “spillover” effect. In case the inversion pulse is felt by the Pi signal, then one could easily correct this “spillover” effect by using the f-factor as defined in Equation [9], without the need to performing a separate experiment with the band-inversion centered on the opposite of Pi, as typically required by ST.
In summary, the ATP synthesis reaction, Pi → γ-ATP, was studied in resting human skeletal muscle at 7T using a simple band-inversion pulse sequence. The resultant high-quality 31P MR spectral data with enhanced exchange effect between Pi and γ-ATP can be easily analyzed using simple 2-site exchange model. Given its good sensitivity and simplicity, it is therefore expected that EBIT could become a useful tool for studying energy metabolism in clinic settings or sports medicine with potential applications extendable to other organs such as brain and heart where abnormal ATP synthesis may be important in characterizing a disease.
Acknowledgments
The authors are grateful for the technical support from Drs. Baolian Yang and Ivan Dimitrov (Philips Medical Systems), Salvador Pena for operational assistance. Jeannie Davis and Janet Jerrow recruited and managed the human subjects. This project was supported by the National Center for Research Resources and the National Institute of Biomedical Imaging and Bioengineering of the National Institutes of Health through P41EB015908, DK081186, R37-HL-034557, P01DK058398 and RO1AR050597, Department of Defense Grant W81XWH-06-2-0046.
Footnotes
EBIT Matlab algorithms are available for research use upon request (contact: jimin.renutsouthwestern.edu).
REFERENCES
- 1.Kemp GJ, Brindle KM. What do magnetic resonance-based measurements of Pi→ATP flux tell us about skeletal muscle metabolism? Diabetes. 2012;61(8):1927–1934. doi: 10.2337/db11-1725. [DOI] [PMC free article] [PubMed] [Google Scholar]
- 2.Befroy DE, Rothman DL, Petersen KF, Shulman GI. 31P-magnetization transfer magnetic resonance spectroscopy measurements of in vivo metabolism. Diabetes. 2012;61(11):2669–2678. doi: 10.2337/db12-0558. [DOI] [PMC free article] [PubMed] [Google Scholar]
- 3.Schmid AI, Schrauwen-Hinderling VB, Andreas M, Wolzt M, Moser E, Roden M. Comparison of measuring energy metabolism by different (31) P-magnetic resonance spectroscopy techniques in resting, ischemic, and exercising muscle. Magn Reson Med. 2012;67(4):898–905. doi: 10.1002/mrm.23095. [DOI] [PubMed] [Google Scholar]
- 4.Valkovič L, Chmelík M, Just Kukurova I, Krššák M, Gruber S, Frollo I, Trattnig S, Bogner W. Time-resolved phosphorous magnetization transfer of the human calf muscle at 3 T and 7 T: a feasibility study. Eur J Radiol. 2013;82(5):745–751. doi: 10.1016/j.ejrad.2011.09.024. [DOI] [PubMed] [Google Scholar]
- 5.Brindle KM, Blackledge MJ, Challiss RA, Radda GK. 31P NMR magnetization-transfer measurements of ATP turnover during steady-state isometric muscle contraction in the rat hind limb in vivo. Biochemistry. 1989;28(11):4887–4893. doi: 10.1021/bi00437a054. [DOI] [PubMed] [Google Scholar]
- 6.Shoubridge EA, Briggs RW, Radda GK. 31P NMR saturation transfer measurements of the steady state rates of creatine kinase and ATP synthetase in the rat brain. FEBS Lett. 1982;140(2):289–292. doi: 10.1016/0014-5793(82)80916-2. [DOI] [PubMed] [Google Scholar]
- 7.Petersen KF, Befroy D, Dufour S, Dziura J, Ariyan C, et al. Mitochondrial dysfunction in the elderly: Possible role in insulin resistance. Science. 2003;300:1140–1142. doi: 10.1126/science.1082889. [DOI] [PMC free article] [PubMed] [Google Scholar]
- 8.Petersen KF, Dufour S, Shulman GI. Decreased insulin-stimulated ATP synthesis and phosphate transport in muscle of insulin-resistant offspring of type 2 diabetic parents. PLoS Med. 2005;2(9):e233. doi: 10.1371/journal.pmed.0020233. [DOI] [PMC free article] [PubMed] [Google Scholar]
- 9.Lowell BB, Shulman GI. Mitochondrial dysfunction and type 2 diabetes. Science. 2005;307:384–387. doi: 10.1126/science.1104343. [DOI] [PubMed] [Google Scholar]
- 10.Szendroedi J, Schmid AI, Chmelik M, Toth C, Brehm A, et al. Muscle Mitochondrial ATP Synthesis and Glucose Transport/Phosphorylation in Type 2 Diabetes. PLoS Med. 2007;4(5):e154. doi: 10.1371/journal.pmed.0040154. [DOI] [PMC free article] [PubMed] [Google Scholar]
- 11.Petersen KF, Dufour S, Befroy D, Garcia R, Shulman GI. Impaired mitochondrial activity in the insulin-resistant offspring of patients with type 2 diabetes. N Engl J Med. 2004;350:664–671. doi: 10.1056/NEJMoa031314. [DOI] [PMC free article] [PubMed] [Google Scholar]
- 12.Lebon V, Dufour S, Petersen KF, Ren J, Jucker BM, et al. Effect of triiodothyronine on mitochondrial energy coupling in human skeletal muscle. J Clin Invest. 2001;108:733–737. doi: 10.1172/JCI11775. [DOI] [PMC free article] [PubMed] [Google Scholar]
- 13.Jucker BM, Dufour S, Ren J, Cao X, Previs SF, Underhill B, Cadman KS, Shulman GI. Assessment of mitochondrial energy coupling in vivo by 13C/31P NMR. Proc Natl Acad Sci U S A. 2000;97(12):6880–6884. doi: 10.1073/pnas.120131997. Erratum in: Proc Natl Acad Sci U S A 2001;98(6):3624. [DOI] [PMC free article] [PubMed] [Google Scholar]
- 14.From AH, Ugurbil K. Standard magnetic resonance-based measurements of the Pi→ATP rate do not index the rate of oxidative phosphorylation in cardiac and skeletal muscles. Am J Physiol Cell Physiol. 2011;301(1):C1–C11. doi: 10.1152/ajpcell.00345.2010. [DOI] [PMC free article] [PubMed] [Google Scholar]
- 15.Balaban RS, Koretsky AP. Interpretation of 31P NMR saturation transfer experiments: what you can't see might confuse you. Focus on "Standard magnetic resonance-based measurements of the Pi→ATP rate do not index the rate of oxidative phosphorylation in cardiac and skeletal muscles". Am J Physiol Cell Physiol. 2011;301(1):C12–C15. doi: 10.1152/ajpcell.00100.2011. [DOI] [PMC free article] [PubMed] [Google Scholar]
- 16.Ren J, Yang B, Sherry AD, Malloy CR. Exchange kinetics by inversion transfer: Integrated analysis of the phosphorous metabolite kinetics exchanges in resting human skeletal muscle at 7T. Magn Reson Med. 2014 Apri; doi: 10.1002/mrm.25256. [Epub ahead of print]. [DOI] [PMC free article] [PubMed] [Google Scholar]
- 17.Balaban RS, Kanto HL, Ferretti JA. In vivo flux between phosphocreatine and adenosine triphosphate determined by two-dimentional phosphorous NMR. J Biol Chem. 1983;258(21):12787–12789. [PubMed] [Google Scholar]
- 18.Kingsley PB, Monahan WG. Corrections for off-resonance effects and incomplete saturation in conventional (two-site) saturation-transfer kinetic measurements. Magn Reson Med. 2000;43(6):810–819. doi: 10.1002/1522-2594(200006)43:6<810::aid-mrm6>3.0.co;2-j. [DOI] [PubMed] [Google Scholar]
- 19.Baguet E, Roby C. Off-Resonance Irradiation Effect in Steady-State NMR Saturation Transfer. J Magn Reson. 1997;128(2):149–160. doi: 10.1006/jmre.1997.1230. [DOI] [PubMed] [Google Scholar]
- 20.Bogner W, Chmelik M, Schmid AI, Moser E, Trattnig S, Gruber S. Assessment of (31)P relaxation times in the human calf muscle: a comparison between 3 T and 7 T in vivo. Magn Reson Med. 2009;62(3):574–582. doi: 10.1002/mrm.22057. [DOI] [PubMed] [Google Scholar]
- 21.Koretsky AP, Basus VJ, James TL, Klein MP, Weiner MW. Detection of exchange reactions involving small metabolite pools using NMR magnetization transfer techniques: relevance to subcellular compartmentation of creatine kinase. Magn Reson Med. 1985;2(6):586–594. doi: 10.1002/mrm.1910020610. [DOI] [PubMed] [Google Scholar]
- 22.Brindle KM. NMR methods for measuring enzyme kinetics in vivo. Progress in NMR Spectroscopy. 1988;20:257–293. [Google Scholar]
- 23.Lei H, Ugurbil K, Chen W. Measurement of unidirectional Pi to ATP flux in human visual cortex at 7 T by using in vivo 31P magnetic resonance spectroscopy. Proc Natl Acad Sci U S A. 2003;100(24):14409–14414. doi: 10.1073/pnas.2332656100. [DOI] [PMC free article] [PubMed] [Google Scholar]
- 24.Du F, Zhu XH, Qiao H, Zhang X, Chen W. Efficient in vivo 31P magnetization transfer approach for noninvasively determining multiple kinetic parameters and metabolic fluxes of ATP metabolism in the human brain. Magn Reson Med. 2007;57(1):103–114. doi: 10.1002/mrm.21107. [DOI] [PubMed] [Google Scholar]
- 25.Valkovič L, Bogner W, Gajdošík M, Považan M, Kukurová IJ, Krššák M, Gruber S, Frollo I, Trattnig S, Chmelík M. One-dimensional image-selected in vivo spectroscopy localized phosphorus saturation transfer at 7T. Magn Reson Med. 2014 doi: 10.1002/mrm.25058. In press. [DOI] [PubMed] [Google Scholar]
- 26.Nabuurs C, Huijbregts B, Wieringa B, Hilbers CW, Heerschap A. 31P saturation transfer spectroscopy predicts differential intracellular macromolecular association of ATP and ADP in skeletal muscle. J Biol Chem. 2010;285(51):39588–39596. doi: 10.1074/jbc.M110.164665. [DOI] [PMC free article] [PubMed] [Google Scholar]
- 27.Morris GA, Freeman R. Selective Excitation in Fourier Transform Nuclear Magnetic Resonance. 1978;29:433–462. doi: 10.1016/j.jmr.2011.08.031. [DOI] [PubMed] [Google Scholar]
- 28.Malloy CR, Sherry AD, Nunnally RL. Carbon 13 NMR measurement of flux through alanine animotransferase by inversion and saturation transfer methods. J Mag Res. 1985;64:243–254. [Google Scholar]
- 29.Degani H, Laughlin M, Campbell S, Shulman RG. Kinetics of creatine kinase in heart: a 31P NMR saturation- and inversion-transfer study. Biochemistry. 1985;24(20):5510–5516. doi: 10.1021/bi00341a035. [DOI] [PubMed] [Google Scholar]
- 30.Xiong Q, Du F, Zhu X, Zhang P, Suntharalingam P, Ippolito J, Kamdar FD, Chen W, Zhang J. ATP production rate via creatine kinase or ATP synthase in vivo: a novel superfast magnetization saturation transfer method. Circ Res. 2011;108(6):653–663. doi: 10.1161/CIRCRESAHA.110.231456. [DOI] [PMC free article] [PubMed] [Google Scholar]
- 31.Xu X, Lee JS, Jerschow A. Ultrafast scanning of exchangeable sites by NMR spectroscopy. Angew Chem Int Ed Engl. 2013;52(32):8281–8284. doi: 10.1002/anie.201303255. [DOI] [PMC free article] [PubMed] [Google Scholar]
- 32.Boutin C, Léonce E, Brotin T, Jerschow A, Berthault P. Ultrafast Z-Spectroscopy for 129Xe NMR-Based Sensors. J Phys Chem Lett. 2013;4(23):4172–4176. doi: 10.1021/jz402261h. [DOI] [PMC free article] [PubMed] [Google Scholar]
- 33.Stanley P, Brown SP, Miller WC, Eason JM. Exercise Physiology: Basis of Human Movement in Health and Disease. Baltimore: Lippincott Williams & Wilkins. 2005:77. [Google Scholar]
- 34.Ren J, Sherry AD, Malloy CR. Noninvasive monitoring of lactate dynamics in human forearm muscle after exhaustive exercise by (1) H-magnetic resonance spectroscopy at 7 tesla. Magn Reson Med. 2013;70(3):610–619. doi: 10.1002/mrm.24526. [DOI] [PMC free article] [PubMed] [Google Scholar]
- 35.Ren J, Lakoski S, Haller R, Sherry AD, Malloy CR. Dynamic Monitoring of Carnitine and Acetylcarnitine in the Trimethylamine Signal after Exercise in Human Skeletal Muscle by 7T lH MRS. Magn Reson Med. 2013;69(1):7–17. doi: 10.1002/mrm.24249. [DOI] [PMC free article] [PubMed] [Google Scholar]
- 36.Ren J, Dimitrov I, Sherry AD, Malloy CR. Population-averaged 7T 1H MRS Determination of Metabolites in Human Skeletal Muscle at Rest. Proceedings of the 19th Annual Meeting of ISMRM; Montreal, Canada. 2011. p. 3202. [Google Scholar]
- 37.Befroy D, Petersen K, Dufour S, Mason G, de Graaf R, Rothman D, Shulman G. Impaired mitochondrial substrate oxidation in muscle of insulin-resistant offspring of type 2 diabetic patients. Diabetes. 2007;56:1376–1381. doi: 10.2337/db06-0783. [DOI] [PMC free article] [PubMed] [Google Scholar]


