Abstract
Gallotannins containing a glucitol core, which are only produced by members of the maple (Acer) genus, are more potent α-glucosidase inhibitors than the clinical drug, acarbose. While this activity is influenced by the number of substituents on the glucitol core (e.g. more galloyl groups leads to increased activity), the mechanisms of inhibitory action are not known. Herein, we investigated ligand-enzyme interactions and binding mechanisms of a series of ‘glucitol-core containing gallotannins (GCGs)’ against the α-glucosidase enzyme. The GCGs included ginnalins A, B and C (containing two, one, and one galloyl/s, respectively), maplexin F (containing 3 galloyls) and maplexin J (containing 4 galloyls). All of the GCGs were noncompetitive inhibitors of α-glucosidase and their interactions with the enzyme were further explored using biophysical and spectroscopic measurements. Thermodynamic parameters (by isothermal titration calorimetry) revealed a 1:1 binding ratio between GCGs and α-glucosidase. The binding regions between the GCGs and α-glucosidase, probed by a fluorescent tag, 1,1′-bis(4-anilino-5-napththalenesulfonic acid, revealed that the GCGs decreased the hydrophobic surface of the enzyme. In addition, circular dichroism analyses showed that the GCGs bind to α-glucosidase and lead to loss of the secondary α-helix structure of the protein. Also, molecular modeling was used to predict the binding site between the GCGs and the α-glucosidase enzyme. This is the first study to evaluate the mechanisms of inhibitory activities of gallotannins containing a glucitol core on α-glucosidase.
Keywords: glucitol-core containing gallotannins (GCGs), maple, α-glucosidase inhibition, isothermal titration calorimetry (ITC), computational modeling
Graphical abstract
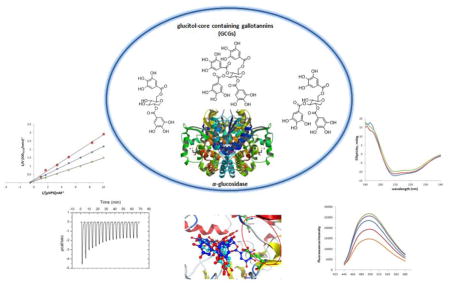
Evaluation of the mechanisms of inhibitory activities of gallotannins containing a glucitol core (GCGs) on α-glucosidase.
INTRODUCTION
In mammals, enzymes involved in the carbohydrate metabolic pathways have been the therapeutic targets for various diseases, including diabetes, cancer, and viral infections.1–3 Among these enzymes, the group of glucosidases (EC 3.2.1.20) plays a crucial role in carbohydrate metabolism by catalyzing the cleavage of glycosidic linkages of oligosaccharides or glycoconjugates to release mono-saccharides.4 Inhibition of glucosidase hinders glucose absorption and consequently decreases postprandial blood glucose levels. Development of α-glucosidase inhibitors, as a class of antidiabetic medications for type II diabetes mellitus (T2DM), has attracted significant scientific attention.5 In fact, several synthetic α-glucosidase inhibitors (AGIs), including acarbose, miglitol, and voglibose, are widely used as clinical treatment options for T2DM.6, 7 However, adherence to synthetic AGIs, as prescription medications, has suffered due to prominent undesirable adverse effects, including flatulence, diarrhea, and abdominal pain.8 In addition, the adult dose of some AGIs, for instance, acarbose, can range from 25–100 mg taken orally 3 times daily. Therefore, the utilization of natural products represents an attractive alternative to clinical drugs since they may lead to increased patient compliance. Moreover, naturally occurring AGIs, isolated from medicinal plants and medicinal foods, offer an attractive dietary strategy for T2DM management since they tend to be safe, and have fewer adverse effects than synthetic AGIs.9
The maple (Acer) genus is widely regarded for certain species including the sugar maple (Acer saccharum) and red maple (Acer rubrum) species, the sap of which are collected and concentrated to produce the natural sweetener, maple syrup.10 Interestingly, in the plant kingdom, only members of the maple (Acer) genus are reported to produce gallotannins containing a glucitol instead of a glucose core which is most commonly found in gallotannins.11–16 Our group and others have shown that these ‘glucitol-core containing gallotannins (GCGs)’ display potent α-glucosidase inhibitory properties which is influenced by the number, type, and location of substituents on their glucitol core.14–17 In addition, our group showed that a red maple bark extract, enriched in GCGs, was similar in activity as acarbose, in lowering blood glucose in an animal model.18 Therefore GCGs represent an interesting polyphenol sub-class of plant natural products which show great promise as natural AGIs.
In our group’s research efforts to identify natural AGIs, we reported on a series of new GCGs, named maplexins E-I, from the red maple (Acer rubrum) species.14–16 The GCGs feature different numbers and positions of galloyl groups attached to a 1,5-anhydro-D-glucitol core and exhibited 20-fold higher potency than acarbose which increased with the number of galloyl groups on the glucitol moiety. However, since these naturally occurring/isolated GCGs only contained three galloyl groups at the most, in an effort to broaden our test panel of GCGs, we synthesized a tetragalloylglucitol analog19 (details provided in Online Supplementary Material) assigned the common name of maplexin J. Indeed, maplexin J was found to be three times more potent than maplexins E and F (contain trigalloyls), and 70 times more potent than acarbose (see Table 1), confirming our previous SAR observations. In the current study, we have focused our attention on investigating the mechanisms of inhibitory actions of these GCGs on the α-glucosidase enzyme. This research project was also prompted, in part, by the fact that other natural AGIs, such as 1-deoxynojirimycin, resveratrol, and oxyresveratrol, show different mechanisms of action against α-glucosidase.20, 21
Table 1.
α-Glucosidase inhibitory activities of GCGs
| Compound | # of galloyl group | IC50 (μM) a | Type of inhibition |
|---|---|---|---|
| ginnalin B (GB) | 1 | > 1000 | n.d. |
| ginnalin C (GC) | 1 | > 1000 | n.d. |
| ginnalin A (GA) | 2 | 216.43 ± 3.19 | noncompetitive |
| maplexin F (MF) | 3 | 13.70 ± 0.87 | noncompetitive |
| maplexin J (MJ) | 4 | 4.27 ± 0.13 | noncompetitive |
| acarbose b | — | 142.40 ± 1.68 | competitive |
IC50 values are shown as mean ± S.D. from three independent experiments;
Positive control; n.d. = not determined.
The mechanisms of inhibition of compounds on the α-glucosidase enzyme can be investigated by several biophysical methods including binding domains, modifications of hydrophobic surfaces, and secondary structural conformational changes of enzymes induced by binding ligands.21 In this study, enzymatic kinetics and biophysical tools, including isothermal titration calorimetry (ITC), fluorescence, and circular dichroism (CD) spectroscopic methods, were used to elucidate the inhibitory mechanisms of the GCGs against the α-glucosidase enzyme. Computational manipulation of homology modeling and molecular docking were performed to support the prediction of binding actions between the GCGs and the α-glucosidase enzyme.
EXPERIMENTAL SECTION
Chemicals
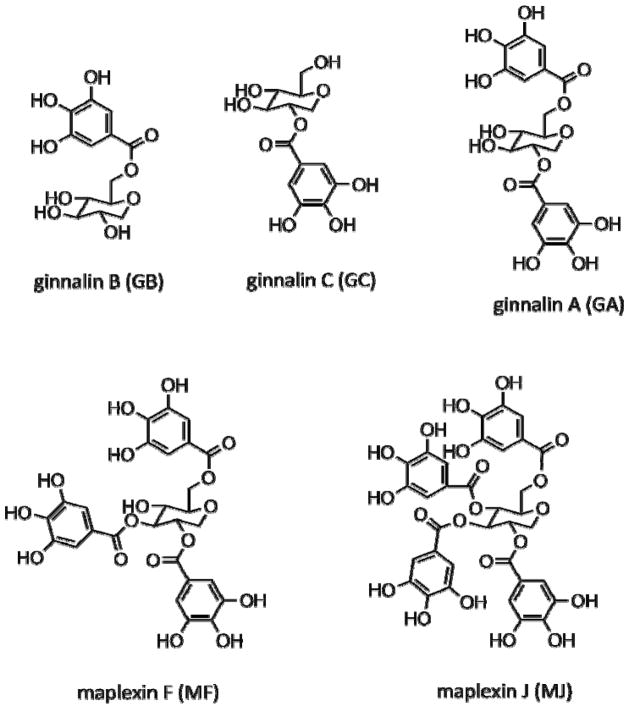
α-Glucosidase (EC 3.2.1.20) from Saccharomyces cerevisiae, p-Nitrophenyl-α-D-glucopyranoside (pNPG), and bis-8-anilinonaphthalene-1-sulfonate (bis-ANS) were purchased from Sigma Aldrich (St. Louis, MO). All other chemicals were analytical reagent grade and were purchased from Sigma Aldrich, unless otherwise specified. The naturally occurring GCGs (Figure 1): ginnalin A (GA; contains two galloyls), ginnalin B (GB; contains one galloyl), ginnalin C (GC; contains one galloyl) and maplexin F (MF; contains three galloyls) were isolated from the red maple species as previously reported.14, 15 Maplexin J (MJ; contains four galloyls) was synthesized in our laboratory according to modifications of a previously published method19 [details provided in Online Supporting Material].
Figure 1.
Chemical structures of five ‘glucitol core containing gallotannins (GCGs)’: ginnalin A, ginnalin B, ginnalin C, maplexin F and maplexin J.
Measurements of α-glucosidase inhibitory assay
A mixture of 50 μL test samples and 100 μL 0.1 M phosphate buffer (pH 6.9) containing yeast α-glucosidase solution (1.0 U/ml) were incubated in 96-well plates at 25 °C for 10 minutes. After pre-incubation, 50 μL of 5 mM p-nitrophenyl-α-D-glucopyranoside solution in 0.1 M phosphate buffer (pH 6.9) were added to each well at timed intervals. The reaction mixtures were incubated at 25 °C for 5 minutes. Before and after incubation, absorbance was recorded at 405 nm by a micro-plate reader (SpectraMax M2, Molecular Devices Corp., operated by SoftmaxPro v.4.6 software, Sunnyvale, CA) and compared to that of the control which had 50 μL buffer solutions in place of the samples. The α-glucosidase inhibitory activity was expressed as inhibition % and was calculated as: Inhibition% = 100 × [(C5 − C0) − (S0 − S0)] / (C5 − C0), where C0 is the absorbance of the reagent blank in 0 minute, S0 the absorbance of the samples in 0 minute, C5 the absorbance of the reagent blank in 5 minutes, and S5 the absorbance of the samples in 5 minutes.22
Kinetics of α-glucosidase inhibition
The inhibition types of ginnalin A (GA), maplexin F (MF), and maplexins J (MJ) were determined from Lineweaver–Burk plots, using previously reported methods with minor modifications.23 Typically, two concentrations around the IC50 values of each sample were chosen (ranging from 2 – 250 μM). For each concentration, α-glucosidase activities were tested by using different concentrations of pPNP glycoside (1 to 1000 μM). The mixtures of the enzyme and the inhibitor were dissolved in 50 mM phosphate buffer (pH 6.8), and pre-incubated at room temperature for 30 minutes, and then the substrate was added. The enzymatic reaction was carried out at room temperature for 60 seconds, and monitored spectrophotometrically by measuring the absorbance at 405 nm. Inhibition types of the inhibitors were determined by Double-reciprocal plots.
Titration microcalorimetry
Isothermal titration calorimetry (ITC), used to determine the thermodynamic properties between the GCGs and α-glucosidase, were measured with a VP-ITC
Microcalorimeter (MicroCal, Northampton, MA, USA) according to previously reported methods with modifications.24 A typical titration experiment consisted of 17 consecutive injections at 240 s intervals consisting of 14 μL injections of each GCGs into the titration cell at 25 °C in phosphate buffer (pH 7.0, 100 mM). The titration cell was stirred continuously at 310 rpm. The GCGs (1 – 4 mM) and α-glucosidase enzyme (0.026 – 0.031 mM) were dissolved in the same phosphate buffer and degassed for 20 mins under vacuum using a ThermoVac (MicroCal, Northampton, MA, USA) prior to each experiment. Controls included buffer injected into buffer and GCGs injected into buffer solutions, respectively. Data were analyzed by using nonlinear regression with a single-site binding model in VP Viewer 2000, which uses the scientific plotting software, ORIGIN 7 (Origin Lab. Corp., Northampton, MA, USA).
Hydrophobic interactions of α-glucosidase using bis-ANS
α-glucosidase (2 μM) was incubated in the presence of various concentrations of the GCGs (0–80 μM) at 37 °C for 5 minutes. Bis-ANS (5 μM) was then added, and fluorescence was measured after incubation at 37 °C for 15 minutes (λex = 400 nm, λem = 440–600 nm).25
Circular dichroism (CD) spectroscopy
Far UV CD measurements (190–240 nm) were conducted on a Jasco J-810 spectropolarimeter equipped with a Peltier temperature controller at 25 °C. Briefly, 2 μM of α-glucosidase was treated with various concentrations of the GCGs (0–80 μM). The samples were dissolved in 200 μL of a sodium phosphate buffer (0.1 M, pH 6.8) and placed in a 1.0 mm path length cell. The spectra were collected and corrected by subtraction of a blank 0.1 M sodium phosphate buffer (pH 6.8), reducing noise and smoothing.26 The changes of secondary structure of α-glucosidase were estimated according to a method in the DichroWeb program, an online server for protein secondary structure analyses from the CD spectroscopic data.27, 28
Homology modeling of α-glucosidase
The Saccharomyces cerevisiae α-glucosidase was downloaded from the UniProt protein knowledgebase (accession number P53341).29 The structure of isomaltase from Saccharomyces cerevisiae (PDB entry 3A4A) that shared a 71.8% sequence identity and 87.1% sequence similarity with Saccharomyces cerevisiae α-glucosidase based on National Center for Biotechnology Information Basic Local Alignment Search Tool (NCBI BLAST) search results was selected as the template for homology modeling. Sequence alignment and structural model building were performed using DS 3.5 (Discovery Studio, version 3.5, Accelrys, Inc., San Diego, CA, USA). Ten initial 3D α-glucosidase structures were constructed and sorted in ascending order of PDF total energy score. The best structure with the most negative score was selected for further refinements.
Refinement of 3D α-glucosidase structure
Molecular dynamics (MD) simulation is widely used for both homology and X-ray structural refinement.30, 31 The initial best 3D α-glucosidase structure from homology modeling was refined through MD simulations using Amber12.32 The initial structure was solvated in an octahedron periodic box (based on the TIP3P model) with 12 Å of water along each dimension. The protein was applied with the Amber ff99SB force field and counterions were added to the system to neutralize charges.33
MD simulations consisted of energy minimization, heat phase, equilibration, and production. The solvated system was minimized by three steps. First, a harmonic constraint potential of 10 kcal/mol/Å2 was applied to all atoms except water molecules. Second, the protein backbone atoms were restrained with a force of 5.0 kcal/mol/Å2. Finally, all atoms were allowed to move freely. In each step, energy minimization was executed by the steepest descent method for the first 2000 steps and the conjugated gradient method for the subsequent 2000 steps. After minimization, the system was gradually heated in the canonical “NVT ensemble” from 0 to 300 Kelvin (K) in 100 picoseconds (ps) using a Langevin thermostat with a coupling coefficient of 1.0 ps with a force constant 10 kcal/mol/Å2 on the protein. The system was then equilibrated for the first two 500 ps and subsequent three 200 ps at 300 K with decreasing restraint weights reduced from 10 to 0.2 kcal/mol/Å2. A production simulation run for 10 ns was lastly performed at 300 K. During the MD simulations, the long-range Coulombic interactions were handled using the particle mesh Ewald (PME) method and the cutoff distance for the long-range van der Waals (vdW) energy term was set at 10.0 Å.34 All hydrogen atoms were constrained using the “SHAKE” algorithm and the time step was set at 2 femtosecond. Coordinate trajectories were recorded every 2 ps. The refined 3D α-glucosidase structure was obtained from last snapshot of MD simulations and validated by Profiles-3D Verify module in DS 3.5.
Molecular docking
GA, MF, and MJ were optimized using MMFF94s force field. The refined α-glucosidase structure from MD simulations was protonated based on amber99 force field after removing water molecules. To obtain the most plausible binding sites, we searched the whole 3-D space of the receptors, including both the active-site (Asp214, Glu276 and Asp349) and non-active-site regions. Site Finder module encoded in MOE (MOE 2010.10. Chemical Computing Group, Inc. Montreal, Canada) was employed for detecting potential ligand binding sites of α-glucosidase. MOE-docking was employed to identify the binding poses of GA, MF, MJ and α-glucosidase. During docking study, 30 poses per compound were retained. All docked poses of GA, MF, and MJ were ranked on the basis of the binding docking energies according to LondondG score.35, 36 The best conformation for each compound from clustering results was chosen for binding mode analyses.
RESULTS
Comparison of α-glucosidase inhibitory effects of GCGs
As shown in Table 1, the inhibitory activities of the GCGs against the α-glucosidase enzyme increased with increasing number of galloyl groups attached to the 1,5-anhydro-D-glucitol moiety. The mono-galloyl substituted gallotannins (GB and GC) did not demonstrate any inhibitory activities on α-glucosidase (IC50 > 1000 μM), and the di-galloyl gallotannin (GA) only showed a moderate inhibitory activity with an IC50 value of 216.43 μM. However, the activities of MF and MJ, which contain three and four galloyl groups, respectively, were significantly enhanced (IC50 = 13.70 and 4.27 μM, respectively). The results indicated that MF and MJ were potent α-glucosidase inhibitors.
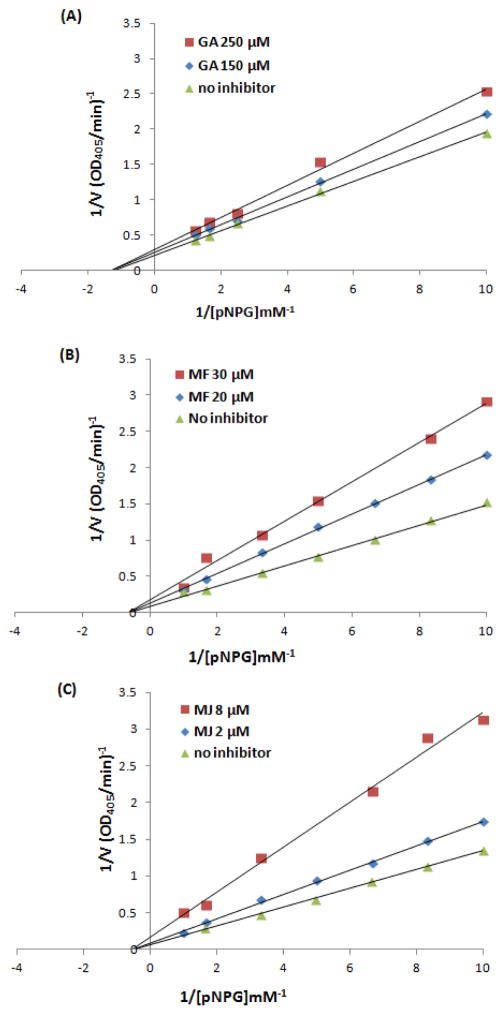
To further evaluate the inhibitory characteristics of GA, MF and MJ, enzyme kinetic assays were performed and their inhibition types were determined by the Lineweaver-Burk plots (Figure 3). The Lineweaver-Burk plot of each GCG (at different concentrations ranging from 2 – 250 μM) generated straight lines that all intersected the X-axis at the same point, suggesting that the GCGs were typical noncompetitive inhibitors of α-glucosidase. Therefore, this implied that GA, MF, and MJ bind to the noncompetitive site of the yeast’s α-glucosidase enzyme rather than to the catalytic domain of the enzyme.
Figure 3.
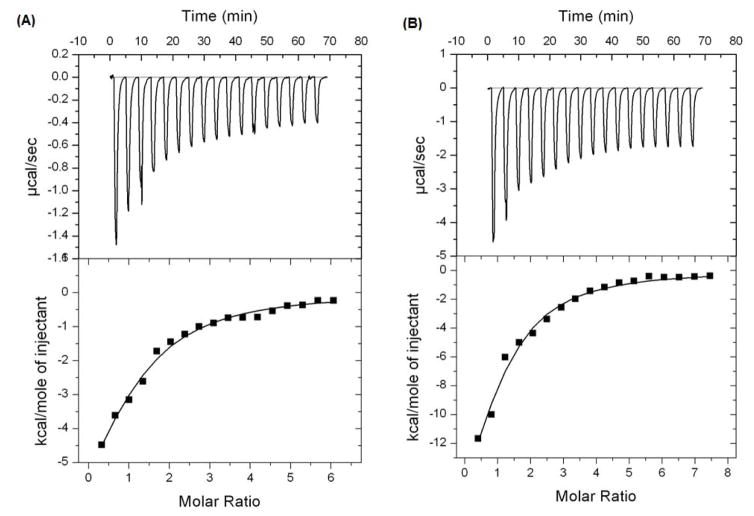
Results of isothermal titration calorimetry (ITC) for GCGs binding to α-glucosidase: (Top) Raw data plot of heat flow against time for the titration of MF (A) or MJ (B) into 0.031 mM α-glucosidase enzyme protein. (Bottom) Plot of molar enthalpy change against GCGs/α-glucosidase enzyme molar ratio.
ITC measurement
The thermodynamic properties of the binding interaction between the GCGs and α-glucosidase complex were determined by using ITC. The titration peaks of GA, GB, and GC (at concentrations ranging from 1 – 4 mM) were too weak to yield thermodynamic parameters. However, the titration peaks for MF or MJ (concentrations ranging from 1 – 2 mM) showed binding interactions that were typically exothermic (see Figure 3). The thermodynamic parameters for GA, MF, and MJ, obtained from the ITC analyses, are summarized in Table 2. Both MF and MJ had a ligand:enzyme ratio (N value) of 1:1 indicating that one molecule of each of these GCGs binds to one molecule of the enzyme.37 In addition, the binding constants (Ka) of MF or MJ with α-glucosidase were 2.85 × 10⁴ and 4.22 × 10⁴ mol−1, respectively. The stronger binding affinity of MJ with α-glucosidase, compared to that of MF and the enzyme, was in agreement with the results obtained from the α-glucosidase inhibitory assay with these GCGs (Table 1).38 The negative ΔG values for both MF and MJ (−6.09 and −6.31 kcal/mol, respectively) suggested that their binding interactions were spontaneous.38, 39 Furthermore, a positive ΔS value and a negative ΔH value for both MF and MJ indicated that their binding interactions with the α-glucosidase enzyme were enthalpy-driven.39, 40 Notably, the thermodynamic parameters observed for MF and MJ are similar to those reported for the major gallotannin present in tea, namely, epigallocatechin gallate (EGCG), with lipase.38
Table 2.
Thermodynamic parameters for GCGs [ginnalin A (GA); maplexin F (MF) and maplexin J (MJ)] binding to α-glucosidase enzyme
| Ligand | N [GCGs/α-glucosidase] | Ka[104 mol−1] | ΔG [kJ mol−1] | ΔH [kJ mol−1] | ΔS [J mol−1 K−1] |
|---|---|---|---|---|---|
| GA | n.d. | n.d. | n.d. | n.d. | n.d. |
| MF | 1.01 | 2.85 | −6.09 | −10.26 | 14.06 |
| MJ | 1.01 | 4.22 | −6.31 | −25.17 | 63.31 |
n.d.: not detected
Given that a positive ΔS value may be associated with the first stage of binding interaction,41, 42 where the ligand and enzyme are immobilized in a hydrophobic environment, we further examined the hydrophobic alteration of the α-glucosidase enzyme.
GCGs reduced the hydrophobicity of α-glucosidase
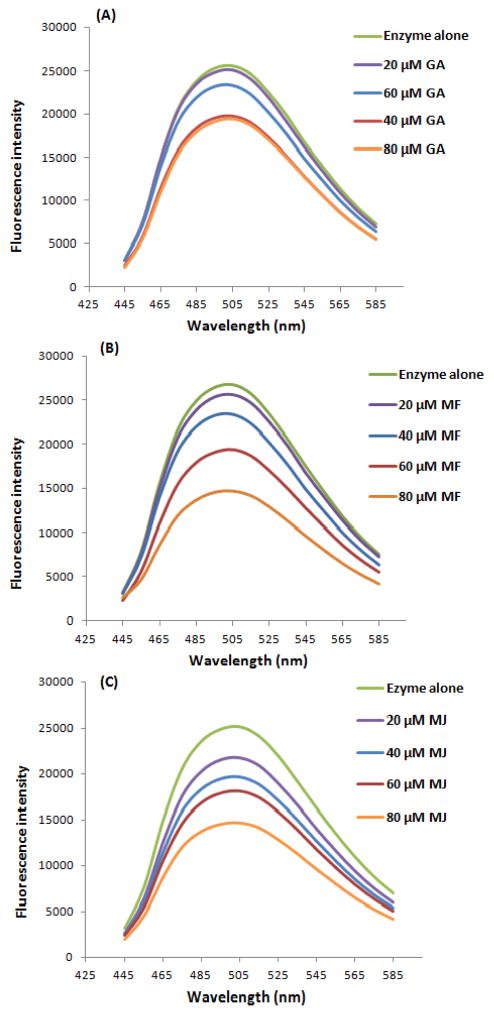
Noncovalent fluorescent probes have been extensively used for the study of protein conformation.43, 44 An external fluorescent probe such as bis-8-anilinonaphthalene-1-sulfonate (bis-ANS) is sensitive to the protein microenvironment and selectively binds to the hydrophobic surface of protein.45 Therefore, a bis-ANS probe was utilized to assess the exposure of α-glucosidase hydrophobic surface induced by the ligands. As shown in Figure 4, after being co-incubated with α-glucosidase for 20 min at 37 °C, GA, MF, and MJ were able to decrease the fluorescence of the bis-ANS-enzyme complex in a concentration-dependent manner. Although GA slightly decreased the fluorescent intensity of the bis-ANS-enzyme complex at the low concentration (20 μM), compared to the non-treatment group, the fluorescence of the MF and MJ treatment groups were significantly reduced. Moreover, all three ligands greatly decreased the fluorescence at concentration of 80 μM, suggesting that GA, MF, and MJ could decrease the hydrophobic surfaces of α-glucosidase. Since hydrophobic surface is crucial to facilitate the formation of the enzyme active site, GA, MF, and MJ could have possibly inhibited the α-glucosidase enzyme activity by inducing poor hydrophobic surfaces on the enzyme structure.46
Figure 4.
Fluorescence intensity of bis-ANS-α-glucosidase complex. The changes of fluorescence intensity were induced by GA (A), MF (B) and MJ (C) at different concentrations ranging from 20 – 80 μM.
Change in conformation of α-glucosidase induced by GCGs
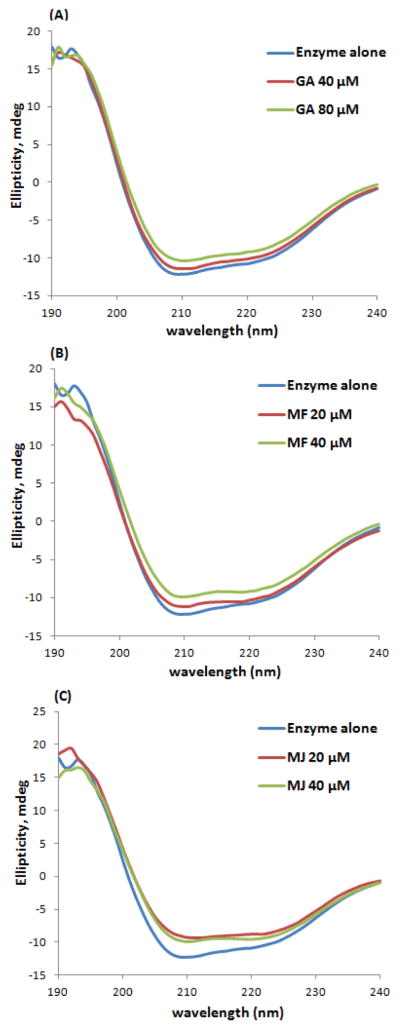
To further examine the effects of the GCGs on the secondary structure of α-glucosidase, circular dichroism (CD) spectra of free α-glucosidase and ligand-α-glucosidase complex were acquired. In Figure 5, the CD spectra of the free α-glucosidase enzyme exhibited two characteristic negative bands at 208 and 222 nm, indicating that the major secondary protein structure presented in the α-glucosidase was α-helix.47, 48 When various concentrations (20 – 80 μM) of the GCGs were co-incubated with α-glucosidase, the CD spectra of the ligand-enzyme complex was significantly altered indicating that the conformation of the enzyme protein was affected by the ligands in a concentration-dependent manner. As summarized in Table 3, the GCGs bind to the enzyme protein that mainly resulted in the loss of α-helix conformation. When 40 μM of MF and MJ were delivered to α-glucosidase, the enzyme lost 4.9 and 5.6 % of its α-helix conformation, respectively, which could potentially cause the loss of biological functions of the α-glucosidase enzyme.
Figure 5.
Circular dichroism (CD) spectra of the α-glucosidase-GCG complex. α-glucosidase (2 μM) were co-incubated with GA, MF, or MJ at 20–80 μM at 37 °C for 20 min.
Table 3.
The effect of GCGs (GA, MF, and MJ) on the secondary structure of α-glucosidase enzyme
| Ligands (Conc.) | α-Helix % | β-Fold % | β-Turns % | Unordered % |
|---|---|---|---|---|
| Control | 36.3 | 21.9 | 14.3 | 26.9 |
| GA 40 μM | 37.8 | 22.7 | 11.5 | 27.8 |
| GA 80 μM | 33.5 | 22.5 | 15.8 | 27.7 |
| MF 20 μM | 30.7 | 24.7 | 15.6 | 28.4 |
| MF 40 μM | 31.2 | 22.7 | 16.6 | 28.9 |
| MJ 20 μM | 31.8 | 21.1 | 20.4 | 26.4 |
| MJ 40 μM | 30.7 | 24.4 | 19.1 | 25.3 |
Homology modeling
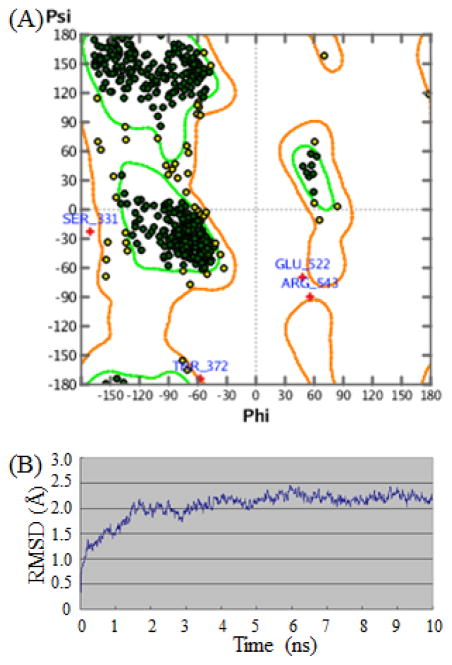
Lacking the 3D structure of Saccharomyces cerevisiae α-glucosidase used in biological assays, we constructed a 3D homology structure of α-glucosidase by computational approach. The 3D homology models of α-glucosidase were generated with the MODELER module in DS 3.5, and the best model with lowest PDF total energy score was refined by 10ns MD simulations (Figure 6B). Trajectory-based analysis showed that the root-mean-square deviation (RMSD) of the protein backbone atoms with reference to the initial structural coordinates increased slowly in the first 4 nanoseconds (ns) and then subsequently stabilized after 4 ns, suggesting that the α-glucosidase structure was stable.
Figure 6.
The properties of the refined α-glucosidase structure. (A) Ramachandran plot for a 3D model of α-glucosidase (residues denoted with a + are outliers); (B) Time dependences of the root mean square deviations (RMSD) of the backbone atoms (Cα, N, O-atoms) with respect to initial structure.
The refined structure from the last snapshot of MD simulations was validated via Profile-3D, Procheck, and Prostat analysis. The overall self-compatibility score generated by Profile-3D module in DS 3.5 for this refined model was 252.5 (the verified expected high score was 263.47, and the verified expected low score was 118.56). Procheck was used to calculate the ϕ and ψ angles (Figure 6A) and four residues (Ser331, Glu522, Arg543, and Tyr372) were located in un-allowed regions, and the percentage of residues within the Ramachandran plot’s allowed regions was 99.32 %. Prostat analysis showed that almost all bond lengths, angles, and torsions stayed within a rational range. All of these validation results proved that the refined model is reliable.
Binding modes analyses
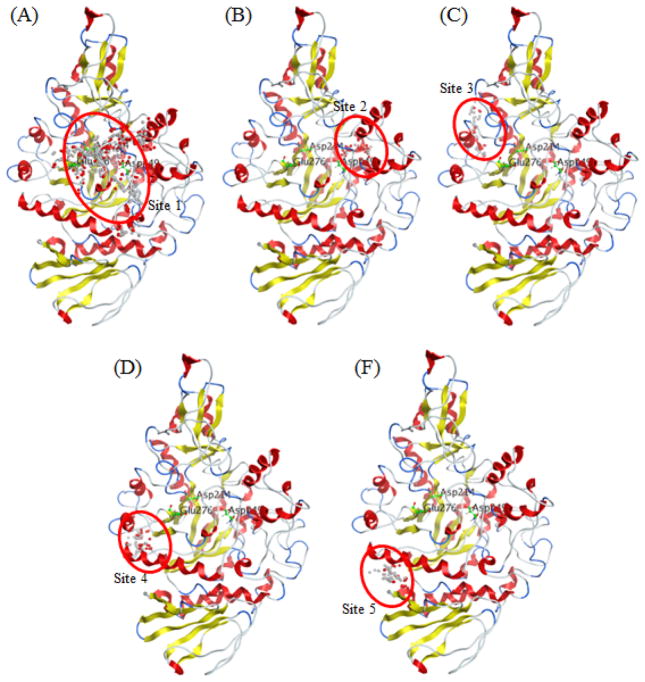
A total of 35 potential ligand binding sites of the refined model were obtained from Site Finder module in MOE. The largest five binding sites (size > 100) were selected for the docking study (Figure 6). As shown in Table 4, the three GCGs, namely, GA, MF, and MJ, shared the same scaffold, suggesting that they bind at the same site for a given target. Sites 2, 4, and 5 were not suitable for these compounds because the trends of the docking scores for GA, MF, and MJ were inconsistent with the corresponding enzyme assay results. For example, compound MF in binding site 4 with a docking score of −17.37 Kcal/mol is lower than that of compound MJ (−15.03 Kcal/mol) which is inconsistent with their enzyme inhibition values (13.70 μM for MF and 4.27 μM for MJ). Similar trends were observed in the docking results of binding sites 2 and 5.
Table 4.
Detailed docking results for GA, MF, and MJ. Cluster represents the docking score of the lowest binding energy conformation of the more populated cluster.
| compound | GA | MF | MJ | |
|---|---|---|---|---|
| Site 1 | Range | (−17.59, −8.53) | (−19.87, −11.98) | (−21.70, −9.40) |
| cluster | −10.54 | −12.02 | −16.53 | |
| Site 2 | Range | (−12.57, −5.78) | (−12.56, −6.80) | (−13.77, −6.39) |
| cluster | −8.44 | −8.15 | −9.14 | |
| Site 3 | Range | (−16.11, −6.47) | (−18.20, −8.70) | (−19.47, −7.70) |
| cluster | −11.27 | −12.25 | −13.04 | |
| Site 4 | Range | (−14.41, −5.28) | (−17.37, −6.43) | (−15.03, −5.90) |
| cluster | −10.26 | −10.37 | −9.86 | |
| Site 5 | Range | (−15.24, −7.46) | (−17.78, −6.23) | (−16.00, −7.53) |
| cluster | −11.32 | −11.72 | −11.06 | |
As shown in Figure 7C, binding site 3 was located at two helix structures and the three GCGs showed considerable binding modes based on the docking score and the enzyme inhibition assay. As previous studies have suggested that the helix structure could be stabilized by targeting compounds with polyhydroxyl groups,21, 23, 49 our CD results suggest that the helix structures were reduced with increasing concentrations of GA, MF, and MJ. Therefore, this implied that binding site 3 is not targeted by these GCGs.
Figure 7.
Top five potential ligand binding site generated via Site Finder module in MOE2010.10. The binding site is represented by alpha sphere centers and red oval. The active site is comprised of catalytic residues (Asp 214, Glu276, and Asp349).
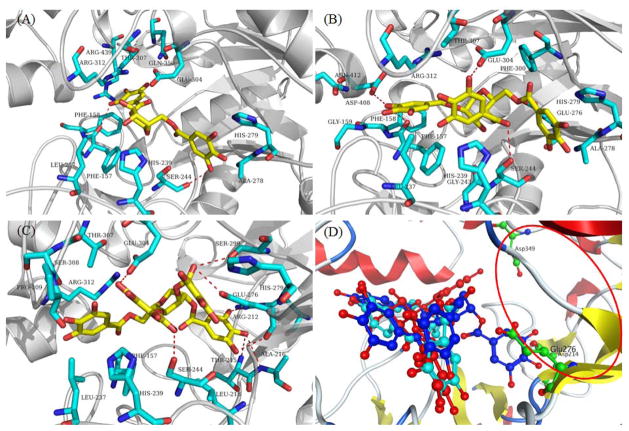
Binding site 1 is surrounded by coil, bend, and sheet structures, with little helix structures, which contain both active and inactive sites (Figure 7A). The trends of docking score of GA, MF, MJ, and the enzyme assay results are consistent. Based on all of the above analyses, the GCGs, GA, MF, and MJ target the binding site 1 of Saccharomyces cerevisiae α-glucosidase. The active site of α-glucosidase is comprised of Asp214, Glu276 and Asp349 and is represented by the red oval in Figure 8D. Superimposition of the binding modes of GA, MF, and MJ suggested that all of the binding sites are located at the noncompetitive domain of α-glucosidase (Figure 8A, B, and C), which are relatively close to the active site (Figure 8D). All of the docking results demonstrate that GA, MF, and MJ are noncompetitive inhibitors, in accordance with the aforementioned kinetic results (Figure 2).
Figure 8.
Binding modes for GA (A), MF (B), MJ (C), and superimposition of the binding modes of GA (red), MF (aquamarine blue), and MJ (blue). Hydrogen bonds are depicted by red dotted lines. Red oval represents the active binding site.
Figure 2.
Lineweaver-Burk plots of the kinetics of inhibition of GA (A), MF (B) and MJ (C) on α-glucosidase enzyme. Two concentrations (ranging from 2 – 250 μM of ligands; close to their IC50 values) were co-incubated with α-glucosidase at 37 °C for 30 min, then pNPG was added at varying concentrations (from 1–1000 μM).
As shown in Figure 8A, the hydroxyl group of GA can form two hydrogen bonds with the side chain of Ser244 and Phe157. One galloyl group of GA is inserted in the polar area comprised of Arg312, Glu304, Arg439, and Gln350, suggesting that a polar interaction can be formed. Moreover, the phenyl group can form favorable hydrophobic interactions with the side chains of Phe158, Phe157, His239, and His279. Compounds MF and MJ contain more galloyl groups than GA, suggesting that more favorable binding interactions will be formed against a given target according to Ge and coworkers’ results.50 As shown in Figures 8B and 8C, MF can form four hydrogen bonds with Asp408, Glu304, Ser244, and Phe157, whereas MJ can form eight hydrogen bonds with Glu304, Ser244, Ser299, Glu276, Arg212, Thr215, and Ala216. Thus, hydrogen bonds are formed via the hydroxyl groups of these GCGs. Notably, a similar phenomenon has been observed in other phenolic compounds such as xanthone derivatives,23 resveratrol, and oxyresveratrol.21 Moreover, more favorable hydrophobic interactions are formed between MF and MJ and α-glucosidase residues (Phe157, Phe158, Leu237, His239, His279 Phe300, and Ala278 for MF, and Phe157, Pro309, Leu237, His239, Leu218, His279, and Arg312 for MJ). These hydrophobic sites were occupied by GCGs, suggesting that the GCGs decreased the hydrophobic surface of the enzyme which was consistent with the data obtained from the bis-ANS assay. Also, the binding energy of GA, MF, and MJ is −10.45, −13.02, and −16.35 kcal/mol, respectively, which was in full accordance with results from the enzyme inhibition assay and binding model analyses.
DISCUSSION
The red maple (Acer rubrum) species is endemic to eastern North America and widely known for its tree sap which is used to produce the natural sweetener, maple syrup. This plant has also been used by the Native Americans as an herbal medicine, and recent phytochemical and biological studies from our group on this species led to the discovery of several GCGs.14–16 More importantly, these GCGs show potential as natural AGIs based on in vitro and animal studies.14–16, 18 While several of these GCGs showed far more potent α-glucosidase inhibitory activities than the clinical drug, acarbose, their mechanisms of action remained unknown. Herein, we reveal several key mechanisms by which these GCGs interact with α-glucosidase.
First, the inhibition type of the GCGs against the α-glucosidase enzyme was found to be noncompetitive, suggesting that these gallotannins bind to the specific site of enzyme-substrate complex rather than the enzyme catalytic domain. This binding pattern is in agreement with previous studies of a ‘glucose-core containing gallotannin’, namely, pentagalloyl glucose (PGG), which is also a noncompetitive α-glucosidase inhibitor.51 It is noteworthy that this distinguishes the GCGs from acarbose, a synthetic AGI, which is known to be a competitive inhibitor that directly binds to the active site of α-glucosidase.52 In addition, increasing the number of galloyl groups on the glucitol core enhanced the α-glucosidase inhibitory activities of these GCGs, an SAR effect that has also been observed in glucose-core containing gallotannin α-glucosidase inhibitors, namely, PGG and its analogs.51
Second, ITC analyses revealed that the binding stoichiometry between the GCGs (MF and MJ) and α-glucosidase was in a 1:1 ratio suggesting a single binding site for these compounds. This data is similar to that reported for the tea gallotannin, epigallocatechin gallate (EGCG) and lipase.38 Additionally, the thermodynamic parameters (Table 2) revealed that the formation of the ligand-enzyme complex was spontaneous and enthalpy-driven suggesting that the binding interaction was largely attributed to the hydrogen bonding. This is not surprising since it has been well established that gallotannins form hydrogen bonds with the polar residues of proteins through their galloyl and/or hydroxyl groups.53, 54 This observation was further supported by our computational models.
Given that gallotannins-protein binding can be enthalpy-driven (by hydrogen bonding and protonation),55–57 entropic factors (such as hydrophobic interactions),41 are also often involved in the formation of ligand-protein complexes. Therefore, we examined the hydrophobicity of the GCGs and α-glucosidase complex.
The GCGs reduced the hydrophobic surface of the enzyme and impeded the formation of the active center of the α-glucosidase enzyme. GA, MF, and MJ significantly decreased the α-helix conformation of the enzyme protein. Since α-helix is a rigid secondary structure that maintains many enzymatic protein functions, loss of this structure may result in enzyme destabilization. Therefore, the major inhibitory mechanism of the GCGs against α-glucosidase mainly consists of binding to the enzyme-substrate complex, reducing the hydrophobic surface, and changing the α-helix conformation of the enzyme protein.
Lastly, the GCGs act as noncompetitive inhibitors that bind to a noncompetitive domain of α-glucosidase located at relatively close to the active site (Figure 7D). This noncompetitive domain is different from the binding pocket of acarbose (competitive inhibitor).52 The predicted noncompetitive binding site may provide a novel site for structure-based discovering and designing novel α-glucosidase inhibitors. The molecular docking results demonstrate that more galloyl groups in the GCGs leads to enhanced binding affinity against α-glucosidase. A major challenge remains for the studies of α-glucosidase enzyme chemical steps by multiscale simulation and this methodology has been developed.58 Therefore, further in silico studies to investigate the aforementioned parameters, as well as multiscale dynamic mechanisms of whether GCGs could trigger the loss of the secondary α-helix of the flexible structures (binding sites of GCGs), is warranted and included in our group’s future studies.
Therefore, overall, this study provides useful information on these GCGs which can be used to guide the design of new GCG analogs with superior activities against α-glucosidase.
CONCLUSION
In summary, we have determined the inhibition type of ‘glucitol-core containing gallotannins (GCGs)’. The ligand-enzyme interaction was studied using several biophysical and spectroscopic tools including ITC, fluorescent probe and CD spectra. Our results showed that these GCGs had a single binding site, they could decrease the hydrophobic surfaces of the enzyme protein, and also reduce the α-helix conformation content of the protein’s secondary structure. Our study provides valuable information underlying the interactions between these GCGs and α-glucosidase, a crucial step towards further investigating their potential as natural AGIs. Further investigation of these GCGs will focus on in vivo studies to evaluate their safety and efficacy as potential dietary agents for T2DM management which is included in our group’s future planned studies.
Supplementary Material
Acknowledgments
HM was financially supported by the Omar Magnate Foundation Fellowship. The spectroscopic data were acquired from instruments located in the RI-INBRE core facility obtained from Grant # P20RR016457 from the National Center for Research Resources (NCRR), a component of the National Institutes of Health (NIH) and the Marine Science Research Facility, supported by NSF-EPSCoR (NSF-1004057) and URI.
Footnotes
Conflicts of interest
The authors have declared no conflicts of interest.
References
- 1.Dwek RA, Butters TD. Chem Rev. 2002;102:283–284. [Google Scholar]
- 2.Jacob GS. Curr Opin Struct Biol. 1995;5:605–611. doi: 10.1016/0959-440x(95)80051-4. [DOI] [PubMed] [Google Scholar]
- 3.Ghazarian H, Idoni B, Oppenheimer SB. Acta Histochem. 2011;113:236–247. doi: 10.1016/j.acthis.2010.02.004. [DOI] [PMC free article] [PubMed] [Google Scholar]
- 4.Lebovitz HE. Endocrinol Metab Clin North Am. 1997;26:539–551. doi: 10.1016/s0889-8529(05)70266-8. [DOI] [PubMed] [Google Scholar]
- 5.Scheen AJ. Drugs. 1997;54:355–368. doi: 10.2165/00003495-199754030-00001. [DOI] [PubMed] [Google Scholar]
- 6.van de Laar FA. Vasc Health Risk Manag. 2008;4:1189–1195. doi: 10.2147/vhrm.s3119. [DOI] [PMC free article] [PubMed] [Google Scholar]
- 7.van de Laar FA, Lucassen PL, Akkermans RP, van de Lisdonk EH, Rutten GE, van Weel C. Diabetes Care. 2005;28:154–163. doi: 10.2337/diacare.28.1.154. [DOI] [PubMed] [Google Scholar]
- 8.Martin AE, Montgomery PA. Am J Health Syst Pharm. 1996;53:2277–2290. doi: 10.1093/ajhp/53.19.2277. [DOI] [PubMed] [Google Scholar]
- 9.Kumar S, Narwal S, Kumar V, Prakash O. Pharmacogn Rev. 2011;5:19–29. doi: 10.4103/0973-7847.79096. [DOI] [PMC free article] [PubMed] [Google Scholar]
- 10.Li L, Seeram NP. J Agric Food Chem. 2010;58:11673–11679. doi: 10.1021/jf1033398. [DOI] [PubMed] [Google Scholar]
- 11.Bate-Smith EC. Phytochemistry. 1977;16:1421–1426. [Google Scholar]
- 12.Haddock EA, Gupta RK, Al-Shafi SMK, Haslam E, Magnolato D. J Chem Soc, Perkin Trans 1. 1982:2515–2524. doi: 10.1039/P19820002515. [DOI] [Google Scholar]
- 13.Hatano T, Hattori S, Ikeda Y, Shingu T, Okuda T. Chem Pharm Bull. 1990;38:1902–1905. [Google Scholar]
- 14.Wan C, Yuan T, Li L, Kandhi V, Cech NB, Xie M, Seeram NP. Bioorg Med Chem Lett. 2012;22:597–600. doi: 10.1016/j.bmcl.2011.10.073. [DOI] [PubMed] [Google Scholar]
- 15.Yuan T, Wan C, Liu K, Seeram NP. Tetrahedron. 2012;68:959–964. [Google Scholar]
- 16.Zhang Y, Ma H, Yuan T, Seeram NP. Nat Prod Commun. 2015;10:1409–1412. [PubMed] [Google Scholar]
- 17.Ogawa A, Miyamae Y, Honma A, Koyama T, Yazawa K, Shigemori H. Chem Pharm Bull. 2011;59:672–675. doi: 10.1248/cpb.59.672. [DOI] [PubMed] [Google Scholar]
- 18.Seeram NP, Xu J, Li L, Slitt A. Med Health R I. 2012;95:283. [PMC free article] [PubMed] [Google Scholar]
- 19.Ren Y, Himmeldirk K, Chen X. J Med Chem. 2006;49:2829–2837. doi: 10.1021/jm060087k. [DOI] [PubMed] [Google Scholar]
- 20.Samulitis B, Goda T, Lee S, Koldovský O. Drugs Exp Clin Res. 1986;13:517–524. [PubMed] [Google Scholar]
- 21.He H, Lu YH. J Agric Food Chem. 2013;61:8110–8119. doi: 10.1021/jf4019323. [DOI] [PubMed] [Google Scholar]
- 22.Yuan T, Wan C, Ma H, Seeram NP. Planta Med. 2013;79:1674–1679. doi: 10.1055/s-0033-1350925. [DOI] [PubMed] [Google Scholar]
- 23.Liu Y, Ma L, Chen WH, Park H, Ke Z, Wang B. J Phys Chem B. 2013;117:13464–13471. doi: 10.1021/jp4067235. [DOI] [PubMed] [Google Scholar]
- 24.Jeoh T, Baker JO, Ali MK, Himmel ME, Adney WS. Anal Biochem. 2005;347:244–253. doi: 10.1016/j.ab.2005.09.031. [DOI] [PubMed] [Google Scholar]
- 25.Liu M, Zhang W, Qiu L, Lin X. J Biochem. 2011;149:27–33. doi: 10.1093/jb/mvq110. [DOI] [PubMed] [Google Scholar]
- 26.Liu M, Yin H, Liu G, Dong J, Qian Z, Miao J. J Agric Food Chem. 2014;62:5548–5554. doi: 10.1021/jf500426z. [DOI] [PubMed] [Google Scholar]
- 27.Whitmore L, Wallace BA. Biopolymers. 2008;89:392–400. doi: 10.1002/bip.20853. [DOI] [PubMed] [Google Scholar]
- 28.Lobley A, Whitmore L, Wallace B. Bioinformatics. 2002;18:211–212. doi: 10.1093/bioinformatics/18.1.211. [DOI] [PubMed] [Google Scholar]
- 29.Yamamoto K, Miyake H, Kusunoki M, Osaki S. FEBS J. 2010;277:4205–4214. doi: 10.1111/j.1742-4658.2010.07810.x. [DOI] [PubMed] [Google Scholar]
- 30.Wang L, Gu Q, Zheng X, Ye J, Liu Z, Li J, Hu X, Hagler A, Xu J. J Chem Inf Model. 2013;53:2409–2422. doi: 10.1021/ci400322j. [DOI] [PubMed] [Google Scholar]
- 31.Dong YN, Wang L, Gu Q, Chen H, Liu X, Song Y, Chen W, Hagler AT, Zhang H, Xu J. Mol Divers. 2013;17:371–382. doi: 10.1007/s11030-013-9437-y. [DOI] [PubMed] [Google Scholar]
- 32.Salomon-Ferrer R, Case DA, Walker RC. Wiley Interdiscip Rev: Comput Mol Sci. 2013;3:198–210. [Google Scholar]
- 33.Hornak V, Abel R, Okur A, Strockbine B, Roitberg A, Simmerling C. Proteins. 2006;65:712–725. doi: 10.1002/prot.21123. [DOI] [PMC free article] [PubMed] [Google Scholar]
- 34.de Souza ON, Ornstein RL. J Biomol Struct Dyn. 1997;14:607–611. doi: 10.1080/07391102.1997.10508160. [DOI] [PubMed] [Google Scholar]
- 35.Abid O-u-R, Babar TM, Ali FI, Ahmed S, Wadood A, Rama NH, Uddin R, Zaheer ul H, Khan A, Choudhary MI. ACS Med Chem Lett. 2010;1:145–149. doi: 10.1021/ml100068u. [DOI] [PMC free article] [PubMed] [Google Scholar]
- 36.Corbeil CR, Williams CI, Labute P. J Comput Aided Mol Des. 2012;26:775–786. doi: 10.1007/s10822-012-9570-1. [DOI] [PMC free article] [PubMed] [Google Scholar]
- 37.Yoshimizu M, Tajima Y, Matsuzawa F, Aikawa SI, Iwamoto K, Kobayashi T, Edmunds T, Fujishima K, Tsuji D, Itoh K, Ikekita M, Kawashima I, Sugawara K, Ohyanagi N, Suzuki T, Togawa T, Ohno K, Sakuraba H. Clin Chim Acta. 2008;391:68–73. doi: 10.1016/j.cca.2008.02.014. [DOI] [PubMed] [Google Scholar]
- 38.Wu X, He W, Yao L, Zhang H, Liu Z, Wang W, Ye Y, Cao J. J Agric Food Chem. 2013;61:8829–8835. doi: 10.1021/jf401779z. [DOI] [PubMed] [Google Scholar]
- 39.Frazier RA, Papadopoulou A, Green RJ. J Pharm Biomed Anal. 2006;41:1602–1605. doi: 10.1016/j.jpba.2006.02.004. [DOI] [PubMed] [Google Scholar]
- 40.Ross PD, Subramanian S. Biochemistry. 1981;20:3096–3102. doi: 10.1021/bi00514a017. [DOI] [PubMed] [Google Scholar]
- 41.Oh HI, Hoff JE, Armstrong GS, Haff LA. J Agric Food Chem. 1980;28:394–398. [Google Scholar]
- 42.Kilmister RL, Faulkner P, Downey MO, Darby SJ, Falconer RJ. Food Chem. 2016;190:173–178. doi: 10.1016/j.foodchem.2015.04.144. [DOI] [PubMed] [Google Scholar]
- 43.McClure WO, Edelman GM. Biochemistry. 1966;5:1908–1919. doi: 10.1021/bi00870a018. [DOI] [PubMed] [Google Scholar]
- 44.Brand L, Gohlke JR. Annu Rev Biochem. 1972;41:843–868. doi: 10.1146/annurev.bi.41.070172.004211. [DOI] [PubMed] [Google Scholar]
- 45.Borejdo J. Biochemistry. 1983;22:1182–1187. doi: 10.1021/bi00274a030. [DOI] [PubMed] [Google Scholar]
- 46.Yan J, Zhang G, Pan J, Wang Y. Int J Biol Macromol. 64:213–223. doi: 10.1016/j.ijbiomac.2013.12.007. [DOI] [PubMed] [Google Scholar]
- 47.Du ZY, Liu RR, Shao WY, Mao XP, Ma L, Gu LQ, Huang ZS, Chan ASC. Eur J Med Chem. 2006;41:213–218. doi: 10.1016/j.ejmech.2005.10.012. [DOI] [PubMed] [Google Scholar]
- 48.Shen Q, Shao J, Peng Q, Zhang W, Ma L, Chan ASC, Gu L. J Med Chem. 2010;53:8252–8259. doi: 10.1021/jm100757r. [DOI] [PubMed] [Google Scholar]
- 49.Liu M, Zhang W, Wei J, Lin X. Marine Drugs. 2011;9:1554–1565. doi: 10.3390/md9091554. [DOI] [PMC free article] [PubMed] [Google Scholar]
- 50.Ge H, Liu G, Xiang YF, Wang Y, Guo CW, Chen NH, Zhang YJ, Wang YF, Kitazato K, Xu J. PLoS One. 2014;9:e94392. doi: 10.1371/journal.pone.0094392. [DOI] [PMC free article] [PubMed] [Google Scholar]
- 51.Gao H, Huang YN, Xu PY, Kawabata J. Food Chem. 2007;105:628–634. [Google Scholar]
- 52.Calder PC, Geddes R. Carbohydr Res. 1989;191:71–78. doi: 10.1016/0008-6215(89)85047-5. [DOI] [PubMed] [Google Scholar]
- 53.Poncet-Legrand C, Gautier C, Cheynier V, Imberty A. J Agric Food Chem. 2007;55:9235–9240. doi: 10.1021/jf071297o. [DOI] [PubMed] [Google Scholar]
- 54.Frazier RA, Papadopoulou A, Mueller-Harvey I, Kissoon D, Green RJ. J Agric Food Chem. 2003;51:5189–5195. doi: 10.1021/jf021179v. [DOI] [PubMed] [Google Scholar]
- 55.Luck G, Liao H, Murray NJ, Grimmer HR, Warminski EE, Williamson MP, Lilley TH, Haslam E. Phytochemistry. 1994;37:357–371. doi: 10.1016/0031-9422(94)85061-5. [DOI] [PubMed] [Google Scholar]
- 56.Charlton AJ, Baxter NJ, Lilley TH, Haslam E, McDonald CJ, Williamson MP. FEBS Lett. 1996;382:289–292. doi: 10.1016/0014-5793(96)00186-x. [DOI] [PubMed] [Google Scholar]
- 57.Spencer CM, Cai Y, Martin R, Gaffney SH, Goulding PN, Magnolato D, Lilley TH, Haslam E. Phytochemistry. 1988;27:2397–2409. [Google Scholar]
- 58.Frushicheva MP, Cao J, Warshel A. Biochemistry. 2011;50:3347–3355. doi: 10.1021/bi200063a. [DOI] [PMC free article] [PubMed] [Google Scholar]
Associated Data
This section collects any data citations, data availability statements, or supplementary materials included in this article.


