Abstract
A thiophene-based tripodal copper(II) complex has been synthesized as a new colorimetric and optical chemosensor for naked-eye discrimination of halides in acetonitrile and an acetonitrile-water mixture. The binding interactions of the new receptor with several anions were analyzed by UV-Vis titrations, electrospray ionization mass spectrometric (ESI-MS) experiments and density functional theory (DFT) calculations. The results from UV-Vis titrations indicate that the coordinative unsaturated copper(II) complex strongly binds a halide at its vacant copper(II) centre via a metal-ligand bond forming a 1:1 complex, exhibiting binding affinities in the order of fluoride > chloride > bromide > iodide. The interactions of the receptor with halides were further confirmed by ESI-MS, showing a distinct signal corresponding to a 1:1 complex for each halide, suggesting that the noncovalent interactions also exist in the gas phase. In addition, time-dependent DFT (TD-DFT) calculations were also carried out to understand the excited-state properties of the chemosensor complexes. A detailed analysis of the TD-DFT calculations shows a consistent red-shift in the first optically-allowed transition, consistent with the observed colorimetric experiments.
A simple tripodal copper(II) complex is capable of discriminating halides via a distinct color change for each halide in acetonitrile. The new chemosensor has been studied for anions by UV-Vis titrations, ESI-MS experiments, and computational methods.

Introduction
Anion recognition with synthetic receptors remains a frontier research area in chemical science due to its importance in several chemical, biological, and environmental systems.1, 2 Because of their prevalence in these various applications, there is an acute need to design sensitive and selective receptors for the detection and monitoring of anions.3 Over the past several years this area has produced a diverse variety of molecular receptors4 that interact with anions through various non-covalent interactions such as hydrogen bonding,4–6 electrostatic,7–9 Lewis acid-base,10 and metal–ligand11–13 bonds. In particular, designed receptors with integrated sensing groups have recently received considerable attention in anion binding chemistry as they strongly and selectively interact with certain anions via reversible non-covalent interactions under a variety of conditions.14–16 Indeed, optical sensing is a quick and cost-effective method to detect an analyte without the use of expensive instruments that often require time-consuming sample preparation.16
Certain receptors incorporated with transition metal ions such as copper,17–23 nickel,24 zinc25–27 and ruthenium28, 29 often respond to an analyte by displaying distinct color or optical changes through metal-anion interactions in a solution under neutral condition. Fabbrizzi and coworkers reported a furan-based dinuclear copper complex leading to the selective binding of chloride in water.18 Delgado and coworkers synthesized a para-xylyl-based dinuclearcopper(II) complex that was found to bridge an oxalate or succinate between the two copper centers.22 Stang, Chi, and coworkers incorporated ruthenium ions into metallo-bowls to obtaintetranuclear complexes showing strong affinities for carboxylate anions in methanol.29 Beer and coworkers reported zinc-containing porphyrin-cages for the optical sensing of halides, and oxoanions in acetone–water solvent mixtures.25 In our efforts to develop simple optical sensors for anions, we have previously synthesized N-methyl-2,2′-diaminodiethylamine-driven dinuclear copper complexes for the selective binding of iodide,30 phosphate,31 and cyanide.32 Previous studies have demonstrated that coordinatively unsaturated copper(II) complexes can effectively be used for the detection of certain anions via metal-anion interactions.18,22,30–33 Recently, Caltagirone and Lippolis and coworkers have incorporated a copper(II) ion into a tetradentate ligand derived from a quinoline-based triazacyclononane. This was subsequently used to synthesize an unsaturated copper(II) complex that was shown to form a penta-coordinated complex with iodide or cyanide, displaying visible color changes.34 Our continuing efforts in designing highly sensitive optical receptors led us to explore a copper(II) complex with a simple and readily obtainable tripodal-based tetradentate ligand (L) for anions. Herein, we report a simple tripodal-based copper(II) complex 1 integrated with 3-thiophene spacers for the naked-eye discrimination of halides in acetonitrile.
Results and discussion
Synthesis
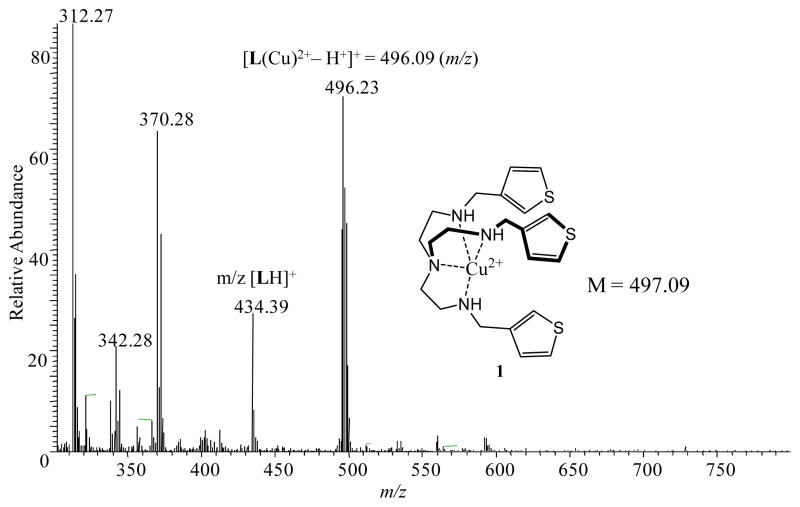
The synthesis of L was straightforward and accomplished througha condensation reaction of tren with 3-thiophenecarboxaldehyde providing a high yield. The copper(II) complex 1 was obtained as a blue powder by mixing of L and copper nitrate in CH3CN at room temperature, yielding a 1:1 copper complex as [Cu(L)](NO3)2. It is assumed that the copper is coordinatively unsaturated and is bonded with four nitrogen atoms as shown in Scheme 1. The two nitrates serve as outer sphere ligands to balance the positive charges of copper in the complex. This assumption was further confirmed by DFT calculations of 1 showing tetracoordinatedcopper(II) in a trigonal pyramidal environment (Scheme 1b) and by MS-ESI (+ve) displaying a m/z = 496.23 which corresponds to a [Cu(L) − H+]+ moiety (Fig. 1). Thus, this complex has the potential to bind an anion to its metal center. A similar coordination sphere at copper(II) center was previously reported in the literature.33, 34
Scheme 1.
(a) Free amine L, copper complex [CuII(L)]2+ (1), and proposed halide-bound complex [1(X)]−, (b) Optimized structure of 1 calculated with density functional theory (DFT) performed using the M06L meta-GGA functional.
Fig. 1.
ESI-MS spectrum of 1 in CH3CN.
UV-Vis binding studies
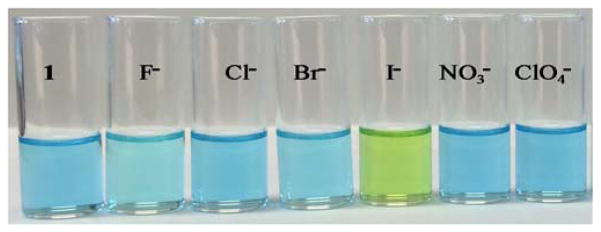
The receptor 1 showed an intense blue color in CH3CN. The addition of one equivalent of F−, Cl−, Br−, and I− to the receptor (5 x 10⁻³ M in CH3CN) showed a distinct visual color change for each halide, indicating strong interactions between the halides and 1. As shown in Fig. 2, the blue color of the solution of 1 changed to aqua for fluoride, lime for chloride, turquoise for bromide, and greenish-yellow for iodide. On the other hand, the color remained the same after the addition of NO3− and ClO4−, suggesting that 1 can be used to effectively discriminate halides in CH3CN. The receptor was also examined in a mixture of CH3CN-H2O (4:1, v/v), showing a noticeable color change for only iodide (Fig. 3), as also previously observed with a dinuclear copper(II) complex.30
Fig. 2.
Colorimetric studies of anions (F−, Cl−, Br−, I−, NO3− and ClO4−) with 1 in CH3CN at room temperature.
Fig. 3.
Colorimetric studies of anions (F−, Cl−, Br−, I−, NO3− and ClO4−) with 1 in CH3CN-H2O (4:1, v/v) at room temperature.
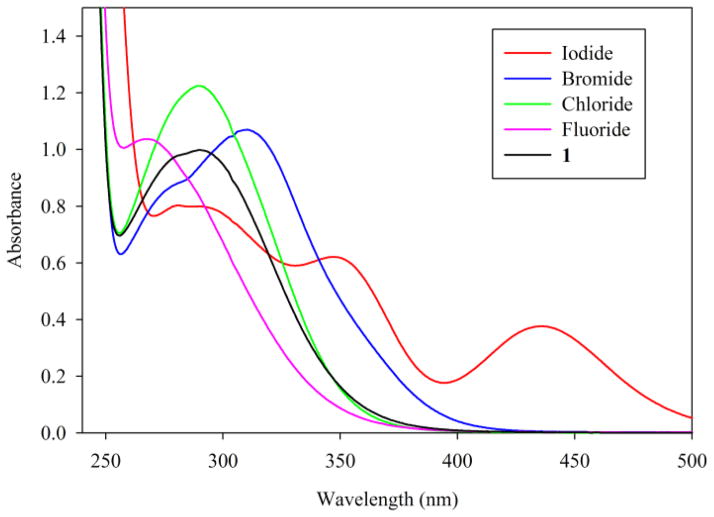
The binding properties of 1 were then investigated by UV–Vis spectroscopy in CH3CN using [n-Bu4N]+ salts of halides. As shown in Fig. 4, the complex showed an absorption band at 291 nm in the absence of an anion. Upon the addition of one equivalent of different halides, the absorption pattern of 1 changed significantly for each halide with respect to the intensity and absorption maximum. Such a change is attributed to the possible axial ligation of a halide anion to the coordinativelyunsaturated copper center leading to the formation of a metal-halide bond. This also accounts for the color change of 1 due to the addition of halides. A significant increase in the absorption intensity was observed for chloride and bromide, while an obvious red shift in the absorption maximum was observed in the presence of bromide (291 to 310 nm), and a blue shift for fluoride (291 to 270 nm). For iodide, there was a decrease in the absorption maxima, while two new peaks appeared at longer wavelengths. The shortest absorption band for fluoride at 270 nm compared to that for iodide at 436 nm indicates that the strong ligand field-effect of F− lowers the energy level of eg of copper(II), thus resulting in the transition at higher energy. However, there was no change in the absorption pattern of 1 after the addition of nitrate or perchlorate.
Fig. 4.
Changes in absorbance of 1 (1 x 10⁻⁴ M) in the presence of one equivalent of different halides in CH3CN at room temperature. λmax: 1 = 291, I− = 290, Br− = 310, Cl− = 289, F− = 270 nm.
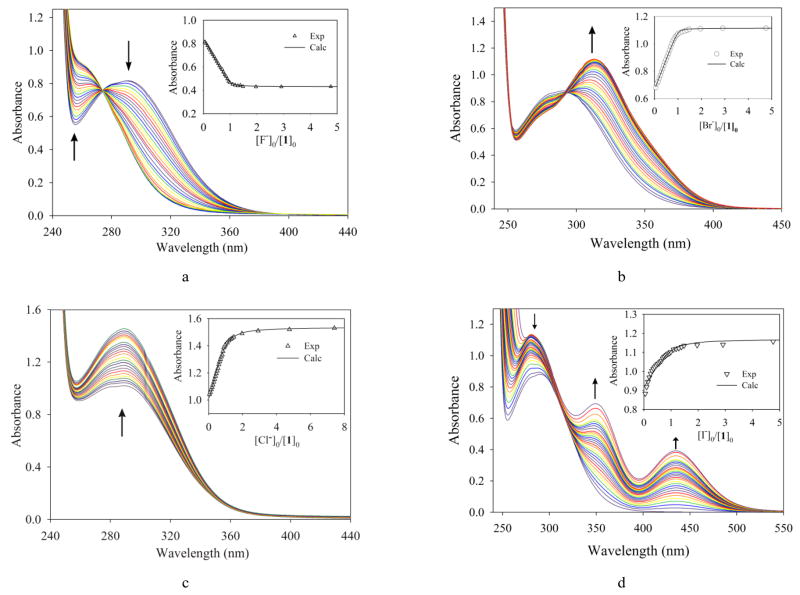
The binding properties of the receptor for halides were determined by UV-Vis titration methods in CH3CN. As shown in Fig. 5a, the incremental addition of F− to 1 in CH3CN resulted in a gradual hypsochromic (blue) shift of the absorption maxima (291 to 262 nm), while the absorption intensities were gradually decreased, showing an isosbestic point at 271 nm. Interestingly, in the case of bromide, a bathochromic (red) shift in the absorbance band (291 to 310 nm) was observed with a gradual increase in the absorption intensity, displaying an isosbestic point at 296 nm (Fig. 5b). In both cases, the isosbestic point is observed at an equimolar ratio of the receptor and the respective halide, suggesting the formation of a 1:1 (receptor:halide) complex. The absorption intensity of 1 was notably enhanced (hyperchromic shift) after the gradual addition of chloride to the receptor, while the absorption maxima (λmax) remained almost unchanged (Fig. 5c). On the other hand, the absorption pattern of the receptor were quite different upon the gradual addition of iodide. New bands in the 330 to 390 nm region as well as strong Soret bands in the 400–500 nm region are shown (Fig 5d), which could be due to the formation of a charge transfer complex.13,29
Fig. 5.
Changes in absorption spectra of 1 (1 x 10⁻⁴ M) with an increasing amount of fluoride (a), bromide (b), chloride (c) and iodide (d) in CH3CN. The titration curves are shown in insets.
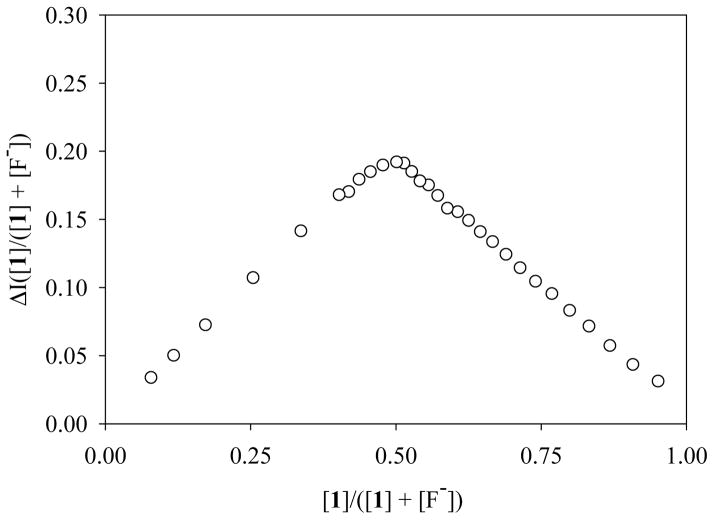
A Job plot analysis confirmed a 1:1 host:guest binding stoichiometry of halide binding to 1 for each halide, showing a maximum at a 0.5 mole fraction (Fig. 6 and Fig. S6-S8) ESI†).The halide binding constants (K) were determined by a non-linear regression of the absorbance changes of the receptorbased on a 1:1 binding model (insets in Fig. 5),35 and are reported in Table 1. The receptor binds halide anions strongly, showing the highest association constant for fluoride with a strong selectivity over other halides. This is presumably a result of a stronger field-effect of the tiny fluoride,36 and is possibly bound at the vacant site of the metal center of 1 (Scheme 1). The binding trend of the receptor correlates directly with the ligand field-effect36 and the charge density of anions in the order of F− >Cl− > Br− > I−. This binding trend is consistent with the results reported by Beer and coworkers for triazolium-containing zinc(II) metalloporphyrins,25 and by us with macrocycle-based receptors appended with dansyl groups.37 However, an opposite trend was observed with a macrocycle-based copper(II) complex, where the size complementarily dominated over charge density.30 1 was also tested for other anions including sulfate, phosphate, acetate, cyanide, benzoate, hydroxide, pyrophosphate and citrate in CH3CN. The receptor was found to bind acetate, hydroxide and sulfate showing the binding constants (in log K) of 4.22(2), 4.00(2) and 3.65(2), respectively. However, the titration for other anions was hampered due to the precipitation during the titration process. The change of absorbance (ΔA) with the concentration of a halide shows a linear dependency upto 150 μM in CH3CN, allowing us to estimate the lowest detection limit (LOD) up to 3.01, 5.24, 9.72 and 15.6 μM for fluoride, chloride, bromide and iodide, respectively (Fig. S13 and Table S1 in ESI).39
Fig. 6.
Job plot analysis of 1 for the binding of fluoride in CH3CN. The change of the absorbance (ΔI) of 1 was determined from the titration plot as shown in Figure 5a.
Table 1.
Binding constants (log K) of 1 with halides.
| Anion | log K | |
|---|---|---|
|
| ||
| CH3CN | CH3CN − H2O (4:1, v/v) | |
| Fluoride | 5.83(3) | 4.58(3) |
| Chloride | 4.86(2) | 4.18(2) |
| Bromide | 4.80(2) | 4.16(2) |
| Iodide | 4.72(2) | 3.98(2) |
We also performed titration studies of 1 for halides in aqueous medium using the mixture of CH3CN-H2O (4:1, v/v). The receptor was found to bind a halide in a 1:1 binding mode (Figure S14) showing a weaker binding trend than that observed in pure CH3CN (Table 1), which is due to the effect of increase solvent polarity.30 The appearance of new band at about 430 nm due to the addition of iodide (Fig. S14(d)) also supports the color change for this anion in CH3CN-H2O (Fig. 3). The LOD for iodide was estimated to 24.9 μM in CH3CN-H2O (Fig. S15 and Table S3) as compeered to 15.5 μM in CH3CN.
Mass spectrometry
Mass spectrometry is a powerful tool used to identify an ionic adduct at a low concentration.39–42 It is a rapid method for studying noncovalent bonds in a supramolecular complex, providing insights into the binding strength, sensitivity, and selectivity of host molecules complementary to that obtained from more traditional techniques. Kavallieratos and coworkers used an APCI-MS (atmospheric pressure chemical ionization mass spectrometry) for the detection of halides and nitrate with sulfonamides in dichloromethane.39 Our group recently used ESI-MS to probe a sulfate complex with a thiophene-based monocycle40 and an octameric phosphate cluster with a tren-based amine.41 This is a direct method to examine the stability and stoichiometry of a complex in a gaseous state. The results from UV-Vis titrations suggest that the positively charged receptor binds a halide forming a 1:1 complex in CH3CN. We therefore used an ESI-MS in a positive ion detection mode using their halide salts in the same solvent, after the essential thermal desorption.
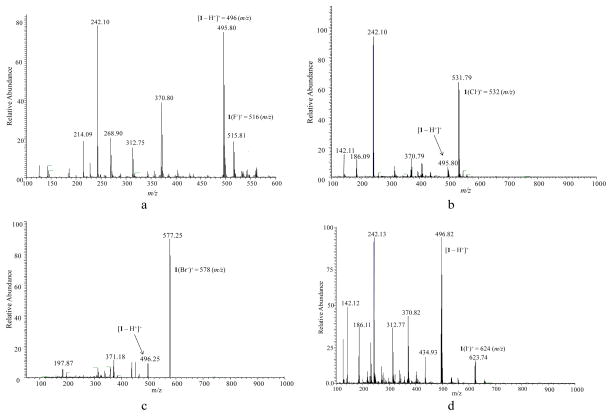
The free receptor shows a prominent signal at m/z = 496 that corresponds to the deprotonated receptor [1 − H+]+ (Fig. 1). After the addition of one equivalent of each halide, the complexes of [1 + F−]+, [1 + Cl−]+, [1 + Br−]+ and [1 + I−]+ at m/z = 516, 523, 578 and 624, respectively, were identified along with the deprotonated receptor [1 − H+]+ at m/z = 496 (Fig. 6). Strong intensities of mass-to-charge ratios were observed for [1 + Cl−]+ and [1 + Br−]+ complexes, while the corresponding signals for [1 + F−]+ and [1 + I−]+ were relatively weak. Similar strong signals for chloride complexes were reported earlier for ESI-MS by Cole and Zhu42 and for APCI-MS by Kavallieratos and coworkers.39 The signals corresponding to 1:1 complexes of 1 with the respective halides are in agreement with the results of UV-Vis titrations in solution. These results further suggest that the noncovalent interactions also exist in the gaseous phase, and the adduct in solution-phase can be transferred into the gas-phase without interrupting the binding stoichiometry.
DFT Calculations
To quantitatively understand the interactions of the various copper halide molecules with the receptor, theoretical calculations based on density functional theory (DFT) were performed with the M06L meta-GGA functional.43
An all-electron, polarized 6–31g(d,p) basis set was used for the copper atom, and a 6–311g(d,p) basis set was used for all of the other atomic species (H, C, N, S, F, Cl, Br and I). Extensive previous work has shown that the M06L semi-local functional accurately predicts binding energies in both organometallic compounds44 as well as noncovalent interactions for large systems.45 Fully unconstrained geometry optimizations were carried out on both the isolated receptor as well as the various molecular-bound complexes. The DFT-optimized geometries of the complexes are shown in Fig. 7. With the optimized geometry, a binding energy was calculated with the expression: , where X− represents a F−, Cl−, Br− or I−. Using this expression for each of the copper halide systems, we obtained attractive interactions for the halide complexes with binding energies in the order of [1(F)]−> [1(Cl)]−> [1(Br)]−> [1(I)]− (Table 2). This trend is in agreement with the binding constants determined experimentally by UV-Vis titrations. Notably, the magnitudes of the binding energies are proportional to the electronegativity of halides, with fluoride having the largest binding energy and iodide having the lowest binding.
Fig. 7.
ESI-MS spectra of 1 in the presence of one equivalent of (a) fluoride, (b) chloride, (c) bromide and (d) iodide in CH3CN.
Table 2.
Binding energies,a excitation energiesb and oscillator strengthsb of the various complexes of 1 with halides.
| Anion | E, Kcal/mol | Excitation energy (eV) | Oscillator Strength |
|---|---|---|---|
| Fluoride | −219.07 | 1.48 | 0.0030 |
| Chloride | −210.57 | 1.30 | 0.0028 |
| Bromide | −197.86 | 1.25 | 0.0026 |
| Iodide | −188.61 | 1.21 | 0.0023 |
Calculated with density functional theory (DFT) using the M06L meta-GGA functional
Obtained at the TD-ωB97 level of theory.
To give further support to the observed colorimetric results, we also carried out high-level time-dependent density functional theory (TD-DFT) calculations on all of the copper-halide complexes. In order to account for charge-transfer effects in these complexes, we used the ωB97 range-separated functional which incorporates a full 100% asymptotic Hartree-Fock exchange. In our previous work on range-separated functionals, we46–49 and others50, 51 have previously shown that maintaining a full 100% contribution of asymptotic Hartree-Fock exchange is essential for accurately describing valence excitations in even relatively simple molecular systems. Due to the size of the complexes and the large basis sets used, we only calculated the lowest 6 excited states for each complex. In addition, since each complex has an open-shell ground state, all the TD-DFT calculations were carried out with an unrestricted electronic configuration, which limited our study to only the lowest 6 excited states. All excited states and energies are given in the Electronic Supplementary Information, and Table S4 summarizes the excitation energies with the highest oscillator strengths for the various copper halide complexes.
Based on an analysis of the TD-ωB97 excitation energies, there is a consistent decrease in the first excited-state energy as one proceeds further down the periodic table. The predicted red-shift in the excitation energy for chloride, bromide and iodide is consistent with the observed colorimetric experiments and highlights the utility of the TD-DFT calculations. The highest excitation energy for the fluoride complex accounts for the blue-shift of the UV-Vis absorbance spectrum (291 to 270 nm) observed experimentally. Fig. 8 displays both the occupied and virtual orbitals that contribute to the first excited-state transition for the various complexes. In each of these optically-allowed transitions, there is a re-arrangement of electron density from the copper halide orbitals to electron orbitals that are localized on the thiophene groups. It is interesting to note that, in each case, there is also some electronic re-arrangement in the excited state to σ orbitals on the halide atom, with the size of the σ orbital being proportional to the size of the halide atom.
Fig. 8.
(a) Optimized structures (1st column) of halide complexes of 1 calculated with density functional theory (DFT) using the M06L meta-GGA functional [Colour codes: gray = carbon, pink = nitrogen, orange = copper. Hydrogen atoms are not shown for clarity]; (b) Occupied (2nd column) and virtual orbitals (3rd column) contributing to the first excited-state transition for the various complexes obtained from TD-DFT calculations.
Conclusions
We have reported a simple new tripodal copper(II) complex that is capable of discriminating halides via a distinct color change for each halide in acetonitrile. The new receptor was investigated for anions by UV-Vis titrations, electrospray ionization mass spectrometric (ESI-MS) experiments, and various computational methods. UV-Vis titration experiments reveal that the receptors exhibit strong anion binding affinities forming a 1:1 stoichiometric complex with each halide in acetonitrile and acetonitrile-water mixture. Specifically, the receptor was shown to respond differently upon the addition of different halides with respect to the intensity and absorption maximum, which is attributed to an axial ligation of a halide anion to the coordinatively unsaturated copper center leading to the formation of a halide complex. The observed binding order of fluoride > chloride > bromide > iodide determined by UV-Vis titrations directly correlates with the relative basicity of the respective halide. The ESI-MS was also employed to identify the receptor-halide complex, showing a distinct signal for a 1:1 complex for each halide. Furthermore, the DFT and TD-DFT calculations give additional insight in the electronic properties of this novel chemosensor. The ground-state DFT results corroborate and validate the binding energy trends observed experimentally for the various anions. Moreover, the excited-state TD-DFT calculations give detailed information on the oscillator strengths and orbitals involved in the first optically-allowed transition. The progressive absorbance red-shift as one proceeds down the periodic table is consistent with the observed colorimetric experiments and further highlights the utility of both experiment and predictive calculations for fully characterizing these chemosensors.
Experimental
General
All reagents and solvents were purchased as reagent grade and used without further purification. Nuclear magnetic resonance (NMR) spectra were recorded on a Varian Unity INOVA 500 FT-NMR. Chemical shifts for samples were measured in CDCl3 or DMSO-d6 and calibrated with tetramethylsilane (TMS) as an internal reference. Elemental analysis was carried out using an ECS 4010 Analytical Platform (Costech Instrument) at Jackson State University. The absorbance was measured on a UV-2600 UV-VIS spectrophotometer (SHIMADZU). Mass spectral data were obtained in the ESI-MS positive mode on a TSQ Quantum GC (Thermo Scientific).
Synthesis
L
Tris (2-aminoethyl) amine (0.67g, 4.60 mmol) was dissolved in 50 mL of EtOH in a round bottom flask, and 3-thiophenecarboxaldehyde (1.55 g, 13.80 mmol) dissolved in 50mL Et2O was added to the flask under constant stirring at room temperature for 4 hours. NaBH4(1.10 g, 29.0 mmol) was added to the reaction mixture which was stirred overnight at room temperature. The solvent was evaporated under reduced pressure, and the product was extracted using dichloromethane (3 x 50 mL). The organic layers were combined and were dried with anhydrous magnesium sulfate. After separating the solid by vacuum filtration, the filtrate was evaporated and then washed with hexane to give the pure product. Yield: 1.76g, 88%. ESI-MS: m/z 435.36 [HL]+. 1H NMR (500 MHz, CDCl3, TSP): δ 7.236 (t, 3H, ArH), δ 7.040 (s, 3H, ArH), δ 6.987 (d, 3H, J = 4.5, ArH), δ 3.752 (s, 6H, ArCH2), δ 2.671 (t,6H, J= 5.5, NCH2), δ 2.572 (t, 6H, J= 5.5, NCH2CH2). 13C NMR (125 MHz, CDCl3, TSP): δ145.840 (Ar-C), 128.461 (Ar-C), 126.772 (Ar-C), 126.135 (Ar-C), 56.066 (Alph-C), 50.123 (Alph-C), 48.613 (Alph-C). Anal.Calcd.for (C21H30N4S3): C, 58.02; H, 6.96; N, 12.89. Found: C, 58.10; H, 6.89; N, 12.81.
[Cu(L)](NO3)2, (1)
The free ligand L (217mg, 0.50 mmol) and Cu(NO3)2(94 mg, 0.50 mmol)were separately dissolved in 10 mL of CH3CN and were mixed under constant stirring. The greenish-blue color of free Cu(NO3)2 solution immediately turned blue. After stirring the mixture overnight, diethyl ether (50 mL) was added to the reaction mixture. The blue precipitate thus formed immediately was separated by decantation, and the solid micro-crystalline product was dried under vacuum to yield the desired copper complex as [Cu(L)](NO3)2. Yield: 200 mg (80%). ESI-MS: m/z 496.23 [M]+.Anal.Calcd.for (C21H30CuN6O6S3): C, 40.53; H, 4.86; N, 13.51. Found: C, 40.30; H, 4.90; N, 13.59.
UV titration studies
UV-Vis titration studies were performed by titrating 1 with [n-Bu4N]+A−in CH3CN at 25 ºC. Initial concentrations of 1 and the anions were 5 x 10⁻⁵ M and 5 x 10⁻³ M, respectively. Each titration was performed by 20–25 measurements ([A−]0/[1]0 = 0–10 equivalents), and the binding constant (K) was calculated by fitting the changeof UV-Vis absorbance (ΔI) with a 1:1 association model using the equation, (where 1 = receptor and A = anion).35 The error limit in K was less than 10%.
ESI-MS experiments
Mass spectral data were obtained in the ESI-MS positive mode by a TSQ Quantum GC. The mass spectrometer was run for m/z = 0 – 1000 in CH3CN as a solvent. The pure solvent was run through the instrument before each analysis. Stock solutions of 1 and each halide ([n-Bu4N]+X− ) were prepared separately to make the concentrations of 1 x 10⁻³ M and 1 x 10⁻³ M, respectively. Each sample was prepared by mixing of the host and respective halide solutions at 1:1 volume ratios, and the mixture was further diluted to make a final concentration of 1 x 10⁻⁶ M. The resulting solution was introduced directly into the mass spectrometer by a micro syringe. A pure host solution of 1 x 10⁻⁶ M was also prepared, and its mass spectrum was run for a comparison.
Computational Studies
Binding energies and structural optimization of copper complexes were evaluated with density functional theory (DFT) calculations,43 and optical properties were calculated using time-dependent density functional theory (TD-DFT) calculations (See Section 3.3 for further details). All the calculations were carried out using the Gaussian 09 package of programs.52
Supplementary Material
Acknowledgments
The National Science Foundation is acknowledged for a CAREER award (CHE-1056927) to MAH. The NMR core facility at Jackson State University was supported by the National Institutes of Health (G12RR013459). R. L. B. was supported by NSF REU site (CHE 1156111) for undergraduate research at Jackson State University. B.M.W. acknowledges the National Science Foundation for the use of supercomputing resources through the Extreme Science and Engineering Discovery Environment (XSEDE), Project No. TG-DMR140054.
Footnotes
Electronic Supplementary Information (ESI) available: [Electronic Supplementary Information (ESI) available: [Characterization of the receptor and additional Job plots]. See DOI: 10.1039/b000000x/
Contributor Information
Bryan M. Wong, Email: bryan.wong@ucr.edu.
Md. Alamgir Hossain, Email: alamgir.hossain@jsums.edu.
References
- 1.Steed JW, Atwood JL. Supramolecular Chemistry. 2. John Wiley & Sons, Ltd; Hoboken, NJ: 2009. [Google Scholar]
- 2.Bowman-James K, Bianchi A, García-Espana E. Anion Coordination Chemistry. Wiley-VCH; New York: 2011. [Google Scholar]
- 3.Stibor I, editor. Topics in current chemistry. Vol. 255 Springer-Verlag; Berlin: 2005. Editonedn. [Google Scholar]
- 4.Yoon J, Kim SK, Singh NJ, Kim KS. Chem Soc Rev. 2006;35:355–360. doi: 10.1039/b513733k. [DOI] [PubMed] [Google Scholar]
- 5.Hua Y, Flood AH. Chem Soc Rev. 2010;39:1262–1271. doi: 10.1039/b818033b. [DOI] [PubMed] [Google Scholar]
- 6.Hossain MA, Begum RA, Day VW, Bowman-James K. In: Supramolecular Chemistry: From Molecules to Nanomaterials. Gale PA, Steed JW, editors. John Wiley & Sons, Ltd; 2012. Editonedn. [Google Scholar]
- 7.García-España E, Díaz P, Llinares JM, Bianchi A. Coord Chem Rev. 2006;250:2952–2986. [Google Scholar]
- 8.Wenzel M, Hiscock JR, Gale PA. Chem Soc Rev. 2012;41:480–520. doi: 10.1039/c1cs15257b. [DOI] [PubMed] [Google Scholar]
- 9.Hossain MA. Curr Org Chem. 2008;12:1231–1256. [Google Scholar]
- 10.Schmidtchen FP, Berger M. Chem Rev. 1997;97:1609–1646. doi: 10.1021/cr9603845. [DOI] [PubMed] [Google Scholar]
- 11.O’Neil EJ, Smith BD. Coord Chem Rev. 2006;250:3068–3080. [Google Scholar]
- 12.Fabbrizzi L, Poggi A. Chem Soc Rev. 2013;42:1681–1699. doi: 10.1039/c2cs35290g. [DOI] [PubMed] [Google Scholar]
- 13.Mateus P, Lima LMP, Delgado R. Polyhedron. 2013;52:25–42. [Google Scholar]
- 14.Basabe-Desmonts L, Reinhoudta DN, Crego-Calama M. Chem Soc Rev. 2007;36:993–1017. doi: 10.1039/b609548h. [DOI] [PubMed] [Google Scholar]
- 15.Kim JS, Quang DT. Chem Rev. 2007;107:3780–3799. doi: 10.1021/cr068046j. [DOI] [PubMed] [Google Scholar]
- 16.Anslyn EV. J Org Chem. 2007;72:687–699. doi: 10.1021/jo0617971. [DOI] [PubMed] [Google Scholar]
- 17.Harding CJ, Mabbs FE, MacInnes EJL, McKee V, Nelson J. J Chem Soc, Dalton Trans. 1996:3227–3230. [Google Scholar]
- 18.Amendola V, Bastianello E, Fabbrizzi L, Mangano C, Pallavicini P, Perotti A, Lanfredi AM, Ugozzoli F. Angew Chem, Int Ed. 2000;39:2917–2920. [PubMed] [Google Scholar]
- 19.Amendola V, Bergamaschi G, Buttafava A, Fabbrizzi L, Monzani E. J Am Chem Soc. 2010;132:147–156. doi: 10.1021/ja9046262. [DOI] [PubMed] [Google Scholar]
- 20.Chen J-M, Zhuang X-M, Yang L-Z, Jiang L, Feng X-L, Lu T-B. Inorg Chem. 2008;47:3158–3165. doi: 10.1021/ic702143d. [DOI] [PubMed] [Google Scholar]
- 21.De Santis G, Fabbrizzi L, Licchelli M, Poggi A, Taglietti A. Angew Chem, Int Ed Engl. 1996;35:202–204. [Google Scholar]
- 22.Carvalho S, Delgado R, Drew MGB, Félix V. Dalton Trans. 2007:2431–2439. doi: 10.1039/b700115k. [DOI] [PubMed] [Google Scholar]
- 23.Li F, Delgado R, Félix V. Eur J Inorg Chem. 2005:4550–4561. [Google Scholar]
- 24.Rhaman MM, Fronczek FR, Powell DR, Hossain MA. Dalton Trans. 2014;43:4618–4621. doi: 10.1039/c3dt53467g. [DOI] [PMC free article] [PubMed] [Google Scholar]
- 25.Gilday LC, White NG, Beer PD. Dalton Trans. 2012;41:7092–7097. doi: 10.1039/c2dt30124e. [DOI] [PubMed] [Google Scholar]
- 26.Lee CH, Lee S, Yoon H, Jang WD. Chem–Eur J. 2011;17:13898–13903. doi: 10.1002/chem.201101884. [DOI] [PubMed] [Google Scholar]
- 27.Clares MP, Aguilar J, Aucejo R, Lodeiro C, Albelda MT, Pina F, Lima JC, Parola AJ, Pina J, de Melo JS, Soriano C, García-España E. Inorg Chem. 2004;43:6114–6122. doi: 10.1021/ic049694t. [DOI] [PubMed] [Google Scholar]
- 28.Vajpayee V, Song YH, Lee MH, Kim H, Wang M, Stang PJ, Chi KW. Chem–Eur J. 2011;17:7837–7844. doi: 10.1002/chem.201100242. [DOI] [PMC free article] [PubMed] [Google Scholar]
- 29.Mishra A, Vajpayee V, Kim H, Lee MH, Jung H, Wang M, Stang PJ, Chi KW. Dalton Trans. 2012;41:1195–1201. doi: 10.1039/c1dt11612f. [DOI] [PubMed] [Google Scholar]
- 30.Mendy JS, Saeed MA, Fronczek FR, Powell DR, Hossain MA. Inorg Chem. 2010;49:7223–7225. doi: 10.1021/ic100686m. [DOI] [PMC free article] [PubMed] [Google Scholar]
- 31.Saeed MA, Powell DR, Hossain MA. Tetrahedron Lett. 2010;51:4904–4907. doi: 10.1016/j.tetlet.2010.07.078. [DOI] [PMC free article] [PubMed] [Google Scholar]
- 32.Rhaman MM, Alamgir A, Wong BM, Powell DR, Hossain MA. RSC Adv. 2014;4:54263–54267. doi: 10.1039/C4RA10813B. [DOI] [PMC free article] [PubMed] [Google Scholar]
- 33.Singh N, Jung HJ, Jang DO. Tetrahedron Lett. 2009;50:71–74. [Google Scholar]
- 34.Tetilla MA, Aragoni MC, Arca M, Caltagirone C, Bazzicalupi C, Bencini A, Garau A, Isaia F, Laguna A, Lippolis V, Meli V. Chem Commun. 2011;47:3805–3807. doi: 10.1039/c0cc04500d. [DOI] [PubMed] [Google Scholar]
- 35.Schneider HJ, Kramer R, Simova S, Schneider U. J Am Chem Soc. 1988;110:6442–6448. [Google Scholar]
- 36.Miessler GL, Tarr DA. Inorganic Chemistry. 3. Pearson Prentice Hall; 2003. p. 368. Editonedn. [Google Scholar]
- 37.Dey KR, Wong BM, Hossain MA. Tetrahedron Lett. 2010;51:1329–1332. doi: 10.1016/j.tetlet.2010.01.004. [DOI] [PMC free article] [PubMed] [Google Scholar]
- 38.Shang L, Zhang L, Dong S. Analyst. 2009;134:107–113. doi: 10.1039/b812458b. [DOI] [PubMed] [Google Scholar]
- 39.Kavallieratos K, Sabucedo AJ, Pau AT, Rodriguez JM. J Am Soc Mass Spectrom. 2005;16:1377–1383. doi: 10.1016/j.jasms.2005.04.008. [DOI] [PMC free article] [PubMed] [Google Scholar]
- 40.Mendy JS, Pilate ML, Horne T, Day VW, Hossain MA. Chem Commun. 2010;46:6084–6086. doi: 10.1039/c0cc01699c. [DOI] [PMC free article] [PubMed] [Google Scholar]
- 41.Hossain MA, Iiklan M, Pramanik A, Saeed MA, Fronczek FR. Cryst Growth Des. 2012;12:567–571. doi: 10.1021/cg201464k. [DOI] [PMC free article] [PubMed] [Google Scholar]
- 42.Cole RB, Zhu J. Rapid Commun Mass Spectrom. 1999;13:607–611. [Google Scholar]
- 43.Zhao Y, Truhlar DG. J Chem Phys. 2006;125:194101. doi: 10.1063/1.2370993. [DOI] [PubMed] [Google Scholar]
- 44.Gusev DG. Organometallics. 2013;32:4239–4243. [Google Scholar]
- 45.Huang C, Wang RK, Wong BM, McGee DJ, Léonard F, Kim YJ, Johnson KF, Arnold MS, Eriksson MA, Gopalan P. ACS Nano. 2011;5:7767–7774. doi: 10.1021/nn202725g. [DOI] [PubMed] [Google Scholar]
- 46.Wong BM, Piacenza M, Sala FD. Phys Chem Chem Phys. 2009;11:4498–4508. doi: 10.1039/b901743g. [DOI] [PubMed] [Google Scholar]
- 47.Wong BM, Hsieh TH. J Chem Theory Comput. 2010;6:3704–3712. doi: 10.1021/ct100529s. [DOI] [PMC free article] [PubMed] [Google Scholar]
- 48.Wong BM, Cordaro JG. J Chem Phys. 2008;129:214703. doi: 10.1063/1.3025924. [DOI] [PubMed] [Google Scholar]
- 49.Foster ME, Wong BM. J Chem Theory Comput. 2012;8:2682–2687. doi: 10.1021/ct300420f. [DOI] [PMC free article] [PubMed] [Google Scholar]
- 50.Richard RM, Herbert JM. J Chem Theory Comput. 2011;7:1296–1306. doi: 10.1021/ct100607w. [DOI] [PubMed] [Google Scholar]
- 51.Kuritz N, Stein T, Baer R, Kronik L. J Chem Theory Comput. 2011;7:2408–2415. doi: 10.1021/ct2002804. [DOI] [PubMed] [Google Scholar]
- 52.Frisch MJ, Trucks GW, Schlegel HB, Scuseria GE, Robb MA, Cheeseman JR, Scalmani G, Barone V, Mennucci B, Petersson GA, Nakatsuji H, Caricato M, Li X, Hratchian HP, Izmaylov AF, Bloino J, Zheng G, Sonnenberg JL, Hada M, Ehara M, Toyota K, Fukuda R, Hasegawa J, Ishida M, Nakajima T, Honda Y, Kitao O, Nakai H, Vreven T, Montgomery JA, Jr, Peralta JE, Ogliaro F, Bearpark M, Heyd JJ, Brothers E, Kudin KN, Staroverov VN, Kobayashi R, Normand J, Raghavachari K, Rendell A, Burant JC, Iyengar SS, Tomasi J, Cossi M, Rega N, Millam MJ, Klene M, Knox JE, Cross JB, Bakken V, Adamo C, Jaramillo J, Gomperts R, Stratmann RE, Yazyev O, Austin AJ, Cammi R, Pomelli C, Ochterski JW, Martin RL, Morokuma K, Zakrzewski VG, Voth GA, Salvador P, Dannenberg JJ, Dapprich S, Daniels AD, Farkas Ö, Foresman JB, Ortiz JV, Cioslowski J, Fox DJ. Gaussian, Inc; Wallingford CT: 2009. Editonedn. [Google Scholar]
Associated Data
This section collects any data citations, data availability statements, or supplementary materials included in this article.


