Abstract
Biomaterial design via genetic engineering can be utilized for the rational functionalization of proteins to promote biomaterial integration and tissue regeneration. Spider silk has been extensively studied for its biocompatibility, biodegradability and extraordinary material properties. As a protein-based biomaterial, recombinant DNA derived derivatives of spider silks have been modified with biomineralization domains which lead to silica deposition and potentially accelerated bone regeneration. However, the influence of the location of the R5 (SSKKSGSYSGSKGSKRRIL) silicifying domain fused with the spider silk protein sequence on the biosilicification process remains to be determined. Here we designed two silk-R5 fusion proteins that differed in the location of the R5 peptide, C- vs. N-terminus, where the spider silk domain consisted of a 15mer repeat of a 33 amino acid consensus sequence of the major ampullate dragline Spidroin 1 from Nephila clavipes (SGRGGLGGQG AGAAAAAGGA GQGGYGGLGSQGT). The chemical, physical and silica deposition properties of these recombinant proteins were assessed and compared to a silk 15mer control without the R5 present. The location of the R5 peptide did not have a significant effect on wettability and surface energies, while the C-terminal location of the R5 promoted more controlled silica precipitation, suggesting differences in protein folding and possibly different access to charged amino acids that drive the silicification process. Further, cell compatibility in vitro, as well as the ability to promote human bone marrow derived mesenchymal stem cell (hMSC) differentiation were demonstrated for both variants of the fusion proteins.
Keywords: spider silk, silaffin, fusion proteins, biomaterials, biomineralization
1. Introduction
The need for foreign material implants in the human body has led to the growth in research of how to continue to improve these materials related to biological outcomes. Silk materials are useful as biomedical devices due to their biocompatibility and their extraordinary physical properties.1–3 High tensile strength and elasticity provide a useful basis for silk materials with medical and non-medical applications as goals.4–8 Silk can be formed into gels, sponges, films, membranes and scaffolds9–13 with applications from controlled release14 to supportive scaffolding constructs.15, 16
Dragline silk from spiders is the focus of the present study due to its support line and framing functions in orb webs.17 The structure consists of protein beta sheet crystals distributed via long protein fibers.18 However, to generate mechanically stiffer spider-silk biomaterials, analogies from bone composite systems can be made, whereby inorganic components are tightly integrated into collagen protein-based components, to generate unique composite features. A similar approach was taken here, building on our past work where we generated a range of spider silk fusion proteins to study silicification. Silica has good compatibility with silk and biological systems.19 Silica is also known for its bioactivity particularly with bone tissue, as it binds strongly with bone whilst also being osteoinductive.20 However, the hard crystalline structures often produced by silica are brittle and lack beneficial tensile properties. By combining the silica with silk materials that combine the best attributes of both can be achieved, where fully biodegradable, osteoinductive features with a mechanically robust composite system can be achieved. Additionally, the new materials would have potential to be doped with constituents such as growth factors and drugs for programmed release.21
Silica is ubiquitous in nature.22 For example, diatoms are eukaryotic cells capable of producing silica minerals for structural support and protection in the form of a shell.23 The processes by which these structures are made involve a specific set of proteins (silaffins) that promote the deposition of silica, in a region of the diatoms known as the silica deposition vesicle.22 The R5 domain (SSKKSGSYSGSKGSKRRIL), a component of a silaffin protein, has been identified as silica promoting in vitro as well as in nature.24 The R5 peptide has been previously used to functionalize recombinant spider silk like proteins and did not disrupt the R5 silica deposition ability.25 Other peptides including A1 (SGSKGSKRRIL) and the A3 peptide (MSPHPHPRHHHT), derived from the R5 peptide and phage display, respectively, showed silica deposition activity.26, 27 Previous composite samples were produced via genetic engineering using a 15 repeating unit of the 33 amino acid consensus sequence of the major ampullate dragline spindroin 1 (MaSp 1) from Nephila clavipes (SGRGGLGGQG AGAAAAAGGA GQGGYGGLGSQGT) and the three peptides mentioned above were covalently coupled to the silk via a linker. In our previous studies, the ability of each peptide to promote silica condensation in the context of β-sheet crystalline structure formation from the silk was determined.25
The current study was focused on further understanding of the role of the position or location of the R5 sequence relative to the silk component in terms of silica formation. The addition of the R5 peptide was performed directly at the C- or N-terminal of the silk repeating unit and the physical and chemical properties of the two protein constructs were analysed relative to the induction of silica precipitation and compared to previous data.
2. Materials and Methods
2.1. Construction of recombinant silk and silk-silica chimeras
The following constructs were designed: 15mer-ch, nh-15mer, R5-15mer-ch and nh-15mer-R5. 15mer-ch and nh-15mer are spider silk constructs build of 15 repeating units (SGRGGLGGQG AGAAAAAGGA GQGGYGGLGSQGT)15 that carry a Histidine tag (His6 = h) on the C-terminal and N-terminal end, respectively. R5-15mer-ch is a 15mer-ch based construct that has the R5 sequence (SSKKSGSYSGSKGSKRRIL), at N-terminal end, whereas nh-15mer-R5 is nh-15mer based construct that has the R5 sequence at C-terminal end. Plasmids pET30ch and pET30nh were used as cloning vectors, where the His-tag is located at the C- or N-terminal of the genetic constructs, respectively. Both pET-30ch and pET-30nh are pET-30a(+) (Novagen, San Diego, CA, USA) derivative vectors. The construction of the cloning vectors pET-30ch and pET-30nh was performed in a similar fashion to that described previously.28 Briefly, for the construction of pET-30ch linkers 1F and 1R were used, whereas for the construction of pET-30nh linkers 2F and 2R were used. The cloning cassette linkers 5’TATGGCTAGCGGTGACCTGAATAACACTAGTC3’ (linker 1F), TCGAGACTAGTGTTATTCAGGTCACCGCTAGCCA (linker 1R), 5’TATGCACCATCATCATCATCATGCTAGCGGTGACCTGAATAACACTAGTTAAAC3’ (linker 2F) and TCGAGTTTAACTAGTGTTATTCAGGTCACCGCTAGCATGATGATGATGATGGTGCA (linker 2R) were generated with NdeI and XhoI sites and prepared by annealing two complement synthetic nucleotides (1F-1R and 2f-2R). Annealing was accomplished by decreasing the temperature of a 20 pmol/µL oligonucleotide solution from 95 to 20°C at a gradient of 0.1°C/s. Mismatched double strands were denatured at 70 °C followed by a further temperature decrease to 20 °C. This cycle was repeated three times. The resulting double stranded linker was ligated into pET30a(+) previously digested with NdeI and XhoI. Both restriction sites were preserved after ligation. The resulting cloning vectors were referred to as pET30ch and pET30nh. The His-tag in the pET30nh vector was integrated as an NdeI/NheI fragment using pre-annealed oligonucleotides TATGCACCATCATCATCATCATG His-tagF and CTAGCATGATGATGATGATGGTGCA His-tagR. Next, a 1485bp DNA NheI/SpeI fragment containing genetic sequence coding for artificial silk protein, 15mer (SGRGGLGGQGAGAAAAAGGAGQGGYGGLGSQGT)15, was inserted into pET30ch and pET30nh to yield pET30ch-15mer and pET30nh-15mer, respectively.29 To prepare the chimeras with the R5 sequence fused at the C- and N-terminus of the 15mer, pET30ch-15mer and pET30nh-15mer were digested with SpeI and then treated by antarctic phosphatase (NEB, Ipswich, MA, USA) to prevent self-ligation. The nucleotide sequences of R5 were designed with restriction endonuclease sites NheI and SpeI flanked at the 5′ and 3′ termini, respectively. Codons were optimized for expression in Escherichia coli strain BL21(DE3) by using the on-line tool OPTIMIZER and were synthesized commercially (Invitrogen, Grand Island, NY, USA). The synthesized nucleotides were annealed to generate double strands and then ligated to generate the constructs pET30ch-R5-15mer and pET30nh-15mer-R5. E. coli DH5α cells were transformed and positive clones were selected on lysogeny broth (LB) plates supplemented with kanamycin (50 µg/mL).
2.2. Expression and purification of recombinant silk and silk-silica chimeras
The recombinant silk constructs were expressed in E. coli strain BL21 Star (DE3) (Invitrogen, Grand Island, NY, USA). A fermentor (Bioflo 3000, New Brunswick Scientific, Edison, NJ, USA) was used for the expression. Cells were cultivated at 37°C in LB medium with 50 µg/mL kanamycin. Once the optical density OD600 reached 0.8, the isopropyl β-d-1-thiogalactopyranoside, IPTG (Sigma-Aldrich, St. Louis, MO, USA) was added at a final concentration of 1 mM to induce expression. After 5 h cells were harvested by centrifugation for 20 min at 8,000 rpm. Recombinant silk protein and chimeras were purified by Ni-NTA affinity chromatography as previously described26. Once purified, proteins were dialyzed and lyophilized26. Protein identity and purity were confirmed by SDS-PAGE (Invitrogen, Grand Island, NY, USA).
2.3. Silk Films
2.3.1. Silk Film production
Polydimethylsiloxane (PDMS) discs were formed as an inert support material for silk film formation in a Clean room. Sylgard 184 PDMS (mlsolar, Campbell, CA, USA) base and curing agent were mixed in a 10:1 ratio in a petri dish and then placed under vacuum for 1 hour so that releasing the vacuum removed the bubbles. The solution was then placed in an oven set to 570C for 4 hours. A 6 mm diameter cork borer was used to produce discs. Next, a 2.5% solution of each recombinant protein (nh-15mer, nh-15mer-R5, 15mer-ch, R5-15mer-ch) was produced using 1,1,1,3,3,3-hexafluoroisopropanol (HFIP) (Sigma-Aldrich, Dorset, UK), the silks were allowed to dissolve overnight at room temperature. A 30 µL aliquot of the silk-HFIP solution was pipetted onto the 6 mm PDMS discs and air dried overnight. The silk films were then annealed with aqueous methanol using a vacuum oven set to 635 mbar containing 4 petri dishes: 2 containing a 60% aqueous methanol solution and 2 containing cotton wool soaked in a 60% aqueous methanol solution.
2.3.2. Silicification of films
For induction of silicification, the recombinant proteins (nh-15mer, nh-15mer-R5, 15mer-ch, R5-15mer-ch) mounted on a PDMS substrate were placed in a 24 well plate with 1 mL of pre-hydrolysed 30 mM tetraethyl orthosilicate in pH 7.4 buffer solution (Sigma-Aldrich, Dorset, UK) for 1 hour.26 The films were then rinsed twice with water and left to dry overnight in a fume hood.
2.3.3. Scanning Electron Microscopy and Microanalysis (SEM-EDX)
SEM-EDX at 20 kV (JEOL 840, UK with Oxford Instruments Inca X-ray microanalysis, Oxford, UK) was used to observe the morphology and size of the particles and obtain information on the elemental composition of the films. Each sample was mounted onto electrically conducting carbon tape on aluminium stubs before being gold coated using an argon gold plasma at 30mV and 1.2 kV for 2 minutes. A minimum of 50 particle diameters were measured and averaged to determine the particles size.
2.3.4. Molybdenum Blue Assay
The concentration of silicic acid remaining in solution was measured via a molybdenum blue assay.25 In brief, 10 µL of sample was added to 1.5 mL molybdic acid with 15 mL distilled water. After 15 minutes 8 mL of reducing agent was added, and the absorbance measured as above within 2–24 hours of reducing agent addition and compared against suitable dilutions of a 1000 ppm SiO2 standard treated the same way.
2.3.5. Fourier Transform Infrared Attenuated Total Reflectance Spectroscopy (FTIR-ATR)
Protein conformation was assessed using FTIR-ATR (Frontier, PerkinElmer, Coventry, UK), with an average of 40 scans over a range of 4000-650 cm−1. Silk films were analysed before and after annealing to observe changes in structure. Thermo Grams A1 software v8.0 was used for curve fitting, including baseline corrections. Six points were chosen from the amide I band (1700-1580 cm−1), and 4 for the conformer absorbances (β-turn 1690-1662 cm−1, α-helix 1662-1645 cm−1, random coil 1645-1637 cm−1, β-sheet 1637-1613 cm−1).30, 31 The remaining 2 bands were introduced to correct for sidechain carbonyl groups and non-baseline resolution of the amide I and II bands. Absorbance bands were restricted to these parameters with the width limited to between 8 and 30 cm−1 (at half height). An iteration was carried out forcing all peaks to have a positive area with a linear baseline and then up to a further 1,000 iterations carried out for curve fitting. The sum of the areas under the relevant peaks was found and each conformer expressed as a percentage of the total.
2.3.6. Wettability and surface energy measurements
The wettability and surface energy of each silk sample was measured using a Theta Attension Instrument with OneAttention v 1.7 software (Biolin Scientific, Staffordshire, UK). A silk film mounted on a PDMS substrate was placed on the stand, and using a syringe a 5 µL droplet of water, dimethyl formamide or ethylene glycol was placed on the surface and the contact angle at each side of the droplet measured ten times and an average taken. It was not possible to measure contact angles of the non-annealed films with DMP and ethylene glycol as they dissolved in the solvents.
2.4. Solution Studies
2.4.1. Zeta Potential
The charge of each protein sample was determined by zeta potential measurements (NanoS Zetasizer, Malvern, UK) over a pH range of 5 to 9. A 1 mg/mL solution of each chimeric protein sample was prepared using 0.1 M citric acid, the solutions were then filtered using a 200 nm membrane. Five measurements were collected at each pH and an average taken. The pH adjustment was achieved by the addition of 0.1 M bis tris propane buffer and the measurements repeated.
2.4.2. Particle Size Measurements
The average particle size was measured using a Malvern NanoS Zetasizer (UK), over a pH range of 5 to 9 on samples prepared as above. Five measurements were collected per protein at each pH and an average taken.
2.4.3. Silicification in aqueous media
The effect of the chimeras on silica precipitation from a metastable monosilicic acid system was investigated. In a 96 well plate 200 µL of 1.0 mg/cm3 silk/chimera solutions buffered to pH 3–9 with 0.1 M bis tris propane/citric acid mixtures was pipetted and then 6 µL of prehydrolyzed tetraethoxysilane (TEOS) solution added (2.23 cm3 TEOS dispersed in and diluted to 9.9 cm3 with 50% aqueous ethanol, 100 µL of 1 M HCl added and allowed to hydrolyze for 10 min) to give a final [Si(OH)4] of 30 mM. The progress of the condensation process (conversion of monosilicic acid to silica) was monitored by turbidity measurement at 595 nm in a Tecan infinite M200 pro plate reader to ensure that the process was complete before isolation of the siliceous material produced. The silica was then sedimented by centrifugation (5 minutes at 3000 RPM) and washed three times with water before freeze drying after flash freezing in liquid nitrogen. The reaction supernatant was retained for analysis of residual monosilicic acid by the molybdenum blue method described previously25 and protein content by a modified Bradford assay.
2.5. Cell Survival and Proliferation
Human mesenchymal stem cells (hMSCs) were isolated from fresh bone marrow aspirates (Lonza, Basel, Switzerland), cultured in Dulbecco’s Modified Eagle Medium (supplemented with 10% fetal bovine serum, 0.1 mM non-essential amino acids, 1 ng/mL bFGF, 1% antibiotic/antimycotic) and seeded at passage 2, as previously described32. For seeding, recombinant silk-silica films were prepared as described above and sterilized in ethylene oxide for 16 h at 4 °C33 and stored aseptically until seeding. Cells were seeded at a density of 5,000 cells per cm2, and allowed to adhere for 30 min prior to flooding with media. All cell culture was performed in an incubator maintained at 37 °C and 5% CO2. The cells were cultured in hMSC media until 85% confluency, and then the medium was changed to an osteogenic medium StemPro Osteogenesis Differentiation Kit (Gibco, Life Technologies, Grand Island, NY, USA). The medium was changed every 3–4 days. Cell growth and shape were monitored using a phase-contrast light microscope (Carl Zeiss, Jena, Germany) equipped with a Sony Exwave HAD 3CCD (Sony Electronics Inc., Park Ridge, NJ, USA) colour video camera.
Cell adherence and viability were determined 14 days post seeding, using LIVE/DEAD Viability/Cytotoxicity Kit (Life Technologies, Grand Island, NY, USA) following the protocol recommended by the manufacturer. Briefly, cells were incubated with calcein AM and ethidium homodimer-1 (EthD-1) for 60 min to stain live (green) and dead cells (red), respectively. After staining, the films were washed three times with phosphate-buffered saline (PBS) and imaged using a fluorescence microscope (Keyence BZ-X700, Itasca, IL, USA) with excitation at 488 nm and emission at 499–537 nm for live cells and excitation at 543 and emission at 620–650 nm for dead cells.
2.5.1. Scanning electron microscopy (SEM)
SEM was used to determine cell growth on the silk-silica films. Following fixation with 4% glutaraldehyde for 15 min, the cells were washed 3 times with PBS. Fixed samples were allowed to air dry in a fume hood. Samples were coated with gold and then observed using a Carl Zeiss (Carl Zeiss SMT, Oberkochen, Germany) Ultra 55 field emission scanning electron microscope at an acceleration voltage of 5 kV.
2.6. Biochemical analysis of cellular calcification
Four and eight weeks post-seeding, films were washed in PBS and osteogenesis was analysed by staining each film with Alizarin Red S (Sigma-Aldrich, St. Louis, MO, USA) to monitor calcium levels in l deposits formed. Cells were fixed with 4% glutaraldehyde for 15min and washed three times with PBS. Next, films were incubated with 2% Alizarin Red S pH 4.2 at room temperature in the dark for 30 min and washed 3 times with PBS. Calcification was monitored using a phase-contrast light microscope (Carl Zeiss, Jena, Germany) equipped with a Sony Exwave HAD 3CCD (Sony Electronics Inc., Park Ridge, NJ, USA) colour video camera. For quantitative analysis of calcium deposition, cells after 4 weeks of culture were first lysed in 0.2% (w/v) Triton X-100 and DNA content was measured using the PicoGreen assay (Molecular Probes, Eugene, OR, USA), according to the protocol of the manufacturer. Samples were measured fluorometrically at an excitation wavelength of 480 nm and an emission wavelength of 528 nm. Calcium was extracted twice with 0.5 mL 5% trichloroacetic acid. Calcium content was determined by a colorimetric assay using o-cresolphthalein complexone (Sigma Aldrich, St. Louis, MO, USA). The calcium complex was measured spectrophotometrically at 575 nm.
2.7. Statistical Analysis
All data provided are taken from averages with the total number of data points denoted by N=x and the error plotted as a function of standard deviation. The molybdenum blue assay data is reported for 10 replicate measurements. The protein conformation data is based on 3 separate measurements on different samples, all zeta potential measurements were repeated 5 times and contact angle measurements were performed 20 times, 10 at each of the left and right contact angle.
3. Results and Discussion
3.1. Recombinant production of silk-silica fusion proteins
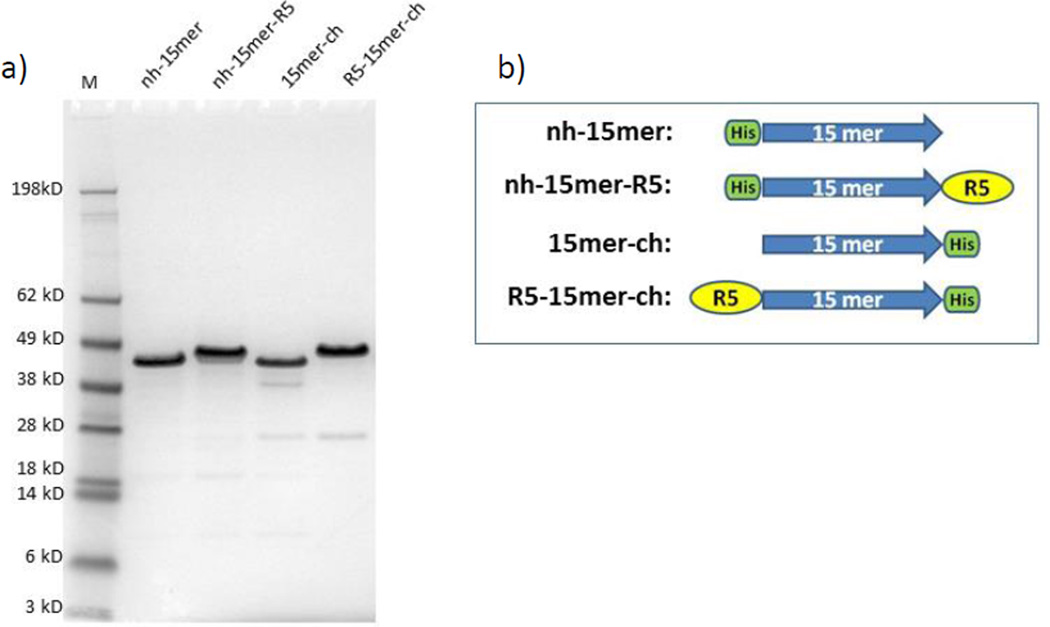
Recombinant spider silk-silica chimeras were cloned by fusing spider silk 15mers with the R5 domain at either C- or N-terminal domain of the spider silk. A similar chimeric protein was designed previously by fusing 15 repeating units of MaSp 1 and R5 peptides via a linker sequence. The ability of this sequence to induce silica precipitation was demonstrated.25 However, to improve the silicification process and to avoid possible effects of the interconnecting linker sequence a new set of chimeric proteins was designed without the linker sequence. In addition, this new approach allowed insight to be gained on the influence of the position of the R5 domain relative to the spider silk sequence and its impact on protein structure, silicification and cell mineralisation. Figure 1 illustrates the successful expression and purification of the recombinant constructs nh-15mer (40 kDa), nh-15mer-R5 (43 kDa), 15mer-ch (40 kDa) and R5-15mer-ch (43 kDa).
Figure 1.
SDS-PAGE of purified recombinant silk-silica chimeric proteins. (a) nh-15mer (~40 kDa), nh-15mer-R5 (~43 kDa), 15mer-ch (~40 kDa) and R5-15mer-ch (~43 kDa), were run on the 4%-12% Bis-Tris acrylamide gel and stained with Simple Blue dye. Marker (M) sizes are indicated on the left. (b) Schematic representation of silk-silica fusion proteins design strategy; His-tag (green box) has been added to spider silk 15mer (blue arrow) at N-terminal end of nh-15mer and nh-15mer-R5 constructs, and C-terminal end of 15mer-ch and R5-15mer-ch constructs; R5 domain (yellow circle) has been added to the C-terminal of nh-15mer-R5 and N-terminal of R5-15mer-ch.
3.2 Solution Studies
3.2.1 Silicification in solution
The four proteins, when introduced into the model silicifying system generated material that sedimented within 30 minutes of the reaction, dramatically quicker than the ‘blank/control’ silicifying sample (no protein), where ca. 24 hours was required for material to sediment.
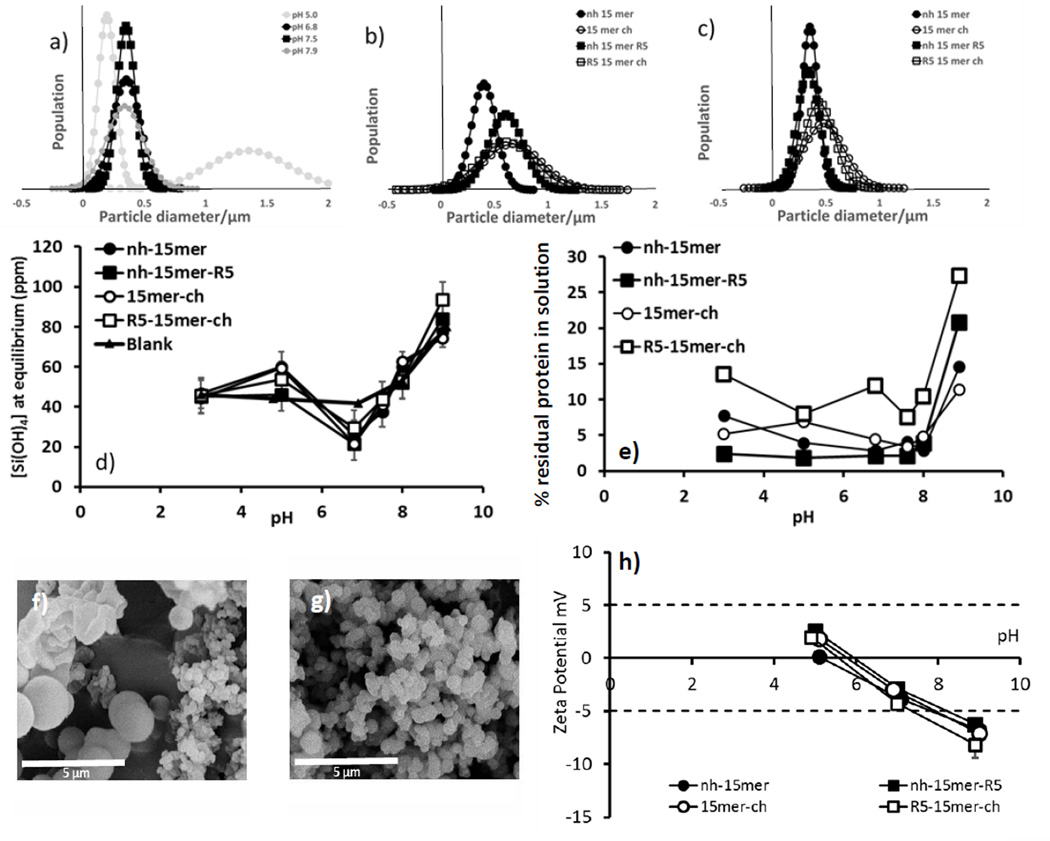
In contrast to the blank/ control which generated ca. 2–4 nm particles, all of the silk constructs produced spherical silica particles that were distinctly bigger at all pH values measured, Figure 2. Greater size control was shown to be dependent on the location of the R5 peptide and the pH at which silicification occurred, Figure 2b,c. It has been previously shown that for nh-15mer-R5 containing a linker between the His tag and the silk domain, silicification outside of a circum neutral pH range (ca. 6–8) leads to poor control over particle size.25 For the current study a blank (nh-15mer) was measured at pH 5 to 7.9, Figure 2a. Reaction at pH values just to either side of neutral (6.8 and 7.5) produced the most uniform particles, while an increase in pH to slightly basic pH showed a range of particles sizes that were larger on average and more size dispersed. Reduction of pH to mildly acidic conditions (pH ~ 5) produced silica with average sizes of ca. 200 nm and 1400 nm being both smaller and larger than the particles formed in the more controlled circumneutral systems suggesting in vivo environments at neutral pH’s would allow control of the silica particles deposited by the materials.
Figure 2.
Particle size analysis in solution of (a) nh-15mer condensed silica pH 5.0 – 7.9 (grey scale intensity indicates level of control shown at each pH (darker scale - more control)), (b) silica condensed at pH 6.8 and (c) at pH 7.5 in the presence of the different chimeras; solution concentration of (d) residual monosilicic acid and (e) silk chimeras at equilibrium time. Error analysis based on standard deviation on 5 separate samples (f), (g) example SEM images of nh-15mer at pH 5 (f) and 6.8 (g) (h) Zeta potential data over a range circumneutral pH’s for aqueous solutions, 1 mg/mL of the nh-15mer, nh-15mer-R5, 15mer-ch and R5-15mer-ch, N=5 for all methods other than particle size measurement by SEM where a minimum of 50 particles were measured.
Figure 2b,c show the particle size distribution of the two R5 and non-chimeric samples, where both ch tagged constructs produced a wider range of particle sizes suggesting poorer control over silicification in solution compared with the nh-15mer and the nh-15mer-R5 at pH 6.8 and 7.5. At the optimum pH (7.5 based on minimum particle size dispersity) the non-chimeric and R5 nh constructs both produced silica particles of a mean diameter of around 400 nm. Figures 2f,g show pictorially the difference between silica formed at pH 6.8 (tight control over particle dispersity) and pH 5 (poor control over particle dispersity).
For all silicification reactions performed in the presence of the silk constructs, a reduction in the equilibrium concentration of monosilicic acid at circumneutral pH when compared to a buffered blank, figure 2d, was observed highlighting the beneficial effects of the silk constructs on silicification Figure 2e shows the concentrations of protein remaining in the supernatant, and showed minimum solution concentration (90–98% removed from solution) at around circumneutral pH where the rate of silica condensation reached a maximum. Higher levels of the nh-silk constructs were removed from solution than for the ch-silk constructs. The chimeras were removed from solution by entrainment into the condensed silica but at higher pH the level of dissolved protein was significantly higher due in part to the higher silica solubility and therefore release of protein back into solution and also to the reduced positive charge on the nitrogen side chains of proteins affecting the affinity of them with the negatively charged silica.
3.2.2 Protein charge in solution: Zeta Potential measurements
Particle aggregation of silk proteins in solution can occur due to hydrophobic interactions. A stable colloidal solution requires sufficient repulsion of particles from surface charges to prevent aggregation. With sufficient charge, proteins tend to form stable colloids of isolated molecules, but as charge is removed by changes in pH these tend to be increasingly replaced by aggregated systems. This aggregation and the forming of larger aggregates has been proposed as the mechanism by which silk chimeras have been able to influence the morphology of the silica produced when the colloidal instability and maximum silica condensation rates coincide.25
The charge on the proteins as measured via zeta potential showed that all samples, over the pH range explored, contained non-stable particles prone to aggregation with values in the ≤ ± 5 mV region, Figure 2h. All samples had an isoelectric point between 5 and 6 (Figure 2h). The location of the R5 peptide on the silk repeating unit appeared to have little effect on the zeta potential at any pH. Similar results were obtained previously for samples that contained the linking unit.25 The data also suggests that lower pH offered greater stability for all silk samples with respect to particle aggregation.
3.3 Silk films
3.3.1 Silicification- particle size and morphology
Silica particles formed with these proteins should be homogeneous within the materials and large enough to strengthen the material. For practical use a ‘good’ material will be capable of inducing accelerated silica deposition to give a high silica presence with controlled silica particle size to aid the regrowth of bone and not obstructing the formation of bone-implant interface. These features can be exploited for bone growth and improved resilience to deformation under compression.
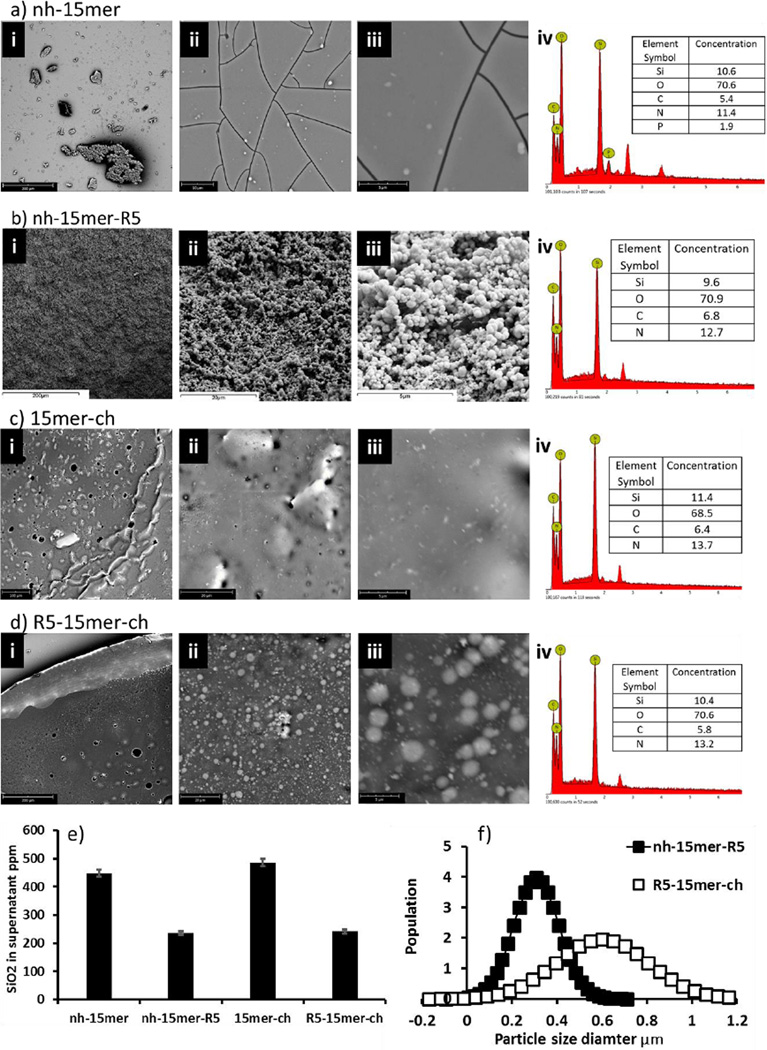
Figure 3a–d shows the effect of the presence and position of the R5 construct on the extent of silicification. EDX data for all four constructs confirm the presence of protein (via detection of ‘N’) and ‘Si’ on all films, Figure 3a–d panel iv. Only films prepared from constructs containing the R5 moiety show recognisable silica particles on the surface, with those for nh-15mer-R5 being the surface with the highest overall coverage of particles (Figure 3b,d). Measurement of the particle sizes on these two surfaces, Figure 3d showed that particles formed on the surface of the nh-15mer-R5 chimera films were smaller (average ca. 300 nm diameter) and more monodisperse than silica particles formed on the R5–15mer-ch films, Figure 3b (average ca. 600 nm diameter). A comparison to silica formation on films containing the additional linker in addition to the nh-15mer-R5 construct presented a monolayer of small silica particles of approximately 100 nm diameter (data not shown).25
Figure 3.
a-d. Scanning electron microscopy images of the silicified films at different magnifications (i-iii) with energy-dispersive X-ray spectroscopy data (iv) of the area represented by (iii). a-d represent the nh-15mer, nh-15mer-R5, 15mer-ch and R5-15mer-ch respectively, with (i) showing areas of 100-200 µm (ii) 10-20 µm and (iii) 5 µm, (e) Molybdenum blue assay of the supernatants after 1 hour silicification of the nh-15mer, nh-15mer-R5, 15mer-ch and R5-15mer-ch samples, N=10. (f) Particle size data from SEM images for the nh-15mer-R5 and R5-15mer-ch samples, N=100.
Additional support for silicification taking place on all surfaces is given from analysis of the silica remaining in solution after the films had been silicified (Figure 3e). All silk constructs removed silica from solution with the effect being greatest for the two constructs containing the R5 peptide. Although different sizes of silica particles were observed to form (Figure 3d) there was little difference in the overall levels of silica condensed for the constructs (Figure 3e). In solution the non-chimeric control constructs were shown to exert control over the morphology of the silicified material and this is probably due to the presence of the basic His tagged domain. This effect is clearly lost when films are formed on a PDMS substrate and subsequently annealed suggesting that the His tag may be no longer available for interaction with silica but that the R5 on the chimeras still is. An alternative view is that the R5 domain may reduce the affinity of the chimeras for the PDMS substrate and allow partial solubilisation of the protein back into solution during the silica condensation process resulting in a layer of silica particles similar to those observed during the solution chemistry study.
The presence of silica on all surfaces shows that they are not repelling the deposition of condensing silica but that the non-chimeric control films appear to be passive rather than active in the process.
3.3.2 Materials Properties of the films
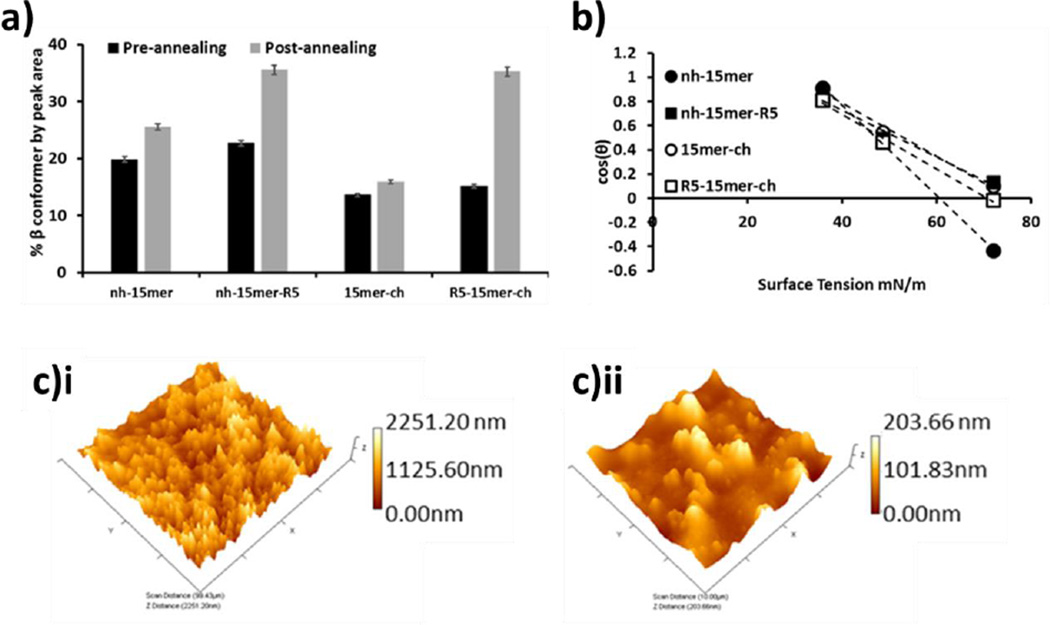
The secondary structure of silk gives rise to its high mechanical and tensile strength and thus it is instructive to know the natural levels of protein conformers present and their susceptibility to change. Using FTIR-ATR the effectiveness of the annealing process on inducing β-sheet structure was evaluated by analysis (peak deconvolution) of the amide I band (1600–1700 cm−1). The amide I band arises primarily from the stretching vibrations of the C=O bond, with location dependent on the structural conformation of the backbone and the hydrogen bonding present.34, 35 This analysis allows quantification of structural types, distinguishing between random coil and beta type structures. Figure 4a depicts the β sheet/turn content of the samples before and after annealing. Example deconvoluted spectra are provided in the supplementary information and quantitative data presented in Table 1. Before annealing, the samples with the His tag at the N terminus exhibited higher levels of sheet/turn. As expected, once annealed, all samples showed increased β-sheet and β-turn content. This was observed in the shift of the amide I band (from approximately 1650 cm−1 to 1630 cm−1), along with the change in peak shape, SI.
Figure 4.
(a) Nature of the nh-15mer, nh-15mer-R5, 15mer-ch and R5-15mer-ch silk films before and after annealing measured as percentage area assigned as β sheet or turn. Error statistics are the standard deviation of 3 peak fitting results for each sample. (b) Zisman plot of the genetic constructs. N=20. (c) Representative AFM 3D images for 15mer-ch sample i) before annealing ii) after annealing, scanned areas 100 µm.
Table 1.
Roughness and wettability data collected for the nh-15mer, nh-15mer-R5, 15mer-ch and R5-15mer-ch. Contact angles: N=20, surface roughness N=3, surface energies N=3.
| Nh-15mer | nh-15mer R5 |
15mer-ch | R5-15mer ch |
|
|---|---|---|---|---|
| Contact Angle 0 Before Annealing | 46.5 ± 1.7 | 55.0 ± 0.6 | 56.4 ± 1.2 | 43.4 ± 0.7 |
| Contact Angle 0 After Annealing | 115.7 ± 0.02 | 74.6 ± 0.003 | 84.2 ± 0.02 | 90.9 ± 0.03 |
| Roughness Before Annealing Rq* | 348.9 ± 10.4 | 229.7 ± 6.8 | 310.2 ± 9.2 | 167.1 ± 5.0 |
| Roughness After Annealing Rq* | 332.3 ± 9.9 | 118.0 ± 3.5 | N/A | 99.2 ± 3.0 |
| Surface Energies** | 33.9 ± 0.8 | 25.8 ± 2.8 | 30.3 ± 0.2 | 26.4 ± 0.9 |
| Percent Beta Structure Before annealing | 19.9 ± 0.4 | 22.7 ± 0.5 | 13.6 ± 0.3 | 15.2 ± 0.3 |
| Percent Beta Structure After annealing | 25.6 ± 0.6 | 35.54 ± 0.8 | 15.9 ± 0.4 | 35.2 ± 0.8 |
Root mean square
2nd order standard deviation used as error.
The most dramatic change was observed for the R5-15mer-ch sample. In both cases, the presence of the R5 domain in the silk constructs enhanced the transformation to the structurally more robust beta silk structure.
The surface properties of the silk materials were assessed before and after annealing by atomic force microscopy (surface roughness) and by measurement of contact angles using a range of liquids to obtain information on wettability and ‘surface’ energy (Figure 4b,c and Table 1). These properties were measured as the surface roughness and wettability of a biomedical material can have a large effect on whether the materials are accepted or rejected in the body.
Contact angle measurements were made on the R5 peptide containing film samples (nh-15mer-R5, R5-15mer-ch) mounted on PDMS, a known hydrophobic surface, before and after annealing using water. However, it was only possible to use the annealed film surfaces with liquids having a lower surface tension than water as the pre-annealed film samples were too porous/soluble to be assessed further. Films prepared with all silk constructs were hydrophilic before annealing with increases in hydrophobicity, commensurate with the observed changes in beta sheet content (Figure 4a) being measured for all samples post annealing, The differences in contact angle before/after annealing was greatest for the samples without the R5 moiety (Table 1). The samples containing R5 were more hydrophilic than their corresponding His tagged counterparts after annealing. The surface energies of the silks containing the R5 constructs were reduced compared to the silk constructs only having a His tag (Figure 4b and Table 1) though the position of the R5 peptide had little effect on the values obtained. AFM analysis of the sample surfaces was used to measure surface roughness (Figure 4c and Table 1). All materials containing the R5 construct were smoother than their counterparts before annealing with a significant reduction in roughness being observed for both constructs containing R5 after.
3.4 Mechanism of silica particle formation on silk films made from the genetic constructs
We have previously proposed that the formation of structure in silica condensation experiments performed in the presence of the silk chimeras was due to the development of silk aggregates at pH values corresponding to the natural maximum for silicic acid condensation in solution.25 In this study we are additionally investigating the effect of a solid interface (silk chimera) with the silicifying medium. In the absence of the spherical structures these chimeras generate in solution, we would expect at most to see the silica deposited ‘within’ the surface if the monosilicic acid has access to it or ‘on’ the surface with electrostatic attachment if silicic acid condensation proceeds in solution in the absence of the protein. For the non-chimeric constructs this behaviour may indeed be the case as EDX analysis shows the presence of silica ‘on/within’ the films. Whether this is merely a coating of the normal 2–4 nm silica particles produced as for the ‘blank’ silicification reaction in the absence of protein, or a layer infused within the protein layer could not be determined but the spheres and porosity generated by the constructs containing the silicifying R5 moiety is clearly missing.
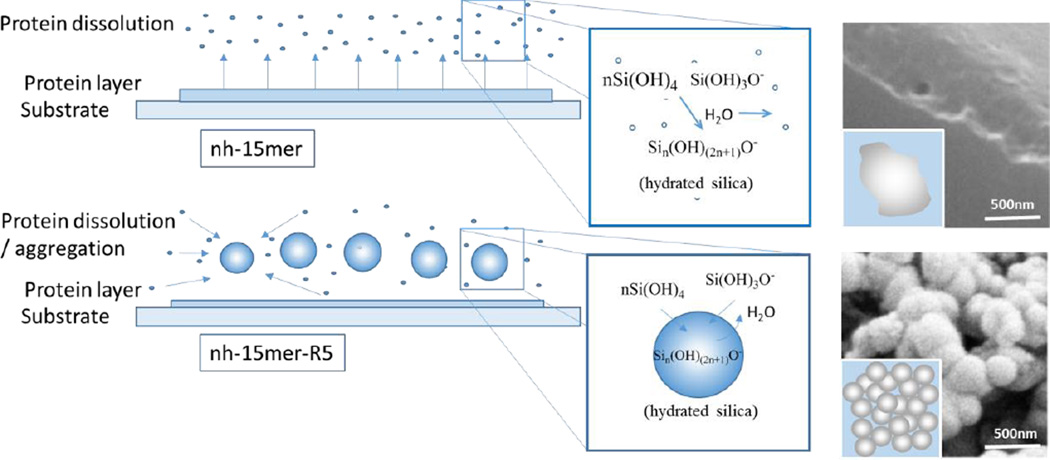
In order to understand the differences in behaviour of the constructs containing the R5 silicifying domain positioned at either end of the repeating silk domain as well as the role of the His tag in silicification the FTIR, AFM and wettability data have to be compared (Table 1). The annealed silk constructs with the R5 moiety have higher β type content (FTIR spectroscopy) and should yield a more hydrophobic surface, however contact angle measurements do not support this with the non-chimeric nh-15mer exhibiting the highest contact angle (Table 1). However the surface roughness is much higher than the R5 constructs and the scale according to the AFM data is of the correct range to invoke the Cassie-Baxter model of wetting for this surface and the Wenzel model for the R5 constructs.36, 37 The surface energy measurements support this hypothesis in that the annealed chimeric proteins containing the R5 silicifying domain both exhibit lower surface energies and are more hydrophobic than films made from the nh-15mer construct. Since entropic forces controlled by hydrophobic domains drive the control of aggregation in these types of protein then aggregation will be favoured for the R5 constructs. The experimental data suggest that when these are immersed in the silicifying medium some of the layer becomes re-dispersed near the reaction interface. The R5 constructs due to their higher hydrophobic nature more readily collapse through entropic forces to aggregates whilst the non-chimeras remain largely isolated at the interfacial layer. As a consequence the silica condenses within the R5 chimera aggregates as for the observed solution studies but the same scale of structure does not develop in the presence of the protein constructs that only contain a His tag. Scheme 1 shows the proposed mechanism for the formation of silica at the protein film surface.
Scheme 1.
The proposed mechanism for the formation of silica at the protein film surface. The non chimeric nh-15mer after dissolution remains mainly as un-associated single molecules or small clusters. The nh-15mer-R5 chimera due to its higher hydrophobic nature forms entropically favoured aggregates/droplets inside which the silicification process is activated through an electron donor/acceptor mechanism and the active elimination of water molecules.
3.5. Cell compatibility of chimeric silk-silica films and osteogenic potential
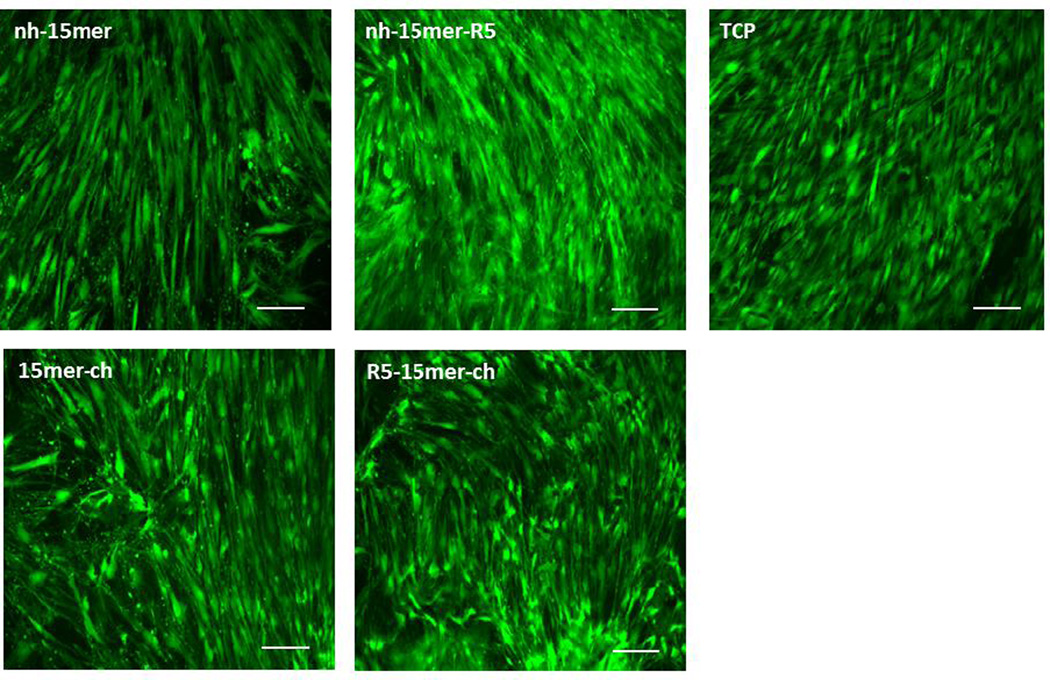
Low cytotoxicity and good mammalian cell adhesion are factors required for biomaterial design. To analyze the ability of silk-silica fusion proteins to support hMSC growth and promote differentiation, the cells were grown on the various film surfaces and assessed by live/dead staining. Fluorescent imaging of live/dead staining confirmed that the hMSCs seeded on the films adhered as compared to the control tissue culture plate (TCP) surface and also supported cell growth and proliferation for 2 weeks (Figure 5). An elongated morphology of hMSCs was observed on all tested surfaces after 14 days suggesting healthy growth of hMSCs and minimal cytotoxicity of the recombinant silk-silica fusion proteins (Figure 5). No differences in terms of cell viability were observed between the different recombinant silk-silica constructs.
Figure 5.
Human mesenchymal stem cell interactions on recombinant silk and silk-silica films. Live (green) and dead (red) fluorescent staining was performed on hMSCs cells grown on nh-15mer, nh-15mer-R5, 15mer-ch, R5-15mer-ch and tissue culture plate (TCP) two weeks post seeding. Scale bars are 100 µm.
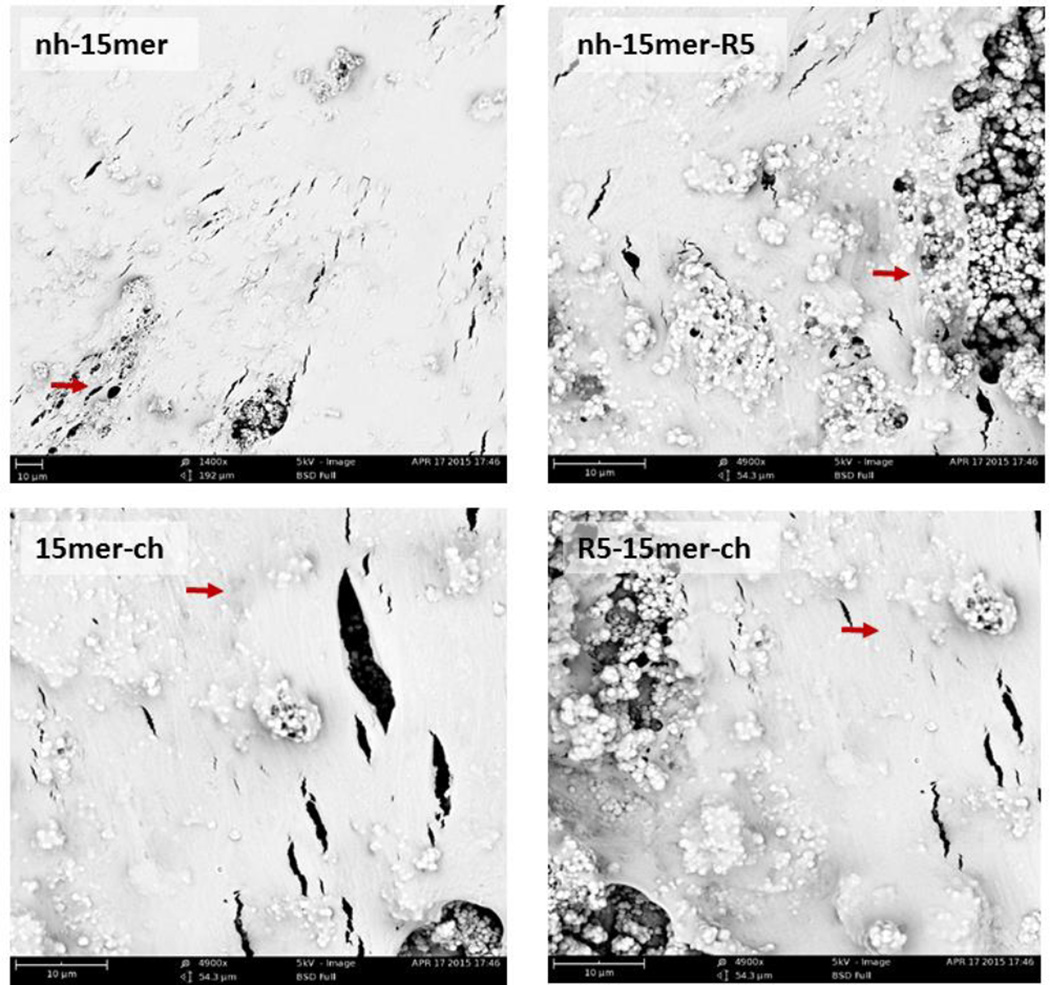
The growth of the cells was monitored during 8 weeks and imaged by SEM 8 weeks post-seeding. The results show conventional cell growth and high surface coverage of all examined recombinant constructs (Figure 6). Elongated cell morphology (red arrows) and spreading of the hMSC leading to complete confluency after 8 weeks was observed on all films tested. No difference was observed between constructs harboring the biomineralizing R5 domain and the silk only control samples, nh-15mer and 15mer-ch.
Figure 6.
SEM images of human mesenchymal stem cells grown on recombinant silk and silk-silica films. hMSC were grown on pre-silicified recombinant nh-15mer, nh-15mer-R5, 15mer-ch and R5-15mer-ch films. Osteogenesis was induced and cells were imaged 8 weeks post-seeding. Scale bars are 10 µm.
The ability of silk-silica fusion proteins to enhance bone formation was investigated. It has been previously shown that silk-silica films enhanced calcium deposition and influenced the upregulation of bone sialoprotein gene expression.20 The goal here was to analyze the ability of the different constructs in terms of their potential in enhancing bone regeneration in vitro. Osteogenic parameters were evaluated in the hMSC cultures grown on nh-15mer, nh-15mer-R5, 15mer-ch and R5-15mer-ch films. The deposition of calcium was evaluated 4 and 8 weeks post seeding.
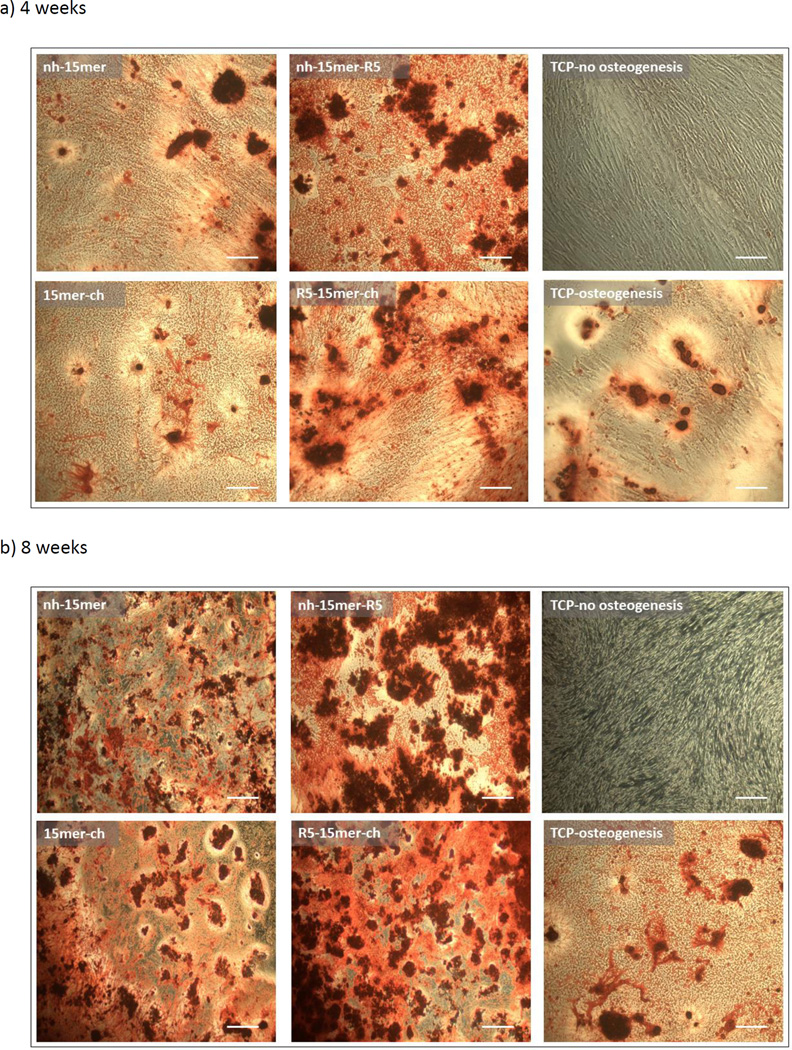
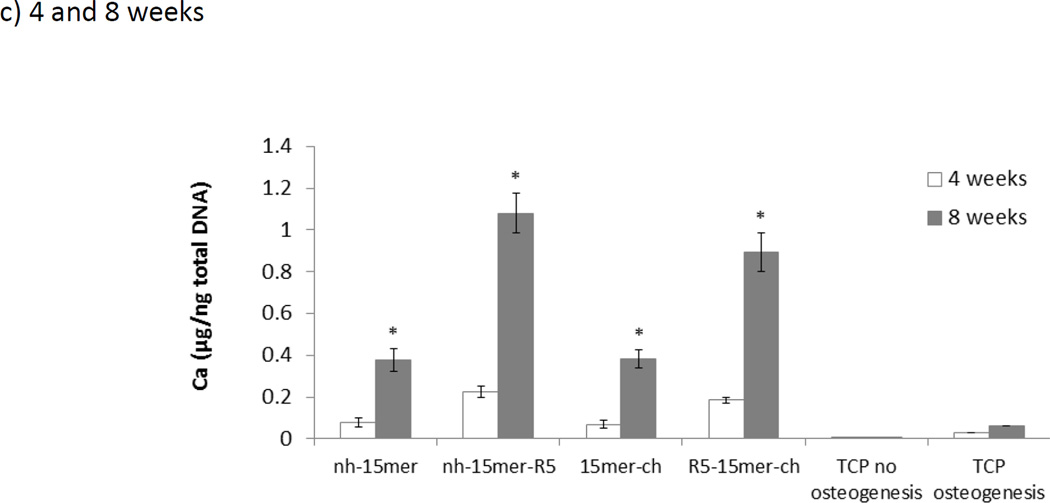
The cells were analyzed prior and post induction of osteogenesis. Calcium staining demonstrated the similar potential of the recombinant constructs lacking silicification domains to induce osteogenesis. Importantly, the potential of the recombinant silk-silica constructs, nh-15mer-R5 and R5-15mer-ch, to induce osteogenesis was higher when compared to silk alone, nh-15mer and 15mer-ch and control TCP samples (Figure 7). Both the N- and C-terminal domain located R5 constructs promoted calcium deposition, however, higher calcium deposition was observed four and eight weeks post-seeding on the nh-15mer-R5 film, possibly due to the higher rate of silicification on these films. Control samples 15mer-ch and nh-15mer induced less calcium deposition, showing the importance of the R5 domain in the process. Biochemical quantification of calcium content was performed after 4 and 8 weeks in culture. The differences between calcium deposition for nh-15mer, nh-15mer-R5, 15mer-ch, R5-15mer-ch and TCP no osteogenesis (negative control) and TCP osteogenesis (positive control) were evaluated. Deposition of calcium crystals was higher on all silk samples after 8 weeks when compared to 4 weeks post seeding (Figure 7c). Threefold higher calcium deposition has been observed on samples that carried R5 domain (nh-15mer-R5, R5-15mer-ch) than nh-15mer and 15mer-ch silk samples both after 4 and 8 weeks (Figure 7c). Silk had an effect on mineralization as well, as more mineral was deposited on silk samples than on the TCP osteogenesis samples. Overall amounts of calcium were similar for both nh-15mer and 15mer-ch, whereas higher deposition was observed on nh-15mer-R5 than on R5-15mer-ch (Figure 7c). Visualization of the mineralization with Alizarin Red S, further supported the biochemical data. No calcium deposition could be seen at 2 weeks of culture (data not shown). At 4 weeks, hMSCs were confluent in all groups (Figure 5, Figure 6) and showed mineral deposition (Figure 7), whereas no deposition could be detected from the control group on TCP where osteogenesis has not been induced (Figure 7).
Figure 7.
Calcium crystal deposition by differentiating human mesenchymal stem cell on the recombinant silk and silk-silica films. Calcium crystals (red) staining by Alzarin Red S was performed on hMSCs cells grown on nh-15mer, nh-15mer-R5, 15mer-ch, R5-15mer-ch and TCP four (a) and eight (b) weeks post seeding. Scale bars are 300 µm. (c) Quantification of calcium deposition of hMSCs grown on recombinant silk-silica constructs after 4 weeks (white bars) and 8 weeks (grey bars) in culture. Results for nh-15mer, nh-15mer-R5, 15mer-ch and R5-15mer-ch silk-silica constructs and TCP no osteogenesis and TCP osteogenesis are shown. Data are represented as the average ± standard deviation (n=3, *p < 0.05).
4. Conclusions
The present work demonstrated new designs of recombinant silk-silica proteins for potential utility in regenerative medicine. These new chimeras were also compared with silk proteins used in previous studies and showed that both in aqueous solution and as annealed films they facilitate the formation of silica precipitates after mineralisation similar to those reported for 6-mer and 15-mer constructs which had additional linker functions between the His tag and the repeat silk domains,26,36 and also in the presence of different silica precursors.29 The manipulation of the fusion protein sequence allowed control of biomineralization. Although the physical properties of biomedical materials are an important factor in the acceptance of an implant, the location of the R5 peptide appeared to have little influence on the surface properties with respect to the wettability and surface energies but did impact these measure when compared with non-chimeric constructs. The ability of all constructs to support cell growth was demonstrated in vitro. Nevertheless, the N-terminal location of the R5 biomineralization domain in the recombinant 15mer silk fusion proteins had a higher potential to induce silica precipitation and subsequently promote hMSC differentiation. The data supports the use of either of these chimeric silk samples while the chemical and physical data suggest that only minor variations occur in the relevant properties of the silk with or without the addition of the silicifying peptide in solution. The nh-15mer-R5 and R5-15mer-ch structures were both capable of controlled silica deposition on to the interface due to the control of protein particle sizes during silicification.
Supplementary Material
Acknowledgments
We thank the NIH (R01 DE017207) for support of this work.
References
- 1.Vepari C, Kaplan DL. Progress in Polymer Science. 2007;32:991–1007. doi: 10.1016/j.progpolymsci.2007.05.013. [DOI] [PMC free article] [PubMed] [Google Scholar]
- 2.Mobini S, Solati-Hashjin M, Peirovi H, Abu Osman NA, Gholipourmalekabadi M, Barati M, Samadikuchaksaraei A. Journal of Medical and Biological Engineering. 2013;33:207–213. [Google Scholar]
- 3.Xu Y, Shao HL, Zhang YP, Hu XC. Journal of Materials Science. 2005;40:5355–5358. [Google Scholar]
- 4.Fu C, Shao Z, Fritz V. Chemical Communications. 2009;43:6515–6529. doi: 10.1039/b911049f. [DOI] [PubMed] [Google Scholar]
- 5.Hakimi O, Knight DP, Vollrath F, Vadgama P. Composites Part B-Engineering. 2007;38:324–337. [Google Scholar]
- 6.Huemmerich D, Helsen CW, Quedzuweit S, Oschmann J, Rudolph R, Scheibel T. Biochemistry. 2004;43:13604–13612. doi: 10.1021/bi048983q. [DOI] [PubMed] [Google Scholar]
- 7.Zhou CZ, Confalonieri F, Jacquet M, Perasso R, Li ZG, Janin J. Proteins-Structure Function and Genetics. 2001;44:119–122. doi: 10.1002/prot.1078. [DOI] [PubMed] [Google Scholar]
- 8.Kim U, Park J, Li C, Jin H, Valluzzi R, Kaplan D. Biomacromolecules. 2004;5:786–792. doi: 10.1021/bm0345460. [DOI] [PubMed] [Google Scholar]
- 9.Fini M, Motta A, Torricelli P, Glavaresi G, Aldini NN, Tschon M, Giardino R, Migliaresi C. Biomaterials. 2005;26:3527–3536. doi: 10.1016/j.biomaterials.2004.09.040. [DOI] [PubMed] [Google Scholar]
- 10.Li MZ, Ogiso M, Minoura N. Biomaterials. 2003;24:357–365. doi: 10.1016/s0142-9612(02)00326-5. [DOI] [PubMed] [Google Scholar]
- 11.Minoura N, Aiba SI, Higuchi M, Gotoh Y, Tsukada M, Imai Y. Biochemical and Biophysical Research Communications. 1995;208:511–516. doi: 10.1006/bbrc.1995.1368. [DOI] [PubMed] [Google Scholar]
- 12.Kim UJ, Park J, Kim HJ, Wada M, Kaplan DL. Biomaterials. 2005;26:2775–2785. doi: 10.1016/j.biomaterials.2004.07.044. [DOI] [PubMed] [Google Scholar]
- 13.Nazarov R, Jin HJ, Kaplan DL. Biomacromolecules. 2004;5:718–726. doi: 10.1021/bm034327e. [DOI] [PubMed] [Google Scholar]
- 14.Wenk E, Wandrey A, Merkle H, Meinel L. Journal of Controlled Release. 2008;132:26–34. doi: 10.1016/j.jconrel.2008.08.005. [DOI] [PubMed] [Google Scholar]
- 15.Uebersax L, Hagenmueller H, Hofmann S, Gruenblatt E, Mueller R, Vunjak-Novakovic G, Kaplan DL, Merkle HP, Meinel L. Tissue Engineering. 2006;12:3417–3429. doi: 10.1089/ten.2006.12.3417. [DOI] [PubMed] [Google Scholar]
- 16.Gellynck K, Verdonk PC, Van Nimmen E, Almqvist KF, Gheysens T, Schoukens G, Van Langenhove L, Kiekens P, Mertens J, Verbruggen G. Journal of Materials Science: Materials in Medicine. 2008;19:3399–409. doi: 10.1007/s10856-008-3474-6. [DOI] [PubMed] [Google Scholar]
- 17.Xu M, Lewis RV. Proceedings of the National Academy of Sciences of the United States of America. 1990;87:7120–7124. doi: 10.1073/pnas.87.18.7120. [DOI] [PMC free article] [PubMed] [Google Scholar]
- 18.Kluge JA, Rabotyagova U, Leisk GG, Kaplan DL. Trends Biotechnol. 2008;26:244–251. doi: 10.1016/j.tibtech.2008.02.006. [DOI] [PubMed] [Google Scholar]
- 19.Lopez-Estebana S, Saiza E, Fujinob S, Okuc T, Suganumac K, Tomsia A. Journal of the European Ceramic Society. 2003;23:2921–1930. [Google Scholar]
- 20.Mieszawska A, Fourligas N, Georgakoudi I, Ouhib N, Belton D, Perry C, Kaplan D. Journal of Biomaterials. 2010;34:8902–8920. doi: 10.1016/j.biomaterials.2010.07.109. [DOI] [PMC free article] [PubMed] [Google Scholar]
- 21.Gimeno-Fabra M, Peroglio M, Eglin D, Alini M, Perry CC. Journal of Materials Chemistry. 2011;21:4086–4089. [Google Scholar]
- 22.Sumper M, Kroger N. Journal of Materials Chemistry. 2004;14:2059–2065. [Google Scholar]
- 23.Dickerson MB, Sandhage KH, Naik RR. Chemical Reviews. 2008;108:4935–4978. doi: 10.1021/cr8002328. [DOI] [PubMed] [Google Scholar]
- 24.Walker JM, Rapley R. Molecular biology and biotechnology. Cambridge: Royal Society of Chemistry; 2000. [Google Scholar]
- 25.Belton DJ, Mieszawska AJ, Currie HA, Kaplan DL, Perry CC. Langmuir. 2012;28:4373–4381. doi: 10.1021/la205084z. [DOI] [PMC free article] [PubMed] [Google Scholar]
- 26.Zhou S, Huang W, Belton DJ, Simmons LO, Perry CC, Wang X, Kaplan DL. Biomaterials. 2015;15:173–180. doi: 10.1016/j.actbio.2014.10.040. [DOI] [PMC free article] [PubMed] [Google Scholar]
- 27.Knecht MR, Wright DW. Chemical Communications. 2003;24:3038–3039. doi: 10.1039/b309074d. [DOI] [PubMed] [Google Scholar]
- 28.Rabotyagova OS, Cebe P, Kaplan DL. Biomacromolecules. 2009;10:229–236. doi: 10.1021/bm800930x. [DOI] [PubMed] [Google Scholar]
- 29.Wong Po Foo C, Patwardhan SV, Belton DJ, Kitchel B, Anastasiades D, Huang J, Naik RR, Perry CC, Kaplan DL. National Academy of Science. 2006;103:9428–9433. doi: 10.1073/pnas.0601096103. [DOI] [PMC free article] [PubMed] [Google Scholar]
- 30.Adochitei A, Drochioiu G. Revue Roumaine De Chimie. 2011;56:783–791. [Google Scholar]
- 31.Teramoto H, Miyazawa M. Biomacromolecules. 2005;6:2049–2057. doi: 10.1021/bm0500547. [DOI] [PubMed] [Google Scholar]
- 32.Altman GH, Horan RL, Lu HH, Moreau J, Martin I, Richmond JC, Kaplan DL. Biomaterials. 2002;23:4131–4141. doi: 10.1016/s0142-9612(02)00156-4. [DOI] [PubMed] [Google Scholar]
- 33.Mauney JR, Blumberg J, Pirun M, Volloch V, Vunjak-Novakovic G, Kaplan DL. Tissue Engineering. 2004;10:81–92. doi: 10.1089/107632704322791727. [DOI] [PubMed] [Google Scholar]
- 34.Arrondo JLR, Goni FM. Progress in Biophysics & Molecular Biology. 1999;72:367–405. doi: 10.1016/s0079-6107(99)00007-3. [DOI] [PubMed] [Google Scholar]
- 35.Arrondo JLR, Muga A, Castresana J, Goni FM. Progress in Biophysics & Molecular Biology. 1993;59:23–56. doi: 10.1016/0079-6107(93)90006-6. [DOI] [PubMed] [Google Scholar]
- 36.Gentle I, Barnes G. Interfacial science: an introduction. Oxford: Oxford University Press; 2005. [Google Scholar]
- 37.Law K, Zhao H. Surface wetting: characterization, contact angle, and fundamentals. New York: Springer; 2015. [Google Scholar]
Associated Data
This section collects any data citations, data availability statements, or supplementary materials included in this article.


