Abstract
An extension to multivariate empirical mode decomposition (MEMD), termed adaptive-projection intrinsically transformed MEMD (APIT-MEMD), is proposed to cater for power imbalances and inter-channel correlations in real-world multichannel data. It is shown that the APIT-MEMD exhibits similar or better performance than MEMD for a large number of projection vectors, whereas it outperforms MEMD for the critical case of a small number of projection vectors within the sifting algorithm. We also employ the noise-assisted APIT-MEMD within our proposed intrinsic multiscale analysis framework and illustrate the advantages of such an approach in notoriously noise-dominated cooperative brain–computer interface (BCI) based on the steady-state visual evoked potentials and the P300 responses. Finally, we show that for a joint cognitive BCI task, the proposed intrinsic multiscale analysis framework improves system performance in terms of the information transfer rate.
Keywords: multivariate empirical mode decomposition, brain–computer interface, adaptive projection, intrinsic multiscale analysis
1. Introduction
Brain–computer interface (BCI) is a technology which provides a direct communication channel between the human brain and computers via electrical potentials, typically measured non-invasively via electroencephalogram (EEG). BCIs are primarily targeted towards people who have lost their cognitive or motor functions. For example, patients with amyotrophic lateral sclerosis, suffering from severe neuromuscular disabilities as a result of progressive neurodegeneration, can use BCIs to communicate via virtual word spellers [1] or even operate vehicles [2]. Nonetheless, this technology is not limited only to those with disabilities, its applications for healthy individuals range from gaming [3] to navigation [4] and robotics [5]. Cooperative BCI systems have recently been proposed to allow multi-user participation in a joint cognitive BCI paradigm, resulting in performance improvements in terms of the information transfer rates (ITRs) and accuracy [6,7]. The feasibility of using cooperative BCIs based on EEG signals has been explored in the areas of robotic control [7], decision-making [8] and gaming [9]. As mentioned earlier, EEG signals are the modality of choice in the vast majority of BCI systems, but they exhibit nonlinear and non-stationary characteristics, and require signal processing schemes which can provide physically meaningful signal representation; one of such techniques is the empirical mode decomposition (EMD) [10].
EMD is an adaptive, data-driven algorithm for the analysis of nonlinear and non-stationary time series. The algorithm employs a sifting process to decompose the signal into its multiple narrow-band amplitude/frequency-modulated components in a deflation-type fashion. These components are referred to as intrinsic mode functions (IMFs) and are used as a basis for the representation of the signal. Unlike conventional projection-based time–frequency algorithms, such as the short-time Fourier transform and the discrete wavelet transform, the basis functions within EMD enable physically meaningful interpretation of instantaneous frequency and phase. Moreover, they also allow for a highly localized time–frequency representation of the signal via the Hilbert transform [11]. The effectiveness of EMD was demonstrated in a number of application areas, including bio-signal analysis [12], seismology [13] and paleoclimatology [14].
Due to its empirical nature, EMD exhibits two types of artefacts: (i) mode-mixing and (ii) mode splitting. Mode-mixing refers to the existence of different oscillatory components in a single IMF, whereas mode splitting is the presence of the same oscillatory component in two or more IMFs. To alleviate mode-mixing, a noise-assisted extension of EMD, called ensemble EMD (EEMD)[15], has been proposed, which adds white Gaussian noise (WGN) directly to the input signal, thus enforcing a dyadic filterbank structure. Large number of noise realizations with subsequent application of EEMD are required to negate the effects of added noise and obtain ensemble means which are treated as true IMFs.
To cater for complex-valued data, multivariate extensions to EMD have been developed, including the complex EMD [16] and rotation invariant complex EMD [17]. Bivariate EMD (BEMD) [18], trivariate EMD (TEMD) [19] and multivariate EMD (MEMD) [20,21] are also multivariate extensions, but estimate the local mean via the projections of the input signal along uniformly sampled direction vectors on a circle (BEMD), three-dimensional sphere (TEMD) and multidimensional sphere (MEMD), respectively. The mode-mixing phenomenon within MEMD refers to the phenomenon where different oscillatory components, present in multiple channels, appear in a single IMF. To mitigate this problem, noise-assisted MEMD (NA-MEMD) [22] was developed, which adds WGN to channels adjacent to the input signal, thus enforcing the dyadic filterbank structure and reducing mode-mixing in the multivariate case. Furthermore, decimated MEMD filterbank [23] was introduced, to create an MEMD-based filterbank, without the presence of added WGN as in the EEMD or NA-MEMD, with an arbitrary tree structure and choice of frequency bands.
The MEMD can be used in conjunction with standard data-association measures such as phase synchrony, sample entropy and correlation, to quantify intra- and inter-component dependences of a complex system, within a framework referred to as intrinsic multiscale analysis [24]. Applications of MEMD include neural signal processing [25], BCIs [26], image processing [27] and artefact removal [28].
Real-world signals, such as electrical potentials measured via EEG, often contain power imbalances or inter-channel correlations. Uniformly sampled direction vectors used in BEMD, TEMD and MEMD may not be optimal for capturing the dynamics of multivariate data, unless a very high (greater than 127) number of projection vectors is used, which can dramatically increase computational complexity. For a low (8–31) to moderate (32–63) number of projections and unbalanced (power mismatched) and/or correlated data channels, these algorithms provide suboptimal estimates of the local mean. To mitigate this problem, non-uniformly sampled BEMD [29] was proposed, which generates a set of projection vectors representing the direction of highest curvature. Another algorithm—dynamically sampled BEMD [30]—employs Menger curvature to quantify local signal dynamics of bivariate signals to generate projection vectors which align with the highest local dynamics. For trivariate signals, non-uniformly sampled TEMD (NS-TEMD) [31] globally identifies a set of non-uniformly sampled projections by performing eigendecomposition of the covariance of a signal, subsequently constructing an ellipsoid of non-uniform direction vectors which matches signal dynamics.
Despite recent progress in computationally efficient MEMD for unbalanced data which are improper and correlated [32], a solution for the general multivariate case is still lacking. In addition, as cooperative BCIs typically use a number of data channels to acquire ‘correlated’ information from multiple users, an analysis approach which would adapt to the data and would be capable of revealing ‘intrinsic and correlated’ inter-channel information with physically meaningful interpretation would be of great importance. To this end, this work extends NS-TEMD to introduce adaptive-projection intrinsically transformed MEMD (APIT-MEMD), which caters for power imbalances and correlations in multichannel data. Similarly to the standard MEMD, the proposed APIT-MEMD accommodates nonlinear and non-stationary signals. It is also capable of alleviating mode-mixing and yields fewer IMFs for unbalanced data. This work also introduces applications of intrinsic multiscale analysis [24] using NA-APIT-MEMD to cooperative BCI applications based on steady-state visual evoked potentials (SSVEP) and P300 responses.
2. Adaptive-projection intrinsically transformed MEMD
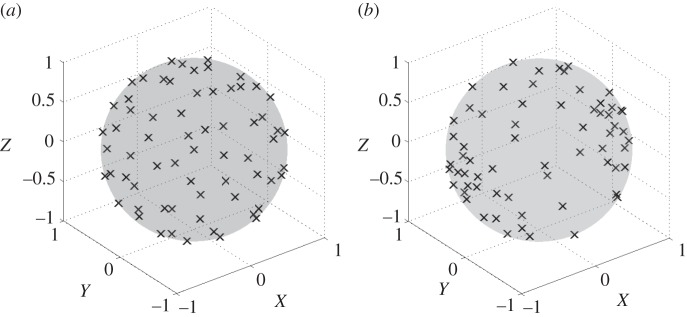
The NS-TEMD algorithm [31] enhances the performance of the conventional TEMD by relocating the direction vectors, pre-generated using the conventional uniform sampling scheme (figure 1a), to their new positions on an ellipsoid (figure 1b), with the directions and relative powers determined by all the eigenvectors and eigenvalues of the trivariate covariance matrix of the signal. In the case of multivariate signals, relocating the pre-generated n-dimensional uniform projection vectors to their new positions on an n-dimensional ellipsoid using the above scheme is an exceptionally complicated task, not least because the direction of global highest curvature of the original input signal may not always align with the direction of local first principal component of each sifting input, resulting in a suboptimal estimate of the local mean.
Figure 1.
Uniform and non-uniform projection vectors. (a) Projection vectors for MEMD based on a low-discrepancy Hammersley sequence. (b) Projection vectors for NS-TEMD when accounting for inter-channel dependencies.
To address this problem, we propose a projection scheme, whereby the direction of the first principal component reflecting the largest power imbalance and/or correlation in the channels of the multivariate signal is determined adaptively. For a given multivariate input signal, s(t), with covariance matrix C=E{sT(t)s(t)} (where E{⋅} is the statistical expectation operator and (⋅)T is the transpose operator), the direction of the first principal component is determined via the eigendecomposition of the covariance matrix, C=VΛVT, where the matrix V corresponds to the matrix of eigenvectors and the entries of the diagonal matrix Λ are the corresponding eigenvalues. Subsequently, the first principal component, pointing in the direction of the highest power imbalance, is used to construct a vector pointing in the diametrically opposite direction. These two vectors are subsequently used to relocate the direction vectors pre-generated by the conventional uniform projection scheme. Each sifting operation then projects its multivariate sifting input along these adaptive direction vectors, so as to estimate the local mean; see algorithm 1 for details of the proposed adaptive-projection intrinsically transformed MEMD.
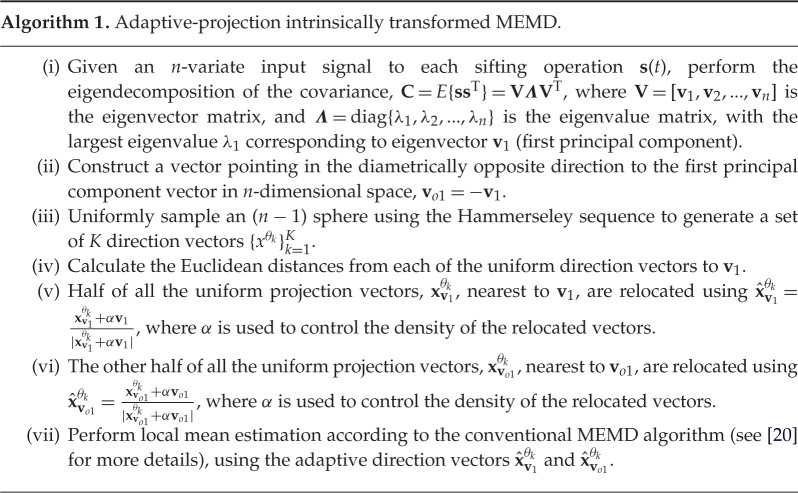
The α values can be determined through the degree of power imbalances between data channels, and a suggested range is from 0 to 1. For α=0, when power imbalances do not exist or are not accounted for, the APIT-MEMD operates similarly to the standard MEMD—no adaptive projection is performed. Conversely, for α=1, the case with high power imbalances between data channels, the APIT-MEMD is perfectly well equipped to deal with the importance-sampling of the signal space.
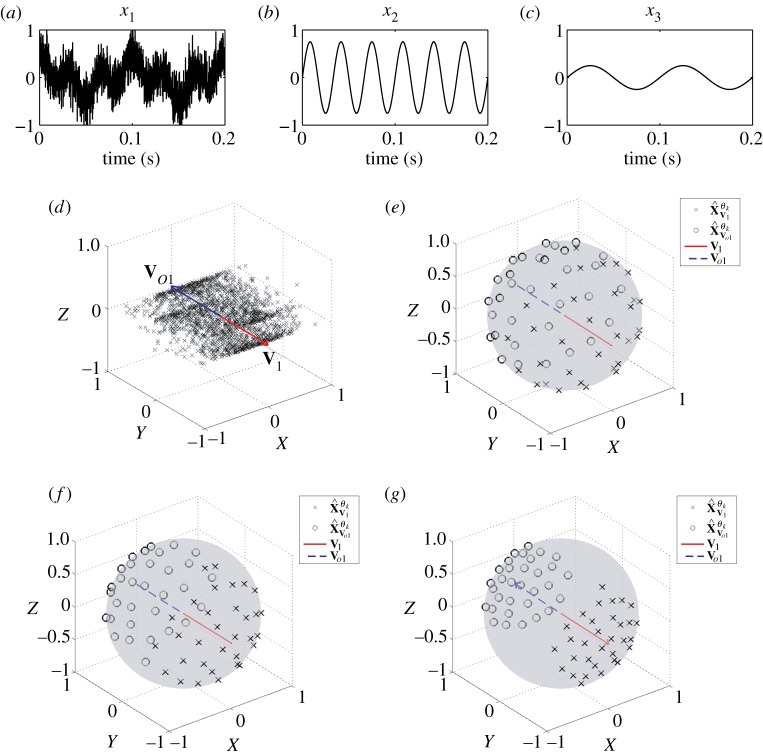
To illustrate the principle of APIT-MEMD, figure 2a–c shows the first, second and third channels, respectively, of a trivariate signal, given by
 |
2.1 |
where n(t) denotes the added WGN and k1 and k2 are scalars which define the degrees of power imbalances between the data channels. In this example, the signal-to-noise ratio (SNR) of the first channel was 0 dB, k1=0.25, k2=0.75, f1=10 Hz and f2=30 Hz, with a sampling frequency of 10 kHz. Figure 2d shows the scatter plot of the input signal in a three-dimensional space, together with the first principal component, v1, and the diametrically opposite vector, vo1. Figure 2e–g shows the projection vectors adapted to the direction of highest power imbalance,  and
and  , of the input. The densities of the projection vectors were controlled by different α values (0, 0.5 and 1). Observe that the relocated direction vectors,
  and
and  , were clustered around the corresponding ‘centroids’, v1 and vo1, and that the density of the direction vectors increased with the α values. For the trivariate signal considered, we used α=1 in order for the APIT-MEMD to capture the directions of highest power imbalances. The input data to the first sifting operation were then projected along all the resulting adaptive projection vectors generated, to estimate the local mean within the sifting algorithm.
Figure 2.
Input signal to the first sifting operation. (a–c) The three data channels considered. (d) Scatter plot of the trivariate data, first principal component and its diametrically opposite vector. (e–g) Projection vectors adapted according to the proposed scheme using different α values (0, 0.5 and 1, respectively). (Online version in colour.)
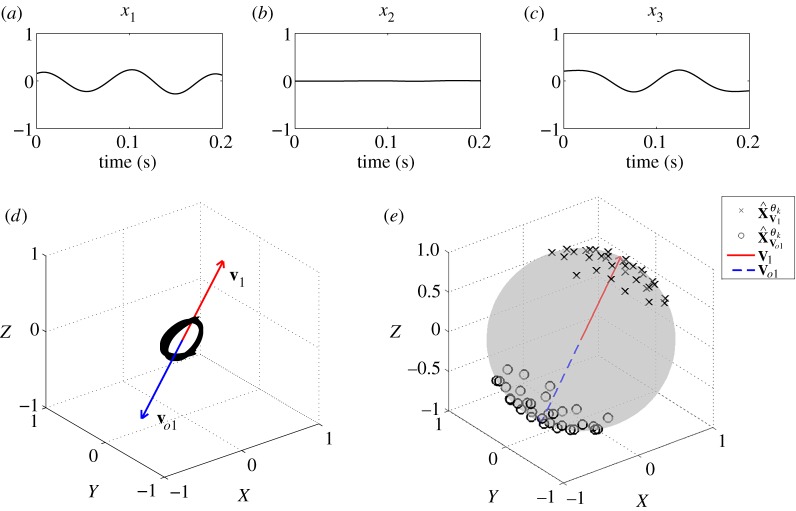
After a number of sifting operations, several IMFs containing decomposed WGN and the higher frequency component in x1 and x2, that is f2, were obtained, resulting in the remaining lower frequency component in x1 and x3, that is f1, as shown in figure 3a–c; the remaining three-channel data were then fed into the next sifting operation. Figure 3d shows the scatter plot of the remaining signal, together with v1 and vo1, and figure 3e shows projection vectors adapted to the dynamics of the remaining signal.
Figure 3.
Input signal to a sifting operation. (a–c) Three-channel data. (d) Scatter plot of the three-channel data, the first principal component and its opposite. (e) Projection vectors adapted to first principal component and the opposite vector. (Online version in colour.)
Performance of the proposed APIT-MEMD algorithm was evaluated using simulations on multivariate signals with different channel powers and real-world P300 responses measured via EEG.
(a). Reconstructing multivariate data with power imbalances
The performance of the APIT-MEMD in reconstructing sinusoidal oscillations in a six-channel signal was first examined against MEMD. The six channels consisted of sinusoidal oscillations corrupted by additive WGN, given by
 |
2.2 |
where f1=10 Hz, f2=30 Hz, and the sampling frequency fs=10 kHz. The SNRs of the first, second and third channels corrupted by independent additive WGN processes n1, n2 and n3 were 0 dB, while the SNRs of the fourth, fifth and sixth channels governed by n4, n5 and n6 varied between 0 dB and 20 dB. The performance was measured using the mean square error (MSE) in the task of reconstructing the f1 and f2 sinusoids in channel 4. The number of direction vectors for MEMD and APIT-MEMD was varied from 32 to 256 (moderate to very high), following the suggestion in [20] that the number of direction vectors should be considerably greater than the dimensionality of the signals in order to extract meaningful IMFs. In our own experience, trivariate signals require more than 16 projection vectors for the NS-TEMD to capture the direction of highest power imbalances [31]. The α value for the APIT-MEMD was 1 due to the power imbalances. To evaluate the performance of the APIT-MEMD and MEMD algorithms in alleviating the mode-mixing problem, we introduce a novel performance measure, termed the mode-mixing ratio (MMR), given by
 |
2.3 |
where  (M is the total number of IMFs) is the sum of all the correlation values between IMF index i, where i≠j, which should not contain the desired oscillations ( f1 or f2), and the clean original oscillation ( f1 or f2), while ρj denotes the correlation value between the IMF index j containing the desired oscillation ( f1 or f2) and the corresponding clean original oscillation ( f1 or f2). If mode-mixing is not present, there is correlation only between the information-bearing IMF and the corresponding clean original oscillation, resulting in MMR=0. However, if mode-mixing is present, besides the non-zero correlation between the information-bearing IMF and the clean original oscillation, there are also non-zero correlations between other IMFs and the clean original signal, resulting in MMR>0.
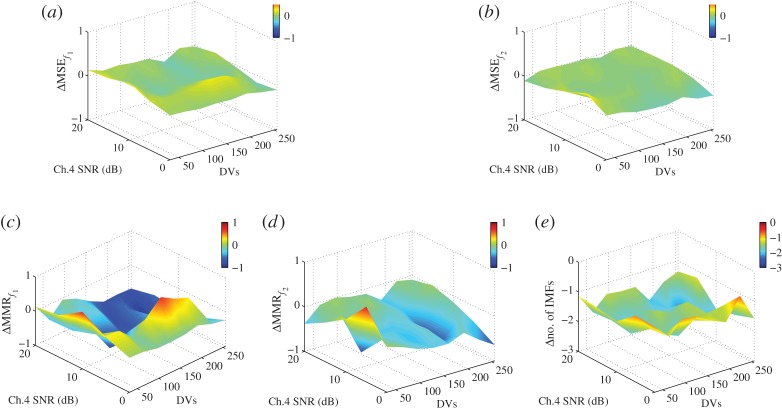
Figure 4a–e shows the differences in MSE, MMR and the number of IMFs required for reconstruction between APIT-MEMD and MEMD algorithms. All the results were obtained by averaging over 30 realizations. Observe that the proposed APIT-MEMD algorithm outperformed MEMD in recovering the f1 and f2 sinusoids—having both lower MSE and MMR—in the channels which exhibited significant power imbalance (channel 4 SNR=0 dB) and where the number of direction vectors was at least 32 (moderate). Moreover, the proposed algorithm consistently produced fewer IMFs. Note that the quasi-dyadic filterbank structure of the IMFs obtained using APIT-MEMD was preserved. This can be observed through the IMF spectra, and similar results were obtained by performing signal decomposition with the assistance of noise (see electronic supplementary material, §§1 and 2, for details).
Figure 4.
Performance comparison between APIT-MEMD and MEMD in reconstructing a six-channel signal exhibiting power imbalance. All performance measures follow the format: ‘APIT-MEMD – MEMD’. (a) Difference in MSE in reconstructing the f1 sinusoid. (b) Difference in MSE in reconstructing the f2 sinusoid. (c) Difference in MMR in reconstructing the f1 sinusoid. (d) Difference in MMR in reconstructing the f2 sinusoid. (e) Difference in the number of IMFs. (Online version in colour.)
(b). P300 reconstruction
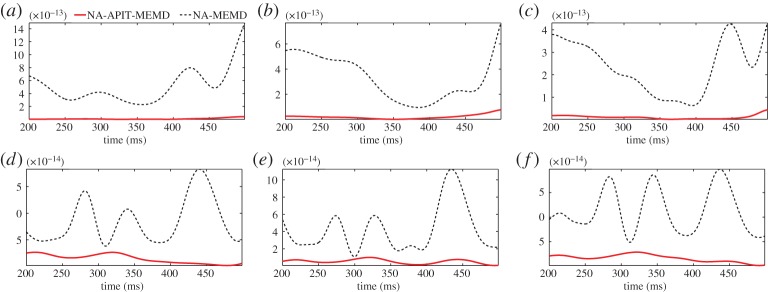
Power imbalances and inter-channel correlation are typically found in multichannel EEG due to different electrode impedances and adjacent locations—a perfect scenario for APIT-MEMD to reconstruct multichannel real-world EEG data. The P300 response is a positive deflection in the EEG signal, elicited approximately 250–500 ms after the brain is exposed to an unexpected visual and/or auditory stimulus [33], the so-called oddball paradigm. Two male subjects participated in the experiment and were exposed to randomly coloured boxes (non-target) and a box with white background and red foreground (target) presented on a liquid crystal display screen, where the time intervals between each of the target stimuli were randomized. EEG signals were recorded from the Fz, Cz and Pz electrodes of Subject 1 and from the Fz, POz and Oz electrodes of Subject 2. The recorded signals were then band-pass filtered to the 1–40 Hz range, averaged over 10 trials and combined to construct a multichannel signal. Channels 1–3 contained the responses of Subject 1, channels 4–6 contained the responses of Subject 2, while channel 7 contained WGN to facilitate the noise-assisted mode of operation of both the APIT-MEMD and MEMD. The α value for the NA-APIT-MEMD was set to 1. The P300 ground truths for each of the six electrodes were then constructed by averaging 1000 P300-IMFs (IMFs containing the maximum power were treated as IMFs containing P300) obtained by applying 1000 realizations of the NA-APIT-MEMD and NA-MEMD to the multichannel data (see electronic supplementary material, §3, for details). We examined the performance of both algorithms for P300 reconstruction as described in [31]. By performing another 100 realizations, the performance of both algorithms was evaluated in terms of MSE in reconstructing the P300 response with respect to the P300 ground truth of each electrode. Observe from figure 5a–f and table 1 that the proposed NA-APIT-MEMD algorithm yielded significantly lower MSE compared with the NA-MEMD for every electrode position of both subjects.
Figure 5.
MSE of P300 responses of two subjects at different electrode positions. (a) Subject 1, Fz electrode. (b) Subject 1, Cz electrode. (c) Subject 1, Pz electrode. (d) Subject 2, Fz electrode. (e) Subject 2, POz electrode. ( f) Subject 2, Oz electrode. (Online version in colour.)
Table 1.
Average MSEs of the NA-APIT-MEMD and NA-MEMD algorithms for the two subjects at different electrodes.
| subject 1 |
subject 2 |
|||||
|---|---|---|---|---|---|---|
| Fz | Cz | Pz | Fz | POz | Oz | |
| NA-APIT-MEMD | 9.39×10⁻¹⁵ | 1.96×10⁻¹⁴ | 1.12×10⁻¹⁴ | 1.43×10⁻¹⁴ | 5.32×10⁻¹⁵ | 1.61×10⁻¹⁴ |
| NA-MEMD | 5.03×10⁻¹³ | 3.28×10⁻¹³ | 2.34×10⁻¹³ | 8.51×10⁻¹⁴ | 4.20×10⁻¹⁴ | 1.13×10⁻¹³ |
3. Applications of intrinsic multiscale analysis to cooperative brain–computer interface
The ITR is an essential measure which indicates the performance of a BCI system. In cooperative BCI systems, EEG data acquired from multiple users simultaneously engaging in the same paradigm can provide joint and collective information, which can effectively reduce the time required for data collection, thus increasing the ITR.
Phase synchrony is a measure of phase relationship between two signals and can be defined in terms of the deviation from perfect synchrony via the phase synchronization index (PSI) [24]. The PSI can also be used to estimate phase synchrony between IMFs, yielding highly localized phase information, the so-called intrinsic phase synchrony [24]. Additionally, to account for both magnitude and phase information another inter-IMF measure can be used, the so-called intrinsic correlation.
We next examined the utility of intrinsic multiscale analysis in providing a higher ITR in cooperative BCI. EEG signals typically contain power imbalances between the data channels, and we therefore used the NA-APIT-MEMD in the context of the intrinsic multiscale analysis framework.
(a). Applications of intrinsic phase synchrony to cooperative SSVEP-based brain–computer interface
The SSVEP is a natural response of the brain to the visual stimuli operating in the frequency range of 5–60 Hz [34]. The SSVEP responses are typically discriminated based on their frequencies, resulting in limited ITR. Integrating phase information in SSVEP-based BCI systems promises a higher number of possible targets and thus a higher ITR [35].
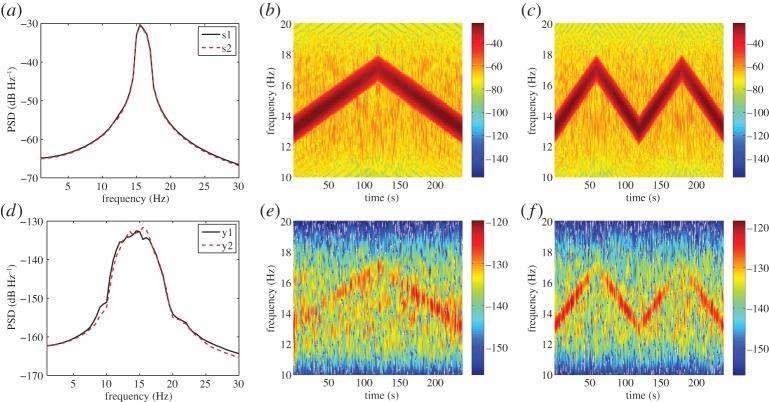
In this section, intrinsic phase synchrony was applied to differentiate between SSVEP responses of two subjects simultaneously participating in an experiment. The 4 min SSVEP responses were recorded from two subjects seated next to each other and attending two different SSVEP stimuli with similar power spectral densities (PSDs), occupying the range 13–17 Hz (figure 6a), but with different phases and generated with two separate LEDs. Subject 1 (y1) attended a chirp signal (s1) with frequencies increasing from 13 to 17 Hz over 2 min and decreasing from 17 to 13 Hz over the following 2 min (figure 6b), while Subject 2 (y2) attended a chirp signal (s2) with frequencies varying from 13 to 17 Hz at twice the speed of s1 (figure 6c). The recorded signals were then band-pass filtered to the range 10–20 Hz. The PSD and spectrograms of SSVEP responses of the two subjects (y1 and y2), exposed to the corresponding stimuli, are shown in figure 6d–f. Observe from figure 6d that the PSD of SSVEP response of subject 1 (y1) was similar to that of subject 2 (y2).
Figure 6.
PSD and time–frequency spectrogram of SSVEP stimuli and brain responses. (a) PSD of SSVEP stimuli presented to subjects 1 and 2 (s1 and s2). (b) Time–frequency spectrogram of s1. (c) Time–frequency spectrogram of s2. (d) PSD of SSVEP responses of subjects 1 and 2 (y1 and y2). (e) Time–frequency spectrogram of y1. ( f) Time–frequency spectrogram of y2. (Online version in colour.)
Following the standard approach to phase synchrony estimation, PSI between each of the two stimuli (s1 and s2), and each of the responses (y1 and y2) was estimated and is shown in figure 7a. Next, within our intrinsic multiscale analysis framework, the stimuli and responses (s1, s2, y1 and y2) were used to form four-channel data which were decomposed using NA-APIT-MEMD with 10 adjacent WGN channels, and the parameter α was 0.3 due to low power imbalances. The IMF with maximum power was treated as the information-bearing IMF (IMF containing the required 13 Hz or 15 Hz oscillation). The PSIs between each of the information-bearing IMFs of the stimuli and responses were then calculated from 30 realizations of NA-APIT-MEMD as shown in figure 7b.
Figure 7.
Estimated PSI between SSVEP stimuli and brain responses. (a) PSI estimated using the standard approach. (b) PSI estimated using the intrinsic multiscale analysis.
Figure 7a demonstrates a subtle difference in the PSI values between y1-s1 (0.4091) and y2-s1 (0.4054), implying that the standard approach could not effectively discriminate between the phases of the SSVEP responses and stimuli, while the results obtained using the proposed intrinsic multiscale approach in figure 7b indicate successful separation of the responses of the subjects, determined by the Z-test at the significance level of 0.05. This approach is also applicable to differentiating SSVEP responses at different frequencies (see electronic supplementary materials, §4, for details).
(b). Applications of intrinsic correlation to cooperative P300-based brain–computer interface
The P300 brain response reflects the outcome of stimulus evaluation and internal decision-making processes [36]; however, its presence after a person is exposed to unexpected stimulus (target) is not always guaranteed. The P300 used in BCI applications, such as word spellers, is therefore typically obtained by averaging EEG segments over a number of trials. For real-time applications, automatic detection of a single-shot P300 is imperative and can lead to practical cooperative real-world BCI applications. EMD was applied in [37] to detect P300 in a single trial; however, the average sensitivity (57.36%) and specificity (52.63%) were not high. We therefore propose to use intrinsic correlation to detect single-shot P300 from a pair of individuals to reduce the time and number of trials normally required to establish an average P300, thus providing higher ITR. This approach is based on an assumption that P300 responses of two people simultaneously engaging in the same oddball paradigm are intrinsically cross-correlated.
In order to evaluate the performance of the proposed detection algorithm, it is essential to have prior knowledge of whether P300 of a subject was present after each target in the recorded data. To this end, we propose the following three criteria to determine the presence of P300: (i) at least one positive peak must be present, (ii) a negative trend must not exist, and (iii) if two or more positive peaks do exist, the difference in the magnitude between the largest and second-largest peaks (d1) must be higher than half of the difference in the magnitude between the largest peak and the ‘valley’ located between the largest and second-largest peaks (d2), d1/d2>0.5.
Figure 8a shows an EEG signal with P300 where: (1) at least one positive peak is present, (2) no negative trend exists, and (3) the difference between the first and second largest peaks (d1=1st peak – 2nd peak) was larger than half the difference between the first peak and the valley (d2=1st peak – valley), d1/d2=0.641>0.5. Figure 8b shows an EEG signal without P300 where: (1) a negative trend exists and (2) the difference between the first and second largest peaks (d1) was lower than half the difference between the first peak and the valley (d2), d1/d2=0.345<0.5.
Figure 8.
Examples of EEG signals with and without the P300 present. (a) EEG signal with a P300 (two positive peaks, no negative trends). (b) EEG signal without a P300 (negative trend, d1/d2<0.5). (Online version in colour.)
The same experimental setting as in §2b (P300 reconstruction) was considered, except that EEG signals of Subject 1 were recorded from the Fz, POz and Oz electrodes. The recorded signals of both subjects were band-pass filtered to the range 1–20 Hz. The P300 ground truth of each subject was then constructed by averaging the signals recorded from the three electrodes over 10 trials. The ground truth was next used to determine the time span of P300 of each subject. The time span of P300 of Subject 1 was between 200 and 400 ms, whereas that of Subject 2 was between 300 and 500 ms. To detect the presence of P300 for both subjects and each trial, the three-channel data of Subject 1 between 200 and 400 ms after a target, and the other three-channel data of Subject 2 between 300 and 500 ms after the same target were used to construct six-channel data, which were decomposed using NA-APIT-MEMD with 10 added WGN channels, where α=0.4; 30 realizations of NA-APIT-MEMD were carried out. Cross-correlation values between the spatially averaged primary IMFs of the signal channels were statistically compared against those between the primary IMFs of the noise channels (see algorithm 2 for details of the proposed two-person single-shot P300 detection algorithm).
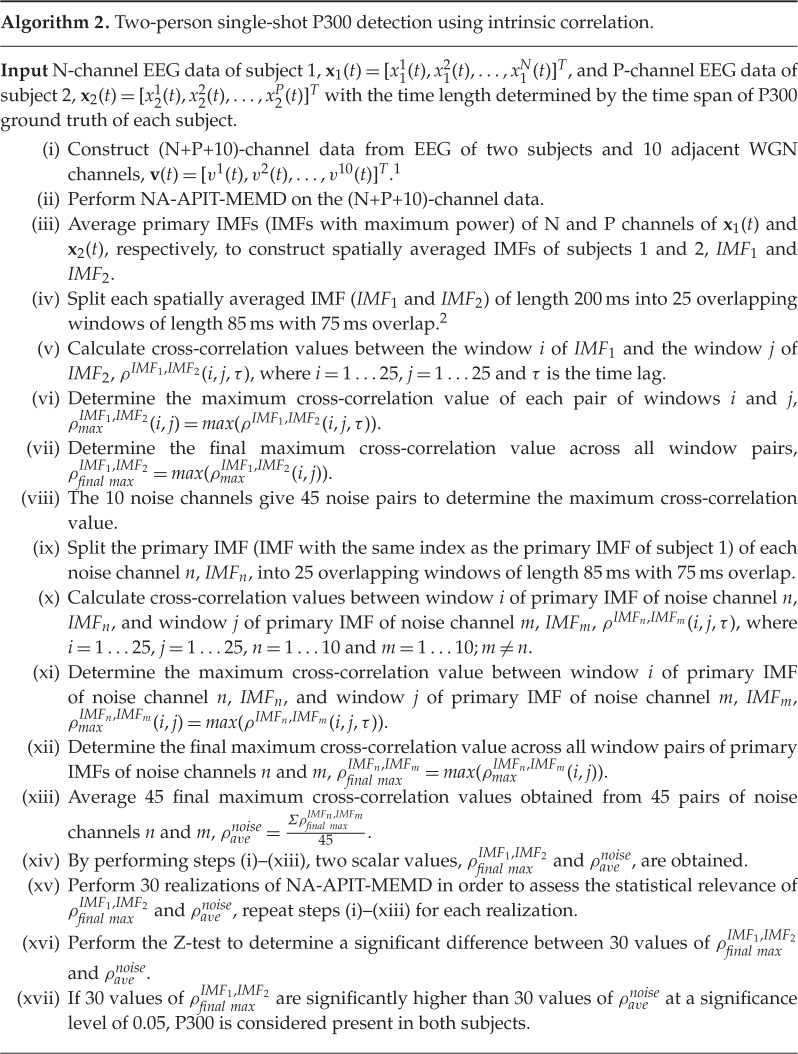
The performance of the proposed two-person single-shot P300 detection algorithm was evaluated as described in [37]. By performing 30 realizations of this algorithm on six EEG signals recorded from two subjects after 10 targets, the number of true positive (TP, P300 was present in both subjects and detected), true negative (TN, P300 was not present in both subjects and not detected), false positive (FP, P300 was not present in both subjects but incorrectly detected), false negative (FN, P300 was present in both subjects but not detected), sensitivity (TP/(TP+FN)) and specificity (TN/(TN+FP)) were calculated, and are shown in table 2.
Table 2.
Performance of the proposed two-person single-shot P300 detection algorithm.
| present | not present | |
|---|---|---|
| detected | TP=109 | FP=61 |
| not detected | FN=41 | TN=89 |
| sensitivity=72.67% | specificity=59.33% |
4. Conclusion
We have introduced an extension of the MEMD algorithm termed APIT-MEMD, in order to cater for power imbalances between data channels. This is achieved through the assessment of the statistical structure of multivariate data, and subsequent resampling of the direction vectors to ensure that their density matches data dynamics. The performance of the algorithm has been evaluated in terms of MSE, MMR and the number of generated IMFs in decomposing1 2 unbalanced synthetic multivariate data both with and without the presence of adjacent WGN channels. The proposed algorithm has been shown to outperform conventional MEMD and NA-MEMD in a noise-assisted mode of operation, for cases with significant power imbalance between data channels. Simulations on EEG data have also shown that NA-APIT-MEMD yielded substantially lower MSE in decomposing the P300, compared to NA-MEMD. Further developments will include clustering direction vectors into a number of different groups, depending on the number of principal components in the data correlation matrix.
Intrinsic multiscale analysis [24] using NA-APIT-MEMD has been applied to cooperative SSVEP- and P300-based BCI applications. We have shown that intrinsic phase synchrony can effectively differentiate between SSVEP responses with different parameters (frequencies or phases) of two subjects. We have also proposed a two-person single-shot P300 detection algorithm. This approach employed intrinsic correlation to determine whether the maximum cross-correlation between EEG signals of two people was higher than that of noise, which can unveil the presence of P300 generated by two cooperating brains. Note that choices of parameters in this algorithm have been set empirically in order to optimally match the nature of P300 in a single trial, and that changes in parameter values might affect the results.
We have observed that when employing either the APIT-MEMD or MEMD algorithm in a noise-assisted mode of operation on SSVEP and P300 signals, the number of WGN channel(s) must be chosen cautiously, as Looney et al. [24] have shown that the higher the number of noise channels, the faster the roll-off of a filterbank structure. For narrowband signals such as SSVEP, a filterbank structure with a fast roll-off is required so that such signals are contained in a single IMF with as little mode-mixing as possible. However, for signals with a wider bandwith such as P300, which are composed of several oscillatory components, a filterbank structure with slower roll-off may be required to contain those oscillations within the same IMF index. Finally, the APIT-MEMD is sensitive to parameter α which reflects the degree of imbalances across the data channels. Future work will focus on an automated selection of this parameter based, for example, on real-time tracking of the degree of impropriety.
Supplementary Material
Footnotes
The number of adjacent WGN channels was 10, as this is sufficient to enforce the desired quasi-dyadic structure and thus reduce the degree of overlap between the IMF spectra.
Note that the P300 response is typically obtained by averaging EEG signals over a number of trials, resulting in an average time span of P300 of approximately 150-200 ms. However, we have empirically found that the P300 in a single trial has a relatively short time span of approximately 85 ms, so that overlapping windows of length 85 ms were thus used in order to capture the P300 in a single trial.
Ethics
A gtec g.USBamp, 16-channel CE-certified and FDA-listed biosignal amplifier was used for recording all EEG data described in the paper. Ethics approval was obtained from the Joint Research Office at Imperial College London, reference ICREC_12_1_1. Written consents of the subjects who participated in these studies were obtained, and they were not paid for the participation.
Data accessibility
Data used in the analyses can be accessed from http://www.commsp.ee.ic.ac.uk/~mandic../research/emd.htm.
Authors' contributions
A.H. caried out the experiments and performed the data analysis. A.H., V.G., D.L. and D.P.M. conceived of and designed the study, and A.H. drafted the manuscript.
Competing interests
We declare we have no competing interests.
Funding
Thanks to the Royal Thai Government for funding A.H.
References
- 1.Mainsah BO, Collins LM, Colwell KA, Sellers EW, Ryan DB, Caves K, Throckmorton CS. 2015. Increasing BCI communication rates with dynamic stopping towards more practical use: an ALS study. J. Neural Eng. 12, 016013 ( 10.1088/1741-2560/12/1/016013) [DOI] [PMC free article] [PubMed] [Google Scholar]
- 2.Fan X-A, Bi L, Teng T, Ding H, Liu Y. 2015. A brain–computer interface-based vehicle destination selection system using P300 and SSVEP signals. IEEE Trans. Intel. Transport. Syst. 16, 274–283. ( 10.1109/TITS.2014.2330000) [DOI] [Google Scholar]
- 3.Marshall D, Coyle D, Wilson S, Callaghan M. 2013. Games, gameplay, and BCI: the state of the art. IEEE Trans. Comput. Intell. AI Games 5, 82–99. ( 10.1109/TCIAIG.2013.2263555) [DOI] [Google Scholar]
- 4.Dhital A, Banic AU. 2013. Navigation in a virtual environment by dichotic listening: simultaneous audio cues for user-directed BCI classification. In Proc. IEEE Virtual Reality, Lake Buena Vista, FL, 18–20 March 2013, pp. 71–72 ( 10.1109/VR.2013.6549368) [DOI]
- 5.Escolano C, Antelis JM, Minguez J. 2012. A telepresence mobile robot controlled with a noninvasive brain–computer interface. IEEE Trans. Syst. Man Cyber. B 42, 793–804. ( 10.1109/TSMCB.2011.2177968) [DOI] [PubMed] [Google Scholar]
- 6.Cecotti H, Rivet B. 2014. Performance estimation of a cooperative brain–computer interface based on the detection of steady-state visual evoked potentials. In Proc. IEEE Int. Conf. on Acoustics, Speech and Signal Processing, pp. 2059–2063 ( 10.1109/ICASSP.2014.6853961) [DOI]
- 7.Nam CS, Lee J, Bahn S. 2013. Brain–computer interface supported collaborative work: implications for rehabilitation. In Proc. 35th Annual Int. Conf. of the IEEE Engineering in Medicine and Biology Society, pp. 269–272 ( 10.1109/EMBC.2013.6609489) [DOI]
- 8.Wang Y, Wang YT, Jung TP, Gao X, Gao S. 2011. A collaborative brain–computer interface. In Proc. 4th Int. Conf. on Biomedical Engineering and Informatics, Shanghai, China, 15–17 October 2011, pp. 580–583. Piscataway, NJ: IEEE ( 10.1109/BMEI.2011.6098286) [DOI]
- 9.Bonnet L, Lotte F, Lecuyer A. 2013. Two brains, one game: design and evaluation of a multiuser BCI video game based on motor imagery. IEEE Trans. Comput. Intell. AI Games 5, 185–198. ( 10.1109/TCIAIG.2012.2237173) [DOI] [Google Scholar]
- 10.Huang NE, Shen Z, Long SR, Wu MC, Shih HH, Zheng Q, Yen N, Tung CC, Liu HH. 1998. The empirical mode decomposition and the Hilbert spectrum for nonlinear and nonstationary time series analysis. Proc. R. Soc. Lond. A 454, 903–995. ( 10.1098/rspa.1998.0193) [DOI] [Google Scholar]
- 11.Huang NE, Wu MC, Long SR, Shen SSP, Qu W, Gloersen P, Fan KL. 2003. A confidence limit for the empirical mode decomposition and Hilbert spectral analysis. Proc. R. Soc. Lond. A 459, 2317–2345. ( 10.1098/rspa.2003.1123) [DOI] [Google Scholar]
- 12.Liang H, Lin QH, Chen JDZ. 2005. Application of the empirical mode decomposition to the analysis of esophageal manometric data in gastroesophageal reflux disease. IEEE Trans. Biomed. Eng. 52, 1692–1701. ( 10.1109/TBME.2005.855719) [DOI] [PubMed] [Google Scholar]
- 13.Zhou Y, Chen W, Gao J, He Y. 2012. Application of Hilbert–Huang transform based instantaneous frequency to seismic reflection data. J. Appl. Geophys. 82, 68–74. ( 10.1016/j.jappgeo.2012.04.002) [DOI] [Google Scholar]
- 14.Chen X, Wu Z, Huange NE. 2010. The time-dependent intrinsic correlation based on the empirical mode decomposition. Adv. Adapt. Data Anal. 2, 233–265. ( 10.1142/S1793536910000471) [DOI] [Google Scholar]
- 15.Wu Z, Huang NE. 2009. Ensemble empirical mode decomposition: a noise-assisted data analysis method. Adv. Adapt. Data Anal. 1, 1–41. ( 10.1142/S1793536909000047) [DOI] [Google Scholar]
- 16.Tanaka T, Mandic DP. 2007. Complex empirical mode decomposition. IEEE Signal Process. Lett. 14, 101–104. ( 10.1109/LSP.2006.882107) [DOI] [Google Scholar]
- 17.Bin Atlaf MU, Gautama T, Tanaka T, Mandic DP. 2007. Rotation invariant complex empirical mode decomposition. In Proc. IEEE Int. Conf. on Acoustics, Speech and Signal Processing, Honolulu, HI, 15–20 April 2007, pp. 1009–1012. Piscataway, NJ: IEEE ( 10.1109/ICASSP.2007.366853) [DOI]
- 18.Rilling G, Flandrin P, Gonçalves P, Lilly JM. 2007. Bivariate empirical mode decomposition. IEEE Signal Process. Lett. 14, 936–939. ( 10.1109/LSP.2007.904710) [DOI] [Google Scholar]
- 19.Rehman N, Mandic DP. 2010. Empirical mode decomposition for trivariate signals. IEEE Trans. Signal Process. 58, 1059–1068. ( 10.1109/TSP.2009.2033730) [DOI] [Google Scholar]
- 20.Rehman N, Mandic DP. 2010. Multivariate empirical mode decomposition. Proc. R. Soc. A 466, 1291–1302. ( 10.1098/rspa.2009.0502) [DOI] [Google Scholar]
- 21.Komaty A, Boudraa AO, Nolan JP, Dare D. 2015. On the behavior of EMD and MEMD in presence of symmetric α-stable noise. IEEE Signal Process. Lett. 22, 818–822. ( 10.1109/LSP.2014.2371132) [DOI] [Google Scholar]
- 22.Rehman N, Mandic DP. 2011. Filter bank property of multivariate empirical mode decomposition. IEEE Trans. Signal Process. 59, 2421–2426. ( 10.1109/TSP.2011.2106779) [DOI] [PMC free article] [PubMed] [Google Scholar]
- 23.Koh MS, Mandic DP, Constantinides AG. 2014. Theory of digital filterbanks realized via multivariate empirical mode decomposition. Adv. Adapt. Data Anal. 6, 1450001 ( 10.1142/S1793536914500010) [DOI] [Google Scholar]
- 24.Looney D, Hemakom A, Mandic DP. 2014. Intrinsic multiscale analysis: a multivariate EMD framework. Proc. R. Soc. A 471, 20140709 ( 10.1098/rspa.2014.0709) [DOI] [PMC free article] [PubMed] [Google Scholar]
- 25.Chang HC, Lee PL, Lo MT, Wu YT, Wang KW, Lan GY. 2013. Inter-trial analysis of post-movement beta activities in EEG signals using multivariate empirical mode decomposition. IEEE Trans. Neural Syst. Rehabil. Eng. 21, 607–615. ( 10.1109/TNSRE.2013.2258940) [DOI] [PubMed] [Google Scholar]
- 26.Park C, Looney D, Rehman N, Ahrabian A, Mandic DP. 2013. Classification of motor imagery BCI using multivariate empirical mode decomposition. IEEE Trans. Neural Sys. Rehabil. Eng. 21, 10–22. ( 10.1109/TNSRE.2012.2229296) [DOI] [PubMed] [Google Scholar]
- 27.Rehman N, Ehsan B, Abdullah SMU, Akhtar MJ, Mandic DP, McDonald-Maier KD. 2015. Multi-scale pixel-based image fusion using multivariate empirical mode decomposition. Sensors 15, 10 923–10 947. ( 10.3390/s150510923) [DOI] [PMC free article] [PubMed] [Google Scholar]
- 28.von Rosenberg W, Chanwimalueang T, Looney D, Mandic DP. 2015. Vital signs from inside a helmet: a multichannel face-lead study. In Proc. IEEE Int. Conf. on Acoustics, Speech and Signal Processing, South Brisbane, QLD, 19–24 April 2015, pp. 982–986. Piscataway, NJ: IEEE ( 10.1109/ICASSP.2015.7178116) [DOI]
- 29.Ahrabian A, ur Rehman N, Mandic DP. 2013. Bivariate empirical mode decomposition for unbalanced real-world signals. IEEE Signal Process. Lett. 20, 245–248. ( 10.1109/LSP.2013.2242062) [DOI] [Google Scholar]
- 30.Rehman N, Safdar MW, Rehman U, Mandic DP. 2014. Dynamically-sampled bivariate empirical mode decomposition. IEEE Signal Process. Lett. 21, 857–861. ( 10.1109/LSP.2014.2317773) [DOI] [Google Scholar]
- 31.Hemakom A, Ahrabian A, Looney D, ur Rehman N, Mandic DP. 2015. Nonuniformly sampled trivariate empirical mode decomposition. In Proc. IEEE Int. Conf. on Acoustics, Speech and Signal Processing, South Brisbane, QLD, 19–24 April 2015, pp. 3691–3695. Piscataway, NJ: IEEE ( 10.1109/ICASSP.2015.7178660) [DOI]
- 32.Mandic DP, Rehman N, Wu Z, Huang NE. 2013. Empirical mode decomposition-based time-frequency analysis of multivariate signals. IEEE Signal Process. Mag. 30, 74–86. ( 10.1109/MSP.2013.2267931) [DOI] [Google Scholar]
- 33.Polich J. 2009. Updating P300: an integrative theory of P3a and P3b. Clin. Neurophysiol. 118, 2128–2148. [DOI] [PMC free article] [PubMed] [Google Scholar]
- 34.Kuś R. et al 2013. On the quantification of SSVEP frequency responses in human EEG in realistic BCI conditions. PLoS ONE 8, e77536 ( 10.1371/journal.pone.0077536) [DOI] [PMC free article] [PubMed] [Google Scholar]
- 35.Jia C, Gao X, Hong B, Gao S. 2011. Frequency and phase mixed coding in SSVEP-based brain–computer interface. IEEE Trans. Biomed. Eng. 58, 200–206. ( 10.1109/TBME.2010.2068571) [DOI] [PubMed] [Google Scholar]
- 36.Nieuwenhuis S, Aston-Jones G, Cohen JD. 2005. Decision making, the P3, and the locus coeruleus–norepinephrine system. Psychol. Bull. 131, 510–532. ( 10.1037/0033-2909.131.4.510) [DOI] [PubMed] [Google Scholar]
- 37.Solis-Escalante T, Gentiletti GG, Yañez-Suarez O. 2006. Single trial P300 detection based on the empirical mode decomposition. In Proc. 28th Annual Int. Conf. of the IEEE Engineering in Medicine and Biology Society, New York, NY, 30 August–3 September 2006, pp. 1157–1160. Piscataway, NJ: IEEE ( 10.1109/IEMBS.2006.260589) [DOI] [PubMed]
Associated Data
This section collects any data citations, data availability statements, or supplementary materials included in this article.
Supplementary Materials
Data Availability Statement
Data used in the analyses can be accessed from http://www.commsp.ee.ic.ac.uk/~mandic../research/emd.htm.


