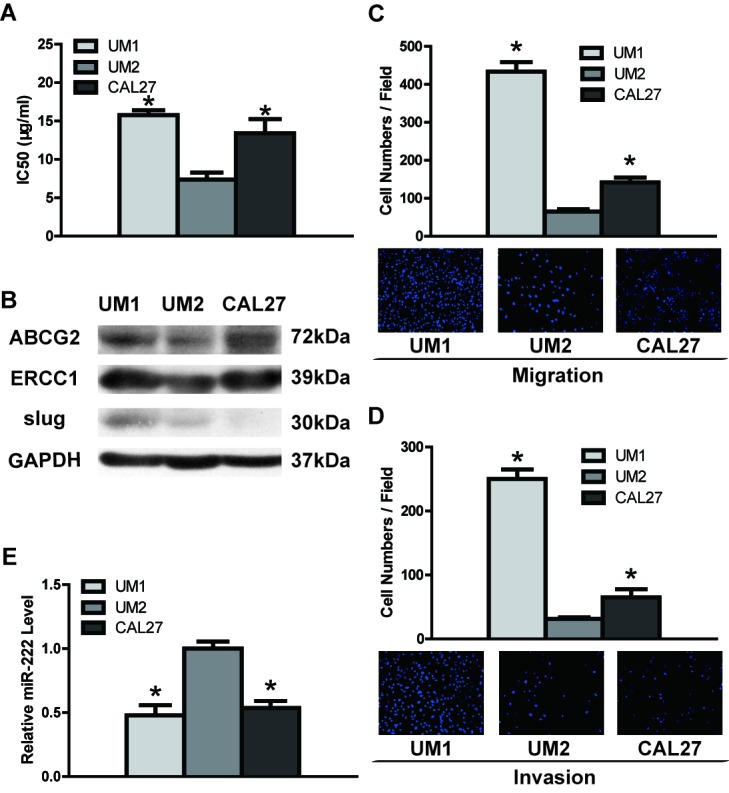
Figure 2. DDP resistance, migratory/invasive potential and miR-222 expression in TSCC cell lines.

A. UM2 cells had significantly lower IC50 values than UM1 and CAL27 cells. B. Western blotting was used to detected the expression of ABCG2, ERCC1 and Slug in TSCC cell lines. The results from western blots were quantified; the results are shown in Figure S1. (C and D) UM2 cells had significantly lower migration and invasion abilities than UM1 and CAL27 cells, as measured by transwell migration C. and invasion D. assays. E. UM2 cells showed significantly higher expression of miR-222 than UM1 and CAL27 cells, as measured by qRT-PCR. *p < 0.05 vs. UM2.
