Abstract
Characterization of the microscale mechanical properties of biomaterials is a key challenge in the field of mechanobiology. Dual-mode ultrasound elastography (DUE) uses high frequency focused ultrasound to induce compression in a sample, combined with interleaved ultrasound imaging to measure the resulting deformation. This technique can be used to non-invasively perform creep testing on hydrogel biomaterials to characterize their viscoelastic properties. DUE was applied to a range of hydrogel constructs consisting of either hydroxyapatite (HA)-doped agarose, HA-collagen, HA-fibrin, or preosteoblast-seeded collagen constructs. DUE provided spatial and temporal mapping of local and bulk displacements and strains at high resolution. Hydrogel materials exhibited characteristic creep behavior, and the maximum strain and residual strain were both material- and concentration-dependent. Burger’s viscoelastic model was used to extract characteristic parameters describing material behavior. Increased protein concentration resulted in greater stiffness and viscosity, but did not affect the viscoelastic time constant of acellular constructs. Collagen constructs exhibited significantly higher modulus and viscosity than fibrin constructs. Cell-seeded collagen constructs became stiffer with altered mechanical behavior as they developed over time. Importantly, DUE also provides insight into the spatial variation of viscoelastic properties at sub-millimeter resolution, allowing interrogation of the interior of constructs. DUE presents a novel technique for non-invasively characterizing hydrogel materials at the microscale, and therefore may have unique utility in the study of mechanobiology and the characterization of hydrogel biomaterials.
Keywords: Mechanical Characterization, Protein Hydrogels, Acoustic Radiation Force, Elastography, Viscoelasticity, Tissue Engineering
INTRODUCTION
The importance of mechanical cues in the extracellular environment in directing cell behavior has been demonstrated conclusively over the past decade [1–3]. Mechanical signals combine with other cues, including soluble biochemical factors and cell-cell and cell-matrix adhesions, to regulate many important developmental, physiological, and pathological processes [4]. The realization that mechanical factors must be considered when seeking to understand cell function has led to an increasing interest in the field of mechanobiology, with an emphasis on determining how changes in matrix mechanical properties affect cell phenotype. However, the molecular mechanisms underlying mechanotransduction are not fully understood, in part because of the difficulty in robustly characterizing the mechanical behavior of biomaterials at the microscale.
Tissue engineering generally aims to enhance tissue regeneration through the use of cells and biomaterial scaffolds designed to mimic the properties of the extracellular matrix (ECM). It is well established that scaffold materials play a critical role in cell attachment, proliferation, and differentiation, and that their mechanical properties have significant effects on cell behavior [5]. Hydrogels are often used as scaffold materials because of their similarity to the ECM, cell compatibility, and ease of fabrication. These materials consist of water-swollen networks of cross-linked hydrophilic polymer chains derived from either natural, synthetic or hybrid materials [6], and have been used as biomimetic materials for skin [7], corneal [8, 9], cartilage [10, 11], and vascular [12] tissue engineering. Hydrogels have also been used to study cell-matrix interactions, including response to mechanical cues [13]. A key attribute of many hydrogel biomaterials is their viscoelastic nature [14], which mimics tissue behavior and has recently been shown to be important to the cellular response [15, 16]. Therefore tuning and characterizing hydrogel mechanical properties are important when creating and maintaining engineered tissues. However, current methods for assessing material mechanical properties are generally limited by the need for invasive specimen preparation, difficulties in applying to soft and cell-seeded biomaterials, and the destructive nature of testing that precludes longitudinal studies.
Commonly used methods for measuring the mechanical properties of hydrogel biomaterials include uniaxial tensile testing [17], compression testing [18], and shear rheology[19, 20]. In addition, more specialized testing using micro- and nano-indentation [21, 22], bulge tests [23], magnetic force methods [24], and other contact-based approaches have been used to characterize the properties of hydrogel materials [25]. These conventional mechanical testing techniques typically deform a sample by stretching or compression applied directly to the sample by means of grips, platens or other physical fixtures [18, 25]. Bulk material properties and stress-strain relationships can be generated to provide more insight into the material behavior, and time-dependent tests can be used to characterize basic viscoelastic properties. However, it is difficult to directly compare measurements obtained from different types of tests because the loading mode is different. For example, shear rheometry relies on tangential shear applied at the material surface (usually in torsion), whereas creep testing uses compression (or tension) to apply a force normal to the surface of the material. The values for the elastic and viscous components derived from these two orthogonal loading modes in soft materials are quite different. In addition, conventional approaches generally require physical contact with the samples, and are unable to determine internal strain distributions or spatial variation of the mechanical properties in materials.
Ultrasound techniques have the potential for non-invasive material characterization, because of their capability to penetrate and interact with cells and tissues at depth (recently reviewed in [26]. Ultrasound elastography [27] has been developed to detect tumors [28–30] by using ultrasound-generated images before and after tissue compression to derive information about sample stiffness [31, 32]. In particular, acoustic radiation force (ARF) elasticity imaging techniques, such as acoustic radiation force impulse (ARFI) imaging [33, 34], use the force associated with an ultrasound field to generate deformation within a body of material in a non-contact fashion [35, 36]. While ultrasound elastography detects relative spatial variation of tissue stiffness, such as those caused by tumors, it does not generally provide a direct assessment of absolute material parameters or tissue viscoelastic properties.
An ultrasound technique called sonorheometry developed by Walker et al. [37]] for assessing blood coagulation [38, 39] uses multiple ultrasound pulses to apply ARF to a sample, and measures the sample displacement over time. Relative elasticity and viscosity of the sample were derived by fitting the time-displacement curve with a Voigt model. Mauldin at el. [40] used a similar approach called monitored steady-state excitation and recovery (MSSER) to obtain displacement data before and after ARF application. These studies focused on non-invasively determining the relative mechanical properties of inclusions in tissues at depth. However, they worked solely with bulk displacements and did not provide information on microscale mechanical properties. In addition, these ARF-based techniques used the same ultrasound system for both force application and detection of displacement. While convenient, this configuration makes it difficult to generate the high intensity ultrasound pulses needed to generate sufficient ARF for tissue compression. Therefore for maximum performance, it is preferable to have separate deforming and imaging beams to optimize the characteristics of each type of ultrasound beam.
The goal of the present study was to demonstrate a versatile technique capable of non-invasive characterization of the viscoelastic properties of hydrogel biomaterials both in the bulk phase and at the microscale. We developed a dual-mode ultrasound elasticity (DUE) technique that uses focused ultrasound (FUS) pulses to induce compression in samples in conjunction with a co-linearly aligned high frequency ultrasound imaging system to detect sample deformation as a function of time and location at high resolution. The use of separate transducers for compression and detection provides the design flexibility to control loading conditions. We applied the DUE technique to representative hydrogel constructs to investigate the effects of biomaterial composition on viscoelastic properties, and to characterize the spatial variation of properties through the depth of these materials. Creep tests were performed by applying a constant load for a defined period of time and characterizing the compression and subsequent relaxation of hydrogel samples. Burger’s viscoelastic model was applied to generate quantitative parameters that described the viscoelastic behavior. This study shows how DUE can be used to non-invasively characterize hydrogel materials, and how the spatial variation in mechanical and viscoelastic properties can be mapped using this technique. Such high resolution spatial information is expected to facilitate our elucidation of the principles of mechanobiology, and will aid in designing and developing engineered tissues.
MATERIALS AND METHODS
Preparation of Hydrogel Constructs
Four types of hydrogel constructs were tested: hydroxyapatite (HA)-doped agarose constructs (10.0 mg/ml), HA-doped collagen constructs (2.0 mg/ml and 5.0 mg/ml), HA-doped fibrin constructs (2.0, 4.0, 8.0, 10.0 and 12.0 mg/ml), and cell-seeded collagen constructs (collagen concentration 2.0 mg/ml) on day 1 and day 5. In acellular constructs, hydroxyapatite served as a scatterer that produced ultrasound signals, while in cell-seeded constructs the cellular component served as the scatterer. HA has been used as an additive in a variety of hydrogel biomaterials, for example to potentiate bone formation and to facilitate endothelial network formation [41].
Agarose solution (1.0% w/v) was prepared by dissolving agarose powder (Sigma Aldrich, St. Louis, MO) in distilled water via heating and stirring. Nano-grade hydroxyapatite (HA) (Sigma Aldrich) suspended in Dulbecco’s modified Eagle’s medium-low glucose (DMEM; Life Technologies, Grand Island, NY) was prepared at 200 mg/ml and placed in a sonication water bath for 1 h to disrupt aggregates [42]. Nano-HA stock solution was added to the agarose solution to obtain a final HA concentration of 10.0 mg/ml. The mixture was degassed and 250 μL was injected into a 48-well plate and allowed to gel at 4°C for 30 min.
HA-doped collagen hydrogels of 2.0 mg/ml and 5.0 mg/ml were generated as previously described [43], with some modifications. Briefly, collagen type I (MP Biomedicals, Solon, OH) was dissolved at 4.0 mg/ml (for 2.0 mg/ml collagen hydrogel) or 10.0 mg/ml (for 5.0 mg/ml collagen hydrogel) in 0.02 N acetic acid and stirred overnight. HA-doped collagen hydrogels were generated by mixing 50% collagen type I, 20% 5X-concentrated Dulbecco’s modified Eagle’s medium (5X-DMEM; Invitrogen, Carlsbad, CA), 10% fetal bovine serum (FBS; Invitrogen), 5% DMEM, 5% 200 mg/ml nano-HA stock solution, and 10% 0.1 N NaOH (Sigma Aldrich). This mixture (250 μL) was then injected into a 48-well plate and allowed to gel at 37ºC for 30 min. HA-collagen composites were 10 mm in diameter and 2–3 mm in thickness after fabrication and their dimensions remained stable over time.
HA-doped fibrin hydrogels of 2.0, 4.0, 8.0, 10.0 and 12.0 mg/ml fibrin were prepared by adding nano-HA solution to a fibrin gel mixture as previously described [43]. Fibrinogen was prepared by dissolving the appropriate amount of bovine fibrinogen (Sigma Aldrich) in DMEM to reach the desired final concentration. HA-fibrin hydrogels were generated by mixing 83% fibrinogen stock solution, 10% FBS, 5% of 200 mg/ml nano-HA stock solution, and 2% 50 UT/mL thrombin (Sigma Aldrich). This mixture (250 μL) was injected into a 48-well plate and allowed to gel at 37ºC for 25 min. HA-fibrin composites were 10 mm in diameter and 2–3 mm in thickness after fabrication and their dimensions remained stable over time.
Mouse pre-osteoblast (MC3T3-E1) cells were cultured in α-MEM (Life Technologies) without ascorbic acid but supplemented with 10% FBS and 1% penicillin and streptomycin (PS; Life Technologies), and encapsulated in collagen hydrogels at passage 9 at a concentration of 1.0×10⁶ cells/mL. Cellular constructs were prepared by mixing 50% collagen type I (4.0 mg/ml), 20% 5X-DMEM, 10% FBS, 10% cell suspension in DMEM, and 10% 0.1 N NaOH. This mixture (250 μL) resulted in a collagen concentration of 2.0 mg/ml, which was then injected into a 48-well plate and allowed to gel at 37ºC for 30 min. Cell-seeded constructs were cultured in α-MEM supplemented with FBS and PS for a period of five days. Cellular constructs were ~8 mm in diameter and 2 mm in thickness at day 1, and compacted over time due to cell-mediated compaction to ~5 mm in diameter and 1 mm in thickness at day 5.
DUE Technique for Characterizing Hydrogel Mechanical Properties
Experimental Setup
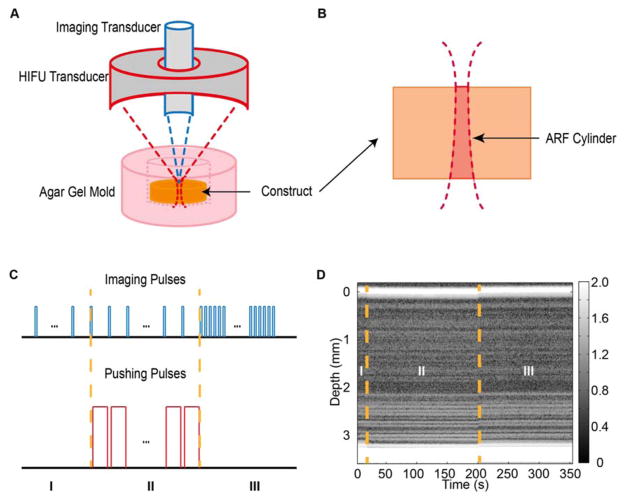
The DUE imaging setup (Fig. 1A) consisted of a 2 MHz FUS transducer with an annular aperture (H148; Sonic Concepts, Woodinville, WA) and an ultrasound imaging system with a 10 MHz transducer (Olympus, Waltham, MA; focal distance at 55 mm, - 6 dB beam width of 1 mm). The imaging transducer was placed in the annular space of the FUS transducer and collinearly aligned. The FUS transducer was driven by a signal generator (33220A; Agilent, Santa Clara, CA) and a power amplifier (75A250; Amplifier Research, Souderton, PA), and was calibrated using a hydrophone (HNR-0500; Onda, Sunnyvale, CA) to map the 3D beam profile in free field. In experiments, a construct was placed in an excavation within a 2% w/v agar gel mold that supported the construct and reduced reflections from boundaries. The FUS focal point was positioned on the top surface of the construct. In this configuration, the FUS applied an ARF to induce compression within a specific volume determined by the FUS beam profile and referred to as the ARF cylinder, (Fig. 1B).
Figure 1.
(A) Experimental setup of dual mode elastography (DUE), which combines high frequency focused ultrasound (HIFU) with high resolution imaging to mechanically characterize hydrogel materials (not to scale). (B) Cross-section of an acoustic radiation force (ARF) cylinder in a sample caused by focusing of the ultrasound beam. (C) Pulse scheme for FUS pushing and imaging pulses during DUE deformation and detection. (D) Representative grayscale M-mode image showing the scatter distribution before (phase I), during (phase II), and after (phase III) compression. Best viewed in color.
Ultrasound Application and Data Acquisition
Experiments were conducted using the four types of constructs described above. For each construct, 3D imaging was performed using a VEVO 770 imaging system (VisualSonics Inc., Toronto, Canada) to assess construct morphology and volume. The volume of the construct was determined by integrating the area of cross-sections obtained from 3D image data with 0.2 mm step size using a semi-automated algorithm from the VEVO 770 system. The absorption coefficient and acoustic speed of the constructs were determined from imaging an agar gel pad with and without the construct and comparing the spectral magnitude and travel time to the agar gel pad under both conditions, as described in our previous work [41].
In this study, the DUE technique was tested with ultrasound imaging operated in M-mode at four discrete lateral locations in each construct, although the technique can be easily expanded to fully 3D measurements by performing testing covering the entire construct. At each location, Aline pulse-echo signals were acquired before, during, and after FUS compression and stored for off-line analysis. As illustrated in Fig. 1C, pulse-echo imaging was performed at a 1 Hz pulse repetition frequency (PRF) via a pulser-receiver (5900 PR; Olympus) for 20 s to acquire baseline signals before FUS compression. A series of FUS pulses (1 Hz PRF, pulse duration 0.99 s or duty cycle 99%) were then applied to the construct for a total of 180 s. During FUS application, ultrasound imaging pulses (PRF 1 Hz, pulse duration 0.4 μs or duty cycle 0.00004%) were applied to detect FUS-induced deformation in the construct. The imaging pulses were interleaved with the FUS pulses to allow acquisition of backscattered radio frequency (RF) signals without interference. At the end of FUS application, imaging was again performed and backscattered RF signals were acquired for 150 s at a PRF of 50 Hz. Synchronization of the FUS pulses and imaging pulses was accomplished using a pulse/delay generator (Model 565; BNC, San Rafael, CA) and two waveform generators (33220A; Agilent, Santa Clara, CA). Backscattered RF signals received by the imaging transducer were recorded at 250 million sample/s and stored on a digital oscilloscope (54380B, Agilent, Santa Clara, CA). Fig 1D shows an example of an M-mode image generated by the imaging transducer, showing a hydrogel before (section I), during (section II), and after (section III) application of the compressive ultrasound pressure.
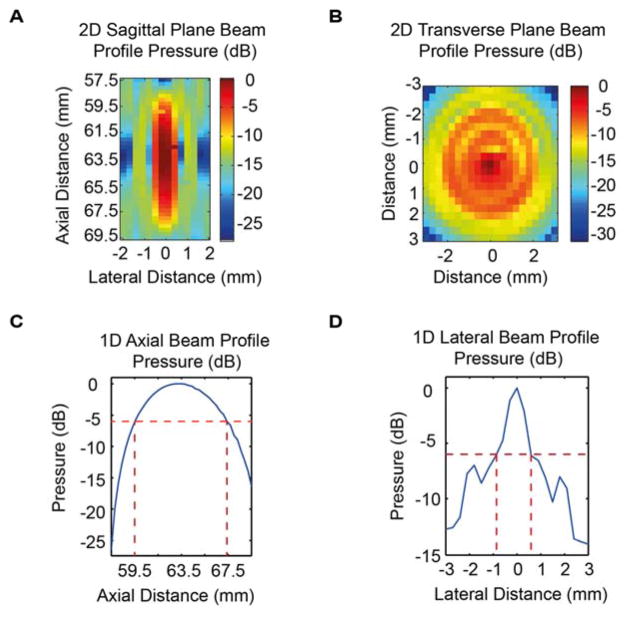
Characterization of the FUS transducer was performed to determine the ultrasound beam profile in the sagittal and transverse planes (Fig. 2A, 2B). The compressive beam measured in free field in this study was axis symmetric, with a 6-dB axial beam depth of 8.0 mm (Fig. 2C) and a lateral beam width of 1.5 mm at the focal plane (Fig 2D).
Figure 2.
Acoustic pressure profile (in dB) for the FUS transducer in (A) 2D sagittal plane, (B) 2D transverse plane, (C) 1D axial direction, and (D) 1D lateral direction. Best viewed in color.
Generation of Stress and Detection of Strain in Hydrogels using DUE
The principle of DUE is to apply FUS pulses to generate deformation in the construct via the associated ARF, which is caused by momentum transfer from a propagating ultrasound wave to the medium [35]. The ARF is a body force that is generated within a sample [44], offering the possibility of “remote palpation” without direct surface contact. The ARF is dependent on the spatial distribution of the ultrasound intensity and the degree of acoustic attenuation in the sample [45]. A high duty cycle (99%) was chosen for the FUS pulses to generate an essentially constant compression load to the sample, while allowing interleaving with ultrasound imaging for detection of deformation during ARF application.
The lateral beam width of the axial symmetric FUS field (e.g. ~ 1.5 mm) generates deformation mostly concentrated within a narrow cylinder of material along the direction of the FUS beam, which we refer to as the ARF cylinder. The cross sectional area of the ARF cylinder is determined by the lateral energy distribution of the FUS field. The material within the ARF cylinder sustains the most deformation and strain, and the co-linearly aligned high frequency ultrasound imaging system, which also has a narrow lateral beam profile, detects the FUS induced strain within the ARF cylinder as a function of depth and time. Laterally, the detected strain is the average strain over the cross sectional area of the imaging beam.
Data Analysis and Model Fitting
M-mode Image, Local Displacement, and Displacement Color Maps
M-mode images were generated from the series of A-line RF signals obtained at a given location at different times after applying the Hilbert transform to the signals [46] (e.g. Fig. 1D). A section of RF signals in the image represents the material element at that location. For each A-line, displacement at different depths was determined from the temporal shift of the corresponding RF signal segment from pre-compression using a two-step cross-correlation algorithm [47]. A ten-wavelength window surrounding a specific location was first used to obtain a coarse estimation of displacement at this location. The coarse estimation was then interpolated, and a single wavelength window was applied to obtain the displacement from base-line, defined as the average value of pre-compression locations. Displacement color maps were generated by color-coding the displacement value at each pixel location.
Bulk Strain and Segment Strain
The positions of the top and bottom surfaces of an ARF cylinder in the construct being tested were determined directly from the backscattered RF signals acquired at this location. Change in thickness (Δl ) of the ARF cylinder, was calculated as the difference between the displacement at the top surface ( dt ) and the bottom surface ( db ) of the ARF cylinder. We define the bulk strain, εb, as the ratio of Δl over the original ARF cylinder thickness ( l0 ) as
| (1) |
To assess spatial distribution of the strain in the construct, an ARF cylinder was divided into N axial segments of equal length ( ls0 ) to represent local strains. The segment strain, εsi, was defined as the ratio of the change in length of a segment ( Δli ), which is computed as the difference in displacements at the top and bottom boundaries of the segment ( dti and dbi in the ARF cylinder) over ls0:
| (2) |
Thus the bulk strain is the average of the segment strains:
| (3) |
To relate local strain to bulk strain, the ratio of each segment strain over the bulk strain was computed. The contribution of each segment strain to the overall bulk strain could then be computed to examine heterogeneity within the sample volume, and to determine the effect of segment size on this heterogeneity.
Maximum Strain, Residual Strain, Creep and Recovery Time Constants
The maximum strain was defined as the highest value of strain achieved during FUS application. The residual strain was defined as the steady-state strain after the end of FUS application. The creep and recovery time constants were obtained by fitting the deformation data over time with exponential functions. These parameters provided a versatile means for characterizing the viscoelastic strains without assuming a specific model of the material being tested.
Burger’s Viscoelastic Model
Burger’s viscoelastic model [48] (Fig. S1) combines a Maxwell model (a spring and a dashpot in series) and a Voigt model (a spring in parallel with a dashpot). The parameters R1 and R2 represent elastic properties (or modulus) of the Maxwell model and Voigt model respectively, while η1 and η2 are associated with the viscosity of the materials [49].
Under a constant stress σ0 from t = 0 to t = tc, the material sustains a strain response described by Burger’s model
| (4) |
which includes the elastic strain σ0/R1, viscous strain σ0t/η1, and viscoelastic strain σ0/R2 with a viscoelastic creep constant η2 / R2 [50]. The model parameters R1, R2, η1 and η2 can be obtained by fitting experimental creep data to equation (4) to characterize the behavior of the viscoelastic material.
After removal of the stress at t = tc, strain will undergo a viscoelastic recovery for t > tc
| (5) |
Note that equation (5) does not include the instantaneous elastic recovery (σ0 / R1)) immediately after the removal of the applied stress. Fitting the recovery strain data (t > tc) to equation (5) can be performed to estimate η1, R1, and η2, while R1 can be obtained directly by determining the instantaneous elastic recovery of strain. However, to avoid potential large errors in estimating the sharp decrease, we rearrange equation (5) using the strain value at t = tc as
| (6) |
allowing estimation of R1 by fitting the recovery strain without using the instantaneous recovery strain. Fitting the recovery strain to eq. (6) can be performed to estimate η1, R1, and η2 / R2.
Model Fitting: DUE Characterization of Averaged Viscoelastic Propertie
Burger’s viscoelastic model is a lumped model that uses discrete spring and dashpot elements to approximate the behavior of linearly viscoelastic materials. In modeling creep behavior, it assumes that the stress is applied as a step function, and is valid for primary and secondary creep behavior, but not tertiary creep (i.e. necking, which is not relevant in compression). Although theoretically the spatiotemporal evolution of FUS-induced stress and strain in a 3D construct is a distributed problem, the DUE technique is compatible with approximation using Burger’s model. Model fitting using Burger’s model can be applied to the entire ARF cylinder to obtain averaged material properties, such as the bulk strain as defined in eq. (1) and stress applied to the ARF cylinder. The FUS generated stress for the ARF cylinder is
| (7) |
Thus the averaged viscoelastic property for the ARF cylinder in a construct can be characterized by fitting the strain and stress to eqs. (4) and (5) to obtain the relevant Burger’s model parameters.
Because the ARF acts through the sample, the DUE technique can be used to interrogate material properties of a specific segment of material (thickness Δz) at depth z within the sample. The segment strain is related to the stress applied to the segment, calculated by volume integration of the body force ARF within the ARF cylinder:
| (8) |
where SFUS(z) is the beam cross sectional area of the axial symmetric FUS beam at depth z. The ARF, F[N/ m3] depends on the absorption coefficient α[m−1], in situ acoustic intensity I′⌊W / m2⌋, and speed of sound c[m/ s] in the sample [44]. Under a plane wave assumption,
| (9) |
where I′ is approximated by the free field intensity I(r,z) multiplied by the attenuation factor.
Temperature Measurement during FUS Application
We used HA-doped collagen constructs (2.0 mg/ml and 5.0 mg/ml collagen) to assess the temperature change due to FUS exposure. A sample was placed in a polymer holder with an acoustically transparent bottom, with its top surface kept dry (above water/medium). IR thermal imaging (Silver SC5600, FLIP, Wilsonville, OR) was used to measure the temperature in the construct as described previously [51] using an emissivity of 0.85 for collagen hydrogels [52]. The FUS pulses were applied from below with its focus positioned on the upper surface of the sample.
Statistical Analysis
Results are presented as mean ± standard deviation. Student’s two-tailed t-test for unpaired samples was performed to determine differences between groups. Differences were considered statistically significant when p < 0.05.
RESULTS AND DISCUSSION
Ultrasound Characterization of Hydrogel Constructs
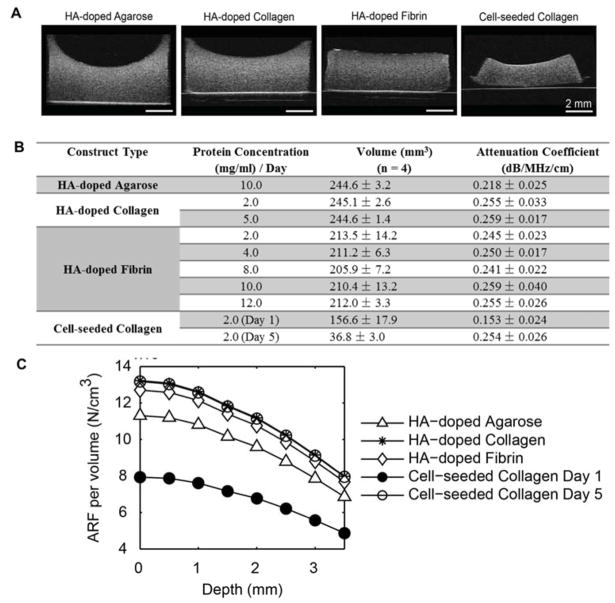
Shape and volume changes in the constructs were monitored longitudinally after fabrication using ultrasound imaging. B-mode images of the hydrogel constructs examined in this study (Fig. 3A) showed that the both the HA added to the hydrogels and the cellular component were evenly spatially distributed as acoustic scatterers within the constructs. The table in Fig 3B shows the calculated volume of each construct type, measured immediately after fabrication for acellular constructs, and on day 1 and day 5 for cellular constructs. All constructs were fabricated using the same initial volume of material. The agarose gels and collagen constructs had the highest volume, which was similar between the materials. However, fibrin constructs had volumes about 15% lower than the other materials. Cell-seeded constructs exhibited an even larger volume reduction via cell-mediated compaction over time, and decreased in volume by 35% at 1 day and 85% after 5 days. These volume reductions resulted in an effective increase in the protein concentrations in the respective construct types. For example, for 2.0 mg/ml fibrin constructs, the effective bulk concentration after compaction was 2.3 mg/ml. For the more compacted cell-seeded constructs (initial collagen concentration 2.0 mg/ml), the effective collagen concentration was 3.1 mg/ml and 13.2 mg/ml on day 1 and day 5, respectively. An advantage of the non-invasive DUE system is that the dynamic remodeling of constructs can be monitored over time.
Figure 3.
(A) B-mode images of hydrogel constructs. (B) Volume and attenuation coefficient of hydrogel constructs as a function of matrix material and concentration. (C) Acoustic radiation force per volume in hydrogel constructs.
Fig. 3B also lists the acoustic attenuation coefficient of each construct type measured at a location near the middle of the hydrogel. The HA-doped collagen and fibrin constructs exhibited similar degrees of acoustic attenuation, generally around 0.25 dB/MHz/cm. These values were not dependent on protein concentration, suggesting that the HA component was mostly responsible for acoustic attenuation. The day 1 cell-seeded collagen samples exhibited a significantly lower degree of acoustic attenuation due to the lack of HA in the matrix, however by day 5 they were similar to the HA-collagen and HA-fibrin samples. This effect was likely due to the high degree of compaction of the cell-seeded constructs over time, resulting in higher effective cell and matrix densities and greater acoustic scattering. The attenuation coefficients could be used to calculate the axial profile of the ARF associated with the FUS field in each construct tested (Fig. 3C).
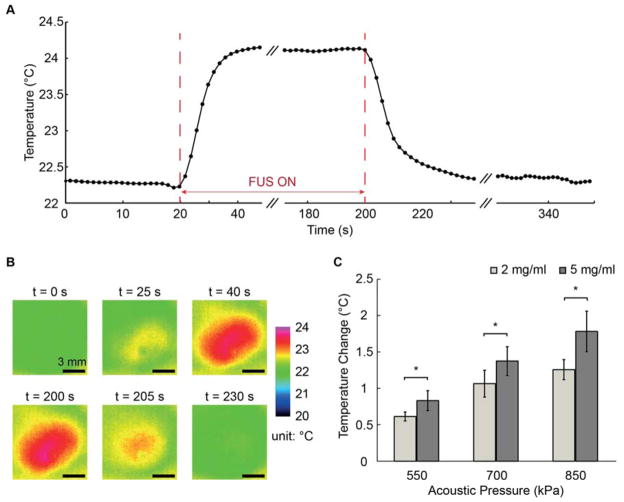
The temperature in the constructs was monitored during FUS application (Fig. 4) to characterize the degree of ultrasound-induced heating, which could be harmful to engineered tissues. The temperature was found to follow a time course (Fig. 4A) and spatial pattern (Fig. 4B) that would be expected from FUS energy application and subsequent heat dissipation. Higher acoustic pressure induced a greater temperature rise (Fig. 4C), however the maximum temperature increase was less than 2 ºC for the FUS parameters used in this study. The 5.0 mg/ml collagen constructs exhibited higher temperature increases than the 2.0 mg/ml collagen constructs at the same acoustic pressure, since the FUS-induced temperature increase depends on the attenuation coefficient and thermal diffusivity [33]. However, in all cases the temperature rise was not in the range expected to be harmful to the embedded cellular component.
Figure 4.
(A) Example temperature-time curve of a 5.0 mg/mL HA-doped collagen hydrogel when tested at 850 kPa acoustic pressure. (B) Example of temperature maps at selected time points during creep testing. (C) Aggregate temperature increase data (n=4) for 2.0 mg/mL and 5.0 mg/mL HA-collagen constructs under acoustic pressure of 550, 700, and 850 kPa with 180 s FUS pulse duration. Best viewed in color.
FUS-induced Strain in Hydrogel Constructs
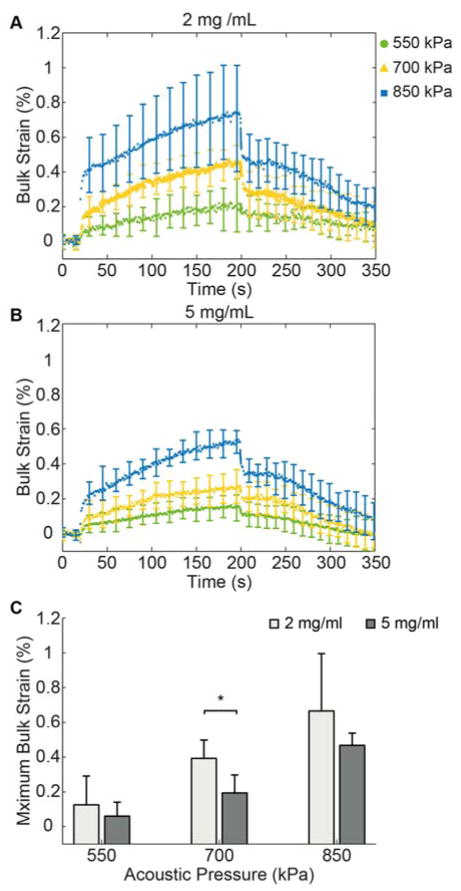
Experiments using HA-collagen constructs (2.0 mg/ml or 5.0 mg/ml collagen) were conducted to examine the bulk strain response to FUS application at selected acoustic pressures (Fig. 5). The bulk strain of the constructs exhibited characteristic viscoelastic behavior (Figs. 5A, 5B). The curves showed a step increase in strain upon FUS application (at t = 20 s) followed by a creep region during which strain increased gradually at constant load until the end of the 180 s FUS application (t = 200 s), followed by strain recovery when FUS compression was removed. At both collagen concentrations, the different acoustic pressures produced distinct curves. The variation in strain values was somewhat larger in 2.0 mg/ml collagen constructs subjected to higher FUS acoustic pressure, compared to the 5.0 mg/ml constructs. In both types of constructs the maximum strain increased with increasing applied acoustic pressure in an approximately linear fashion (Fig. 5C), and at 700 kPa the collagen concentrations were distinguished by a statistical significantly different maximum strain, reflective of the difference in material stiffness.
Figure 5.
Bulk strain curves for (A) 2.0 mg/mL and (B) 5.0 mg/mL HA-doped collagen constructs (n = 4). (C) Maximum bulk strain values for the two concentrations under acoustic pressures of 550 kPa, 700 kPa, and 850 kPa.
Spatiotemporal Distribution of FUS-induced Deformation in Hydrogel Constructs
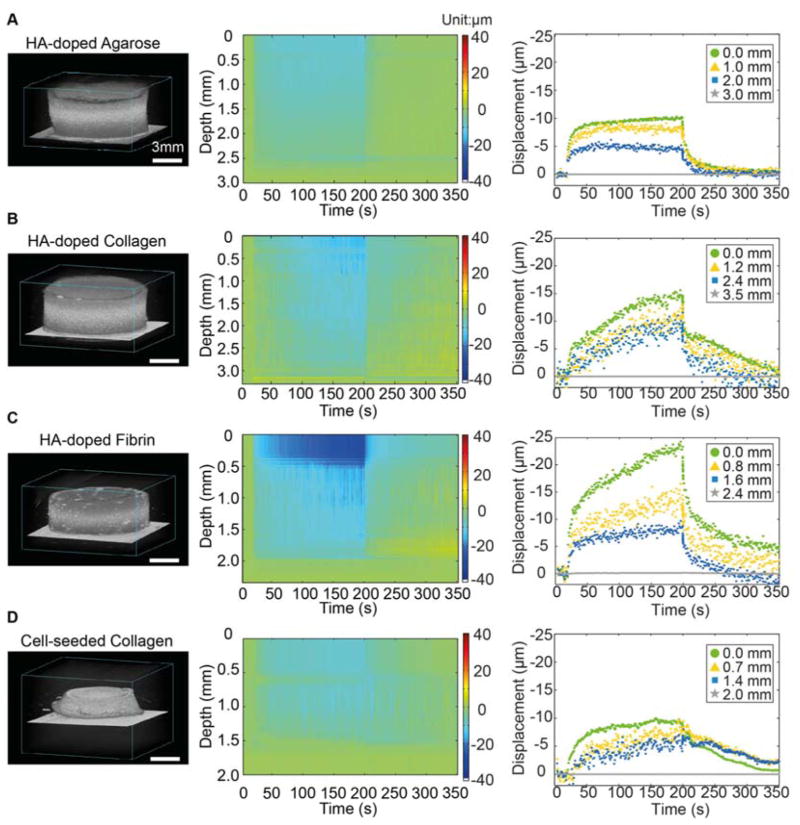
Figure 6 shows high frequency 3D renderings of the hydrogel construct types (left column), along with the corresponding displacement maps (middle column), and graphs of displacement at four axial locations within each construct type (right column) generated by DUE. The displacement maps express the spatiotemporal evolution of the FUS-induced deformation within the samples. The displacements were the largest at the top surface of the construct, decreased with increasing depth within the material, and were zero at the bottom of the samples because of the fixed boundary. In general, maximum displacements were in the range 10–25 μm, depending on the material and location in the construct. HA-doped agarose gels (Fig. 6A) showed displacements that increased rapidly upon application of FUS, and stayed almost constant during the period of FUS compression. Similarly, recovery after FUS compression was rapid and complete. The rapid step jumps upon application of FUS compression and the lack of significant creep are reflective of the essentially elastic nature of these constructs. In contrast, FUS-generated displacements in collagen and fibrin constructs exhibited viscoelastic behavior, with a clear creep response during FUS compression and after removal of the acoustic pressure (Fig 6B–6D). The degree of displacement was dependent on the construct composition. Fibrin constructs generally exhibited the greatest degree of compression, while cell-seeded constructs at day 1 sustained smaller displacements, due to the lower attenuation coefficient (Fig. 3B) and correspondingly lower ARF in these samples (Fig. 3C).
Figure 6.
Example of 3D rendered ultrasound images (left column), displacement color maps (center column) and displacement at selected depth in the constructs (right column) for (A) HA-doped agarose gel, (B) HA-doped collagen constructs (2 mg/mL), (C) HA-doped fibrin construct (2 mg/mL), and (D) cell-seeded collagen construct (day 1). Best viewed in color.
Spatiotemporal Distribution of FUS-induced Strain in Hydrogel Constructs
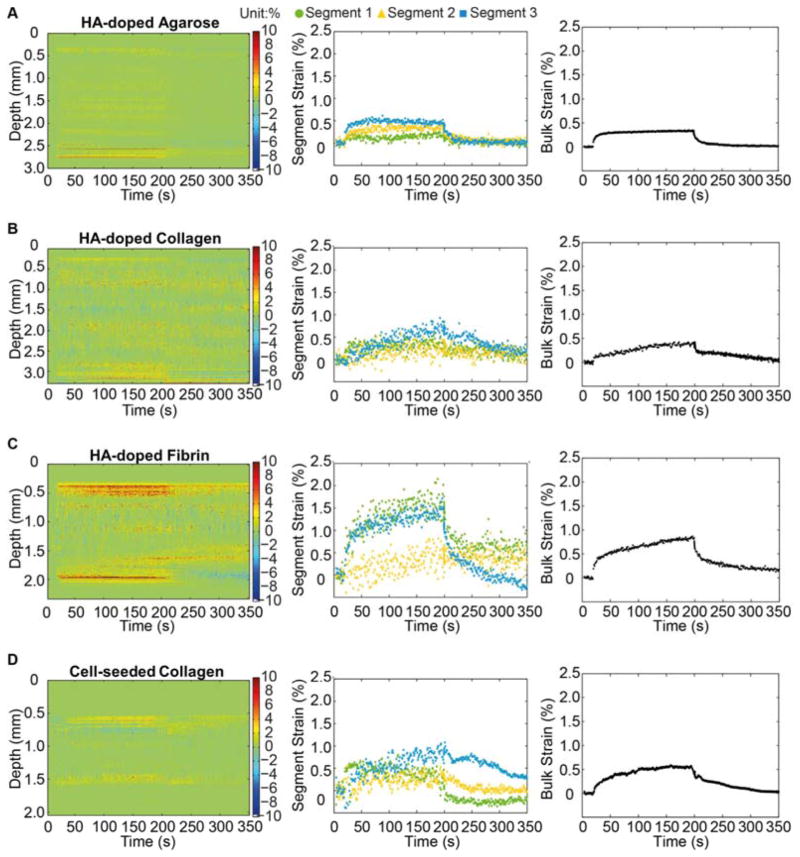
The absolute displacement data were converted to strain by normalizing to a dimension in the uncompressed state, either of a portion of the thickness of the construct (to calculate segment strains) or of the entire construct thickness (to calculate bulk strain). Figure 7 shows strain maps (left column), three selected segment strains (middle column), and bulk strains (right column) for the each construct type. The strain maps provide a convenient way to examine the heterogeneity in strain through the thickness of the samples. Strain values produced by FUS compression were generally small (<2%), and the general shape of the curves mirrored the deformation data. HA-doped agarose gels (Fig. 7A) exhibited relatively uniform strain within the sample with complete recovery, consistent with results from other forms of compressive testing [53, 54]. Collagen constructs (Fig. 7B) showed relatively uniform strain levels through the construct, with a characteristic viscoelastic response [55]. Fibrin constructs (Fig. 7C) showed a similar profile, but exhibited significant variation in strain magnitude between segments. Significantly larger strains were observed at the top bottom surfaces of the fibrin constructs, compared to the interior. Cell-seeded collagen constructs (Fig. 7D) produced a profile that showed viscoelastic response, but which was distinct from the acellular constructs. In particular, cell-seeded constructs showed higher spatial variation through their thickness, and a slower relaxation response.
Figure 7.
Segment strain color maps (left column) and graphs of segment strain (center column) and bulk strain (right column) for (A) HA-doped agarose gel, (B) HA-doped collagen constructs (2 mg/mL), (C) HA-doped fibrin construct (2 mg/mL) , and (D) cell-seeded collagen construct (day 1). Best viewed in color.
Characteristic Parameters derived from FUS-induced Strains in Hydrogel Constructs
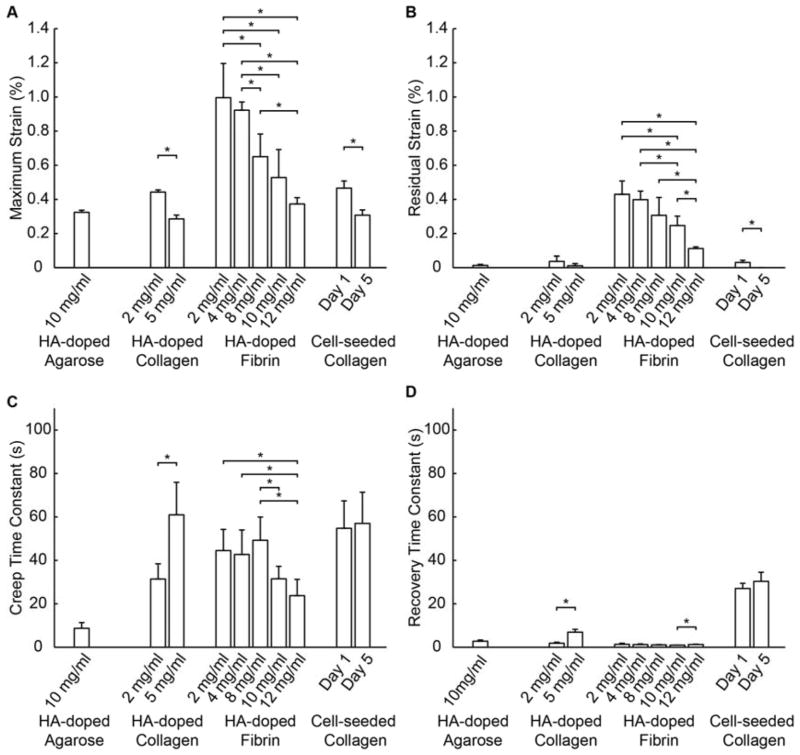
To provide a practical means for rapid quantification of the FUS-induced strain without assuming a model for the material, the maximum strain, residual strain, and creep and recovery time constants were determined from the bulk strain data for each of the samples types (Fig. 8). The maximum strain (Fig. 8A) was both material- and concentration-dependent. At the same concentration, fibrin constructs exhibited significantly higher maximum strains (indicative of lower stiffness) than the other materials. Higher protein concentrations resulted in lower maximum strains (indicative of higher material stiffness), and the effect of concentration was observable in all materials. The cell-seeded constructs had higher effective collagen concentrations due to volume compaction over time, and consequently the day 5 cellular constructs exhibited a lower maximum strain than the day 1 cellular constructs. These constructs did not contain HA and therefore their increased stiffness is a result of the increased protein and cell concentration caused by hydrogel compaction. The compaction of collagen gels via cell-mediated remodeling is a well-established phenomenon that results in an effectively more concentrated protein matrix [56, 57].
Figure 8.
Characteristic parameters of hydrogel constructs (n=4 per construct type). (A) Maximum strain, (B) Residual strain, (C) Creep time constant, and (D) Recovery time constant.
The minimal residual strains detected in the HA-agarose gels and the HA- and cell-seeded collagen constructs (Fig. 8B) indicate that these constructs achieved essentially complete recovery with minimal permanent deformation after the FUS was applied. In contrast, fibrin constructs exhibited comparatively larger residual strains, reflecting the more plastic nature of these constructs that results in more permanent deformation. The degree of residual strain was also dependent on fibrin concentration, with generally decreased residual strain in hydrogels with higher fibrin concentrations. These results are consistent with those obtained from unconfined compression test on synthetic hydrogels with varying water content [14].
The creep and recovery time constants (Fig. 8C, 8D) represent the dynamics of the deformation and relaxation processes. The more elastic HA-doped agarose gels exhibited low creep and recovery time constants, indicating a more rapid material response. HA-collagen and HA-fibrin materials showed markedly higher creep time constants. While higher collagen concentration increased the time constants, there was no clear protein concentration-dependence in the HA-fibrin constructs. The cell-seeded collagen constructs exhibited notably higher creep and relaxation time constants, reflective of the slower dynamics of deformation and relaxation in these constructs. In particular, the cellular constructs became stiffer and had altered time-depended deformation as they developed from day 1 to day 5, similar to reported results from in vivo studies [58, 59].
Viscoelastic Properties of Hydrogel Constructs using Model Fitting
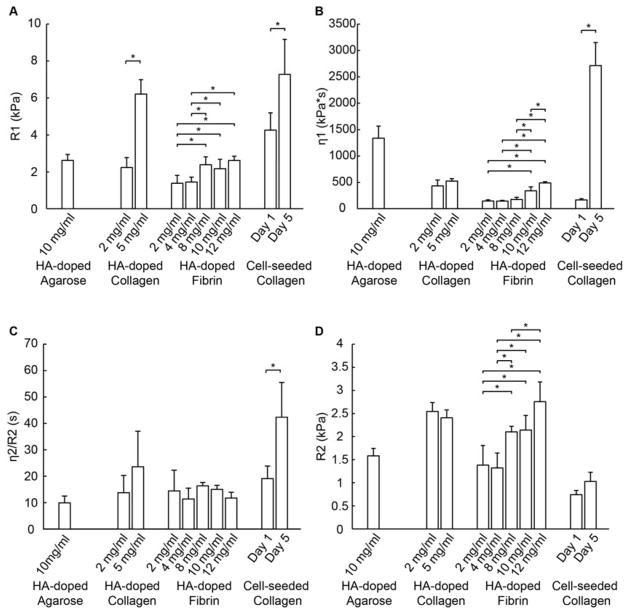
To assess the averaged properties of constructs within an ARF cylinder, we fit the measured bulk strain data using Burger’s model to obtain the elastic and viscoelastic parameters for each of the constructs types (Fig. 9). The spring constant for the Maxwell element, R1, represents the initial elastic response of the material, and is directly related to material stiffness. The R1 values (Fig. 9A) agreed in general with the trends observed in the maximum strain data (Fig. 8A), though they showed an inverse pattern since increased stiffness leads to decreased strain. Collagen at 5.0 mg/ml was stiffer than at 2.0 mg/ml, and cellular constructs were stiffer at day 5 then at day 1. There was again a general increase in stiffness with increasing protein concentration in both collagen and fibrin constructs, consistent with reported observations that hydrogels with lower water content or higher protein concentration exhibit higher stiffness [58, 60].
Figure 9.
Burger’s model parameters for hydrogel constructs generated by fitting of the bulk creep curves (n=4 per construct type). (A) R1, (B) η1, (C) η2/R2, and (D) R2.
The viscous damping parameter in the Maxwell element, η1 (Fig. 9B), represents the unrecoverable strain response and the long term creep behavior of the material. This value was lowest in fibrin constructs, indicating an increased propensity to creep over time, and exhibited a concentration dependence. The agarose constructs exhibited a relatively large η1, reflecting their more elastic nature. This parameter was markedly elevated in the day 5 cellular constructs, suggesting decreased viscoelastic behavior, presumably due to the large increase in collagen protein concentration due to volume compaction and other changes during construct development.
The viscoelastic time constant, η2 / R1 (Fig. 9C) reflects the magnitude and duration of the transient region of the creep curve. This parameter was similar among the acellular constructs tested, though the Day 5 cellular collagen constructs exhibited an increase relative to other constructs. This parameter reflects a slower creep response, and again suggests a significant effect of construct development on the viscoelastic behavior of cellular constructs. The cellular constructs also had a lower value of the modulus related to retarded elasticity, R2 (Fig. 9D), which is inversely related to the magnitude of the strain response in the transient region.
The Burger’s parameters generated for different types of constructs reflected the different viscoelastic characteristics of the materials and, in the case of cellular constructs, their development over time. These parameters reveal the effects of construct composition (type and concentration of protein, presence of cells, changes over time) on their mechanical properties and behavior, and therefore provide a useful tool in comparing materials and developing constructs. Notably, these parameters can be obtained non-invasively and at high resolution using DUE. The Burger’s model parameters obtained from the relaxation portion of the creep curve were also calculated (Fig. S2), and generally mirrored the values obtained from the creep deformation curve. Mechanical parameters obtained using DUE can also be combined with compositional information, for example as obtained by multispectral ultrasound imaging [41, 45], to elucidate structure-function relationships in engineered tissues.
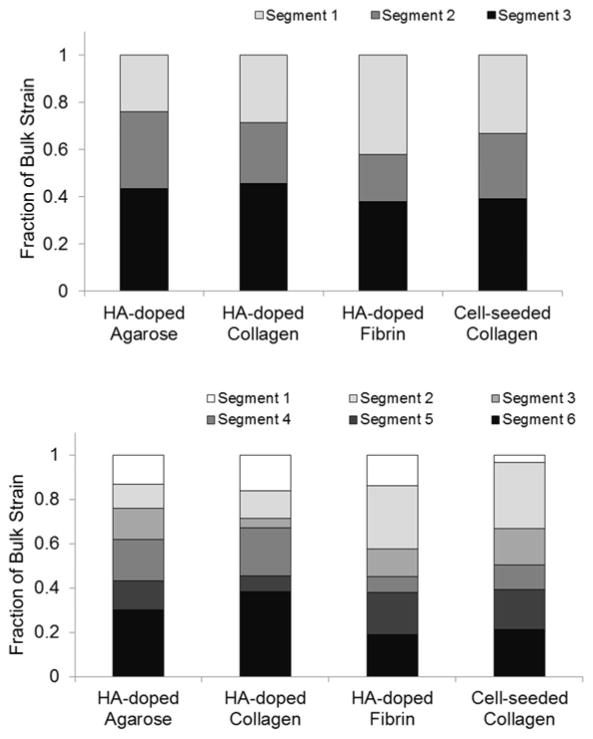
An important capability of the DUE technique is the ability to virtually section samples and thereby to examine local mechanical properties at a very small scale non-invasively. This type of analysis can also reveal inhomogeneity in samples at high resolution. The displacement and strain maps and curves presented in Figs. 6 and 7 show spatial variation along the depth direction, and provide a rapid and easily accessible way to show the pattern of internal strains. The amount of variability between segments at different depths depended on the construct type and could be generally represented by the ratio of the segment strain to the bulk strain. Figure 10 shows an analysis of segment strains and the fraction of the total bulk strain which each segment contributes. These data show that there is heterogeneity in strain through the construct, and that the amount of variation depended on the construct type. Agarose gels exhibited more uniform strain that increased regularly through the thickness of the sample as would be the expected effect of a body force, compared to the collagen and fibrin constructs, which exhibited more random variations. In addition the degree of variation depended on the number of segments used in the analysis. Use of three segments (Fig. 10A) resulted in relatively uniform segment strains, while use of six segments (Fig. 10B) revealed increased heterogeneity at smaller scales.
Figure 10.
Fraction of the total bulk strain contributed by each segment, when analyzed as A) three segments, or B) six segments.
The ability to analyze sub-surface sections of the material non-invasively is a useful feature when characterizing the structure of a biomaterials and its mechanical effect on cells. Previously reported efforts have used conventional shear rheometry to measure the viscoelastic properties of collagen gels fabricated under different temperatures [61]. The bulk shear properties were correlated with the microscale morphology of the collagen fibers as determined by confocal microscopy, but no direct microscale mechanical measurements were made. Another previous study applied “active microrheology” by optically oscillating silica microbeads (2 μm in diameter) within a fibrin matrix [62]. The oscillatory deflection of the surrounding matrix was used to determine the storage and loss moduli of the material, similar to macroscale dynamic mechanical analysis. However, the degree of microbead deflection was only around 60 nm, and therefore the technique may be better described as “nanorheology”. In contrast, the DUE technique we report achieved and imaged deformation from 5,000–25,000 nm (5–25 μm), which is more clearly on the microscale. In agreement with the present study, the active microrheology experiments showed that protein hydrogels exhibit microscale heterogeneity.
CONCLUSIONS
This study demonstrates the feasibility of applying DUE to the non-invasive characterization of both the averaged bulk and segmented local viscoelastic properties of hydrogel constructs. Application of a constant acoustic radiation force using DUE can be used to perform a creep test on small or large samples, and the resulting curves reflect the viscoelastic characteristics of the materials. In addition, DUE can be used to image the samples and determine their volume, morphology, and acoustic parameters. Testing of HA-doped hydrogels showed the effects of material type and concentration on the viscoelastic mechanical properties, as well as the effects of cell-seeding as constructs developed over time. Importantly, examination of local mechanical properties showed spatial variation that reflected microscale heterogeneity within the constructs. These findings suggest that DUE is a flexible tool that can be used to investigate microscale properties of hydrogel materials over time. The technique may also be extended to examine other material properties, and to characterization of tissues in vivo. Therefore DUE may provide an important enabling tool for investigating fundamental mechanisms of mechanobiology and facilitating progress in tissue engineering.
Supplementary Material
Schematic of Burger’s model of viscoelastic solids.
Burger’s model parameters for hydrogel constructs generated by fitting of the bulk recovery curves (n=4 per construct type). (A) R1, (B) η1, and (C) η2/R2.
Acknowledgments
Research reported in this publication was supported in part by the National Institute of Arthritis and Musculoskeletal and Skin Diseases of the National Institutes of Health under award numbers R21AR064041 (to CXD and JPS) and R01AR062636 (to JPS). The content is solely the responsibility of the authors and does not necessarily represent the official views of the National Institutes of Health. The authors also thank Dr. Yi-Sing Hsiao for her valuable assistance during the development of techniques used in this study.
Footnotes
Publisher's Disclaimer: This is a PDF file of an unedited manuscript that has been accepted for publication. As a service to our customers we are providing this early version of the manuscript. The manuscript will undergo copyediting, typesetting, and review of the resulting proof before it is published in its final citable form. Please note that during the production process errors may be discovered which could affect the content, and all legal disclaimers that apply to the journal pertain.
References
- 1.Discher DE, Janmey P, Wang YL. Tissue cells feel and respond to the stiffness of their substrate. Science. 2005;310(5751):1139–43. doi: 10.1126/science.1116995. [DOI] [PubMed] [Google Scholar]
- 2.Jaalouk DE, Lammerding J. Mechanotransduction gone awry. Nat Rev Mol Cell Biol. 2009;10(1):63–73. doi: 10.1038/nrm2597. [DOI] [PMC free article] [PubMed] [Google Scholar]
- 3.Vogel V, Sheetz M. Local force and geometry sensing regulate cell functions. Nat Rev Mol Cell Biol. 2006;7(4):265–75. doi: 10.1038/nrm1890. [DOI] [PubMed] [Google Scholar]
- 4.Discher DE, Mooney DJ, Zandstra PW. Growth factors, matrices, and forces combine and control stem cells. Science. 2009;324(5935):1673–7. doi: 10.1126/science.1171643. [DOI] [PMC free article] [PubMed] [Google Scholar]
- 5.Drury JL, Mooney DJ. Hydrogels for tissue engineering: scaffold design variables and applications. Biomaterials. 2003;24(24):4337–4351. doi: 10.1016/s0142-9612(03)00340-5. [DOI] [PubMed] [Google Scholar]
- 6.Anseth KS, Bowman CN, Brannon-Peppas L. Mechanical properties of hydrogels and their experimental determination. Biomaterials. 1996;17(17):1647–57. doi: 10.1016/0142-9612(96)87644-7. [DOI] [PubMed] [Google Scholar]
- 7.Eaglstein WH, Falanga V. Tissue engineering and the development of Apligraf(R), a human skin equivalent. Clinical Therapeutics. 1997;19(5):894–905. doi: 10.1016/s0149-2918(97)80043-4. [DOI] [PubMed] [Google Scholar]
- 8.Minami Y, Sugihara H, Oono S. Reconstruction of Cornea in 3-Dimensional Collagen Gel Matrix Culture. Investigative Ophthalmology & Visual Science. 1993;34(7):2316–2324. [PubMed] [Google Scholar]
- 9.Vijayasekaran S, et al. Cell viability and inflammatory response in hydrogel sponges implanted in the rabbit cornea. Biomaterials. 1998;19(24):2255–2267. doi: 10.1016/s0142-9612(98)00128-8. [DOI] [PubMed] [Google Scholar]
- 10.Kisiday J, et al. Self-assembling peptide hydrogel fosters chondrocyte extracellular matrix production and cell division: Implications for cartilage tissue repair. Proceedings of the National Academy of Sciences of the United States of America; 2002; pp. 9996–10001. [DOI] [PMC free article] [PubMed] [Google Scholar]
- 11.Yamaoka H, et al. Cartilage tissue engineering chondrocytes embedded in using human auricular different hydrogel materials. Journal of Biomedical Materials Research Part A. 2006;78A(1):1–11. doi: 10.1002/jbm.a.30655. [DOI] [PubMed] [Google Scholar]
- 12.Weinberg CB, Bell E. A Blood-Vessel Model Constructed from Collagen and Cultured Vascular Cells. Science. 1986;231(4736):397–400. doi: 10.1126/science.2934816. [DOI] [PubMed] [Google Scholar]
- 13.Chaudhuri O, et al. Hydrogels with tunable stress relaxation regulate stem cell fate and activity. Nat Mater. 2015 doi: 10.1038/nmat4489. [DOI] [PMC free article] [PubMed] [Google Scholar]
- 14.Stammen JA, et al. Mechanical properties of a novel PVA hydrogel in shear and unconfined compression. Biomaterials. 2001;22(8):799–806. doi: 10.1016/s0142-9612(00)00242-8. [DOI] [PubMed] [Google Scholar]
- 15.Chaudhuri O, et al. Substrate stress relaxation regulates cell spreading. Nat Commun. 2015;6:6364. doi: 10.1038/ncomms7365. [DOI] [PMC free article] [PubMed] [Google Scholar]
- 16.Ahearne M, et al. Characterizing the viscoelastic properties of thin hydrogel-based constructs for tissue engineering applications. Journal of the Royal Society Interface. 2005;2(5):455–463. doi: 10.1098/rsif.2005.0065. [DOI] [PMC free article] [PubMed] [Google Scholar]
- 17.Rowe SL, Lee S, Stegemann JP. Influence of thrombin concentration on the mechanical and morphological properties of cell-seeded fibrin hydrogels. Acta Biomater. 2007;3(1):59–67. doi: 10.1016/j.actbio.2006.08.006. [DOI] [PMC free article] [PubMed] [Google Scholar]
- 18.Svensson A, et al. Bacterial cellulose as a potential scaffold for tissue engineering of cartilage. Biomaterials. 2005;26(4):419–431. doi: 10.1016/j.biomaterials.2004.02.049. [DOI] [PubMed] [Google Scholar]
- 19.Ulrich TA, et al. Probing cellular mechanobiology in three-dimensional culture with collagen-agarose matrices. Biomaterials. 2010;31(7):1875–84. doi: 10.1016/j.biomaterials.2009.10.047. [DOI] [PubMed] [Google Scholar]
- 20.Rao RR, et al. Matrix composition regulates three-dimensional network formation by endothelial cells and mesenchymal stem cells in collagen/fibrin materials. Angiogenesis. 2012;15(2):253–264. doi: 10.1007/s10456-012-9257-1. [DOI] [PMC free article] [PubMed] [Google Scholar]
- 21.Merino JC, Martin B, Pastor JM. Mechanical Indentation Tester Designed to Control and Measure in Real-Time the Microhardness Process. Measurement Science & Technology. 1991;2(8):740–743. [Google Scholar]
- 22.Mirshams RA, Pothapragada RM. Correlation of nanoindentation measurements of nickel made using geometrically different indenter tips. Acta Materialia. 2006;54(4):1123–1134. [Google Scholar]
- 23.Tsakalakos T. The Bulge Test - a Comparison of Theory and Experiment for Isotropic and Anisotropic Films. Thin Solid Films. 1981;75(3):293–305. [Google Scholar]
- 24.Liu KK, Ju BF. A novel technique for mechanical characterization of thin elastomeric membrane. Journal of Physics D-Applied Physics. 2001;34(15):L91–L94. [Google Scholar]
- 25.Drury JL, Dennis RG, Mooney DJ. The tensile properties of alginate hydrogels. Biomaterials. 2004;25(16):3187–3199. doi: 10.1016/j.biomaterials.2003.10.002. [DOI] [PubMed] [Google Scholar]
- 26.Deng CX, Hong X, Stegemann JP. Ultrasound imaging techniques for spatiotemporal characterization of composition, microstructure, and mechanical properties in tissue engineering. Tissue Eng Part B Rev. 2016 doi: 10.1089/ten.teb.2015.0453. [DOI] [PMC free article] [PubMed] [Google Scholar]
- 27.Ophir J, et al. Elastography - a Quantitative Method for Imaging the Elasticity of Biological Tissues. Ultrasonic Imaging. 1991;13(2):111–134. doi: 10.1177/016173469101300201. [DOI] [PubMed] [Google Scholar]
- 28.Garra BS, et al. Elastography of breast lesions: Initial clinical results. Radiology. 1997;202(1):79–86. doi: 10.1148/radiology.202.1.8988195. [DOI] [PubMed] [Google Scholar]
- 29.Hoeks APG, et al. Non-invasive measurement of mechanical properties of arteries in health and disease. Proceedings of the Institution of Mechanical Engineers Part H-Journal of Engineering in Medicine; 1999; pp. 195–202. [DOI] [PubMed] [Google Scholar]
- 30.Levinson SF, Shinagawa M, Sato T. Sonoelastic Determination of Human Skeletal-Muscle Elasticity. Journal of Biomechanics. 1995;28(10):1145–1154. doi: 10.1016/0021-9290(94)00173-2. [DOI] [PubMed] [Google Scholar]
- 31.Lubinski MA, Emelianov SY, O'Donnell M. Speckle tracking methods for ultrasonic elasticity imaging using short-time correlation. IEEE Trans Ultrason Ferroelectr Freq Control. 1999;46(1):82–96. doi: 10.1109/58.741427. [DOI] [PubMed] [Google Scholar]
- 32.Bilgen M, Insana MF. Deformation models and correlation analysis in elastography. J Acoust Soc Am. 1996;99(5):3212–24. doi: 10.1121/1.414865. [DOI] [PubMed] [Google Scholar]
- 33.Nightingale K, et al. Acoustic radiation force impulse imaging: In vivo demonstration of clinical feasibility. Ultrasound in Medicine and Biology. 2002;28(2):227–235. doi: 10.1016/s0301-5629(01)00499-9. [DOI] [PubMed] [Google Scholar]
- 34.Nightingale KR, et al. On the feasibility of remote palpation using acoustic radiation force. J Acoust Soc Am. 2001;110(1):625–34. doi: 10.1121/1.1378344. [DOI] [PubMed] [Google Scholar]
- 35.Doherty JR, et al. Acoustic radiation force elasticity imaging in diagnostic ultrasound. IEEE Trans Ultrason Ferroelectr Freq Control. 2013;60(4):685–701. doi: 10.1109/TUFFC.2013.2617. [DOI] [PMC free article] [PubMed] [Google Scholar]
- 36.Lizzi FL, et al. Radiation-force technique to monitor lesions during ultrasonic therapy. Ultrasound Med Biol. 2003;29(11):1593–605. doi: 10.1016/s0301-5629(03)01052-4. [DOI] [PubMed] [Google Scholar]
- 37.Walker WF, Fernandez FJ, Negron LA. A method of imaging viscoelastic parameters with acoustic radiation force. Phys Med Biol. 2000;45(6):1437–47. doi: 10.1088/0031-9155/45/6/303. [DOI] [PubMed] [Google Scholar]
- 38.Viola F, et al. A novel ultrasound-based method to evaluate hemostatic function of whole blood. Clin Chim Acta. 2010;411(1–2):106–13. doi: 10.1016/j.cca.2009.10.017. [DOI] [PMC free article] [PubMed] [Google Scholar]
- 39.Viola F, et al. Sonorheometry: a noncontact method for the dynamic assessment of thrombosis. Ann Biomed Eng. 2004;32(5):696–705. doi: 10.1023/b:abme.0000030235.72255.df. [DOI] [PubMed] [Google Scholar]
- 40.Mauldin FW, Jr, et al. Monitored steady-state excitation and recovery (MSSER) radiation force imaging using viscoelastic models. IEEE Trans Ultrason Ferroelectr Freq Control. 2008;55(7):1597–610. doi: 10.1109/TUFFC.2008.836. [DOI] [PubMed] [Google Scholar]
- 41.Rao RR, et al. Effects of hydroxyapatite on endothelial network formation in collagen/fibrin composite hydrogels in vitro and in vivo. Acta Biomater. 2014;10(7):3091–7. doi: 10.1016/j.actbio.2014.03.010. [DOI] [PMC free article] [PubMed] [Google Scholar]
- 42.Gudur MS, et al. Noninvasive quantification of in vitro osteoblastic differentiation in 3D engineered tissue constructs using spectral ultrasound imaging. PLoS One. 2014;9(1):e85749. doi: 10.1371/journal.pone.0085749. [DOI] [PMC free article] [PubMed] [Google Scholar]
- 43.Cummings CL, et al. Properties of engineered vascular constructs made from collagen, fibrin, and collagen-fibrin mixtures. Biomaterials. 2004;25(17):3699–706. doi: 10.1016/j.biomaterials.2003.10.073. [DOI] [PubMed] [Google Scholar]
- 44.Nyborg W. Acoustic Streaming. In: Mason W, editor. Physical Streaming. Academic; New York: 1965. pp. 265–331. [Google Scholar]
- 45.Torr GR. The Acoustic Radiation Force. American Journal of Physics. 1984;52(5):402–408. [Google Scholar]
- 46.Gudur M, et al. Noninvasive, quantitative, spatiotemporal characterization of mineralization in three-dimensional collagen hydrogels using high-resolution spectral ultrasound imaging. Tissue Eng Part C Methods. 2012;18(12):935–46. doi: 10.1089/ten.tec.2012.0180. [DOI] [PMC free article] [PubMed] [Google Scholar]
- 47.Chen H, Shi H, Varghese T. Improvement of elastographic displacement estimation using a two-step cross-correlation method. Ultrasound Med Biol. 2007;33(1):48–56. doi: 10.1016/j.ultrasmedbio.2006.07.022. [DOI] [PMC free article] [PubMed] [Google Scholar]
- 48.Berglund JD, Nerem RM, Sambanis A. Viscoelastic testing methodologies for tissue engineered blood vessels. J Biomech Eng. 2005;127(7):1176–84. doi: 10.1115/1.2073487. [DOI] [PubMed] [Google Scholar]
- 49.Rowe SL, Stegemann JP. Microstructure and mechanics of collagen-fibrin matrices polymerized using ancrod snake venom enzyme. J Biomech Eng. 2009;131(6):061012. doi: 10.1115/1.3128673. [DOI] [PMC free article] [PubMed] [Google Scholar]
- 50.Dey AB, PK Parameter estimation of four-parameter viscoelastic Burger model by inverse analysis: case studies of four oil-refineries. Interaction and Multiscale Mechanics. 2012;5(3):211–228. [Google Scholar]
- 51.Hsiao YS, Kumon RE, Deng CX. Characterization of Lesion Formation and Bubble Activities during High Intensity Focused Ultrasound Ablation using Temperature-Derived Parameters. Infrared Phys Technol. 2013;60:108–117. doi: 10.1016/j.infrared.2013.04.002. [DOI] [PMC free article] [PubMed] [Google Scholar]
- 52.Ye XY, et al. Structure and infrared emissivity of collagen/SiO2 composite. Applied Surface Science. 2008;254(18):5975–5980. [Google Scholar]
- 53.Ahearne M, et al. Characterizing the viscoelastic properties of thin hydrogel-based constructs for tissue engineering applications. J R Soc Interface. 2005;2(5):455–63. doi: 10.1098/rsif.2005.0065. [DOI] [PMC free article] [PubMed] [Google Scholar]
- 54.Normand V, et al. New insight into agarose gel mechanical properties. Biomacromolecules. 2000;1(4):730–738. doi: 10.1021/bm005583j. [DOI] [PubMed] [Google Scholar]
- 55.Chandran PL, V, Barocas H. Microstructural mechanics of collagen gels in confined compression: Poroelasticity, viscoelasticity, and collapse. Journal of Biomechanical Engineering-Transactions of the Asme. 2004;126(2):152–166. doi: 10.1115/1.1688774. [DOI] [PubMed] [Google Scholar]
- 56.Hong H, McCullough CM, Stegemann JP. The role of ERK signaling in protein hydrogel remodeling by vascular smooth muscle cells. Biomaterials. 2007;28(26):3824–33. doi: 10.1016/j.biomaterials.2007.05.007. [DOI] [PMC free article] [PubMed] [Google Scholar]
- 57.Mohammadi H, Janmey PA, McCulloch CA. Lateral boundary mechanosensing by adherent cells in a collagen gel system. Biomaterials. 2014;35(4):1138–49. doi: 10.1016/j.biomaterials.2013.10.059. [DOI] [PubMed] [Google Scholar]
- 58.Bryant SJ, Anseth KS. Hydrogel properties influence ECM production by chondrocytes photoencapsulated in poly(ethylene glycol) hydrogels. J Biomed Mater Res. 2002;59(1):63–72. doi: 10.1002/jbm.1217. [DOI] [PubMed] [Google Scholar]
- 59.Weinand C, et al. Comparison of hydrogels in the in vivo formation of tissue- engineered bone using mesenchymal stem cells and beta-tricalcium phosphate. Tissue Eng. 2007;13(4):757–65. doi: 10.1089/ten.2006.0083. [DOI] [PubMed] [Google Scholar]
- 60.Hunter CJ, Mouw JK, Levenston ME. Dynamic compression of chondrocyte- seeded fibrin gels: effects on matrix accumulation and mechanical stiffness. Osteoarthritis Cartilage. 2004;12(2):117–30. doi: 10.1016/j.joca.2003.08.009. [DOI] [PubMed] [Google Scholar]
- 61.Kotlarchyk MA, et al. Concentration independent modulation of local micromechanics in a fibrin gel. PLoS One. 2011;6(5):e20201. doi: 10.1371/journal.pone.0020201. [DOI] [PMC free article] [PubMed] [Google Scholar]
- 62.Raub CB, et al. Noninvasive assessment of collagen gel microstructure and mechanics using multiphoton microscopy. Biophys J. 2007;92(6):2212–22. doi: 10.1529/biophysj.106.097998. [DOI] [PMC free article] [PubMed] [Google Scholar]
Associated Data
This section collects any data citations, data availability statements, or supplementary materials included in this article.
Supplementary Materials
Schematic of Burger’s model of viscoelastic solids.
Burger’s model parameters for hydrogel constructs generated by fitting of the bulk recovery curves (n=4 per construct type). (A) R1, (B) η1, and (C) η2/R2.


