

Abstract
Background
The role of CD4+ regulatory T cells (Tregs) and their subsets during HIV infection is controversial. Cryopreserved peripheral blood mononuclear cells (PBMC) are an important source for assessing number and function of Tregs. However, it is unknown if PBMC isolation and cryopreservation affect the expression of CD120b and CD39, markers that identify specific subsets of Tregs.
Methods
HIV-uninfected (HIV−) and -infected (HIV+) men were randomly selected from the Multicenter AIDS Cohort Study (MACS). Percentages of CD120b+ and CD39+ Tregs measured by flow cytometry in whole blood and in corresponding fresh and cryopreserved PBMC were compared.
Results
Percentages of CD120b+ Tregs were significantly lower in a) fresh PBMC relative to whole blood, and b) freshly thawed frozen PBMC relative to fresh PBMC when the recovery of viable cryopreserved cells was low. When present, low expression of CD120b in frozen PBMC was reversible by 4 hours of in vitro culture. In contrast, expression of CD39 on Tregs was not affected by isolation and/or cryopreservation of PBMC, or by relative recovery of cryopreserved PBMC. These findings were unaffected by the HIV status of the donor.
Conclusion
The data suggest that percentages of CD120b+ Tregs and CD39+ Tregs can be validly measured in either whole blood or PBMC (fresh and frozen) in HIV− and HIV+ men. However, for measurement of CD120b+ Tregs one type of sample should be used consistently within a given study, and thawed frozen cells may require in vitro culture if recovery of viable cells is low.
Keywords: CD4+ regulatory T cells, CD120b, CD39, PBMC cryopreservation, HIV
1. Introduction
Regulatory T cells (Tregs) are an important subset of CD4 T cells that suppress immune responses. Tregs are divided into different phenotypic and functional subsets (Simonetta and Bourgeois, 2013). For example, expression of CD120b (TNF-α receptor II) identifies a subset with high suppressive function (Mercer et al., 2010,Minigo et al., 2009,Chen et al., 2010). Another subset is defined by expression of CD39, an ecto-nucleoside triphosphate diphosphohydrolase, which facilitates the production of adenosine that inhibits T cell proliferation (Deaglio et al., 2007) and production of IL-2 (Jenabian et al., 2013). Tregs have been implicated in the control of immune responses under many physiological and pathological conditions, such as autoimmune diseases, allograft tolerance, tumors, and infectious diseases (Sakaguchi et al., 2010) including, controversially, HIV infection (Imamichi and Lane, 2012).
Cryopreservation of peripheral blood mononuclear cells (PBMC) is critical for assessing the phenotype and function of these cells in retrospective studies. Several studies have examined percentages of total Tregs before and after cryopreservation, with some showing lower percentages after cryopreservation (Elkord, 2009,Sattui et al., 2012) and others finding no difference (Van Hemelen et al., 2010,Venet et al., 2010,Shete et al., 2013). To our knowledge no study has evaluated the effect of cryopreservation on different subsets of Tregs. In addition, the process of PBMC isolation may also affect the expression of surface markers (Lundahl et al., 1995). Therefore, this study was undertaken to explore the effect of both PBMC isolation and cryopreservation on the expression of CD120b and CD39 on Tregs. PBMC from both HIV-uninfected (HIV−) and -infected (HIV+) men were analyzed, to test for an effect of HIV infection.
2. Materials and Methods
2.1. Study Population
HIV− and HIV+ men were randomly selected from the Baltimore-Washington, DC center of the Multicenter AIDS Cohort Study (MACS), an ongoing prospective cohort study of the natural and treated history of HIV-1 infection in men who have sex with men in Baltimore-Washington DC, Chicago, Los Angeles, and Pittsburgh (Detels et al., 2012). Briefly, the men are seen semi-annually, with each study visit including a medical and behavioral history; collection of blood for laboratory studies including HIV serology and (for HIV+ men) plasma HIV RNA concentration (viral load); and storage of serum, plasma and PBMC, as described (Detels et al., 2012). CD4 T cell counts were measured by flow cytometry as described (Hultin et al., 2007), and viral load was determined by the Roche ultrasensitive assay, which is sensitive to 50 copies/mL (Roche Diagnostics, Nutley, NJ). Because analyses of CD120b and CD39 expression were done in two separate time periods, two groups of subjects were studied.
2.2. Isolation, cryopreservation and thawing procedures of PBMC
PBMC were isolated by Ficoll Paque® density gradient centrifugation (GE Healthcare, Pittsburgh, PA) from sodium heparinized venous blood. Isolated cells were stained with trypan blue and counted using a Vi-CELL Series Cell Viability Analyzer (Beckman Coulter, Indianapolis IN). Cryopreservation and thawing were performed as described (Aziz et al., 2013). 5 or 10 ×106 PBMC from each sample were suspended to 1×10⁷/ml in cold freezing solution (RPMI-1640 (Life Technologies, Carlsbad, CA) containing 50% fetal bovine serum (FBS; HyClone Laboratories, South Logan, UT) and 10% dimethyl sulfoxide (DMSO; Sigma-Aldrich Corporation, St. Louis, MO), and added to 2-ml cryogenic vials (Thermo Fisher Scientific Inc, Waltham, MA). The vials were kept overnight at −80°C in a freezing container (Nalgene Mr. Frosty, Thermo Fisher Scientific Inc), and transferred the next day to −140°C where they were stored for 1–12 months before analysis. On the day of analysis, frozen PBMC were thawed by immediate immersion of the cryogenic vials in a 37°C water bath with gentle agitation. The contents of the vial were then transferred to a 50-ml conical centrifuge tube and 10 ml of RPMI-1640 containing 50% FBS was added to the tube in a dropwise fashion. After centrifugation at 300g for 10 minutes, cells were washed once with RPMI-1640 containing 10% FBS, stained with trypan blue, and counted using a hemocytometer. The average recovery, calculated as the number of viable cells obtained from a vial divided by the number of PBMC initially frozen in the vial, was 80% (±20% Standard deviation (SD)).
2.3. Immunophenotypic analyses and cell culture
Monoclonal antibodies (mAbs) were obtained from BD Biosciences, San Jose, CA, unless otherwise noted. To evaluate two phenotypes which identify Tregs, cells (i.e., whole blood and corresponding fresh and frozen PBMC) were stained with anti-CD127–fluorescein isothiocyanate (FITC), anti-CD25–allophycocyanin (APC), and anti-CD4–allophycocyanin-Hilite®7 (APC-H7) for the phenotype CD4+CD25+CD127low/−, and anti-FoxP3–Alexa Fluor® 488, anti-CD25–APC, and anti-CD4−Pacific Blue® for the phenotype CD4+CD25+FoxP3+. To examine CD120b expression on Tregs (CD4+CD25+CD127low/−), cells were stained with anti-CD127–FITC, anti-CD120b−phycoerythrin (PE), anti-CD25–APC, and anti-CD4–APC-H7. To examine CD39 expression on Tregs, cells were stained with anti-CD25–PE, anti-CD4–Alexa Fluor® 700, anti-CD39–PE–cyanine 7 (Cy7), and anti-CD127–PE-Cy5 (eBiosciences, San Diego, CA). For whole blood, after incubating with the mAbs on ice in the dark for 30 minutes, erythrocytes were lysed by FACS Lysing solution (BD Biosciences) for 10 minutes at room temperature, and cells were washed twice with PBS and resuspended in FACS Lysing solution. The staining of PBMC, whether fresh or frozen, followed the same steps, except that no lysing step was performed. Intracellular staining of FoxP3 was performed according to the manufacturer’s instructions, using the Human FoxP3 Buffer Set (BD Biosciences). Briefly, the cells were fixed for 10 minutes, followed by permeabilization for 30 minutes at room temperature in the dark. Then they were stained with anti-FoxP3 antibody on ice in the dark for 30 minutes. To examine the possibility of masking of CD120b immunostaining by TNF-α on freshly thawed PBMC, cells from HIV− donors were stained with higher than usual concentrations of anti-CD120b−PE (2 μg and 4 μg of antibody, versus 1 μg, per 1×10⁶ cells).
For in vitro culture of PBMC, cells were resuspended at 1×10⁶/ml in RPMI-1640 containing 20% FBS and 1% antibiotic antimycotic solution (Sigma-Aldrich), plated at 1×10⁶ /well in a 24-well plate (Sigma-Aldrich), and cultured at 37°C in 5% CO2 in a humidified incubator. Changes in expression of CD120b and CD120a on frozen and fresh cells were monitored at 4, 8, 12, and 24 hours of culture. At each time point 1×10⁶ cells were harvested, washed, and stained for immunophenotypic analysis with anti-CD3−Pacific Blue®, anti-CD120a−FITC, anti-CD120b−PE, anti-CD25-APC, and anti-CD4−APC-H7. Fresh PBMC were cultured in parallel with the frozen PBMC, harvested at the same time points, and stained with the same antibody panel for analysis.
For all flow cytometry analyses, fluorescence-minus-one controls (Roederer, 2002) were applied to set appropriate analysis thresholds. Fluorescence data were acquired on a FACSCanto II flow cytometer (BD Biosciences). Data were analyzed using FACSDiva software version 6.13 (BD Biosciences).
2.4. Statistical analysis
The non-parametric Wilcoxon signed rank test was used to compare paired data generated from whole blood, fresh PBMC, or frozen PBMC. The significance of differences between HIV− and HIV+ men was tested by Fisher’s exact test for categorical variables and the Mann-Whitney U test for continuous variables. Bivariate correlations among whole blood, fresh PBMC, or frozen PBMC were estimated using the Pearson correlation coefficient if the variable was distributed normally or log-normally, and the non-parametric Spearman correlation coefficient if not. To analyze the effect of HIV status on these correlations, HIV status was included in multiple linear regression analyses as an indicator variable. Analyses were performed with Stata version 11.2 (StataCorp, College Station, TX). A p value of <0.05 was considered statistically significant.
3. Results
3.1. Subject characteristics
Tregs were studied for CD120b expression in 48 men (25 HIV−, 23 HIV+) and for CD39 expression in 34 men (21 HIV− and 13 HIV+). The characteristics of these donors are shown in Table 1a and 1b, respectively. Among the first group (Table 1a), HIV− and HIV+ men were similar in age, but HIV+ men were more likely to be of black ethnicity. Among the second group (Table 1b), HIV− men and HIV+ men were similar in ethnicity, but HIV+ men were younger. For both groups, most of the HIV+ men were virologically suppressed by antiretroviral therapy (ART).
Table 1.
Demographic and Laboratory Characteristics of Study population
| a. For analysis of CD120b | HIV-Negative | HIV-Positive | Total |
|---|---|---|---|
| N | 25 | 23 | 48 |
| Ethnicity | |||
| Black | 4 (16)*† | 16 (70) | 20 (42) |
| White | 21 (84) | 7 (30) | 28 (58) |
| Age, median (IQR)** | 58 (52–62) | 57 (50–61) | 57 (51–62) |
| CD4 cell count (/μL), median (IQR) | 985 (796–1117)† | 630 (536–941) | 812 (604–1076) |
| Antiretroviral treatment (ART) | 19 (82) | ||
| Undetectable viral load (<50 copies/ml) | 17 (74) | ||
| b. For analysis of CD39
| |||
| N | 21 | 13 | 34 |
| Ethnicity | |||
| Black | 4 (19) | 5 (38) | 9 (26) |
| White | 17 (81) | 8 (62) | 25 (74) |
| Age, median (IQR)** | 59 (56–69)† | 54 (44–59) | 59 (53–66) |
| CD4 cell count (/μL), median (IQR) | 1269 (1119–1417)† | 974 (797–1287) | 1214 (974–1413) |
| Antiretroviral treatment (ART) | 12 (92) | ||
| Undetectable viral load (<50 copies/ml) | 10 (77) | ||
Data are number (percentages) unless otherwise indicated.
IQR= interquartile range (25th–75th percentiles)
p<.05 for comparison between HIV− and HIV+ men.
3.2. Evaluation of Tregs assessed by the phenotypes CD4+CD25+CD127low/− and CD4+CD25+FoxP3+
The percentages of Tregs among CD4 T cells were measured by two phenotypes, CD4+CD25+CD127low/− and CD4+CD25+FoxP3+. By the phenotype CD4+CD25+CD127low/−, these percentages were similar in whole blood and fresh PBMC for all but 2 donors (1 HIV− and 1 HIV+) (Fig. 1a). The same was true for the phenotype CD4+CD25+FoxP3+ (Fig. 1b). Percentages of Tregs were significantly higher in HIV+ men than in HIV− men, as reported (reviewed in (Moreno-Fernandez et al., 2012)). Comparing fresh and frozen PBMC, percentages of Tregs assessed by the phenotype CD4+CD25+CD127low/− were similar (Fig 1c), but results for the phenotype CD4+CD25+FoxP3+ were significantly lower in frozen PBMC (Fig 1d).
Fig.1.
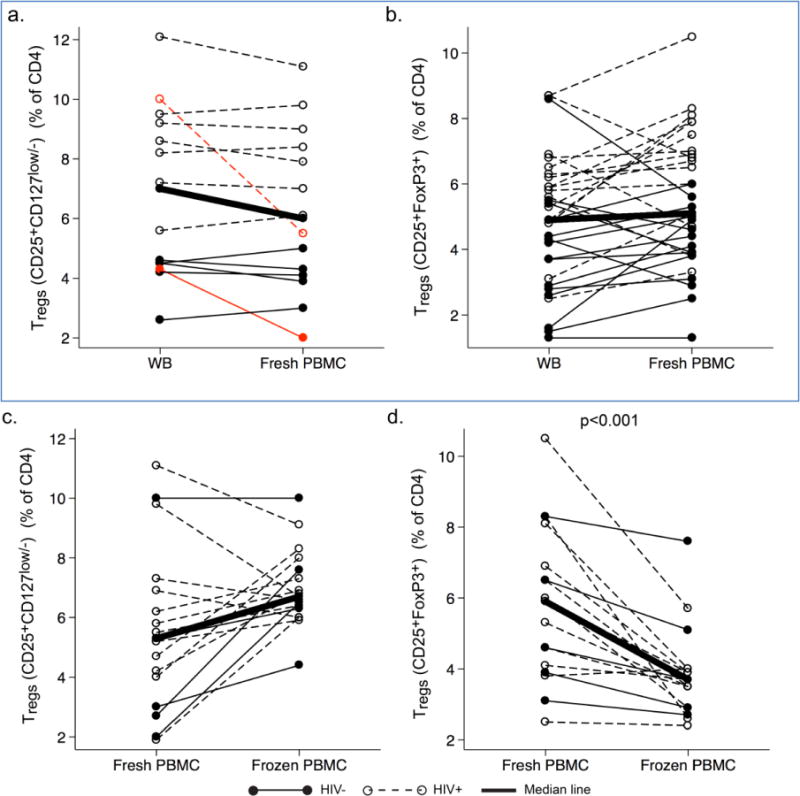
Percentages of Tregs among CD4 T cells measured by the phenotypes CD4+CD25+CD127low/− and CD4+CD25+FoxP3+, in paired whole blood (WB), fresh PBMC, and frozen PBMC from HIV− and HIV+ men. Data were obtained from HIV− men (filled circles, solid lines) and HIV+ men (open circles, dotted lines), using the phenotypes CD4+CD25+CD127low/− (a and c) and CD4+CD25+FoxP3+ (b and d), for WB and fresh PBMC (a and b) and fresh and frozen PBMC (c and d). The thick lines connect the median percentages in each group. The percentages in WB and fresh PBMC were similar when measured by CD4+CD25+CD127low/− (a) or CD4+CD25+FoxP3+ (b), although two men (marked in red) showed greater changes than the others (a). The percentages were significantly lower in frozen PBMC than in fresh PBMC in d but not in c.
The percentages of Tregs measured by two phenotypes were highly correlated in whole blood (r=0.73, p<0.01), fresh PBMC (p=0.59, p<0.001), and frozen PBMC (r=0.79, p<0.001), for both HIV− and HIV+ donors (supplemental table 1). Therefore, the phenotype CD4+CD25+CD127low/− was valid for identifying Tregs in this study.
3.3. Comparison of CD120b expression on Tregs in whole blood and fresh PBMC
Percentages of CD120b+ Tregs (CD4+CD25+CD127low/−CD120b+) among CD4+ lymphocytes (Fig. 2a) and CD120b+ among Tregs (Fig. 2b) were significantly lower in fresh PBMC than in whole blood. The significance of these differences was not affected by removing the three HIV+ men who had the greatest differences in Fig. 2a, or by HIV status (data not shown). Percentages of CD120b+ Tregs in paired whole blood and fresh PBMC were highly correlated, and the slope of the relationship was not affected by HIV status (Fig. 2c). A significant correlation between whole blood and fresh PBMC was also observed in percentages of CD120b+ cells among Tregs (r=0.57 (Spearman’s correlation coefficient), p=0.03).
Fig. 2.
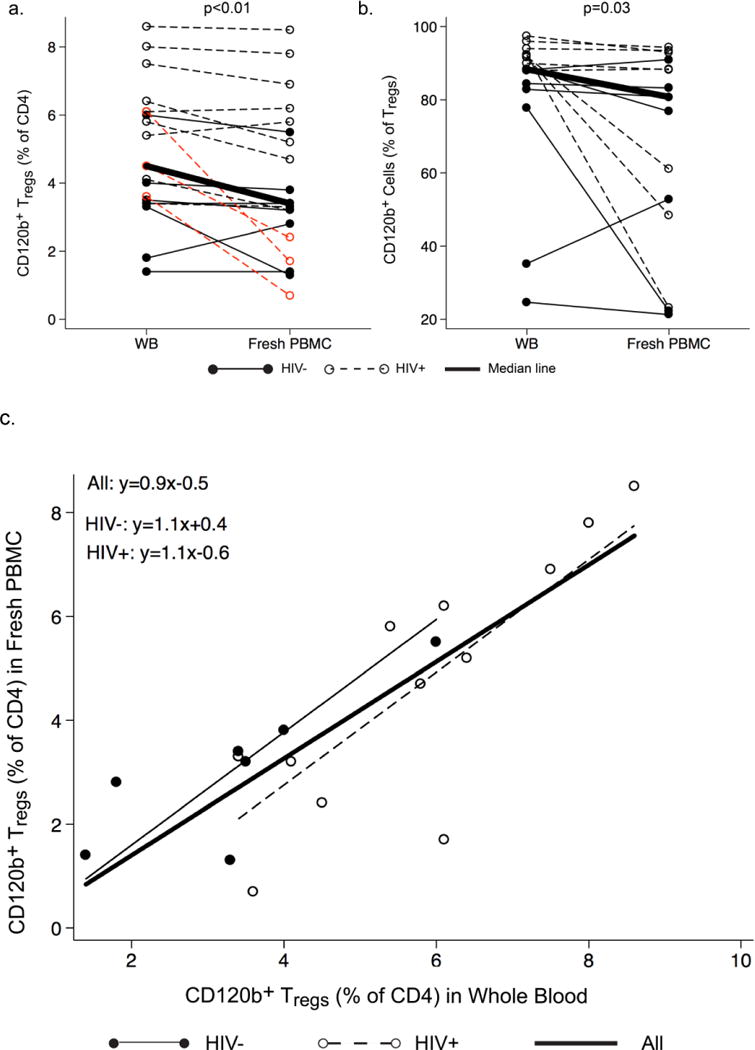
Expression of CD120b on Tregs in paired whole blood and fresh PBMC from HIV− and HIV+ men. a and b. Comparisons of percentages of (a) CD120b+ Tregs among CD4+ lymphocytes and (b) CD120b+ cells among Tregs in whole blood (WB) and fresh PBMC for HIV− men (filled circles, solid lines) and HIV+ men (open circles, dotted lines). The thick line connects the median percentages in WB and fresh PBMC. Differences between WB and fresh PBMC were significant in both a and b. In b, removing the three HIV+ men who had the greatest differences (marked in red) did not affect the significance of this difference. c. Correlations of percentages of CD120b+ Tregs in WB and fresh PBMC by HIV status. The line for the entire group is derived from an unadjusted least-squares regression and shows a strong correlation (r=0.82, p<0.0001). The lines shown for HIV− men and HIV+ men are derived from multiple linear regression analysis adjusting for HIV status. In the equations, y represents the percentage of CD120b+ Tregs in fresh PBMC, and x the percentage of CD120b+ Tregs in WB. The slopes of these did not differ significantly.
3.4. CD120b expression in freshly thawed and cultured thawed cells
Surprisingly, in the initial series of experiments on HIV− men, we found that the percentage of CD120b+ cells among Tregs was very low in freshly thawed PBMC, whether Tregs were defined as CD25+CD127−/low (Fig. 3a) or simply as CD25+ (Fig. 3b, time 0) CD4 T cells. This low percentage was not increased by staining with higher concentrations of anti-CD120b mAbs (data not shown), suggesting that it was probably not due to masking by free ligand. However, after overnight culture of the thawed cells CD120b expression was increased (Fig. 3a), taking place within 4 hours (Fig. 3b) and reaching approximately the level seen on fresh Tregs (Supplemental Fig. 1a). Percentages of Tregs that were CD120b+ among freshly thawed cells and thawed cells cultured for 4 hours were highly correlated (r=0.73, p<0.01 among CD4+CD25+ T cells). The same was true for thawed CD8+ T cells, which also lost then regained CD120b when thawed and cultured (r=0.67, p=0.02). CD120b expression was low on non-Treg CD4+ T cells at all times, whether fresh or frozen (data not shown).
Fig. 3.
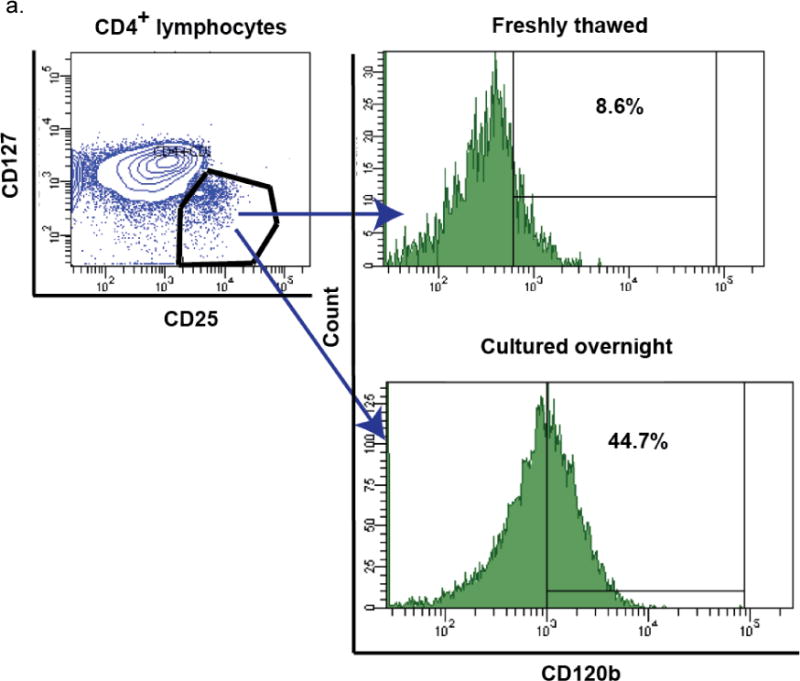
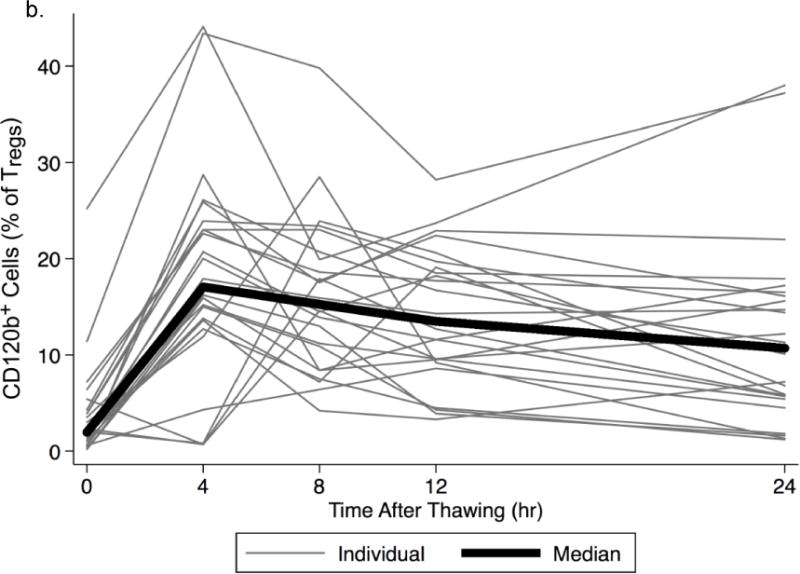
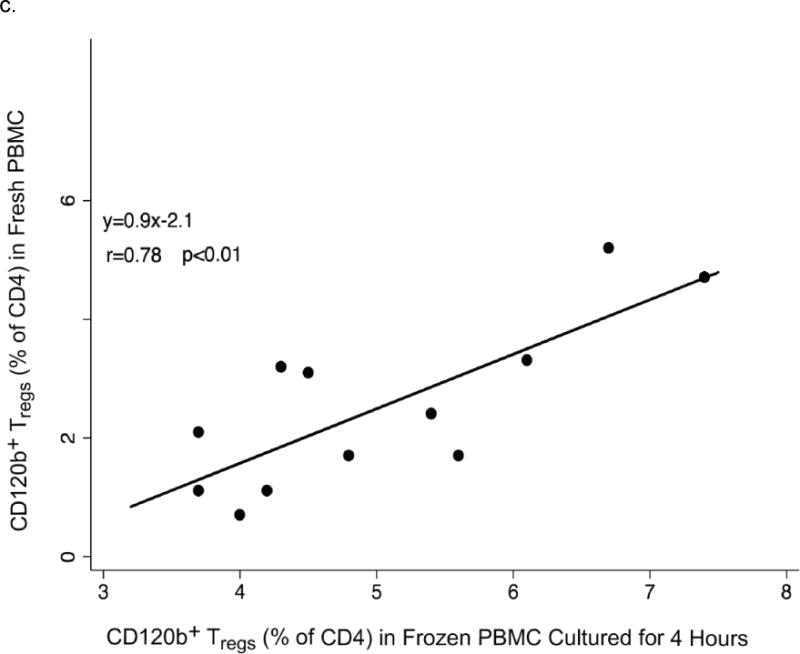
Changes of CD120b expression in frozen PBMC during in vitro culture. a. The gating strategy is shown beginning at the upper left: after identifying CD4+ T cells, CD25+CD127low/− cells were identified, and the changes of CD120b expression on these cells were measured (right panels). Expression of CD120b on Tregs thawed freshly and those cultured overnight from a representative donor are shown and were lower immediately after thawing (top right, 8.6%) than after overnight culture (bottom, 44.7%). b. Percentages of CD120b+ cells among Tregs (CD4+CD25+) in frozen PBMC from HIV− men. Percentages were low immediately after thawing (0 hours), rose substantially after 4 hours of culture, and then remained nearly constant throughout 24 hours. Lines indicate data obtained from the same donor. The bold line indicates the median percentages at the time points. c. Relationships of percentages of CD120b+ Tregs (CD4+CD25+CD127low/−CD120b+) in fresh and frozen PBMC from HIV+ men. The frozen PBMC were cultured for 4 hours. The line represents the least-squares regression line of the data. In the equation, y represents the percentage of CD120b+ Tregs in fresh PBMC, and x represents the percentage of CD120b+ Tregs in frozen PBMC.
In a second series of experiments analyzing CD120b expression on thawed PBMC from an additional 12 HIV+ men, recovery of viable cells was generally good (more than 70%) and CD120b expression was similar on fresh and freshly thawed cells (0 hours in supplemental Fig. 1b). However, the percentages of CD120b+ Tregs (CD4+CD25+CD127low/−CD120b+) in fresh and freshly thawed PBMC were poorly correlated (r=0.35, p>0.05). This correlation improved dramatically after 4 hours of culture (r=0.78, p<0.01, Fig. 3c). In these experiments, the 4 HIV− donors studied also demonstrated high recoveries and had no decline in CD120b expression at any time after thawing (supplemental Fig. 2b).
Overall, the percentages of total Tregs did not change during in vitro culture (data not shown). For both Tregs (CD4+CD25+) and CD8+ T cells, the percentage of CD120b+ cells in freshly thawed PBMC was significantly correlated with the recovery of viable cells from the frozen PBMC (r=0.42, p<0.01 for CD4+CD25+ T cells, and r=0.49, p=0.02 for CD8+ T cells). Culture of fresh PBMC did not affect CD120b expression (data not shown). In contrast to CD120b, expression of CD120a (TNF-α receptor I) was not affected by freezing, thawing, or in vitro culture (Supplemental fig. 3). During in vitro culture, the cell number and viability did not change significantly (data not shown).
3.5. CD39 expression on Tregs in whole blood, fresh PBMC, and frozen PBMC
The effect of cryopreservation on the expression of CD39 was evaluated in 34 men (21 HIV− and 13 HIV+), including 21 (10 HIV− and 11 HIV+) in whom the expression of CD39 in whole blood was also tested.
Percentages of CD39+ cells among Tregs were generally similar among whole blood, fresh PBMC, and frozen PBMC, although 2 HIV+ men showed very large differences between whole blood and fresh PBMC (Fig. 4a). Percentages of CD39+ cells in whole blood and fresh PBMC were highly correlated (Fig. 4b, r=0.67, p<0.001), as were those in fresh and frozen PBMC (Fig. 4c, r=0.82, p<0.001), even after adjusting for HIV status.
Fig. 4.
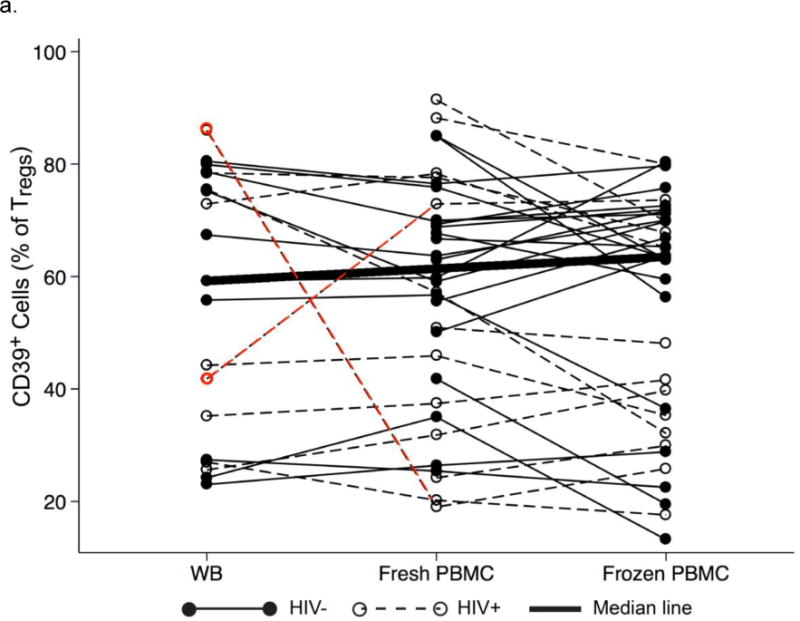

Percentages of CD39+ cells among Tregs in WB, fresh and frozen PBMC. a. Comparisons of percentages CD39+ cells among Tregs obtained from HIV− men (filled circles, solid lines) and HIV+ men (hollow circles, dotted lines). The bold line connects the median percentages in the three types of samples. The red dots and lines denote two HIV+ men who had large differences between WB and fresh PBMC (−67% and +31%, respectively). b and c. Relationships of CD39 expression in WB, fresh PBMC, and frozen PBMC. Percentages of CD39+ cells among Tregs in fresh PBMC (vertical axes) are shown in relation to the corresponding percentages in WB (b) and frozen PBMC (c). The lines for all men (i.e., combined HIV− and HIV+ men) were derived from unadjusted least-squares regressions and show strong correlations (r=0.67, p<0.001 for b; r=0.82, p<0.001 for c). The separate lines for HIV− men and HIV+ men were derived from multiple linear regression analysis adjusting for HIV status. In the equations, y represents the percentage of CD120b+ Tregs in fresh PBMC, and x the percentage of CD39+ Tregs in WB (b) or frozen PBMC (c). In both cases, the slopes of these lines did not differ significantly by HIV status.
4. Discussion
This study assessed the effect of isolation and cryopreservation of PBMC on the expression of two markers of subsets of Tregs, CD120b and CD39, in HIV− and HIV+ men. Isolation of PBMC by density gradient centrifugation resulted in a decrease of CD120b expression on Tregs, and freezing-thawing of PBMC did the same when recovery of frozen cells was low, i.e., less than about 70%. When it occurred, the low expression of CD120b in frozen PBMC could be reversed after 4 hours of in vitro culture. Percentages of CD120b+ Tregs in whole blood and fresh PBMC were highly correlated, as were those in fresh PBMC and frozen PBMC that were cultured for 4 hours, in both HIV− and HIV+ men. Thus, for the purpose of group comparisons, percentages of CD120b+ Tregs can probably be measured validly using either whole blood or PBMC (fresh and frozen) in HIV− and HIV+ men, provided that one type of sample is used consistently.
The mechanism of reduced expression of CD120b on frozen T cells in samples with lower recovery of viable cells is unclear. Selective loss of CD120b+ cells is unlikely, because CD120b expression recovered rapidly in culture without apparent changes of cell numbers. A more likely possibility is stress-induced loss of CD120b, for two reasons. First, CD120b expression immediately after thawing was significantly and positively correlated with the recovery of viable cells. Second, factors leading to a low recovery may induce stress in the recovered viable cells; cellular stress has been reported to induce activation of the metalloprotease TNF-alpha converting enzyme (TACE) (Kuper et al., 2007) which in turn may lead to shedding of CD120b from Tregs (van Mierlo et al., 2008). However, TACE was also reported to be responsible for the shedding of CD120a (TNF-α receptor I) (Deng et al., 2015), and we found that the expression of CD120a on Tregs was not affected by freezing and thawing. Therefore, further studies are needed to explore the mechanisms of reduced levels of CD120b on freshly thawed Tregs.
In contrast to CD120b, CD39 expression on Tregs was similar and highly correlated among whole blood, fresh PBMC, and frozen PBMC. This was true regardless of HIV status. Therefore, CD39+ Tregs can be validly measured in all three types of sample. However, the finding that two HIV+ men had very different CD39 expression in whole blood and PBMC raises the caution that PBMC isolation may affect CD39 expression in some HIV+ people, a phenomenon that requires further study.
Percentages of total Tregs, measured by the phenotype CD4+CD25+CD127low/−, were not affected by cryopreservation of PBMC, which agreed with previous reports (Van Hemelen et al., 2010,Venet et al., 2010,Shete et al., 2013). These percentages were also well correlated with those measured by the phenotype CD4+CD25+FoxP3+, regardless of types of the samples and HIV status. These results suggest that the phenotype CD4+CD25+CD127low/− can be used to identify Tregs in cryopreserved HIV+ samples.
Most of the HIV+ men studied here were treated with ART and had very low or undetectable plasma HIV RNA concentrations. Therefore the results in this study may not apply to HIV+ people who are not virologically suppressed, or to women. However, the results should apply to studies in HIV− men or men living with long-term suppressed HIV infection, for example on the role of Tregs in chronic diseases (Tan et al., 2014), inflammation (Phetsouphanh et al., 2015), and aging (Zhang et al., 2015).
5. Conclusion
In the present study, we validated the measurement of the percentages of CD120b+ Tregs and CD39+ Tregs in either whole blood or PBMC (fresh and frozen) in HIV− and HIV+ men. Because CD120b expression on Tregs was reduced by isolation and cryopreservation when the recovery of cryopreserved cells was low, one type of sample should be used consistently within a given study, and thawed frozen cells may require in vitro culture if recovery of viable cells is low.
Supplementary Material
Acknowledgments
We thank Paula Mercado and Ginnie Khoza for isolation and cryopreservation of PBMC; the Baltimore-Washington, DC site of the MACS: the Study to Help the AIDS Research Effort (SHARE) office and clinic staff for conduct of the SHARE study; and SHARE participants for their long-term participation in the SHARE study. This work was supported by the National Institutes of Health (U01 AI35042).
Contributor Information
Weiying Zhang, Email: wzhang32@jhu.edu.
Tricia L. Nilles, Email: tnilles1@jhu.edu.
Jacquett R. Johnson, Email: jjohns20@jhu.edu.
References
- Aziz N, Margolick JB, Detels R, Rinaldo CR, Phair J, Jamieson BD, Butch AW. Value of a quality assessment program in optimizing cryopreservation of peripheral blood mononuclear cells in a multicenter study. Clin Vaccine Immunol. 2013;20:590–595. doi: 10.1128/CVI.00693-12. [DOI] [PMC free article] [PubMed] [Google Scholar]
- Chen X, Subleski JJ, Hamano R, Howard OM, Wiltrout RH, Oppenheim JJ. Co-expression of TNFR2 and CD25 identifies more of the functional CD4+FOXP3+ regulatory T cells in human peripheral blood. Eur J Immunol. 2010;40:1099–1106. doi: 10.1002/eji.200940022. [DOI] [PMC free article] [PubMed] [Google Scholar]
- Deaglio S, Dwyer KM, Gao W, Friedman D, Usheva A, Erat A, Chen JF, Enjyoji K, Linden J, Oukka M, Kuchroo VK, Strom TB, Robson SC. Adenosine generation catalyzed by CD39 and CD73 expressed on regulatory T cells mediates immune suppression. J Exp Med. 2007;204:1257–1265. doi: 10.1084/jem.20062512. [DOI] [PMC free article] [PubMed] [Google Scholar]
- Deng M, Loughran PA, Zhang L, Scott MJ, Billiar TR. Shedding of the tumor necrosis factor (TNF) receptor from the surface of hepatocytes during sepsis limits inflammation through cGMP signaling. Sci Signal. 2015;8:ra11. doi: 10.1126/scisignal.2005548. [DOI] [PMC free article] [PubMed] [Google Scholar]
- Detels R, Jacobson L, Margolick J, Martinez-Maza O, Munoz A, Phair J, Rinaldo C, Wolinsky S. The multicenter AIDS Cohort Study, 1983 to …. Public Health. 2012;126:196–198. doi: 10.1016/j.puhe.2011.11.013. [DOI] [PMC free article] [PubMed] [Google Scholar]
- Elkord E. Frequency of human T regulatory cells in peripheral blood is significantly reduced by cryopreservation. J Immunol Methods. 2009;347:87–90. doi: 10.1016/j.jim.2009.06.001. [DOI] [PubMed] [Google Scholar]
- Hultin LE, Menendez FA, Hultin PM, Jamieson BD, O’Gorman MR, Borowski L, Matud JL, Denny TN, Margolick JB. Assessing immunophenotyping performance: proficiency-validation for adopting improved flow cytometry methods. Cytometry B Clin Cytom. 2007;72:249–255. doi: 10.1002/cyto.b.20176. [DOI] [PMC free article] [PubMed] [Google Scholar]
- Imamichi H, Lane HC. Regulatory T Cells in HIV-1 infection: the Good, the bad, and the ugly. J Infect Dis. 2012;205:1479–1482. doi: 10.1093/infdis/jis238. [DOI] [PubMed] [Google Scholar]
- Jenabian MA, Seddiki N, Yatim A, Carriere M, Hulin A, Younas M, Ghadimi E, Kok A, Routy JP, Tremblay A, Sevigny J, Lelievre JD, Levy Y. Regulatory T cells negatively affect IL-2 production of effector T cells through CD39/adenosine pathway in HIV infection. PLoS Pathog. 2013;9:e1003319. doi: 10.1371/journal.ppat.1003319. [DOI] [PMC free article] [PubMed] [Google Scholar]
- Kuper C, Bartels H, Fraek ML, Beck FX, Neuhofer W. Ectodomain shedding of pro-TGF-alpha is required for COX-2 induction and cell survival in renal medullary cells exposed to osmotic stress. Am J Physiol Cell Physiol. 2007;293:C1971–82. doi: 10.1152/ajpcell.00404.2007. [DOI] [PubMed] [Google Scholar]
- Lundahl J, Hallden G, Hallgren M, Skold CM, Hed J. Altered expression of CD11b/CD18 and CD62L on human monocytes after cell preparation procedures. J Immunol Methods. 1995;180:93–100. doi: 10.1016/0022-1759(94)00303-e. [DOI] [PubMed] [Google Scholar]
- Mercer F, Kozhaya L, Unutmaz D. Expression and function of TNF and IL-1 receptors on human regulatory T cells. PLoS One. 2010;5:e8639. doi: 10.1371/journal.pone.0008639. [DOI] [PMC free article] [PubMed] [Google Scholar]
- Minigo G, Woodberry T, Piera KA, Salwati E, Tjitra E, Kenangalem E, Price RN, Engwerda CR, Anstey NM, Plebanski M. Parasite-dependent expansion of TNF receptor II-positive regulatory T cells with enhanced suppressive activity in adults with severe malaria. PLoS Pathog. 2009;5:e1000402. doi: 10.1371/journal.ppat.1000402. [DOI] [PMC free article] [PubMed] [Google Scholar]
- Moreno-Fernandez ME, Presicce P, Chougnet CA. Homeostasis and function of regulatory T cells in HIV/SIV infection. J Virol. 2012;86:10262–10269. doi: 10.1128/JVI.00993-12. [DOI] [PMC free article] [PubMed] [Google Scholar]
- Phetsouphanh C, Xu Y, Zaunders J. CD4 T Cells mediate both positive and negative regulation of the immune response to HIV infection: complex role of T follicular helper cells and regulatory T cells in pathogenesis. Front Immunol. 2015;5:681. doi: 10.3389/fimmu.2014.00681. [DOI] [PMC free article] [PubMed] [Google Scholar]
- Roederer M. Compensation in flow cytometry. Curr Protoc Cytom. 2002 doi: 10.1002/0471142956.cy0114s22. Chapter 1, Unit 1.14. [DOI] [PubMed] [Google Scholar]
- Sakaguchi S, Miyara M, Costantino CM, Hafler DA. FOXP3(+) regulatory T cells in the human immune system. Nat Rev Immunol. 2010;10:490–500. doi: 10.1038/nri2785. [DOI] [PubMed] [Google Scholar]
- Sattui S, de la Flor C, Sanchez C, Lewis D, Lopez G, Rizo-Patron E, White AC, Jr, Montes M. Cryopreservation modulates the detection of regulatory T cell markers. Cytometry B Clin Cytom. 2012;82:54–58. doi: 10.1002/cyto.b.20621. [DOI] [PubMed] [Google Scholar]
- Shete A, Jayawant P, Thakar M, Kurle S, Singh DP, Paranjape RS. Differential modulation of phenotypic composition of HIV-infected and -uninfected PBMCs during cryopreservation. J Immunoass Immunoch. 2013;34:333–345. doi: 10.1080/15321819.2012.741087. [DOI] [PubMed] [Google Scholar]
- Simonetta F, Bourgeois C. CD4+FOXP3+ regulatory T cell subsets in human immunodeficiency virus (HIV) infection. Frontiers in Immunology. 2013;4:215. doi: 10.3389/fimmu.2013.00215. [DOI] [PMC free article] [PubMed] [Google Scholar]
- Tan DB, Fernandez S, Price P, French MA, Thompson PJ, Moodley YP. Impaired function of regulatory T-cells in patients with chronic obstructive pulmonary disease (COPD) Immunobiology. 2014;219:975–979. doi: 10.1016/j.imbio.2014.07.005. [DOI] [PubMed] [Google Scholar]
- Van Hemelen D, Oude Elberink JN, Heimweg J, van Oosterhout AJ, Nawijn MC. Cryopreservation does not alter the frequency of regulatory T cells in peripheral blood mononuclear cells. J Immunol Methods. 2010;353:138–140. doi: 10.1016/j.jim.2009.11.012. [DOI] [PubMed] [Google Scholar]
- van Mierlo GJ, Scherer HU, Hameetman M, Morgan ME, Flierman R, Huizinga TW, Toes RE. Cutting edge: TNFR-shedding by CD4+CD25+ regulatory T cells inhibits the induction of inflammatory mediators. J Immunol. 2008;180:2747–2751. doi: 10.4049/jimmunol.180.5.2747. [DOI] [PubMed] [Google Scholar]
- Venet F, Malcus C, Ferry T, Poitevin F, Monneret G. Percentage of regulatory T cells CD4+CD25+CD127- in HIV-infected patients is not reduced after cryopreservation. J Immunol Methods. 2010;357:55–58. doi: 10.1016/j.jim.2010.02.005. [DOI] [PubMed] [Google Scholar]
- Zhang W, Nilles TL, Johnson JR, Margolick JB. Regulatory T cells, frailty, and immune activation in men who have sex with men in the Multicenter AIDS Cohort Study. J Gerontol A Biol Sci Med Sci. 2015;70(12):1533–1541. doi: 10.1093/gerona/glv132. [DOI] [PMC free article] [PubMed] [Google Scholar]
Associated Data
This section collects any data citations, data availability statements, or supplementary materials included in this article.