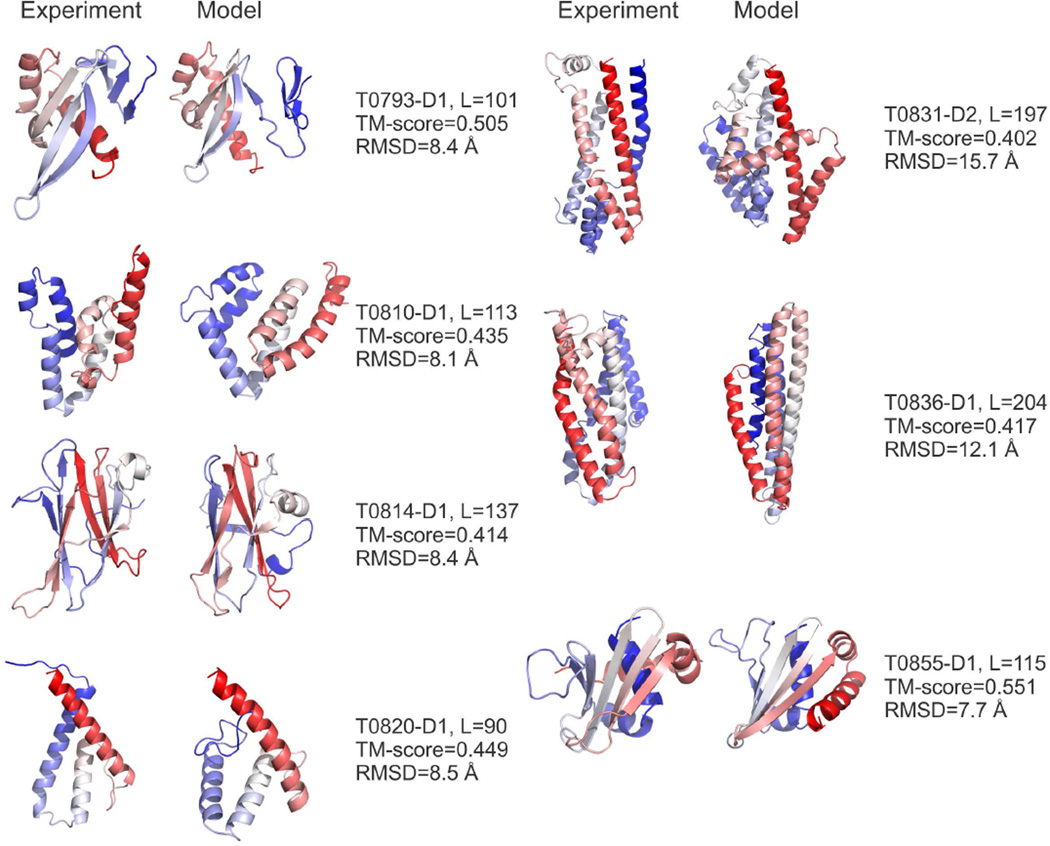
Figure 5.
The targets for which Zhang-Server generated models with a TM-score above 0.4, excluding T0837-D1 that is shown in Figure 3. Blue to red runs from the N- to C-terminals. The left cartoon of each panel shows the experimental structure and the right cartoon shows the predicted model. L is the length of the sequence having structure solved by X-ray, which is usually shorter than the length of the target sequence.

