Abstract
Neurons that signal the orientation of edges within the visual field have been widely studied in primary visual cortex. Much less is known about the mechanisms of orientation selectivity that arise earlier in the visual stream. Here we examine the synaptic and morphological properties of a subtype of orientation-selective ganglion cell in the rabbit retina. The receptive field has an excitatory ON center, flanked by excitatory OFF regions, a structure similar to simple cell receptive fields in primary visual cortex. Examination of the light-evoked postsynaptic currents in these ON-type orientation-selective ganglion cells (ON-OSGCs) reveals that synaptic input is mediated almost exclusively through the ON pathway. Orientation selectivity is generated by larger excitation for preferred relative to orthogonal stimuli, and conversely larger inhibition for orthogonal relative to preferred stimuli. Excitatory orientation selectivity arises in part from the morphology of the dendritic arbors. Blocking GABAA receptors reduces orientation selectivity of the inhibitory synaptic inputs and the spiking responses. Negative contrast stimuli in the flanking regions produce orientation-selective excitation in part by disinhibition of a tonic NMDA receptor-mediated input arising from ON bipolar cells. Comparison with earlier studies of OFF-type OSGCs indicates that diverse synaptic circuits have evolved in the retina to detect the orientation of edges in the visual input.
SIGNIFICANCE STATEMENT A core goal for visual neuroscientists is to understand how neural circuits at each stage of the visual system extract and encode features from the visual scene. This study documents a novel type of orientation-selective ganglion cell in the retina and shows that the receptive field structure is remarkably similar to that of simple cells in primary visual cortex. However, the data indicate that, unlike in the cortex, orientation selectivity in the retina depends on the activity of inhibitory interneurons. The results further reveal the physiological basis for feature detection in the visual system, elucidate the synaptic mechanisms that generate orientation selectivity at an early stage of visual processing, and illustrate a novel role for NMDA receptors in retinal processing.
Keywords: electrophysiology, neural circuit, NMDA receptors, receptive field, retinal ganglion cell, synaptic transmission
Introduction
The retina provides an ideal system to investigate how neuronal circuits perform specific computations because the outputs of the circuits are readily accessible and the inputs can be precisely defined. The output from the retina comprises the summed activity of the optic nerve fibers, which transmit parallel signals from ∼20–30 types of ganglion cell (Wässle, 2004; Taylor and Smith, 2011; Masland, 2012), each of which represents a discrete neural circuit that is presumably optimized to convey specific information (Gollisch and Meister, 2010). Some of these circuits extract sophisticated features from the visual input, such as the direction of motion, or the orientation of edges. This paper focuses on the synaptic mechanisms that enable a specific population of retinal ganglion cells to respond selectively to horizontally oriented edges. Determining how orientation is computed within the retina has particular appeal, as it provides an interesting counterpoint to the widely studied orientation-selective cells in primary visual cortex (V1) that have evolved to perform the same basic computation. In V1, orientation selectivity is driven by excitatory inputs from oriented arrays of concentric retinal receptive fields (RFs) (Hubel and Wiesel, 1962; Chapman and Stryker, 1992; Reid and Alonso, 1995; Priebe and Ferster, 2012). Inhibitory inputs to simple cells in V1 share the same orientation preference as the excitatory inputs and therefore do not contribute directly to generating orientation-selective signals (Monier et al., 2003). In contrast, we show here that orientation selectivity in the retina is dependent on the activity of orientation-selective GABAergic inhibitory interneurons.
Orientation selectivity has been reported at subcortical levels (Xu et al., 2002; Cheong et al., 2013; Piscopo et al., 2013; Scholl et al., 2013; Zhao et al., 2013) and has been proposed to arise in part from concentric, center-surround-type retinal ganglion cells that display orientation bias due to random asymmetries in the RFs (Levick and Thibos, 1980; Leventhal and Schall, 1983; Thibos and Levick, 1985; Passaglia et al., 2002). This paper is not concerned with orientation-biased cells but focuses on retinal ganglion cells that are optimized to detect the orientation of edges (Levick, 1967; Amthor et al., 1989; Bloomfield, 1994; He et al., 1998; Venkataramani and Taylor, 2010). In the absence of anatomical markers, the density and distribution of orientation-selective ganglion cells in the retina remain unknown. Multielectrode array recordings using random white-noise stimuli have been used to catalog retinal ganglion cell types by simultaneously sampling responses from large numbers of cells. This approach has provided information about the distribution and density of different ganglion cell types across the retina; however, OSGCs have been absent from such surveys of ganglion cells (Devries and Baylor, 1997; Anishchenko et al., 2010), possibly because they are weakly activated by typical white-noise stimuli. Here we have identified OSGCs using oriented light and dark bars as stimuli. We have made whole-cell recordings to characterize the synaptic inputs and to fill the cells with fluorescent dye to reveal the dendritic structure. The anatomical and physiological properties of the ON-type OSGCs described here are uniform, leading us to propose that these cells comprise a distinct functional type. Unlike the OFF-OSGCs described previously (Venkataramani and Taylor, 2010), the RFs of ON-type OSGCs contain ON- and OFF-oriented subfields, very much like orientation-selective simple cells in primary visual cortex. The excitatory OFF subfield arises from inversion of signals from the ON pathway, due to the activity of an intervening inhibitory amacrine cell that modulates tonic activation of NMDA receptors (NMDARs). The results reveal a novel role for NMDAR-mediated synaptic transmission in visual processing and provide further insight into the diverse neural circuits that have evolved within the visual system to compute the orientation of edges.
Materials and Methods
Retina preparation, morphology, and patch recording.
Experiments involving animals were performed in accord with National Institutes of Health guidelines, and the anesthesia and euthanasia protocols were approved by the Institutional Animal Care and Use Committee at Oregon Health and Science University. The procedure for isolating the retina and recording light responses has been previously described (Venkataramani and Taylor, 2010). Pigmented rabbits of either sex were dark-adapted for at least 1 h before isolating the retina. Rabbits were sedated by intramuscular injection of ketamine (50 mg/kg) and xylazine (10 mg/kg), followed ∼5–10 min later by injection of intravenous sodium pentobarbital to produce surgical level anesthesia. After removing the eyes, the animal was killed by intravenous overdose of sodium pentobarbital (40 mg/kg) followed by 2.5 ml of potassium chloride (3 m).
A piece of inferior retina was placed in the recording chamber, ganglion cell side up, and continuously perfused with Ames medium (34°C, pH 7.4; US Biologicals) at a rate of 4–5 ml/min. The retina was always oriented in the recording chamber such that a stimulus angle of 0° on the stimulus monitor was parallel to the visual streak.
Patch electrodes were pulled from borosilicate glass to a final resistance of 4–6 mΩ. For extracellular recording, the electrodes were filled with Ames medium. For whole-cell recordings, the electrodes contained the following: 125 mm Cs-methylsulfonate, 6 mm CsCl, 2 mm Mg-ATP, 1 mm Na-GTP, 1 mm EGTA, 10 mm Na-HEPES, 2.5 mm phosphocreatine disodium salt, and 3 mm QX-314-chloride. The solution was adjusted to pH 7.4 using CsOH for voltage-clamp recording. The chloride reversal potential was calculated to be −70 mV. Voltages were corrected for a calculated liquid junction potential of −10 mV. Current and voltage signals were filtered at 2 kHz (4 pole Bessel) and digitized with a sampling period of 100 μs. Further filtering was performed during subsequent data analysis.
Intracellular labeling.
The recorded cells were filled with Alexa-488 (1 mm in intracellular solution, AlexaFluor-488 hydrazide, Invitrogen, #A10438). The retina was fixed for 30 min with 4% PFA in 0.1 m phosphate buffer (PB), pH 7.4, and subsequently washed overnight in 0.1 m PBS, pH 7.4. The retina was incubated in blocking solution (10% normal horse serum, 1% Triton-100, 0.025% sodium azide in PBS) for 1 h, followed by 5–7 d incubation in PBS containing 3% normal horse serum, 1% Triton X-100, 0.2% sodium azide, and primary antibodies raised against choline acetyltransferase (goat-anti-ChAT, Millipore AB144P; Millipore, catalog #AB144P, 1:200) at room temperature. The retina was then washed in PBS overnight and subsequently incubated in PBS containing 3% normal horse serum, 0.025% sodium azide, and donkey anti-goat Alexa-594 (Jackson Immuno Research, 1:800) in a humidified container overnight at room temperature. The retina was washed in PBS overnight and mounted on glass slides and prepared for confocal imaging. Confocal micrographs were acquired on a Zeiss LSM 510 confocal microscope with 40× oil-immersion objective (NA 1.3). Images illustrating the dendritic morphology (see Fig. 3A) show a z-axis projection of several confocal sections through the retina. To obtain the level of dendritic stratification relative to the ChAT bands (see Fig. 3B), the images were acquired using a 60× oil-immersion objective (NA 1.42) with an additional 1–3× optical zoom. The contrast and brightness levels of the images were adjusted using ImageJ (Schneider et al., 2012). In some cases, extraneous fluorescence was removed using Adobe Photoshop, to increase the clarity of the filled cells. This was sometimes required near the soma, where some dye spread was occasionally observed.
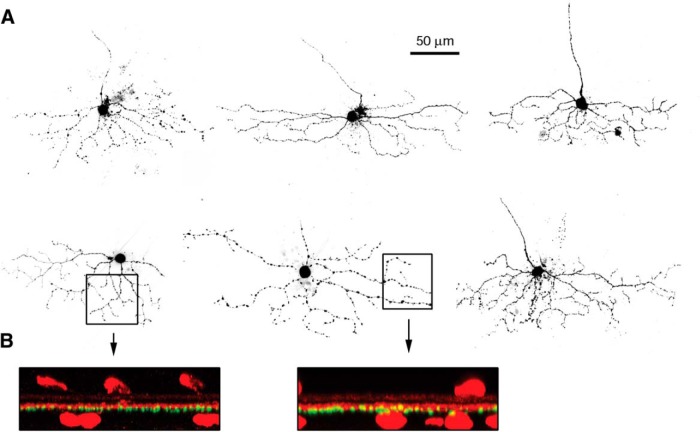
Figure 3.
Anatomical structure of ON-OSGCs. A, Fluorescence micrographs of 6 cells from which patch-clamp recordings were made. Note the elongation of the dendritic arbors parallel to the horizontal dimension. B, Vertical projections of 2 cells showing the narrow stratification of the OSGC dendrites. Red fluorescence shows ChAT staining as a reference for the stratification level. ON-OSGC dendrites (green) were narrowly stratified just below the inner ChAT band, within sublamina 4.
Light stimulation and recording.
Light stimuli were generated on a CRT computer monitor at a refresh rate of 60 Hz. The monitor screen was projected onto the retina through a 20×, 0.95 NA water-immersion objective (Olympus) and brought into focus on the photoreceptor outer segments. The percentage stimulus contrast was defined as C = 100(Stimulus − Background)/Background and was set to either 80% or −80%, as indicated. The background light intensity was 150 μW/m2 at the photoreceptor outer segments, which for the green phosphor of the stimulus monitor corresponds to 400 photons/μm2/s. Assuming a collecting area for rabbits rods of ∼1 μm2 and half-maximal saturation for a light-adapted mammalian rod of ∼100 photons/μm2/s (Venkataramani and Taylor, 2010), the background intensity was well above the scotopic range. The standard stimulus was a bar 1 mm long × 100 μm wide, centered on the RF of the cell, and oriented either parallel with or orthogonal to the visual streak. Peristimulus time histograms of spiking responses (PSTHs) were constructed from 20 to 40 trials under each condition. The PSTHs from individual cells were averaged.
Data analysis.
Light-activated synaptic conductances were measured as described previously (Venkataramani and Taylor, 2010). Briefly, the light responses were recorded at holding potentials adjusted sequentially from −110 to 50 mV in 20 mV steps. Total membrane current–voltage relations (I–Vs) were generated at 10 ms intervals commencing ∼500 ms before the light response and running until near the end of the voltage step. At each time-point, the leak I–V relation was subtracted to obtain the net light-evoked I–V. At positive potentials, the membrane current during the voltage-steps generally showed a steady decline, most likely due to inactivation of residual voltage-gated potassium currents. To obtain more accurate measures of the net light-activated current, this trend was subtracted before subtracting the leak I–V relation. For the I–V relation at each time-point, the corresponding voltages were corrected for series resistance errors calculated for the total current amplitude.
At each time-point, the I–V relation, representing the membrane current, Im, as a function of the holding potential, V, was fit with the following equation giving the sum of the currents produced by each conductance component:
 |
where GI is an inhibitory conductance with reversal potential, ECl was calculated to be ∼−70 mV under these recording conditions, and GE is a linear excitatory component with reversal potential, VE = 0 mV. Because of the 70 mV separation between the excitatory and inhibitory reversal potentials, inaccuracies of a few millivolts in either ECl or VE would have little effect on the relative magnitudes of the calculated conductances. GNMDA is a nonlinear excitatory component representing an NMDAR-mediated input, where V1/2 = −35 mV is the potential at which Mg blocks 50% of the channels, and Vδ = 15 mV gives the voltage dependence of Mg block (Venkataramani and Taylor, 2010). The values for V1/2 and Vδ were similar to those used in previous studies (Dunn et al., 2006) but were modified slightly to accurately account for the d-AP5-sensitive current shown in Figure 6A. Fitting was performed using the nonlinear, least-squares Levenberg–Marquardt algorithm as implemented in the Igor Pro software (version 6, Wavemetrics). Data points were weighted equally during fitting. The linear excitatory component, GE, is presumed to arise from AMPA and or kainate receptors and is referred to as the “A/K” component in the text and figures. The inclusion of GNMDA in Equation 1 was prompted by the finding that some I–V relations were J-shaped, which is often indicative of a contribution from postsynaptic NMDA receptors. The presence of NMDAR-mediated synaptic input is confirmed by pharmacological experiments. Moreover, fitting the blue I–Vs in Figure 4B, C yielded lower χ2 values when GNMDA was included (see Fig. 4B, χ2 = 2.14; see Fig. 4C, χ2 = 7.86) than when the data were fitted with just GI and GE (see Fig. 4B, χ2 = 5.88; see Fig. 4C, χ2 = 21.30). Thus, including GNMDA decreased the χ2 value by similar factors of 2.75 (Fig. 4B) and 2.71 (Fig. 4C) at these two time-points. However, the addition of GNMDA as a free parameter in Equation 1 is unlikely to produce a statistically significant improvement of the fits to the I–V relations at all time-points. Our rationale was to consider the minimal model that can account for the synaptic inputs to the ON-OSGCs and to apply it uniformly across all the datasets. Therefore, all three components, GI, GE, and GNMDA, were free parameters while fitting the I–V relations under all conditions.
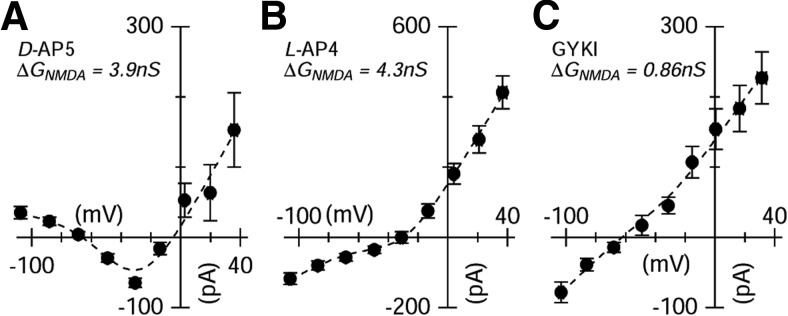
Figure 6.
The effects of pharmacological blockers on resting conductance. The NMDAR antagonist blocks a tonic input to ON-OSGCs. A, Average difference I–V relation obtained for the cells shown in Figure 5. For each cell, the I–V relation, at a fixed time-point before the light stimulus, was generated in control and after addition of 50 μm d-AP5. Symbols represent the net current blocked by 50 μm d-AP5, averaged over the 6 cells. Line through the points shows the fit to Equation 1 and indicates that application of d-AP5 suppressed 3.9 nS of tonic NMDA conductance, increased GA/K by 0.42 nS, and reduced GInh by 0.23 nS. The change in the NMDA component was equivalent to suppressing excitation by 1.1 nS at −60 mV. B, The same analysis for the 8 ON-OSGCs shown in Figure 8, in control and after addition of 50 μm l-AP4. Blocking the ON pathway suppressed 4.3 nS of tonic NMDA conductance and suppressed GA/K by 0.39 nS and GInh by 2.2 nS. C, For six cells, the AMPA receptor selective antagonist GYKI, produced an almost linear difference I–V relation. GYKI suppressed GInh by 2.0 nS, GA/K by 0.14 nS, and GNMDA by 0.86 nS.
Figure 4.
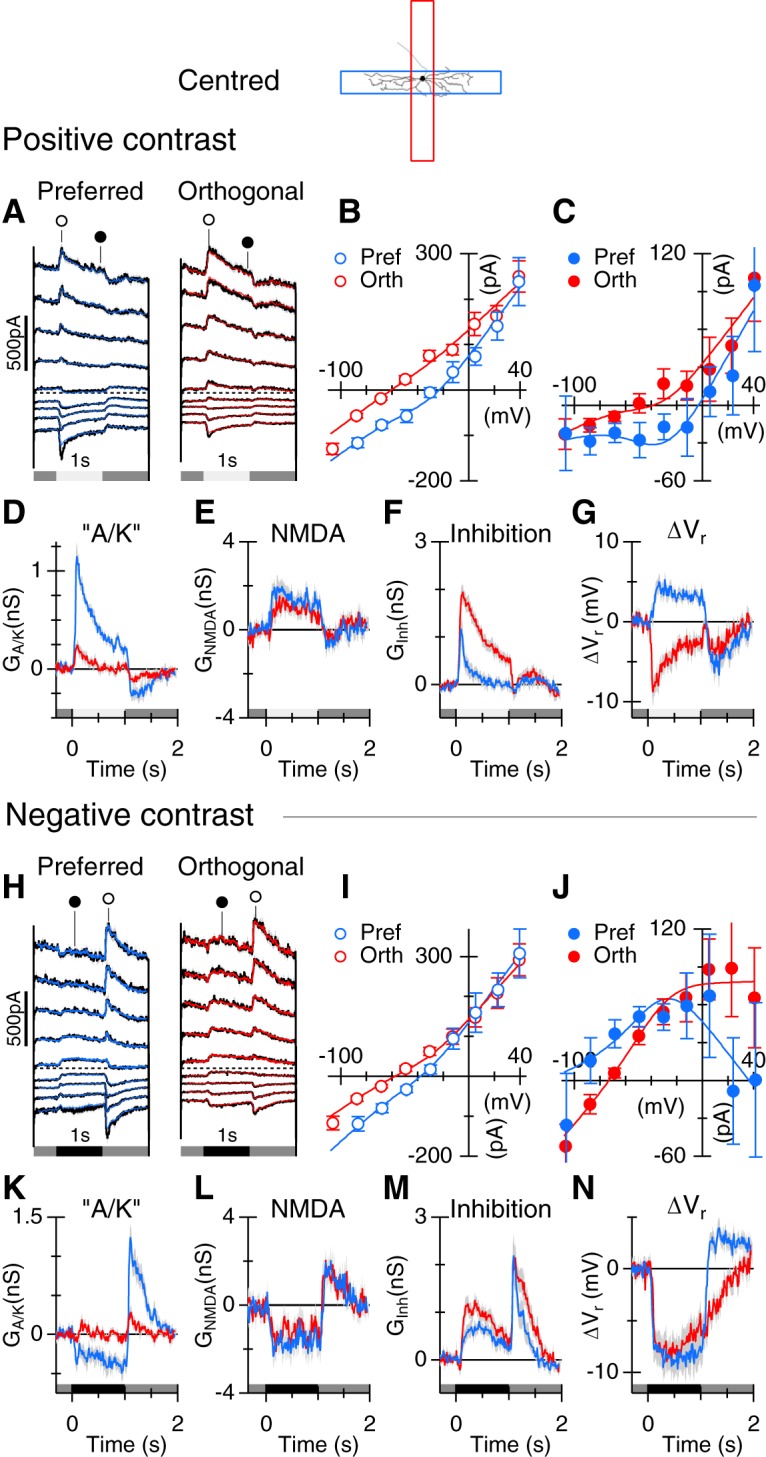
Voltage-clamp analysis of the synaptic inputs to ON-OSGCs. Top, Schematic represents the stimulus configuration relative to the morphology of the recorded cell. A, Average currents recorded from 17 cells at holding potentials from −100 to +40 mV at 20 mV intervals (black). Colored overlays in this and subsequent figures represent the currents reconstructed from the corresponding average conductances, here shown in D–F. Light stimulus contrast was 80%. Timing is indicated beneath the traces. B, C, Average current–voltage relations for the 17 cells measured at the time-points indicated by the symbols in A. Solid lines indicate the average of the fits of Equation 1 to the individual current–voltage relations. D–F, Average conductances calculated for the 17 cells. Blue represents the preferred orientation. Red represents nonpreferred (orthogonal) orientation. G, Change in the whole-cell zero-current potential, Vr, as a function of time during the light stimulus (for details, see Materials and Methods).H–N, Results for negative contrast stimuli (−80%) obtained concurrently with the positive contrast data in 16 of the 17 cells. The layout and conventions are the same as for A–G.
The first trial in a light stimulus series often produced a relatively larger response than subsequent trials, presumably due to contrast adaptation. To obviate distortion of the calculated conductances that could be produced by this systematic error, the first trial, which was obtained at the most negative potential, was not included when fitting the I–V relations in Figures 4, 5, 7, and 8. Because the most negative trace was not used for fitting, the overlying colored traces in the figures at this potential represent the prediction based on the fits to the remaining data at the other step potentials. The largest deviation in this prediction occurs during a period of ∼100 ms near the start of the stimulus, which is consistent with the time course of rapid contrast adaptation (Victor, 1987; Brown and Masland, 2001).
Figure 5.
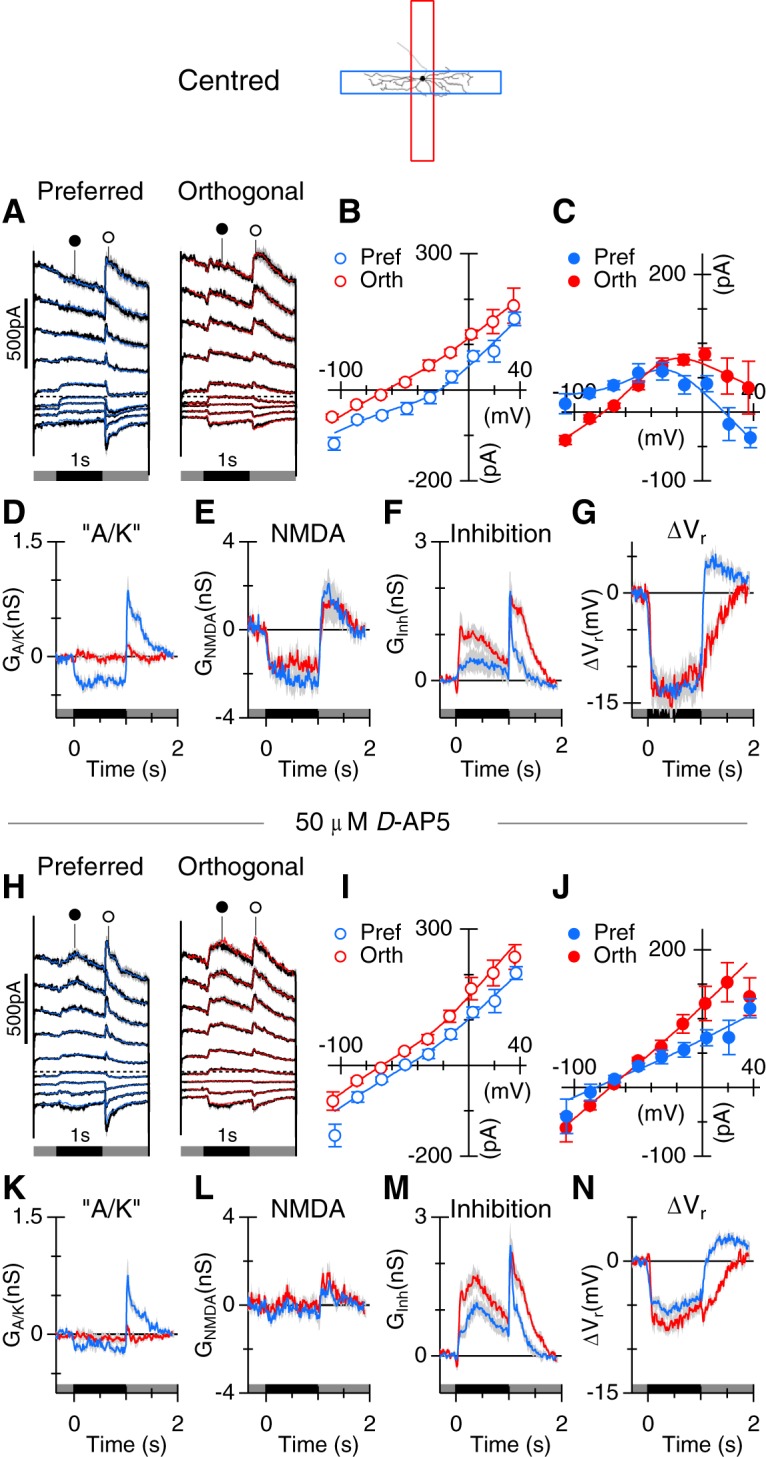
Blocking NMDARs linearizes the I–V relations. A–N, The conventions are identical to Figure 4. All responses were obtained for negative contrast stimuli (−80%). Data show averages from 6 cells in control (A–G) and in the presence of 50 μm d-AP5 (H–N).
Figure 7.
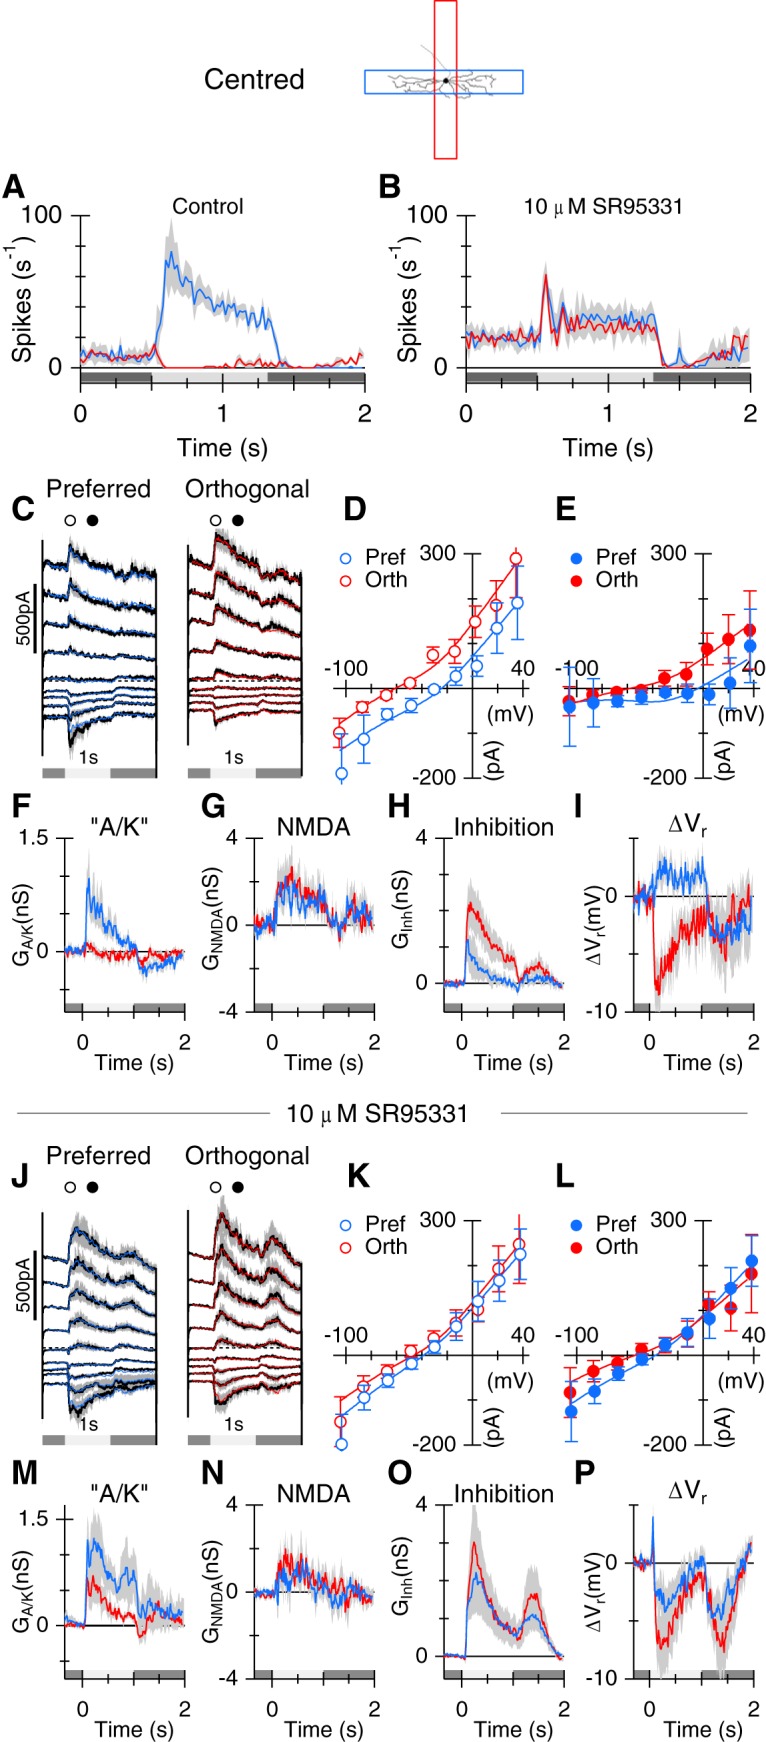
Blocking GABAA receptors suppresses orientation selectivity. A, B, Average PSTHs in control, and in the presence of 10 μm SR-95531 to block GABAA receptors. C–P, The layout and conventions are as shown in Figure 5. Top panels (C–I) represent the control. Bottom panels (J–P) represent the data in the presence of 10 μm SR-95531.
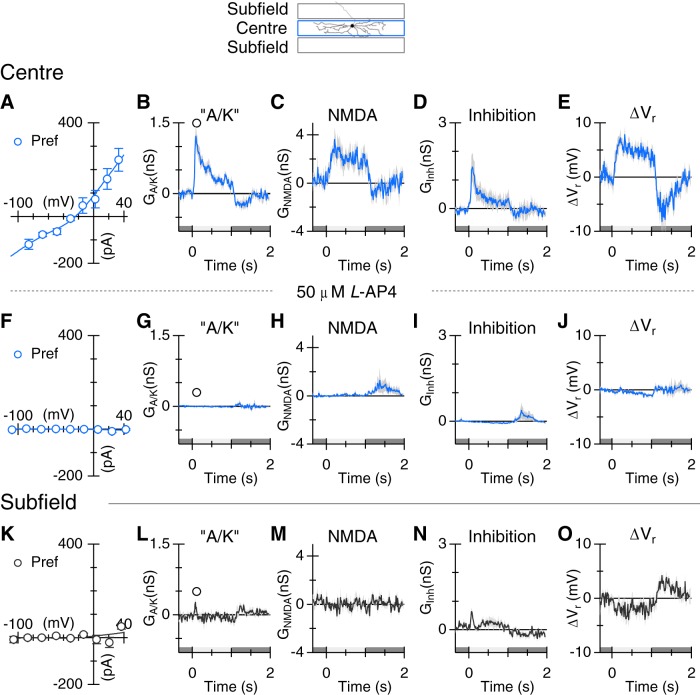
Figure 8.
Blocking the ON pathway with l-AP4 largely blocks light-evoked responses. Top, Spatial arrangements of the stimuli. A, Average I–V relations obtained at the time-point shown in B. B–D, Average conductances elicited by 1 s light flashes (80%, n = 5. E, Change in the whole-cell zero-current potential. F–J, Same format as A–E, showing the residual response in the presence of 50 μm l-AP4. K–O, Same format as A–E, for the same sample of cells showing responses to light flashes in the subfields adjacent to the center. The stimulus was flashed at two locations 100 and 150 μm above and below the center of the RF. Responses at the two locations were averaged.
The whole-cell reversal potential, or zero-current potential, Vr was calculated at each time point by using cubic spline interpolation to determine where the whole-cell I–V relation cut the voltage axis. The change in Vr relative to the resting value, is designated as ΔVr, and provides a measure of depolarizing or hyperpolarizing drive produced by the total light-evoked synaptic input that takes into account the whole-cell input resistance.
An orientation selectivity index (OSI) for a response parameter was defined as follows:
 |
The OSI was used to assess the strength of orientation tuning for different parameters. The von Mises distribution, which is the circular analog to the Gaussian distribution, was used to describe the tuning curves shown in Figure 1E, F, and is given by the following:
where Rmax is the maximum response, μ is the preferred orientation, and κ is a parameter that accounts for the width of the orientation tuning.
Figure 1.
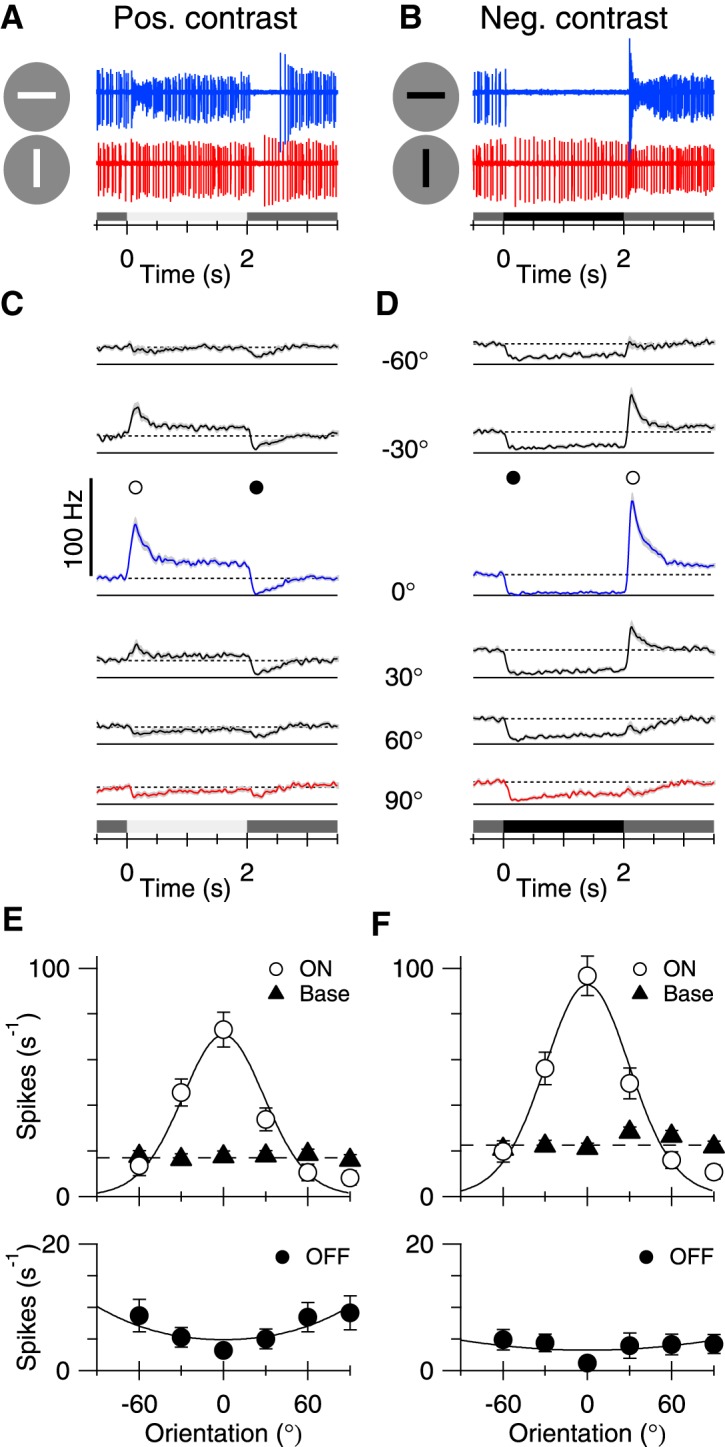
Orientation tuning of spike responses. Throughout the figure legends: Blue represents preferred orientation. Red represents orthogonal orientation. Open symbols represent data corresponding to positive contrast or ON stimulus transitions (appearance of a bright bar or disappearance of a dark bar). Solid symbols represent data for negative contrast or OFF stimulus transitions (appearance of a dark bar or disappearance of a bright bar).A, B, Single sweeps showing extracellular spike recordings in an ON-OSGC in response to a 100 μm × 1 mm bar flashed in the preferred (horizontal) and orthogonal (vertical) orientations.A, B, Shaded bars beneath traces represent contrast and stimulus timing. C, D, Each trace represents an average PSTH for 19 cells. The PSTH in each cell was estimated from 2 trials at each orientation. Shading represents SEM. Symbols represent the time-points for the measurements inE, F.E, F, Tuning curves generated from the positive and negative contrast data in C, D. Data points represent the mean spike rates measured from the PSTHs during a 20 ms time-window centered on the corresponding symbols shown in C, D. Solid triangles represent the mean tonic firing rate during the 500 ms preceding the stimuli. Error bars indicate SEM.
Unless otherwise specified, errors quoted in the text or illustrated in figures are SEM. Statistical significance was evaluated using paired, two-tailed Student's t tests. The resulting p values are quoted in the text.
Results
ON-OSGCs were targeted by making extracellular recordings of spikes evoked by flashing vertical and horizontal bars as test stimuli. The center of the RF was located by mapping linear response profiles for a 100 μm circle flashed at a sequence of locations across the screen along the vertical and horizontal axes. The RF of the cell was centered on the stimulus screen by iteratively offsetting of the origin of the stimulus coordinates and reassessing the response profiles for the 100 μm spot.
ON-OSGCs are tuned to detect horizontal edges
Once the stimulus was centered on the RF, orientation selectivity (OS) could be readily observed during responses to single stimuli. A bright bar of the preferred orientation increased spiking and produced a pause in spiking when it disappeared (Fig. 1A, blue). Conversely, a dark bar suppressed spiking and produced a transient increase when it disappeared (Fig. 1B, blue, right). Orthogonally oriented stimuli produced little modulation of spiking (Fig. 1A,B, red).
The orientation tuning was mapped by measuring responses to a bar (100 μm × 1 mm) flashed on the center of the RF at 6 orientations at 30° intervals between −60° and 90° relative to the preferred orientation (defined as 0°). Average PSTHs for 19 cells at different stimulus angles are shown in Figure 1C, D. A bright bar of the preferred orientation produced a transient increase in spiking that settled to a slightly higher maintained level for the duration of the 2 s stimulus (Fig. 1C, blue). At the termination of the bright bar stimulus, spiking was transiently suppressed before returning to the original maintained spike rate. Conversely, a dark bar suppressed spiking for the duration of the stimulus (Fig. 1D, blue). At the termination of a dark bar stimulus, spiking transiently increased, with peak firing rates comparable to those observed during bright bar stimuli. For orthogonally orientated stimuli (90°), neither the bright nor dark bar produced much change in spiking (Fig. 1C,D, red).
The tuning curve for bright bars was obtained by plotting the mean spike rate within a 20 ms window at a fixed time-point coincident with the peak of the PSTH for preferred orientations (Fig. 1E, open circles). The tuning was well described by the von Mises distribution (Fig. 1E, solid lines). The preferred orientation (0°) was aligned with the visual streak, which is parallel to the horizon for a rabbit sitting in the freeze position (Hughes, 1971). For the same group of cells, the orientation tuning of the ON response elicited at the termination of dark bar stimulation was essentially identical (Fig. 1F, open circles). The background firing rate averaged ∼20 Hz (Fig. 1E,F, black triangles). OFF stimuli suppressed the tonic background spiking, either at the termination of a bright bar, or the onset of a dark bark, but did not show much orientation tuning (Fig. 1E,F, bottom).
The orientation selectivity index (OSI, Eq. 2) was calculated to be 0.83 ± 0.24 for the ON response during bright bar stimulation, and 0.78 ± 0.23 for the ON response at the termination of dark bar stimulation (±SD, n = 19). As far as possible, each piece of isolated retina was placed in the same orientation in the recording chamber. Nonetheless, inevitable inaccuracies in the alignment of the preparation each day will tend to broaden the average orientation-tuning curves; therefore, the tuning widths shown in Figure 1E, F are likely overestimates.
Once the preferred orientation was established, the width of the RF center was mapped by measuring responses to bars of the preferred orientations over a range of vertical offsets (Fig. 2A,B). At locations above and below the center (flanking locations), the stimulus produced responses of the opposite polarity (i.e., an ON transition suppressed spiking at flanking locations) (Fig. 2C,D, open symbols), and an OFF transition elicited spiking at flanking locations (Fig. 2C,D, solid symbols). The orientation selectivity within these OFF-responding regions was evident from responses to orthogonal stimuli, which tended to suppress spiking at most positions, regardless of stimulus contrast (Fig. 2E,F).
Figure 2.
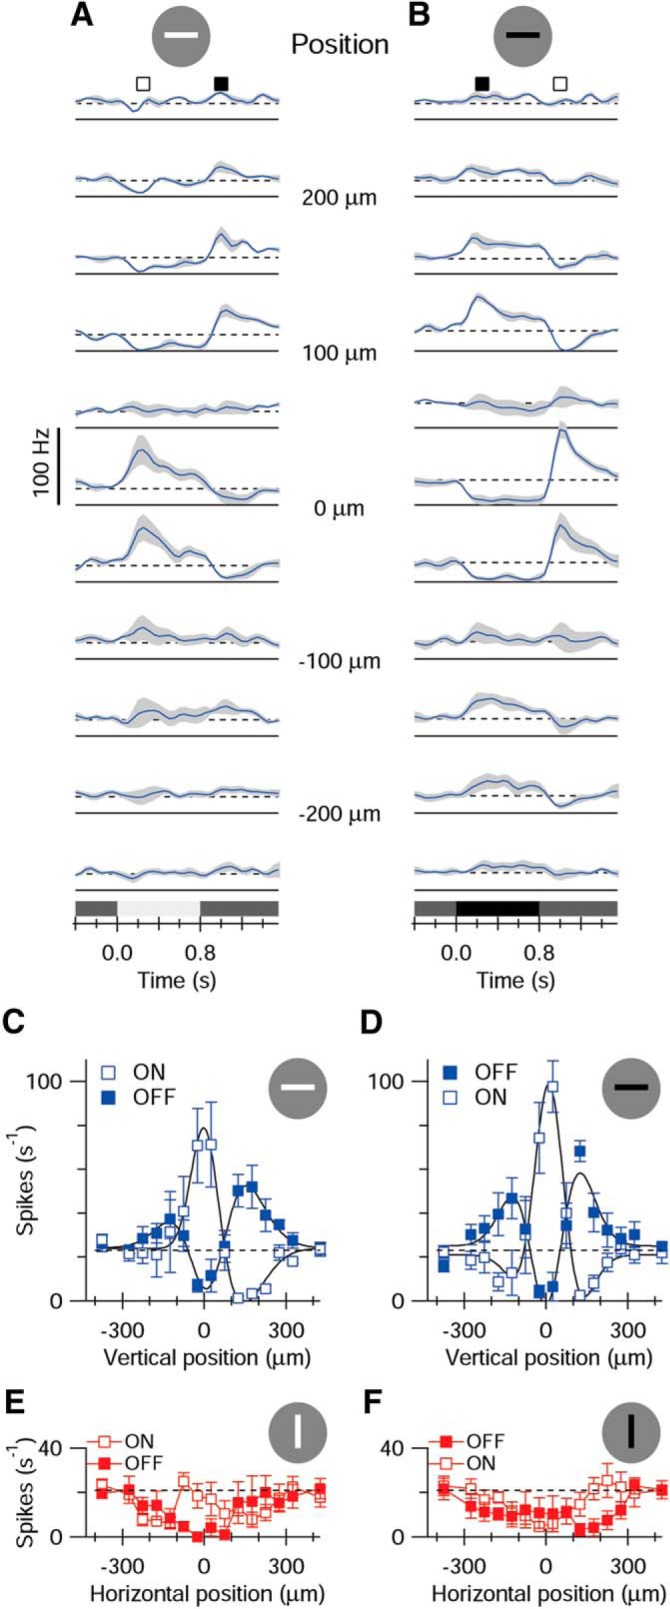
RF structure. A, B, Average PSTHs for 5 cells obtained for horizontal stimuli offset vertically by 50 μm between each trace. Shading represents SEM. The locations of the bar relative to the RF center are indicated between the traces. The vertical spike calibration applies to both sets of traces. The stimulus is shown schematically at the top. C, D, Mean spike rates measured during a 20 ms time-window centered on the corresponding symbols shown in A, B. Open symbols represent ON responses. Closed symbols represent OFF responses. E, F, Same format as C, D for vertical bars offset horizontally across the RF. The corresponding PSTHs are not shown. C–F, Error bars indicate SEM.
ON-OSGC morphology
We revealed the morphology of the ON-OSGCs during whole-cell recordings by including a fluorescent dye in the patch electrode. The dendritic arbors showed similar morphological features and tended to be elongated along the horizontal axis of the retina, parallel with the visual streak and the preferred orientation (Fig. 3). The extent of the dendritic arbors was estimated by drawing the smallest rectangle that enclosed the dendritic tips. The average width of the enclosing rectangles was 212 ± 39 μm, and the average height was 79 ± 19 μm. The elongation index was calculated as (width − height)/(width + height). By this metric, a horizontally extensive dendritic arbor (with no vertical extent) would have an index of 1, whereas a symmetric arbor (equal horizontal and vertical extents) would have an index of 0. For the dendritic arbors illustrated, the mean index was 0.46 ± 0.10 (n = 6, ±SD). This anatomical asymmetry may contribute to the orientation preference of the excitatory inputs that is documented below. Colabeling with an antibody against ChAT indicated that the cells were narrowly stratified in the ON sublamina (S4) of the inner plexiform layer (Fig. 3B), consistent with the excitatory inputs being driven by positive contrast stimuli (i.e., ON-type ganglion cells).
Synaptic mechanisms generating orientation selectivity
To determine the synaptic basis for orientation-tuned responses, we stimulated the cells with a dark or light bar in either the preferred or orthogonal orientation and recorded the synaptic currents at a range of holding potentials (Fig. 4A,H). The excitatory and inhibitory synaptic conductances were estimated by fitting Equation 1 to current–voltage relations (Fig. 4B,C,I,J; see Materials and Methods). The linear excitatory component will be referred to as the “A/K” component, as both AMPA and kainate receptors are found in the inner plexiform layer of mammalian retinas (Brandstätter et al., 1997; Qin and Pourcho, 2001). The curvature in the I–V relations (Fig. 4B,C) was accounted for by the NMDA component in Equation 1. The integrated “A/K” conductance measured during the stimulus was significantly smaller for orthogonal stimuli (0.11 ± 0.22 nS·s) than for preferred (0.44 ± 0.20 nS·s, ±SD, p = 4.8e-6, n = 17; Fig. 4D). The integrated NMDA conductance measured during the stimulus was smaller for orthogonal stimuli (0.78 ± 0.77 nS·s) than for preferred (1.22 ± 0.97 nS·s, ± SD, p = 0.033, n = 17; Fig. 4E). Conversely, the integrated inhibitory conductance was smaller for preferred stimuli (0.25 ± 0.41 nS·s) than for orthogonal (0.94 ± 0.52 nS·s, ± SD, p = 2.0e-6, n = 17; Fig. 4F). The OSIs calculated for the average integrated conductances were 0.60, 0.22, and −0.59 for “A/K,” NMDA, and inhibition, respectively. Consistent with the spiking responses (Fig. 1), the combined excitation and inhibition produced net depolarization of the whole-cell zero-current potential for preferred stimuli and a hyperpolarization for orthogonal stimuli (Fig. 4G). These results indicate that orientation selectivity results from a “push-pull” arrangement of excitation and inhibition.
The suppression in spiking seen at the termination of a positive contrast stimulus (Fig. 1A,C) mirrors the drop in excitation below the baseline seen in Figure 4D. Analysis of responses to negative contrast stimuli provides further evidence for suppression of tonic excitatory input to ON-OSGCs. During dark bar stimulation, the reversal potential for the I–V relation was more negative than the chloride reversal potential of −70 mV (Fig. 4J, blue). A synaptic reversal potential more negative than ECl can be accounted for by combining suppression of a tonic excitatory conductance with activation of an inhibitory conductance (Fig. 4K–M, blue). Moreover, the I–V relations in Figure 4J appear to be inversions of the J-shaped I–V relation characteristic of NMDA receptors, consistent with suppression of a tonic input mediated by NMDA receptors (Fig. 4L). The magnitude of the integrated “A/K” conductance, measured during the negative contrast stimulus, was smaller for orthogonal stimuli (2.8 ± 88 pS·s) than for preferred (−201 ± 200 pS·s, ± SD, p = 0.0014, n = 16; Fig. 4K). Similarly, the integrated NMDAR conductance, measured during the stimulus, was smaller for orthogonal stimuli (−0.84 ± 0.74 nS·s) than for preferred (−1.24 ± 0.95 nS·s, ± SD, p = 0.022, n = 16; Fig. 4L). Conversely, the integrated inhibitory conductance was slightly larger for orthogonal stimuli (0.69 ± 0.52 nS·s) than for preferred (0.47 ± 0.43 nS·s, ± SD, p = 0.013, n = 16; Fig. 4M). For the ON response seen at the termination of the negative contrast stimulus, the peak inhibition was similar for the preferred and orthogonal stimuli (Fig. 4M), whereas the peak excitation showed a large difference (Fig. 4K). This observation indicates that inverse orientation selectivity of excitation and inhibition does not arise simply from voltage-clamp errors (Poleg-Polsky and Diamond, 2011; Vaney et al., 2012).
If the inverted J-shaped I–V relation is due to the presence of postsynaptic NMDARs, then the nonlinearity should disappear when NMDARs are blocked. We tested this prediction by applying the NMDAR antagonist, d-AP5 (50 μm), and recording responses to negative contrast stimuli. Application of the NMDAR antagonist linearized the synaptic I–V relations (compare Fig. 5B,C,I,J), consistent with suppression of NMDARs on ON-OSGCs. The amount of the NMDAR conductance suppressed by the dark bar (Fig. 5E) was reduced in the presence of d-AP5 (Fig. 5L; n = 6, p = 0.0030, preferred orientation; p = 0.0021, nonpreferred orientation). By contrast, the “A/K” conductance observed at the termination of the dark bar stimuli was unaffected by d-AP5 (p = 0.11, preferred orientation; p = 0.34, nonpreferred orientation). Overall, these results indicate that the ON-OSGCs receive a tonic input mediated by NMDARs that is strongly modulated by light stimuli.
If there is a tonic NMDAR input to the cells, then the slope of the “leak” I–V relation, recorded in the absence of light stimulation, should be reduced when NMDARs are blocked. We tested this prediction by measuring the I–V relation at a time-point before light stimulation under control conditions and subtracting the I–V relation obtained at the same time-point in the presence of d-AP5. The resulting difference I–V relation reversed close to 0 mV and showed the characteristic nonlinearity expected for NMDA receptors (Fig. 6A). The fitted curve indicates that application of d-AP5 blocked ∼3.9 nS of tonic NMDA input, which is comparable with the suppression shown in Figures 4L and 5E. Because negative contrasts suppressed the NMDAR input, it seems likely that it arises from tonically depolarized ON-bipolar cells and therefore should be suppressed by applying the mGluR6 receptor agonist, l-AP4, which would hyperpolarize ON-bipolar cells. Indeed, application of 50 μm l-AP4 suppressed ∼4.4 nS of NMDAR input and 2.1 nS of inhibition (Fig. 6B). By contrast, in another sample of cells, the AMPA receptor antagonist, GYKI 53655, blocked an essentially linear conductance that could be accounted for by suppression of 2.0 nS of tonic inhibitory input (Fig. 6C). These results indicate that ON-OSGCs receive a tonic NMDAR-mediated input from ON-bipolar cells that is similar in magnitude to the NMDAR-mediated input modulated by light.
GABAA-mediated inhibition is critical for OS responses
GABAA receptors (GABAARs) underlie selectivity for specific trigger features in a number of retinal ganglion cell types. For example, the distinctive RF properties of ON and ON-OFF direction-selective ganglion cells, and OFF-OSGCs, are lost in the presence of GABAAR antagonists (Caldwell et al., 1978; Venkataramani and Taylor, 2010). We tested whether GABAARs produce orientation selectivity in ON-OSGCs by applying 10 μm of the GABAAR antagonist, SR-95531 (gabazine). Blocking GABAARs completely abolished the orientation selectivity of spiking responses in 3 of 3 cells tested (Fig. 7A,B). There was also an increase in the baseline-firing rate, which could reflect an increase in tonic excitation or a decrease in tonic inhibition. The data in Figure 6B, C suggest the presence of tonic inhibitory inputs. The magnitude of the integrated “A/K” excitatory input was increased by the application of SR-95531 (preferred, p = 0.033, orthogonal, p = 0.037, n = 6; Fig. 7F,M); however, the difference in the integrated “A/K” excitation for preferred versus orthogonal stimuli remained significant (control, p = 0.034; Fig. 7F; SR, p = 0.022; Fig. 7M). These results indicate that activity of GABAA receptors is not essential for excitatory tuning. Blocking GABAARs significantly increased the inhibitory conductance for preferred orientation stimuli for positive (p = 0.026, n = 6; Fig. 7H,O) and negative (p = 0.015, n = 5; data not shown) contrast stimuli. The magnitude of the inhibition during orthogonal stimulation did not change significantly (p = 0.22, n = 6; Fig. 7G). The orientation selectivity of the total conductance was lower in SR-95531 because the zero-current potential was hyperpolarizing in either orientation (compare traces in Fig. 7I,P). The data do not preclude the possibility that postsynaptic GABAA receptors contribute to inhibition under control conditions, but indicate that ON-OSGCs receive inputs via other inhibitory receptors, and demonstrate that orientation selectivity of postsynaptic inhibition is dependent on GABAA receptor activation.
Synaptic input to ON-OSGCs is driven through ON-bipolar cells
The narrow stratification of the OSGCs to ON sublamina S4 is consistent with the finding that the excitatory inputs are largely driven by positive contrast stimuli. However, both excitation and inhibition were modulated during both ON and OFF stimulus transitions, raising the possibility that both the ON and OFF pathways are involved. We used the mGluR6 receptor agonist l-AP4 to assess the contribution of ON-bipolar cells to the synaptic input to ON-OSGCs. For centered stimuli, l-AP4 completely suppressed synaptic inputs, regardless of orientation, for positive contrast transitions either at the onset of a light bar or termination of a dark bar (Fig. 8A–J; orthogonal responses are not shown but were similarly suppressed). Overall, the results show that ON-bipolar cells largely drive both excitatory and inhibitory inputs to the RF center. There were, however, small responses activated during negative contrast transitions that were not blocked by l-A4, suggesting that some synaptic inputs to ON-OSGCs are driven through the OFF pathway, at least during blockade of the ON pathway (Fig. 9A–J).
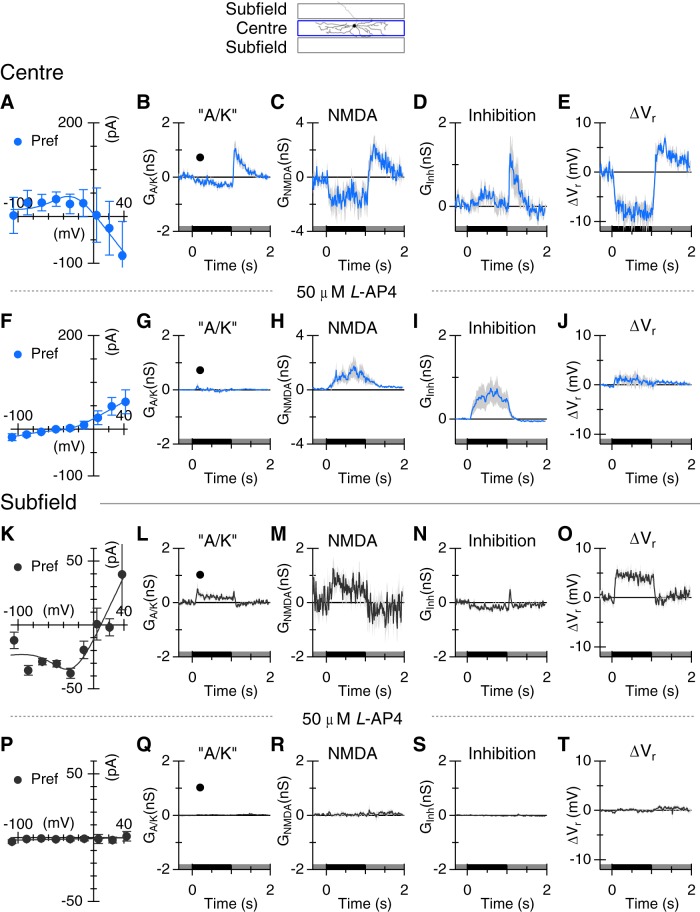
Figure 9.
Excitation elicited by negative contrast stimulation of the subfields is mediated by the ON pathway. The stimulus was a negative contrast (−80%) bar flashed at two locations 100 and 150 μm above and below the center of the RF. Data show average results from 6 cells. The format for the panels is identical to Figure 8A–J. Responses to dark bar stimulation in the center were largely suppressed by blocking the ON pathway. K–O, Negative contrast activated both “A/K” and NMDA inputs from the subfields, with little evidence for activation of inhibition. P–T, Subfield responses were completely suppressed when the ON pathway transmission was blocked with 50 μm l-AP4.
Flashing a stimulus of the preferred orientation in regions adjacent to the RF center produced inverted responses in ON-OSGCs: a transition from bright to dark was excitatory (Fig. 2). We will refer to these excitatory flanking regions as “subfields.” Given that excitation for center responses is driven through the ON pathway, we sought to determine whether the excitatory OFF responses in the subfields were also driven through the ON pathway. To this end, we recorded responses to bars at laterally offset locations 100 and 150 μm above and below the center. The results were essentially identical in the two locations; therefore, to improve the accuracy of our estimates, we combined the results from the two locations.
A positive contrast stimulus in the subfields produced very little activation of synaptic inputs to ON-OSGCs (Fig. 8K–O), indicating that direct excitatory and inhibitory inputs arise from ON-bipolar cells and amacrine cells with relatively narrow RFs, contained within the center RF of the ON-OSGC. However, stimulation with negative contrast in the subfields activated an NMDAR input (Fig. 9M), and a small “A/K” receptor-mediated input (Fig. 9L) and generated a depolarizing drive to the ON-OSGCs (Fig. 9O), although there was little evidence for activation of inhibition (Fig. 9N). These subfield inputs were driven through the ON pathway because the conductances were completely suppressed by application of l-AP4 (Fig. 9P–T; “A/K,” p = 0.017, NMDAR, p = 0.012, n = 6). The NMDAR-mediated input is expected to contribute to the tonic firing under background illumination, and to the excitatory responses to negative contrast stimulation in the surround. We tested these predictions by applying 50 μm d-AP5. In three cells, application of 50 μm d-AP5 reversibly suppressed background spiking (Fig. 10). There was also an unexpectedly large suppression of the ON response seen at the termination of the dark flash (Fig. 10A), indicating that the increased NMDA conductance consistently seen at this time (e.g.; Figs. 4L, 5E, 9C) contributes to the spiking responses. Blocking NMDA receptors also reduced the spiking produced by negative contrast stimulation in the subfields (Fig. 10B).
Figure 10.
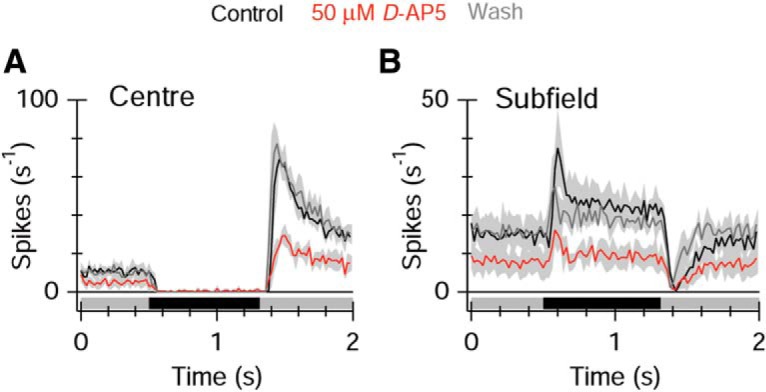
Blocking NMDA receptors suppresses spiking responses. A, Average PSTHs for dark bar stimulation (−80%) at the preferred orientation in the center of the RF (n = 3 cells). Application of the NMDA antagonist reversibly suppressed the basal firing rate and the ON response at the termination of the dark flash. B, The increase in spiking produces by negative contrast stimulation in the subfields adjacent to the center was suppressed by the NMDA antagonist.
Discussion
The data show that the RFs of ON-OSGCs comprise a central region excited by positive contrast and flanking subfields excited by negative contrast. This RF organization has not been previously described in the retina and is remarkably similar to the RF structure of simple cells in primary visual cortex (V1) (Hubel and Wiesel, 1962; Chapman and Stryker, 1992; Ferster and Miller, 2000; Priebe and Ferster, 2012). The convergent evolution of such similar RFs at different levels within the visual system seems consistent with the notion that visual neurons have evolved to efficiently encode the statistical structure of natural images (Simoncelli and Olshausen, 2001). However, unlike simple cells in V1, the data presented here and previously indicate that OSGCs in the retina display only two preferred orientations: horizontal and vertical (Levick, 1967; Oyster et al., 1971; Venkataramani and Taylor, 2010). This dichotomy may reflect evolutionary pressure because the two axes align with a slight asymmetry in the statistics of natural images, in which vertical and horizontal orientations are slightly over-represented (van der Schaaf and van Heteren, 1996; Balboa and Grzywacz, 2003). The finding that ON- and OFF-OSGCs signal only two orientations would seem to preclude a major role in image-forming pathways; however, these cells could contribute to visual feedback control of posture or head and eye position. Identification of the central targets of these cells may provide further physiological insight.
In V1, orientation selectivity is driven by excitatory inputs from oriented arrays of concentric retinal RFs, whereas inhibition shares the same orientation preference as the excitatory inputs and therefore does not contribute to generating orientation selective signals (Monier et al., 2003). By contrast, for ON-OSGCs, orientation selectivity depends critically on presynaptic GABAergic mechanisms, which selectively suppress inhibitory inputs during preferred orientation stimulation (Fig. 7). The putative presynaptic GABAergic amacrine cells must respond selectively to horizontal edges (Fig. 11). It is noteworthy that, for the two types of OFF-OSGCs described previously (Venkataramani and Taylor, 2010), orientation selectivity is also dependent on unknown presynaptic GABAergic amacrine cells that render both excitatory and inhibitory inputs orientation-selective. These presynaptic orientation-selective signals may originate in the activity of spatially oriented amacrine cells similar to those described recently (Bloomfield, 1994; Murphy-Baum and Taylor, 2015). Thus, the mechanisms generating orientation selectivity in the cortex and the retina are fundamentally different: the former relies on ordered retinotopic mapping of excitatory inputs and is not critically dependent on inhibition, whereas the latter relies on signals from orientation-selective inhibitory interneurons.
Figure 11.
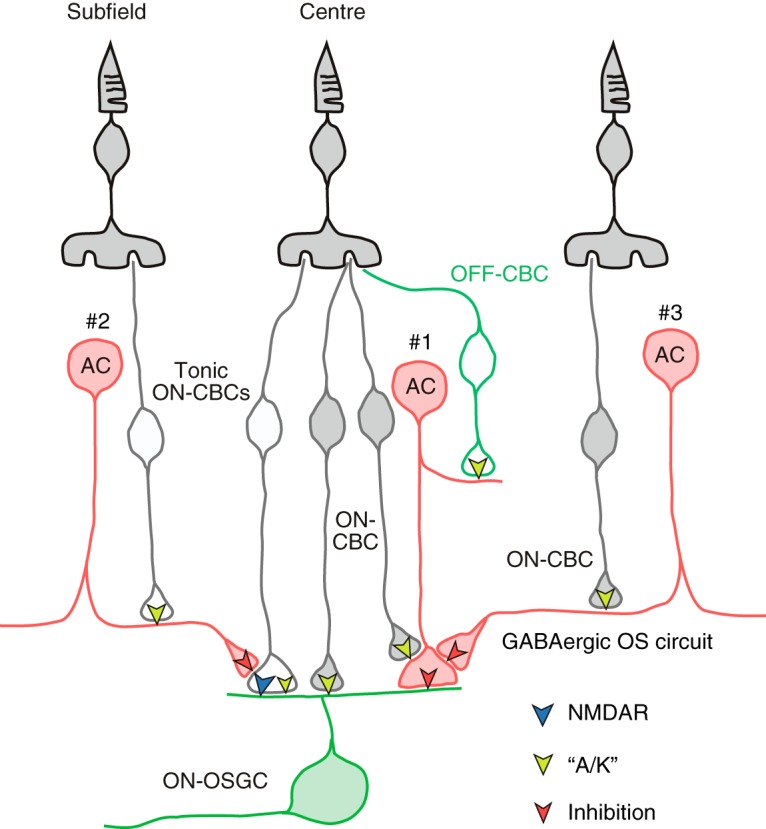
Schematic summarizing the proposed synaptic circuitry that drives ON-OSGCs. Excitation is confined to the RF center and is mediated by NMDA and presumably AMPA receptors (Figs. 4; 5). Direct inhibitory inputs are confined to the RF center (Figs. 8; 9) and are proposed to arise from an amacrine cell that receives input from both ON and OFF bipolar cells (AC#1). It is also possible that separate ON and OFF amacrine cells are involved. The inhibitory inputs from AC#1 are rendered orientation-selective due to GABAA receptor-mediated inhibition from an ON-type amacrine cell (AC#3) that is most strongly activated by horizontal orientations (Fig. 7). A serial inhibitory connection is shown here, but an equivalent effect would be produced by inhibition of the bipolar cell inputs to AC#1. Center excitation is mediated by tonically active ON bipolar cells that activate NMDA and “A/K” receptors. Activation is turned off during negative contrast stimuli. Negative contrast stimuli are excitatory in the flanking subfields but are driven through the ON pathway. A tonically active amacrine cell (AC#2) is proposed to invert the ON pathway signal, by disinhibiting center bipolar cells during negative contrast stimuli (Fig. 9).
ON-OSGCs represent a distinct cell class
Multielectrode array recordings have not revealed OSGC mosaics in the retina (Devries and Baylor, 1997; Anishchenko et al., 2010); however, studies using stimuli specifically designed to elicit orientation-tuned responses indicate that 20%–40% of GCs in the mouse retina are orientation-selective (OSI > 0.33) (Zhao et al., 2013; Chen et al., 2014). These cells may represent orientation bias in cell types that might otherwise be identified as concentric center-surround units. It seems likely that the ON-OSGCs described here represent a distinct population of RGCs because they display characteristic morphology, spiking properties, and patterns of synaptic drive. The ON-OSGCs were sampled within 1 mm of the center of the visual streak. Assuming a dendritic coverage of one, a dendritic extent of 80 × 200 μm, and a density of 3000–5000 ganglion cells/mm2 (Vaney, 1980), then the ON-OSGCs should represent ∼1%-2% of rabbit GCs. Similar considerations for the two OFF-type OSGCs (Venkataramani and Taylor, 2010) suggest that ∼4%-5% of rabbit ganglion cells should be orientation-selective, which accords with the encounter rate of orientation-selective units in the visual streak of the rabbit retina (Levick, 1967).
Substructure of the RF: different synaptic mechanisms for ON- and OFF-OSGCs
The flanking subfields of inverted contrast sensitivity observed in these ON-OSGCs RFs was not observed in OFF-OSGCs (Venkataramani and Taylor, 2010), a finding that may reflect fundamental differences between the ON and OFF pathways. The ON and OFF excitation of ON-OSGCs does not result from convergent input from ON- and OFF-type bipolar cells (Figs. 8, 9). Instead, excitation is driven entirely through the ON pathway. The suppression of excitatory conductances seen during OFF stimulation indicates input from tonically active ON-bipolar cells. We propose that similar tonically active ON bipolar cells drive the laterally connected amacrine cells shown in the model (AC#2; Fig. 11). Decreased illumination of these tonically active amacrine cells inverts ON signals within the OFF subfields by disinhibiting ON-bipolar cell axon terminals and increasing glutamate release (Sagdullaev et al., 2006; Sethuramanujam and Slaughter, 2014). Such a mechanism is not possible for the OFF-OSGCs because they do not receive tonic excitatory input (Venkataramani and Taylor, 2010). Thus, the different RF structures of ON versus OFF-OSGCs may ultimately be attributable to a difference in the presynaptic bipolar cells: the ON-bipolar cells tonically release glutamate, and the OFF-bipolar cells do not. This comparison of excitatory inputs to ON- and OFF-OSGCs mirrors differences observed in other paramorphic ON and OFF retinal ganglion cell types. The excitatory input to ON parasol ganglion cells in the primate retina is inherently more linear than for OFF parasol ganglion cells (Chichilnisky and Kalmar, 2002; Trong and Rieke, 2008). Analysis of ON and OFF α-ganglion cells in other mammals indicates that the difference between the two pathways likely arises at the output of the bipolar cells. ON-bipolar cells tend to be tonically depolarized and are able to modulate glutamate release above and below a basal level, thereby producing more linear synaptic transfer than OFF-bipolar cells, which rest just below release threshold and can only increase glutamate release, resulting in more rectified signaling (Zaghloul et al., 2003; Liang and Freed, 2010; Borghuis et al., 2013). It would be interesting to see whether mean luminance levels, which have been shown to affect rectification of bipolar cells in the ON pathway (Grimes et al., 2014), also affect the substructure of the ON-OSGC RFs.
Concomitant activation of synaptic AMPA and NMDA receptors is well documented in the retina (Mittman et al., 1990; Diamond and Copenhagen, 1993; Taylor et al., 1995; Matsui et al., 1998; Manookin et al., 2010; Venkataramani and Taylor, 2010; Buldyrev et al., 2012; Crook et al., 2014; Stafford et al., 2014); however, the physiological significance of this arrangement in most GC types is unknown. The less pronounced desensitization of NMDARs compared with AMPARs (Traynelis et al., 2010) makes them ideal to mediate the tonic excitatory signals seen in the center and the flanking subfields of the ON-OSGC RFs. Moreover, the NMDARs are well positioned to enhance the gain of orientation-selective responses, due to the convergence of signals from the center and the subfields; when a contrast border aligns with the RF, signals from the bright and dark sides of the border will converge synergistically upon the bipolar cell terminals to increase NMDAR activity and drive spiking responses in the ON-OSGCs (Fig. 10). In this context, it is noteworthy that the AMPAR-mediated excitatory inputs and the inhibitory inputs displayed stronger orientation selectivity than the NMDAR inputs (Fig. 4), suggesting that the primary role for NMDAR inputs may be to amplify the orientation-selective signals generated by the other mechanisms. Previous results have also suggested a role for NMDARs in enhancing responses to high- or low-contrast stimuli in GCs with concentric center-surround RFs (Manookin et al., 2010; Buldyrev et al., 2012). Unresolved questions regarding NMDAR function in the retina concern the potential for physiological modulation of NMDARs via glycine or serine release from amacrine cells (Lukasiewicz and Roeder, 1995; Gustafson et al., 2007; Kalbaugh et al., 2009) and the pathway-specific extrasynaptic localization of some NMDARs (Zhang and Diamond, 2009).
Multiple roles for inhibitory interneurons
A major challenge for visual neuroscientists is to elucidate the functional roles of the 30–40 diverse types of amacrine cell in the retina (Menger et al., 1998; MacNeil et al., 1999). The current analysis identifies roles for at least three different amacrine cells within the circuitry generating orientation selectivity. First is a transiently responding, narrow field cell that makes direct, orientation-selective input to OSGCs (AC#1; Fig. 11). This cell is narrow field because the inhibition is not activated by stimulation of the subfields (Figs. 8N, 9N), and it is orientation-selective because of the involvement of a second amacrine cell, presumably a relatively wide field GABAergic cell (AC#3; Fig. 11). Other complex RF properties (e.g., direction selectivity) are also dependent on GABAergic transmission (Caldwell et al., 1978; Ariel and Daw, 1982; Massey et al., 1997). Finally, the inversion of the ON pathway signals in the subfields of the OSGC RF, where an OFF stimulus becomes excitatory, requires the intervention of a third tonically active amacrine cell (Fig. 9, AC#2; Fig. 11). AC#2 fits the profile expected for a glycinergic cell (Menger et al., 1998); it is narrow field, and the ON/OFF responses are consistent with diffuse vertical stratification. Future studies will need to match these physiological functions with morphological cell types. Large-scale reconstructions at nanometer resolution will hopefully begin to provide some of the answers (Marc et al., 2012; Helmstaedter et al., 2013).
Footnotes
This work was supported by National Eye Institute Grants R01 EY014888 and P30 EY010572, and Research to Prevent Blindness (New York) unrestricted departmental funding. We thank Jacqueline Gayet for excellent technical support, and assistance with rabbit dissection and immunology experiments; and Teresa Puthussery, Ben Sivyer, and Ben Murphy-Baum for helpful discussions and critical reading of the manuscript.
The authors declare no competing financial interests.
References
- Amthor FR, Takahashi ES, Oyster CW. Morphologies of rabbit retinal ganglion cells with complex receptive fields. J Comp Neurol. 1989;280:97–121. doi: 10.1002/cne.902800108. [DOI] [PubMed] [Google Scholar]
- Anishchenko A, Greschner M, Elstrott J, Sher A, Litke M, Feller MB, Chichilnisky EJ. Receptive field mosaics of retinal ganglion cells are established without visual experience. J Neurophysiol. 2010;103:1856–1864. doi: 10.1152/jn.00896.2009. [DOI] [PMC free article] [PubMed] [Google Scholar]
- Ariel M, Daw NW. Pharmacological analysis of directionally sensitive rabbit retinal ganglion cells. J Physiol. 1982;324:161–185. doi: 10.1113/jphysiol.1982.sp014105. [DOI] [PMC free article] [PubMed] [Google Scholar]
- Balboa RM, Grzywacz NM. Power spectra and distribution of contrasts of natural images from different habitats. Vision Res. 2003;43:2527–2537. doi: 10.1016/S0042-6989(03)00471-1. [DOI] [PubMed] [Google Scholar]
- Bloomfield SA. Orientation-sensitive amacrine and ganglion cells in the rabbit retina. J Neurophysiol. 1994;71:1672–1691. doi: 10.1152/jn.1994.71.5.1672. [DOI] [PubMed] [Google Scholar]
- Borghuis BG, Marvin JS, Looger LL, Demb JB. Two-photon imaging of nonlinear glutamate release dynamics at bipolar cell synapses in the mouse retina. J Neurosci. 2013;33:10972–10985. doi: 10.1523/JNEUROSCI.1241-13.2013. [DOI] [PMC free article] [PubMed] [Google Scholar]
- Brandstätter JH, Koulen P, Wässle H. Selective synaptic distribution of kainate receptor subunits in the two plexiform layers of the rat retina. J Neurosci. 1997;17:9298–9307. doi: 10.1523/JNEUROSCI.17-23-09298.1997. [DOI] [PMC free article] [PubMed] [Google Scholar]
- Brown SP, Masland RH. Spatial scale and cellular substrate of contrast adaptation by retinal ganglion cells. Nat Neurosci. 2001;4:44–51. doi: 10.1038/82888. [DOI] [PubMed] [Google Scholar]
- Buldyrev I, Puthussery T, Taylor WR. Synaptic pathways that shape the excitatory drive in an OFF retinal ganglion cell. J Neurophysiol. 2012;107:1795–1807. doi: 10.1152/jn.00924.2011. [DOI] [PMC free article] [PubMed] [Google Scholar]
- Caldwell JH, Daw NW, Wyatt HJ. Effects of picrotoxin and strychnine on rabbit retinal ganglion cells: lateral interactions for cells with more complex receptive fields. J Physiol. 1978;276:277–298. doi: 10.1113/jphysiol.1978.sp012233. [DOI] [PMC free article] [PubMed] [Google Scholar]
- Chapman B, Stryker MP. Origin of orientation tuning in the visual cortex. Curr Opin Neurobiol. 1992;2:498–501. doi: 10.1016/0959-4388(92)90186-O. [DOI] [PubMed] [Google Scholar]
- Chen H, Liu X, Tian N. Subtype-dependent postnatal development of direction- and orientation-selective retinal ganglion cells in mice. J Neurophysiol. 2014;112:2092–2101. doi: 10.1152/jn.00320.2014. [DOI] [PMC free article] [PubMed] [Google Scholar]
- Cheong SK, Tailby C, Solomon SG, Martin PR. Cortical-like receptive fields in the lateral geniculate nucleus of marmoset monkeys. J Neurosci. 2013;33:6864–6876. doi: 10.1523/JNEUROSCI.5208-12.2013. [DOI] [PMC free article] [PubMed] [Google Scholar]
- Chichilnisky EJ, Kalmar RS. Functional asymmetries in ON and OFF ganglion cells of primate retina. J Neurosci. 2002;22:2737–2747. doi: 10.1523/JNEUROSCI.22-07-02737.2002. [DOI] [PMC free article] [PubMed] [Google Scholar]
- Crook JD, Packer OS, Dacey DM. A synaptic signature for ON- and OFF-center parasol ganglion cells of the primate retina. Vis Neurosci. 2014;31:57–84. doi: 10.1017/S0952523813000461. [DOI] [PMC free article] [PubMed] [Google Scholar]
- Devries SH, Baylor DA. Mosaic arrangement of ganglion cell receptive fields in rabbit retina. J Neurophysiol. 1997;78:2048–2060. doi: 10.1152/jn.1997.78.4.2048. [DOI] [PubMed] [Google Scholar]
- Diamond JS, Copenhagen DR. The contribution of NMDA and non-NMDA receptors to the light-evoked input-output characteristics of retinal ganglion cells. Neuron. 1993;11:725–738. doi: 10.1016/0896-6273(93)90082-3. [DOI] [PubMed] [Google Scholar]
- Dunn FA, Doan T, Sampath AP, Rieke F. Controlling the gain of rod-mediated signals in the mammalian retina. J Neurosci. 2006;26:3959–3970. doi: 10.1523/JNEUROSCI.5148-05.2006. [DOI] [PMC free article] [PubMed] [Google Scholar]
- Ferster D, Miller KD. Neural mechanisms of orientation selectivity in the visual cortex. Annu Rev Neurosci. 2000;23:441–471. doi: 10.1146/annurev.neuro.23.1.441. [DOI] [PubMed] [Google Scholar]
- Gollisch T, Meister M. Eye smarter than scientists believed: neural computations in circuits of the retina. Neuron. 2010;65:150–164. doi: 10.1016/j.neuron.2009.12.009. [DOI] [PMC free article] [PubMed] [Google Scholar]
- Grimes WN, Schwartz GW, Rieke F. The synaptic and circuit mechanisms underlying a change in spatial encoding in the retina. Neuron. 2014;82:460–473. doi: 10.1016/j.neuron.2014.02.037. [DOI] [PMC free article] [PubMed] [Google Scholar]
- Gustafson EC, Stevens ER, Wolosker H, Miller RF. Endogenousserine contributes to NMDA-receptor-mediated light-evoked responses in the vertebrate retina. J Neurophysiol. 2007;98:122–130. doi: 10.1152/jn.00057.2006. [DOI] [PubMed] [Google Scholar]
- He S, Levick WR, Vaney DI. Distinguishing direction selectivity from orientation selectivity in the rabbit retina. Vis Neurosci. 1998;15:439–447. doi: 10.1017/s0952523898153038. [DOI] [PubMed] [Google Scholar]
- Helmstaedter M, Briggman KL, Turaga SC, Jain V, Seung HS, Denk W. Connectomic reconstruction of the inner plexiform layer in the mouse retina. Nature. 2013;500:168–174. doi: 10.1038/nature12346. [DOI] [PubMed] [Google Scholar]
- Hubel DH, Wiesel TN. Receptive fields, binocular interaction and functional architecture in the cat's visual cortex. J Physiol. 1962;160:106–154. doi: 10.1113/jphysiol.1962.sp006837. [DOI] [PMC free article] [PubMed] [Google Scholar]
- Hughes A. Topographical relationships between the anatomy and physiology of the rabbit visual system. Doc Ophthalmol. 1971;30:33–159. doi: 10.1007/BF00142518. [DOI] [PubMed] [Google Scholar]
- Kalbaugh TL, Zhang J, Diamond JS. Coagonist release modulates NMDA receptor subtype contributions at synaptic inputs to retinal ganglion cells. J Neurosci. 2009;29:1469–1479. doi: 10.1523/JNEUROSCI.4240-08.2009. [DOI] [PMC free article] [PubMed] [Google Scholar]
- Leventhal AG, Schall JD. Structural basis of orientation sensitivity of cat retinal ganglion cells. J Comp Neurol. 1983;220:465–475. doi: 10.1002/cne.902200408. [DOI] [PubMed] [Google Scholar]
- Levick WR. Receptive fields and trigger features of ganglion cells in the visual streak of the rabbits retina. J Physiol. 1967;188:285–307. doi: 10.1113/jphysiol.1967.sp008140. [DOI] [PMC free article] [PubMed] [Google Scholar]
- Levick WR, Thibos LN. Orientation bias of cat retinal ganglion cell. Nature. 1980;286:389–390. doi: 10.1038/286389a0. [DOI] [PubMed] [Google Scholar]
- Liang Z, Freed MA. The ON pathway rectifies the OFF pathway of the mammalian retina. J Neurosci. 2010;30:5533–5543. doi: 10.1523/JNEUROSCI.4733-09.2010. [DOI] [PMC free article] [PubMed] [Google Scholar]
- Lukasiewicz PD, Roeder RC. Evidence for glycine modulation of excitatory synaptic inputs to retinal ganglion cells. J Neurosci. 1995;15:4592–4601. doi: 10.1523/JNEUROSCI.15-06-04592.1995. [DOI] [PMC free article] [PubMed] [Google Scholar]
- MacNeil MA, Heussy JK, Dacheux RF, Raviola E, Masland RH. The shapes and numbers of amacrine cells: matching of photofilled with Golgi-stained cells in the rabbit retina and comparison with other mammalian species. J Comp Neurol. 1999;413:305–326. doi: 10.1002/(SICI)1096-9861(19991018)413:2<305::AID-CNE10>3.0.CO;2-E. [DOI] [PubMed] [Google Scholar]
- Manookin MB, Weick M, Stafford BK, Demb JB. NMDA receptor contributions to visual contrast coding. Neuron. 2010;67:280–293. doi: 10.1016/j.neuron.2010.06.020. [DOI] [PMC free article] [PubMed] [Google Scholar]
- Marc RE, Jones BW, Lauritzen JS, Watt CB, Anderson JR. Building retinal connectomes. Curr Opin Neurobiol. 2012;22:568–574. doi: 10.1016/j.conb.2012.03.011. [DOI] [PMC free article] [PubMed] [Google Scholar]
- Masland RH. The neuronal organization of the retina. Neuron. 2012;76:266–280. doi: 10.1016/j.neuron.2012.10.002. [DOI] [PMC free article] [PubMed] [Google Scholar]
- Massey SC, Linn DM, Kittila CA, Mirza W. Contributions of GABAA receptors and GABAC receptors to acetylcholine release and directional selectivity in the rabbit retina. Vis Neurosci. 1997;14:939–948. doi: 10.1017/S0952523800011652. [DOI] [PubMed] [Google Scholar]
- Matsui K, Hosoi N, Tachibana M. Excitatory synaptic transmission in the inner retina: paired recordings of bipolar cells and neurons of the ganglion cell layer. J Neurosci. 1998;18:4500–4510. doi: 10.1523/JNEUROSCI.18-12-04500.1998. [DOI] [PMC free article] [PubMed] [Google Scholar]
- Menger N, Pow DV, Wässle H. Glycinergic amacrine cells of the rat retina. J Comp Neurol. 1998;401:34–46. doi: 10.1002/(SICI)1096-9861(19981109)401:1<34::AID-CNE3>3.0.CO;2-P. [DOI] [PubMed] [Google Scholar]
- Mittman S, Taylor WR, Copenhagen DR. Concomitant activation of two types of glutamate receptor mediates excitation of salamander retinal ganglion cells. J Physiol. 1990;428:175–197. doi: 10.1113/jphysiol.1990.sp018206. [DOI] [PMC free article] [PubMed] [Google Scholar]
- Monier C, Chavane F, Baudot P, Graham LJ, Frégnac Y. Orientation and direction selectivity of synaptic inputs in visual cortical neurons: a diversity of combinations produces spike tuning. Neuron. 2003;37:663–680. doi: 10.1016/S0896-6273(03)00064-3. [DOI] [PubMed] [Google Scholar]
- Murphy-Baum BL, Taylor WR. The synaptic and morphological basis of orientation selectivity in a polyaxonal amacrine cell of the rabbit retina. J Neurosci. 2015;35:13336–13350. doi: 10.1523/JNEUROSCI.1712-15.2015. [DOI] [PMC free article] [PubMed] [Google Scholar]
- Oyster CW, Takahashi E, Levick WR. Information processing in the rabbit visual system. Doc Ophthalmol. 1971;30:161–204. doi: 10.1007/BF00142519. [DOI] [PubMed] [Google Scholar]
- Passaglia CL, Troy JB, Rüttiger L, Lee BB. Orientation sensitivity of ganglion cells in primate retina. Vis Res. 2002;42:683–694. doi: 10.1016/S0042-6989(01)00312-1. [DOI] [PMC free article] [PubMed] [Google Scholar]
- Piscopo DM, El-Danaf RN, Huberman AD, Niell CM. Diverse visual features encoded in mouse lateral geniculate nucleus. J Neurosci. 2013;33:4642–4656. doi: 10.1523/JNEUROSCI.5187-12.2013. [DOI] [PMC free article] [PubMed] [Google Scholar]
- Poleg-Polsky A, Diamond JS. Imperfect space clamp permits electrotonic interactions between inhibitory and excitatory synaptic conductances, distorting voltage clamp recordings. PLoS One. 2011;6:e19463. doi: 10.1371/journal.pone.0019463. [DOI] [PMC free article] [PubMed] [Google Scholar]
- Priebe NJ, Ferster D. Mechanisms of neuronal computation in mammalian visual cortex. Neuron. 2012;75:194–208. doi: 10.1016/j.neuron.2012.06.011. [DOI] [PMC free article] [PubMed] [Google Scholar]
- Qin P, Pourcho RG. Immunocytochemical localization of kainate-selective glutamate receptor subunits GluR5, GluR6, and GluR7 in the cat retina. Brain Res. 2001;890:211–221. doi: 10.1016/S0006-8993(00)03162-0. [DOI] [PubMed] [Google Scholar]
- Reid RC, Alonso JM. Specificity of monosynaptic connections from thalamus to visual cortex. Nature. 1995;378:281–284. doi: 10.1038/378281a0. [DOI] [PubMed] [Google Scholar]
- Sagdullaev BT, McCall MA, Lukasiewicz PD. Presynaptic inhibition modulates spillover, creating distinct dynamic response ranges of sensory output. Neuron. 2006;50:923–935. doi: 10.1016/j.neuron.2006.05.015. [DOI] [PubMed] [Google Scholar]
- Schneider CA, Rasband WS, Eliceiri KW. NIH Image to ImageJ: 25 years of image analysis. Nat Methods. 2012;9:671–675. doi: 10.1038/nmeth.2089. [DOI] [PMC free article] [PubMed] [Google Scholar]
- Scholl B, Tan AY, Corey J, Priebe NJ. Emergence of orientation selectivity in the mammalian visual pathway. J Neurosci. 2013;33:10616–10624. doi: 10.1523/JNEUROSCI.0404-13.2013. [DOI] [PMC free article] [PubMed] [Google Scholar]
- Sethuramanujam S, Slaughter MM. Disinhibitory recruitment of NMDA receptor pathways in retina. J Neurophysiol. 2014;112:193–203. doi: 10.1152/jn.00817.2013. [DOI] [PMC free article] [PubMed] [Google Scholar]
- Simoncelli EP, Olshausen BA. Natural image statistics and neural representation. Annu Rev Neurosci. 2001;24:1193–1216. doi: 10.1146/annurev.neuro.24.1.1193. [DOI] [PubMed] [Google Scholar]
- Stafford BK, Manookin MB, Singer JH, Demb JB. NMDA and AMPA receptors contribute similarly to temporal processing in mammalian retinal ganglion cells. J Physiol. 2014;592:4877–4889. doi: 10.1113/jphysiol.2014.276543. [DOI] [PMC free article] [PubMed] [Google Scholar]
- Taylor WR, Smith RG. Trigger features and excitation in the retina. Curr Opin Neurobiol. 2011;21:672–678. doi: 10.1016/j.conb.2011.07.001. [DOI] [PMC free article] [PubMed] [Google Scholar]
- Taylor WR, Chen E, Copenhagen DR. Characterization of spontaneous excitatory synaptic currents in salamander retinal ganglion cells. J Physiol. 1995;486:207–221. doi: 10.1113/jphysiol.1995.sp020803. [DOI] [PMC free article] [PubMed] [Google Scholar]
- Thibos LN, Levick WR. Orientation bias of brisk-transient y-cells of the cat retina for drifting and alternating gratings. Exp Brain Res. 1985;58:1–10. doi: 10.1007/BF00238948. [DOI] [PubMed] [Google Scholar]
- Traynelis SF, Wollmuth LP, McBain CJ, Menniti FS, Vance KM, Ogden KK, Hansen KB, Yuan H, Myers SJ, Dingledine R. Glutamate receptor ion channels: structure, regulation, and function. Pharmacol Rev. 2010;62:405–496. doi: 10.1124/pr.109.002451. [DOI] [PMC free article] [PubMed] [Google Scholar]
- Trong PK, Rieke F. Origin of correlated activity between parasol retinal ganglion cells. Nat Neurosci. 2008;11:1343–1351. doi: 10.1038/nn.2199. [DOI] [PMC free article] [PubMed] [Google Scholar]
- van der Schaaf A, van Heteren J. Modelling the power spectra of natural images: statistics and information. Vision Res. 1996;28:2759–2770. doi: 10.1016/0042-6989(96)00002-8. [DOI] [PubMed] [Google Scholar]
- Vaney DI. A quantitative comparison between the ganglion cell populations and axonal outflows of the visual streak and periphery of the rabbit retina. J Comp Neurol. 1980;189:215–233. doi: 10.1002/cne.901890202. [DOI] [PubMed] [Google Scholar]
- Vaney DI, Sivyer B, Taylor WR. Direction selectivity in the retina: symmetry and asymmetry in structure and function. Nat Rev Neurosci. 2012;13:194–208. doi: 10.1038/nrn3165. [DOI] [PubMed] [Google Scholar]
- Venkataramani S, Taylor WR. Orientation selectivity in rabbit retinal ganglion cells is mediated by presynaptic inhibition. J Neurosci. 2010;30:15664–15676. doi: 10.1523/JNEUROSCI.2081-10.2010. [DOI] [PMC free article] [PubMed] [Google Scholar]
- Victor JD. The dynamics of the cat retinal X cell centre. J Physiol. 1987;386:219–246. doi: 10.1113/jphysiol.1987.sp016531. [DOI] [PMC free article] [PubMed] [Google Scholar]
- Wässle H. Parallel processing in the mammalian retina. Nat Rev Neurosci. 2004;5:747–757. doi: 10.1038/nrn1497. [DOI] [PubMed] [Google Scholar]
- Xu X, Ichida J, Shostak Y, Bonds AB, Casagrande VA. Are primate lateral geniculate nucleus (LGN) cells really sensitive to orientation or direction? Vis Neurosci. 2002;19:97–108. doi: 10.1017/s0952523802191097. [DOI] [PubMed] [Google Scholar]
- Zaghloul KA, Boahen K, Demb JB. Different circuits for ON and OFF retinal ganglion cells cause different contrast sensitivities. J Neurosci. 2003;23:2645–2654. doi: 10.1523/JNEUROSCI.23-07-02645.2003. [DOI] [PMC free article] [PubMed] [Google Scholar]
- Zhang J, Diamond JS. Subunit- and pathway-specific localization of NMDA receptors and scaffolding proteins at ganglion cell synapses in rat retina. J Neurosci. 2009;29:4274–4286. doi: 10.1523/JNEUROSCI.5602-08.2009. [DOI] [PMC free article] [PubMed] [Google Scholar]
- Zhao X, Chen H, Liu X, Cang J. Orientation-selective responses in the mouse lateral geniculate nucleus. J Neurosci. 2013;33:12751–12763. doi: 10.1523/JNEUROSCI.0095-13.2013. [DOI] [PMC free article] [PubMed] [Google Scholar]


