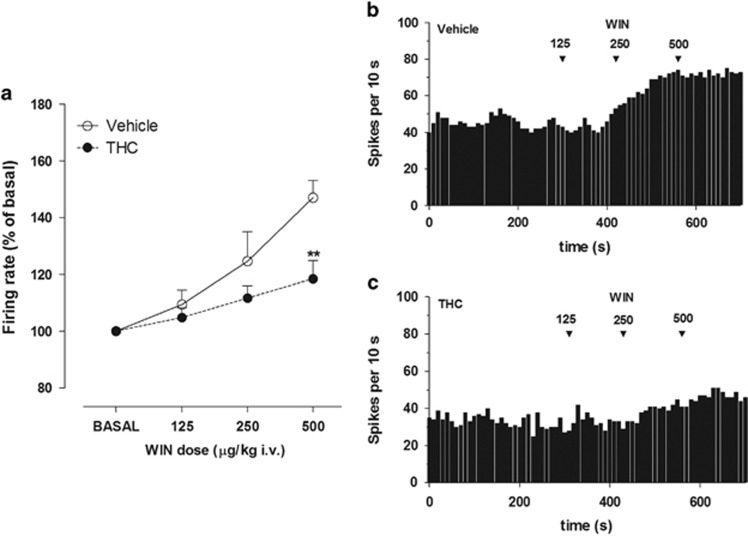
Figure 4.
(a) Dose–response curves displaying the effect of cumulative doses of WIN on the firing rate of VTA DA neurons recorded from vehicle- (n=5) and THC- exposed rats (n=6). Results are presented as mean±SEM of firing rate expressed as a percentage of baseline levels. Two-way ANOVA: **P<0.01 vs vehicle-exposed rats. Exemplificative firing rate histograms of DA neurons recorded from (b) a vehicle- and (c) a THC-exposed rat show frequency increases after systemic administration of WIN. Arrows indicate the time of injection. Numbers above arrows indicate the dosages expressed in μg/kg i.v.

