Abstract
Background
The aim of this meta-analysis was to explore the correlations of abnormal glucose metabolism (AGM) with bone mineral density (BMD) and bone metabolism.
Material/Methods
Relevant studies were identified using computerized and manual search strategies. The included studies were in strict accordance with inclusion and exclusion criteria. Statistical analyses were conducted with the Comprehensive Meta-analysis 2.0 (Biostat Inc., Englewood, NJ, USA).
Results
Our present meta-analysis initially searched 844 studies, and 7 studies were eventually incorporated in the present meta-analysis. These 7 cohort studies included 1123 subjects altogether (560 patients with AGM and 563 healthy controls). The results showed that bone mass index (BMI), insulin, and insulin resistance (IR) of patients with AGM were significantly higher than that of the population with normal glucose metabolism (BMI: SMD=1.658, 95% CI=0.663~2.654, P=0.001; insulin: SMD=0.544, 95% CI=0.030~1.058, P=0.038; IR: SMD=8.767, 95% CI=4.178~13.356, P<0.001). However, the results also indicated there was no obvious difference in osteocalcin (OC) and BMD in patients with AGM and the population with normal glucose metabolism (OC: SMD=0.293, 95% CI=−0.023~0.609, P=0.069; BMD: SMD=0.805, 95% CI=−0. 212~1.821, P=0.121).
Conclusions
Our meta-analysis results suggest that AGM might lead to increased BMI, insulin, and IR, while it has no significant correlation with BMD or bone metabolism.
MeSH Keywords: Bone Density, Glucose Metabolism Disorders, Insulin, Insulin Resistance, Osteocalcin
Background
Abnormal glucose metabolism (AGM) is a type of endocrine and metabolic disease that is clinically manifested with high levels of blood sugar maintained for a prolonged period of time [1]. It is currently established that AGM comprises distinct forms of disorders, ranging from impaired glucose regulation (IGR) to diabetes mellitus (DM) [2,3]. Epidemiological data revealed an alarming the number of individuals with AGM, which is expected to increase from the present 190 million to 366 million by 2030 worldwide [4]. In addition, a higher rate of disease occurrence is observed in Asian populations, strongly suggesting the emerging potential of AGM becoming epidemic in developing countries [5]. It is generally believed that the major risk factors for developing AGM lie in the complex interactions between genetic, psychological, and social environments [6,7]. The primary symptoms of AGM are urination frequency, polydipsia, and polyphagia, which are often accompanied by other clinical complications [8–10]. Previous studies have demonstrated that AGM preventable through a variety of strategies, including performing sufficient physical exercise and adopting a healthy diet [11].
Bone mineral density (BMD) is medically defined as the amount of mineral matter per square centimeter of bones, which also acts as an indirect indicator for the risk of developing osteoporosis and fracture in clinical medicine [12]. BMD is clinically featured by its painlessness and non-invasiveness, which involves low radiation exposure frequently performed in nuclear medicine or radiology departments in clinics or hospitals [13,14]. Various risk factors have been identified to be indicative of low BMD, including older age, vertebral abnormalities, primary hyperparathyroidism, history of eating disorders, and other additional factors [15,16]. As a lifelong process, bone metabolism is characterized by generation and substitution of new bone tissues for mature bone tissues within the skeleton [17]. It also controls bone regeneration and replacement following injuries, such as fractures and micro-damage that occur during normal activities [18]. Bone metabolism is maintained at a balanced rate through a complex crosstalk between growth and differentiation that heavily depends upon various regulatory signaling pathways, which includes hormones, cytokines, bone marrow-derived membrane, and growth factors [19–21].
AGM is a disease that includes inflammation (a factor associated with reduced BMD) and obesity (a factor related to increased BMD) [22]. Study reported that the systemic inflammation associated with the metabolic syndrome, such as AGM, may activate bone resorption and further result in reduced BMD [23]. In contrast, Mitsuyo found higher BMD among subjects with AGM, in which obesity appeared to be the main component increasing BMD [24]. However, a definitive role for AGM in BMD and bone metabolism remains to be fully elucidated, as several recent independent studies have reported discordant and seemingly conflicting results [25–28]. Higher BMD was protective in obese individuals with AGM; however, fracture risk was increased in more advanced diabetes, which may change bone quality with BMD remaining unchanged [29,30]. Weight loss is advocated in AGM patients to reduce their cardiovascular risk, but it may also reduce BMD and increase bone turnover [31,32]. AGM has some detrimental impacts on bone metabolism, and it has significant outcomes for patients with diabetes with regard to decreased BMD and increased risk of fractures [33,34]. Therefore, we performed a meta-analysis to evaluate the correlation of AGM with BMD and bone metabolism.
Material and Methods
Data sources and keywords
Research articles that addressed the correlation of AGM with BMD and bone metabolism published before September 1, 2014 were obtained by searching multiple independent computerized databases (PubMed, China BioMedicine (CBM), Embase, Web of Science, China National Knowledge Infrastructure (CNKI) and Cochrane Library), utilizing selected keywords (“glucose tolerance test” or “glucose metabolism”) and (“osteoporosis”, “OP”, “bone metabolism”, “bone density”, “bone mineral density” or “BMD”). The language of the articles was not restricted. The bibliographies within the papers were further examined manually to identify additional relevant papers.
Study selection
In order to be enrolled in our meta-analysis, published papers must meet the following selection criteria: (1) designed as clinical cohort studies regarding the correlation between AGM and BMD or bone metabolism; (2) studied patients with AGM in comparison with controls that had normal glucose metabolism; (3) had complete data available; and (4) written in Chinese or English. Exclusion criteria were: (1) lack of integrity for the literature data, (2) baseline characteristics being considerably different for the subjects between the observation and control group, and (3) repetition of published documents.
Data extraction
Relevant information from selected articles was extracted by 2 independent investigators and recorded on a predefined form. Specifically, the following data were obtained: first author, time of publication, language, disease, diagnostic criterion, age, gender, study type, country, ethnicity, study design, sample size, and intervention measures.
Quality assessment
The Newcastle-Ottawa Scale (NOS) criteria were utilized to assess the studies independently [35]. The NOS criteria are scored as: (1) group selection: whether the exposed group has adequate or pool representation (NOS01); whether the unexposed group and exposed group come from the same population (NOS02); whether the included studies have reliably recorded and structured interviews (NOS03); whether observational outcomes were described at the beginning of the selected studies(NOS04); (2) group comparability: whether the study selected the most important factors with the controls being appropriately analyzed (NOS05); whether the study controls other important confounding factors (NOS06); (3) group results: whether the study depended upon a blinded method (NOS07); whether the follow-up time was sufficient for the results to be valid (NOS08); whether there are a small number of missing subjects during the follow-up assessment despite no introduced deviation (NOS09); whether the non-response rate is the same in 2 groups (NOS10). Discrepancies for the NOS scores of the included articles were further addressed by a third reviewer by group discussion and consulting.
Statistical analysis
Our meta-analysis was carried out with Comprehensive Meta-analysis 2.0 (Biostat Inc., Englewood, New Jersey, USA). The standard mean difference (SMD) with its 95% confidence interval (95% CI) was utilized for evaluating the differences between the observation and control group. The Z test was performed to determine the significance of the overall effect value. The Cochran’s Q-statistic was used for evaluating the heterogeneity across the enrolled studies, which was further measured by I2 test (0%, no heterogeneity; 100%, maximal heterogeneity). P<0.05 was considered statistically significant [36,37]. A random-effects model was employed when heterogeneity was detected among studies, whereas a fixed-effects model was implemented in the presence of acceptable homogeneity [38]. Sensitivity analysis was conducted to assess if the results were affected after exclusion of any single selected study. The funnel plots together with the Egger’s linear regression test were constructed to determine if a publication bias was present [39].
Results
Included studies
Figure 1 presented the procedure that led to the identification and inclusion of eligible studies for our analysis. We initially retrieved a total of 844 studies after searching the electronic database combined with manual search. There were 123 duplicates, 16 non-human studies, 7 letters, reviews or meta-analysis, and 563 non-related articles that were considered ineligible and thus excluded. The remaining 135 studies were further reviewed, among which 124 were also excluded because 24 were non-cohort studies, 48 irrelevant to glucose metabolism and 52 irrelevant to bone metabolism or BMD. Since there were 4 papers among the remaining ones that lacked sufficient information, this eventually led to 7 studies being enrolled for the analysis. These ultimately selected cohort studies, published between 2005 and 2014, evaluated the correlation of AGM with BMD and bone metabolism in Asian and Caucasian populations (each in 3 studies) with a total of 1123 subjects (560 patients with AGM and 563 healthy controls) [40–46]. Among these 7 articles, 2 were performed in the USA, 2 in Greece, 2 in China, and 1 in Israel. Only 2 of these studies were in accordance with the WHO diagnostic criteria. Table 1 and Figure 2 illustrate the baseline characteristics in detail, as well as the NOS quality evaluation for the ultimately selected 7 studies.
Figure 1.
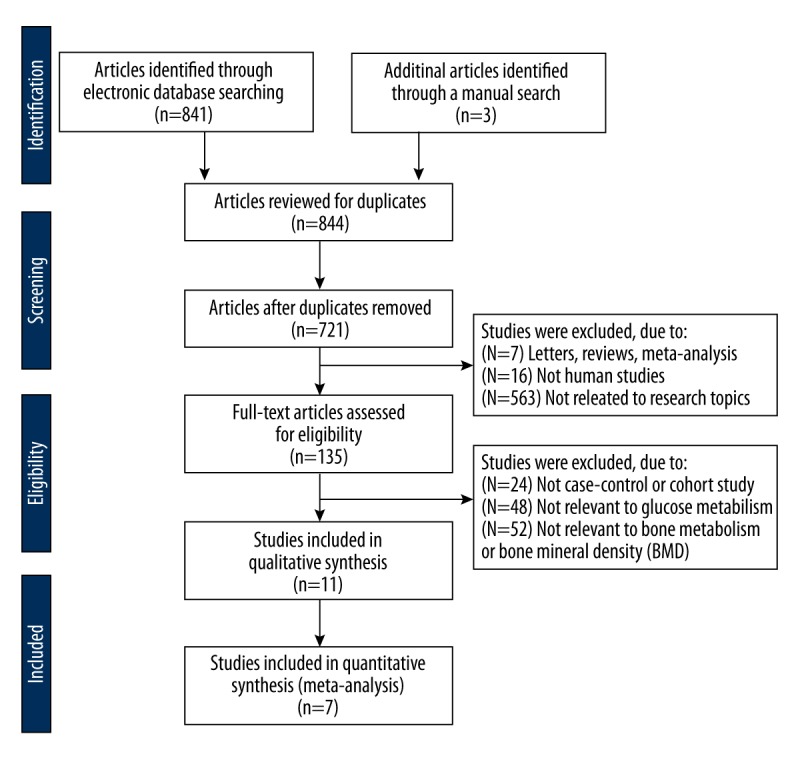
Flow chart showing the study selection procedure based upon the inclusion and exclusion criteria. This ultimately led to 7 studies being included in this meta-analysis.
Table 1.
Main characteristics and methodological quality of all eligible studies.
| First author | Year | Ethnicity | Diagnostic criteria | Gender (M/F) | Age (years) | Outcomes | ||
|---|---|---|---|---|---|---|---|---|
| Case | Control | Case | Control | |||||
| Afghani A [45] | 2005 | Caucasians | NR | 26/20 | 80/58 | 12.1±1.8 | 11.8±1.7 | BMI, BMD, glucose, insulin, IR |
| Anastasilakis A [44] | 2007 | Caucasians | NR | 0/23 | 65.6±1.8 | Glucose, insulin, IR | ||
| Hu CH [43] | 2007 | Asians | WHO | 38/24 | 34/31 | 53.2±9.1 | 52.4±10.2 | BMD, BMI |
| Rochefort GY [41] | 2011 | Asians | NR | 12/15 | NR | 9–12 | NR | BMI, BMD, insulin, Oc |
| Yavropoulou MP [40] | 2011 | Caucasians | NR | 39/79 | 28/50 | NR | NR | BMI, blood glucose, Oc |
| Liu MY [42] | 2012 | Asians | WHO | 155/0 | 70.6±2.1 | 69.4±2.4 | BMI, BMD | |
| Camhi SM-a [50] | 2014 | Caucasians | NR | 136/0 | 43.6±11.2 | 37.8±12.7 | BMD, BMI | |
| Camhi SM-b [50] | 2014 | Caucasians | 0/259 | 43.5±10.1 | 39.2±10.6 | BMD, BMI | ||
M – male; F – female; NR – not report. WHO – World Health Organization; BMI – bone mass index; BMD – bone mineral density; IR – insulin resistance; Oc – osteocalcin.
Figure 2.
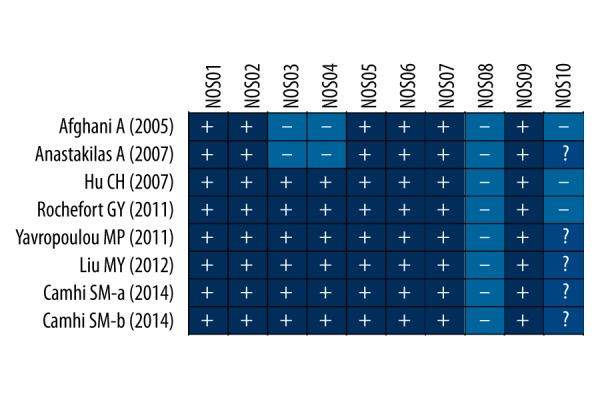
Quality assessment of the included studies by the Newcastle-Ottawa Scale scores.
Pooled outcome of meta-analysis
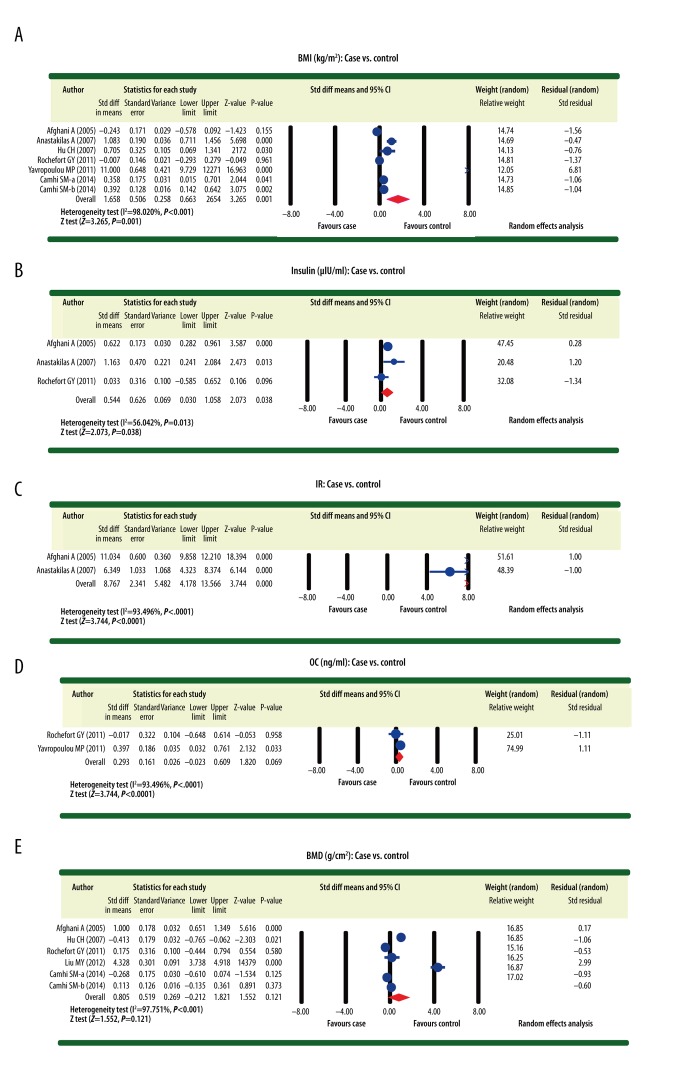
The differences with respect to body mass index (BMI), insulin, and insulin resistance (IR) between patients with AGM and healthy controls with normal glucose metabolism were reported in 6, 3, and 2 studies, respectively. Considering the heterogeneity (I2 >50%, P<0.05) detected in our analysis, a random-effects model was applied to pool the data concerning these 3 indexes. The results demonstrated that BMI, insulin, and IR for patients with AGM were significantly higher than for the control population with normal glucose metabolism (BMI: SMD=1.658, 95% CI=0. 663~2.654, P=0. 001; insulin: SMD=0.544, 95% CI=0.030~1.058, P=0.038; IR: SMD=8.767, 95% CI=4.178~13.356, P<0.001) (Figure 3A–3C). On the other hand, the differences with respect to osteocalcin (OC) and BMD between patients with AGM and the population with normal glucose metabolism were reported in 2 and 5 studies, respectively. Accordingly, a random-effects model was also applied to pool the data of these 2 indexes given the detected heterogeneity (I2 > 50%, P < 0.05). However, the results revealed no significant difference concerning the OC and BMD in patients with AGM and the control subjects with normal glucose metabolism (OC: SMD=0.293, 95% CI=−0.023~0.609, P=0.069; BMD: SMD=0.805, 95% CI=−0. 212~1.821, P=0. 121) (Figure 3D, 3E).
Figure 3.
Forest plots illustrating the differences for osteocalcin, bone mineral density, body mass index, insulin, and insulin resistance between patients with abnormal glucose metabolism and healthy controls with normal glucose metabolism ((A) Body mass index (case vs. control); (B) Insulin (case vs. control); (C) Insulin resistance (case vs. control); (D) Osteocalcin (case vs. control); (E) Bone mineral density (case vs. control)).
Sensitivity analysis and publication bias
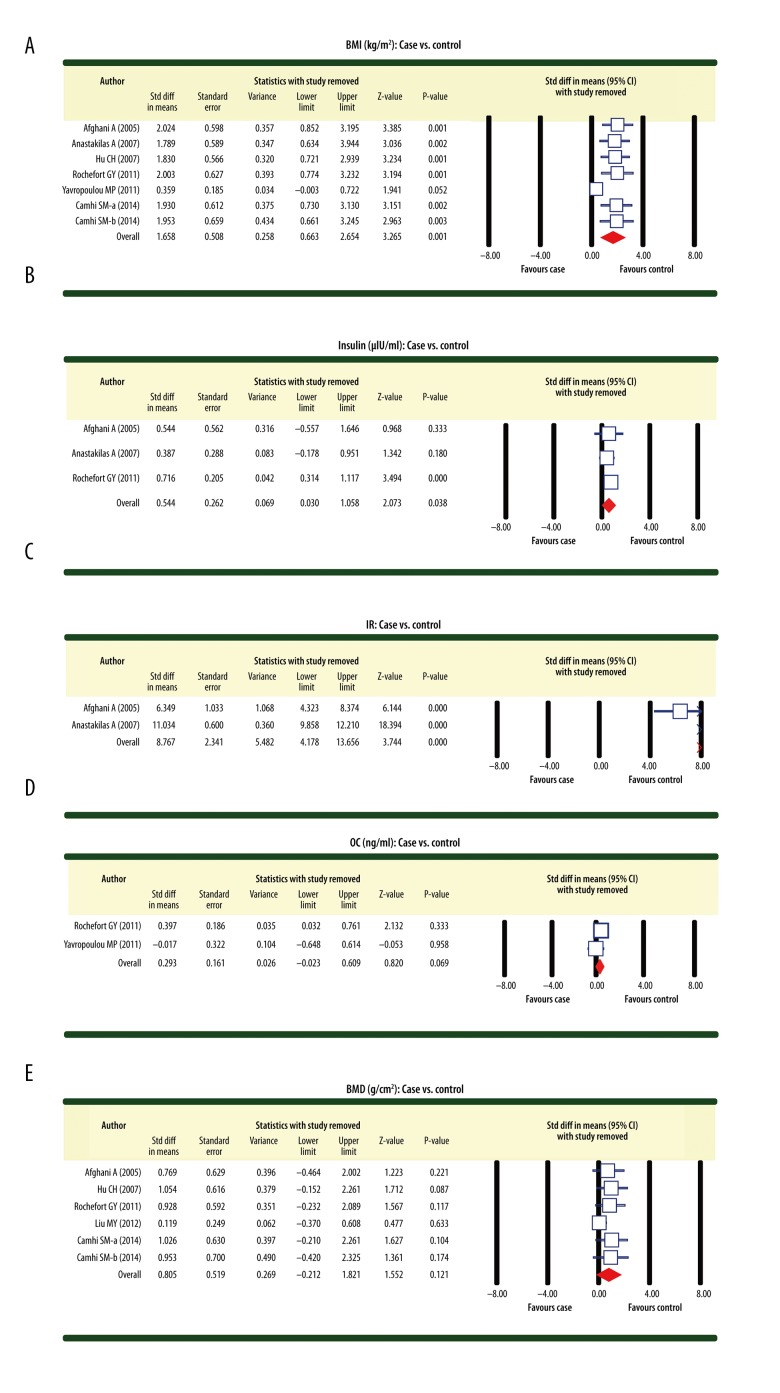
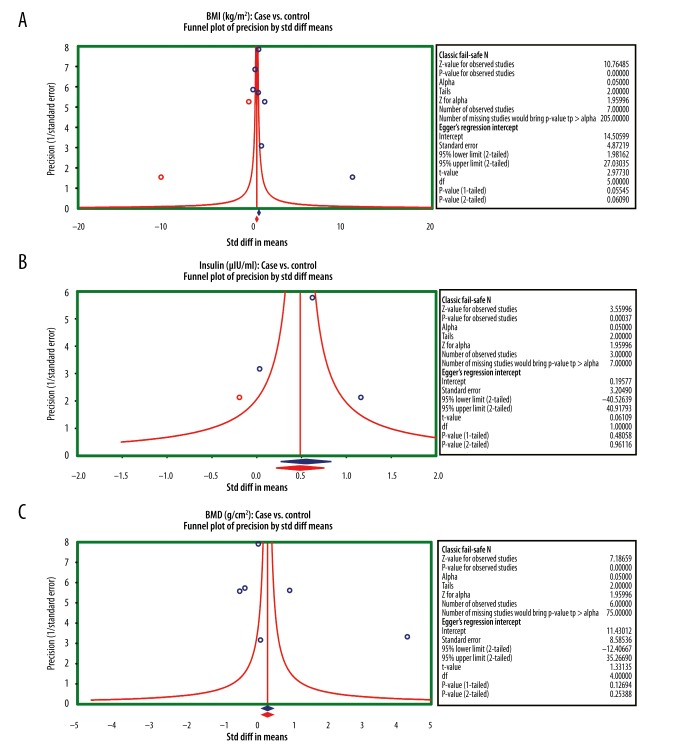
Using the sensitivity analysis in our investigation, we revealed that removal of any single included study had a negligible impact on our findings, indicating the stability of our analysis. Results from the sensitivity analysis suggested that all included studies had no detected effect on the merging effect value SMD of the correlation between AGM and BMD or bone metabolism (Figure 4A–4E). The symmetrical funnel plots for all 7 studies did not support the presence of a publication bias. This was further corroborated by the Egger linear regression analysis (all P>0.05) (Figure 5A–5C).
Figure 4.
Sensitivity analyses regarding the differences for osteocalcin, bone mineral density, body mass index, insulin, and insulin resistance between patients with abnormal glucose metabolism and healthy controls with normal glucose metabolism ((A) Body mass index (case vs. control); (B) Insulin (case vs. control); (C) Insulin resistance (case vs. control); (D) Osteocalcin (case vs. control); (E) Bone mineral density (case vs. control)).
Figure 5.
Funnel plots to detect a potential publication bias on the differences for osteocalcin, bone mineral density, body mass index, insulin, and insulin resistance between patients with abnormal glucose metabolism and healthy controls with normal glucose metabolism ((A) Body mass index (case vs. control); (B) Insulin (case vs. control); (C) Bone mineral density (case vs. control)).
Discussion
To definitively explore the correlation of AGM with BMD and bone metabolism, a systematical meta-analysis was performed. Based on the experimental data obtained from previous studies, our meta-analysis revealed that BMI, insulin, and IR for patients with AGM were significantly higher than for healthy individuals with normal glucose metabolism, implying that AGM might lead to increased BMI, insulin, and IR. BMI is frequently utilized as a technically straightforward and easily interpreted method to assess the extent to which an individual’s height-corrected body weight deviates from normal [47]. According to the WHO criteria, BMI less than 18.5 is considered as underweight, which indicates potential health problems such as possible malnutrition and eating disorders; in contrast, BMI greater than 25 is considered as overweight, especially for those who may be obese with BMI above 30 [48]. As a peptide hormone secreted by the beta cells in the pancreas, insulin plays an indispensible role in regulating the metabolism of carbohydrates and fats. Mechanistically, insulin exerts it physiological functions by facilitating the absorption of glucose from blood to fat tissues and skeletal muscles and simultaneously promoting fat deposition with suppressed energy consumption [49,50]. Insulin induces a variety of increased (glycogen synthesis, lipid synthesis, amino acid and potassium uptake and esterification of fatty acids) and decreased (proteolysis, lipolysis, gluconeogenesis and autophagy) cellular activities [51,52]. However, there are aberrant conditions when cells are unable to biologically respond to insulin, resulting in metabolic syndromes and DM, which is medically defined as IR [53]. Intriguingly, the physiological consequences of IR seem to be context-dependent. For example, IR in muscle and fat cells compromises glucose uptake, whereas IR in liver cells diminishes synthesis and storage of glycogens and causes failed suppression of production and release of glucose into the blood [54]. In line with this, our meta-analysis postulated that increased BMI, insulin, and IR are closely associated with AGM.
To further explore the correlation between AGM and other indexes, a subgroup meta-analysis was subsequently conducted with more accuracy and rigorousness. The selected indexes included OC and BMD. Interestingly, the stratified analysis indicated that OC was not significantly different between patients with AGM and healthy controls with normal glucose metabolism. Meanwhile, BMD was also not significantly different between patients with AGM and healthy individuals with normal glucose metabolism. Taken together, our findings are in line with previous studies that consistently showed no detectable correlation of AGM with OC and BMD.
Similar to other published meta-analysis, we also acknowledged several limitations in the current meta-analysis. Firstly, our analysis was severely limited by the number of the included studies, which might not accurately and strictly represent a suitable dataset for the statistical analysis. Secondly, the sample size in the enrolled studies was relatively small, which might not provide sufficiently valid data for our results. A third limitation lies in the potential language bias in our selection procedure, since only those studies published in English and Chinese were included. Notably, we identified only 2 eligible studies published in Chinese from those 7 studies. Last but not least, our analysis was restricted by the selection procedure for controls, which was only population-based and might not represent the entire general population.
Conclusions
In summary, our meta-analysis indicates that GM might lead to increased BMI, insulin, and IR. In contrast, it has no significant correlation with BMD or bone metabolism.
Acknowledgments
We would like to acknowledge the reviewers for their helpful comments on this paper.
Footnotes
Source of support: Departmental sources
Competing interests
The authors have declared that no competing interests exist.
References
- 1.Kim CH, Kim HK, Bae SJ, et al. Association of elevated serum ferritin concentration with insulin resistance and impaired glucose metabolism in Korean men and women. Metabolism. 2011;60:414–20. doi: 10.1016/j.metabol.2010.03.007. [DOI] [PubMed] [Google Scholar]
- 2.Pan HY, Guo L, Li Q. Changes of serum omentin-1 levels in normal subjects and in patients with impaired glucose regulation and with newly diagnosed and untreated type 2 diabetes. Diabetes Res Clin Pract. 2010;88:29–33. doi: 10.1016/j.diabres.2010.01.013. [DOI] [PubMed] [Google Scholar]
- 3.Zhang H, Dellsperger KC, Zhang C. The link between metabolic abnormalities and endothelial dysfunction in type 2 diabetes: an update. Basic Res Cardiol. 2012;107:237. doi: 10.1007/s00395-011-0237-1. [DOI] [PMC free article] [PubMed] [Google Scholar]
- 4.Chen L, Magliano DJ, Zimmet PZ. The worldwide epidemiology of type 2 diabetes mellitus – present and future perspectives. Nat Rev Endocrinol. 2012;8:228–36. doi: 10.1038/nrendo.2011.183. [DOI] [PubMed] [Google Scholar]
- 5.Peairs KS, Barone BB, Snyder CF, et al. Diabetes mellitus and breast cancer outcomes: a systematic review and meta-analysis. J Clin Oncol. 2011;29:40–46. doi: 10.1200/JCO.2009.27.3011. [DOI] [PMC free article] [PubMed] [Google Scholar]
- 6.de Mello VD, Schwab U, Kolehmainen M, et al. A diet high in fatty fish, bilberries and wholegrain products improves markers of endothelial function and inflammation in individuals with impaired glucose metabolism in a randomised controlled trial: the Sysdimet study. Diabetologia. 2011;54:2755–67. doi: 10.1007/s00125-011-2285-3. [DOI] [PubMed] [Google Scholar]
- 7.Brunner EJ, Kivimaki M. Epidemiology: work-related stress and the risk of type 2 diabetes mellitus. Nat Rev Endocrinol. 2013;9:449–50. doi: 10.1038/nrendo.2013.124. [DOI] [PubMed] [Google Scholar]
- 8.Volarevic V, Arsenijevic N, Lukic ML, Stojkovic M. Concise review: Mesenchymal stem cell treatment of the complications of diabetes mellitus. Stem Cells. 2011;29:5–10. doi: 10.1002/stem.556. [DOI] [PMC free article] [PubMed] [Google Scholar]
- 9.Folli F, Corradi D, Fanti P, et al. The role of oxidative stress in the pathogenesis of type 2 diabetes mellitus micro- and macrovascular complications: avenues for a mechanistic-based therapeutic approach. Curr Diabetes Rev. 2011;7:313–24. doi: 10.2174/157339911797415585. [DOI] [PubMed] [Google Scholar]
- 10.Garcia-Bailo B, El-Sohemy A, Haddad PS, et al. Vitamins D, C, and E in the prevention of type 2 diabetes mellitus: modulation of inflammation and oxidative stress. Biologics. 2011;5:7–19. doi: 10.2147/BTT.S14417. [DOI] [PMC free article] [PubMed] [Google Scholar]
- 11.Kengne AP, Sobngwi E, Echouffo-Tcheugui JB, Mbanya JC. New insights on diabetes mellitus and obesity in Africa-Part 2: prevention, screening and economic burden. Heart. 2013;99:1072–77. doi: 10.1136/heartjnl-2013-303773. [DOI] [PubMed] [Google Scholar]
- 12.Kalluru R, Ames R, Mason B, et al. Bone density in healthy men after cessation of calcium supplements: 20-month follow-up of a randomized controlled trial. Osteoporos Int. 2015;26:173–78. doi: 10.1007/s00198-014-2896-x. [DOI] [PubMed] [Google Scholar]
- 13.Riggs BL, Khosla S, Melton LJ., III Better tools for assessing osteoporosis. J Clin Invest. 2012;122:4323–24. doi: 10.1172/JCI66746. [DOI] [PMC free article] [PubMed] [Google Scholar]
- 14.Winzenberg T, Powell S, Shaw KA, Jones G. Effects of vitamin D supplementation on bone density in healthy children: systematic review and meta-analysis. BMJ. 2011;342:c7254. doi: 10.1136/bmj.c7254. [DOI] [PMC free article] [PubMed] [Google Scholar]
- 15.Warriner AH, Outman RC, Feldstein AC, et al. Effect of self-referral on bone mineral density testing and osteoporosis treatment. Med Care. 2014;52:743–50. doi: 10.1097/MLR.0000000000000170. [DOI] [PMC free article] [PubMed] [Google Scholar]
- 16.Edmonds SW, Solimeo SL, Lu X, et al. Developing a bone mineral density test result letter to send to patients: a mixed-methods study. Patient Prefer Adherence. 2014;8:827–41. doi: 10.2147/PPA.S60106. [DOI] [PMC free article] [PubMed] [Google Scholar]
- 17.Sheu Y, Cauley JA. The role of bone marrow and visceral fat on bone metabolism. Curr Osteoporos Rep. 2011;9:67–75. doi: 10.1007/s11914-011-0051-6. [DOI] [PMC free article] [PubMed] [Google Scholar]
- 18.Kanno Y, Ishisaki A, Kawashita E, et al. Plasminogen/plasmin modulates bone metabolism by regulating the osteoblast and osteoclast function. J Biol Chem. 2011;286:8952–60. doi: 10.1074/jbc.M110.152181. [DOI] [PMC free article] [PubMed] [Google Scholar]
- 19.Merle B, Garnero P. The multiple facets of periostin in bone metabolism. Osteoporos Int. 2012;23:1199–212. doi: 10.1007/s00198-011-1892-7. [DOI] [PubMed] [Google Scholar]
- 20.Nappi C, Bifulco G, Tommaselli GA, et al. Hormonal contraception and bone metabolism: a systematic review. Contraception. 2012;86:606–21. doi: 10.1016/j.contraception.2012.04.009. [DOI] [PubMed] [Google Scholar]
- 21.Hernandez JL, Olmos JM, Pariente E, et al. Metabolic syndrome and bone metabolism: the Camargo Cohort study. Menopause. 2010;17:955–61. doi: 10.1097/gme.0b013e3181e39a15. [DOI] [PubMed] [Google Scholar]
- 22.von Muhlen D, Safii S, Jassal SK, et al. Associations between the metabolic syndrome and bone health in older men and women: the Rancho Bernardo Study. Osteoporos Int. 2007;18:1337–44. doi: 10.1007/s00198-007-0385-1. [DOI] [PubMed] [Google Scholar]
- 23.Rhee EJ, Kim YC, Lee WY, et al. Comparison of insulin resistance and serum high-sensitivity C-reactive protein levels according to the fasting blood glucose subgroups divided by the newly recommended criteria for fasting hyperglycemia in 10059 healthy Koreans. Metabolism. 2006;55:183–87. doi: 10.1016/j.metabol.2005.08.010. [DOI] [PubMed] [Google Scholar]
- 24.Kinjo M, Setoguchi S, Solomon DH. Bone mineral density in adults with the metabolic syndrome: analysis in a population-based U.S. sample. J Clin Endocrinol Metab. 2007;92:4161–64. doi: 10.1210/jc.2007-0757. [DOI] [PubMed] [Google Scholar]
- 25.Kashiwagi A, Fein MJ, Shimada M. A high fat diet-induced impaired glucose metabolism in mice with targeted deletion of calpain in osteoblasts. Biochem Biophys Res Commun. 2011;409:235–40. doi: 10.1016/j.bbrc.2011.04.134. [DOI] [PMC free article] [PubMed] [Google Scholar]
- 26.Motyl KJ, McCabe LR, Schwartz AV. Bone and glucose metabolism: a two-way street. Arch Biochem Biophys. 2010;503:2–10. doi: 10.1016/j.abb.2010.07.030. [DOI] [PMC free article] [PubMed] [Google Scholar]
- 27.Saarinen A, Saukkonen T, Kivela T, et al. Low density lipoprotein receptor-related protein 5 (LRP5) mutations and osteoporosis, impaired glucose metabolism and hypercholesterolaemia. Clin Endocrinol (Oxf) 2010;72:481–88. doi: 10.1111/j.1365-2265.2009.03680.x. [DOI] [PubMed] [Google Scholar]
- 28.Bone HG, McClung MR, Roux C, et al. Odanacatib, a cathepsin-K inhibitor for osteoporosis: a two-year study in postmenopausal women with low bone density. J Bone Miner Res. 2010;25:937–47. doi: 10.1359/jbmr.091035. [DOI] [PubMed] [Google Scholar]
- 29.Khazai NB, Beck GR, Jr, Umpierrez GE. An overshadowed association. Curr Opin Endocrinol Diabetes Obes. 2009;16:435–45. doi: 10.1097/MED.0b013e328331c7eb. [DOI] [PMC free article] [PubMed] [Google Scholar]
- 30.Vestergaard P, Rejnmark L, Mosekilde L. Relative fracture risk in patients with diabetes mellitus, and the impact of insulin and oral antidiabetic medication on relative fracture risk. Diabetologia. 2005;48:1292–99. doi: 10.1007/s00125-005-1786-3. [DOI] [PubMed] [Google Scholar]
- 31.Riedt CS, Cifuentes M, Stahl T, et al. Overweight postmenopausal women lose bone with moderate weight reduction and 1 g/day calcium intake. J Bone Miner Res. 2005;20:455–63. doi: 10.1359/JBMR.041132. [DOI] [PMC free article] [PubMed] [Google Scholar]
- 32.De Laet C, Kanis JA, Oden A, et al. Body mass index as a predictor of fracture risk: a meta-analysis. Osteoporos Int. 2005;16:1330–38. doi: 10.1007/s00198-005-1863-y. [DOI] [PubMed] [Google Scholar]
- 33.Vestergaard P. Discrepancies in bone mineral density and fracture risk in patients with type 1 and type 2 diabetes – a meta-analysis. Osteoporos Int. 2007;18:427–44. doi: 10.1007/s00198-006-0253-4. [DOI] [PubMed] [Google Scholar]
- 34.Blumsohn A, Marin F, Nickelsen T, et al. Early changes in biochemical markers of bone turnover and their relationship with bone mineral density changes after 24 months of treatment with teriparatide. Osteoporos Int. 2011;22:1935–46. doi: 10.1007/s00198-010-1379-y. [DOI] [PMC free article] [PubMed] [Google Scholar]
- 35.Stang A. Critical evaluation of the Newcastle-Ottawa scale for the assessment of the quality of nonrandomized studies in meta-analyses. Eur J Epidemiol. 2010;25:603–5. doi: 10.1007/s10654-010-9491-z. [DOI] [PubMed] [Google Scholar]
- 36.Jackson D, White IR, Riley RD. Quantifying the impact of between-study heterogeneity in multivariate meta-analyses. Stat Med. 2012;31:3805–20. doi: 10.1002/sim.5453. [DOI] [PMC free article] [PubMed] [Google Scholar]
- 37.Peters JL, Sutton AJ, Jones DR, et al. Comparison of two methods to detect publication bias in meta-analysis. JAMA. 2006;295:676–80. doi: 10.1001/jama.295.6.676. [DOI] [PubMed] [Google Scholar]
- 38.Zintzaras E, Ioannidis JP. Heterogeneity testing in meta-analysis of genome searches. Genet Epidemiol. 2005;28:123–37. doi: 10.1002/gepi.20048. [DOI] [PubMed] [Google Scholar]
- 39.Zintzaras E, Ioannidis JP. HEGESMA: genome search meta-analysis and heterogeneity testing. Bioinformatics. 2005;21:3672–73. doi: 10.1093/bioinformatics/bti536. [DOI] [PubMed] [Google Scholar]
- 40.Liu MY, Li CL, Xiao HJ, et al. The feature of bone mineral density and body fat in elderly males with metabolic syndrome of abnormal glucose metabolism. Chinese Journal of Osteoporosis. 2012;18:408–11. [Google Scholar]
- 41.Yavropoulou MP, Tomos K, Tsekmekidou X, et al. Response of biochemical markers of bone turnover to oral glucose load in diseases that affect bone metabolism. Eur J Endocrinol. 2011;164:1035–41. doi: 10.1530/EJE-11-0128. [DOI] [PubMed] [Google Scholar]
- 42.Rochefort GY, Rocher E, Aveline PC, et al. Osteocalcin-insulin relationship in obese children: a role for the skeleton in energy metabolism. Clin Endocrinol (Oxf) 2011;75:265–70. doi: 10.1111/j.1365-2265.2011.04031.x. [DOI] [PubMed] [Google Scholar]
- 43.Hu CH, Zhu SW, Liu JH. Clinical observation on changes of bone mineral density by impaired glucose tolerance in 62 cases. Chinese General Practice. 2007;10:1025–26. [Google Scholar]
- 44.Anastasilakis A, Goulis DG, Koukoulis G, et al. Acute and chronic effect of teriparatide on glucose metabolism in women with established osteoporosis. Exp Clin Endocrinol Diabetes. 2007;115:108–11. doi: 10.1055/s-2007-967090. [DOI] [PubMed] [Google Scholar]
- 45.Afghani A, Cruz ML, Goran MI. Impaired glucose tolerance and bone mineral content in overweight latino children with a family history of type 2 diabetes. Diabetes Care. 2005;28:372–78. doi: 10.2337/diacare.28.2.372. [DOI] [PubMed] [Google Scholar]
- 46.Camhi SM, Katzmarzyk PT. Differences in body composition between metabolically healthy obese and metabolically abnormal obese adults. Int J Obes (Lond) 2014;38:1142–45. doi: 10.1038/ijo.2013.208. [DOI] [PMC free article] [PubMed] [Google Scholar]
- 47.Flegal KM, Carroll MD, Kit BK, Ogden CL. Prevalence of obesity and trends in the distribution of body mass index among US adults, 1999–2010. JAMA. 2012;307:491–97. doi: 10.1001/jama.2012.39. [DOI] [PubMed] [Google Scholar]
- 48.Finucane MM, Stevens GA, Cowan MJ, et al. National, regional, and global trends in body-mass index since 1980: systematic analysis of health examination surveys and epidemiological studies with 960 country-years and 9.1 million participants. Lancet. 2011;377:557–67. doi: 10.1016/S0140-6736(10)62037-5. [DOI] [PMC free article] [PubMed] [Google Scholar]
- 49.Dimitriadis G, Mitrou P, Lambadiari V, et al. Insulin effects in muscle and adipose tissue. Diabetes Res Clin Pract. 2011;93(Suppl 1):S52–59. doi: 10.1016/S0168-8227(11)70014-6. [DOI] [PubMed] [Google Scholar]
- 50.Shreenivas AV, Leung V. A rare case of insulinoma presenting with postprandial hypoglycemia. Am J Case Rep. 2014;15:488–91. doi: 10.12659/AJCR.891336. [DOI] [PMC free article] [PubMed] [Google Scholar]
- 51.Menting JG, Whittaker J, Margetts MB, et al. How insulin engages its primary binding site on the insulin receptor. Nature. 2013;493:241–45. doi: 10.1038/nature11781. [DOI] [PMC free article] [PubMed] [Google Scholar]
- 52.Mainali NR, Schmidt TR, Alweis R, George DL. Novel development of remitting seronegative symmetrical synovitis with pitting edema (RS3PE) syndrome due to insulin therapy. Am J Case Rep. 2014;15:119–22. doi: 10.12659/AJCR.890318. [DOI] [PMC free article] [PubMed] [Google Scholar]
- 53.Samuel VT, Shulman GI. Mechanisms for insulin resistance: common threads and missing links. Cell. 2012;148:852–71. doi: 10.1016/j.cell.2012.02.017. [DOI] [PMC free article] [PubMed] [Google Scholar]
- 54.Hazlehurst JM, Gathercole LL, Nasiri M, et al. Glucocorticoids fail to cause insulin resistance in human subcutaneous adipose tissue in vivo. J Clin Endocrinol Metab. 2013;98:1631–40. doi: 10.1210/jc.2012-3523. [DOI] [PubMed] [Google Scholar]


