

Abstract
Aims/hypotheses
Obesity is associated with decreased insulin sensitivity (IS) and elevated plasma branched-chain amino acids (BCAAs). The purpose of this study was to investigate the relationship between BCAA metabolism and IS in overweight (OW) individuals during exercise intervention.
Methods
Whole-body leucine turnover, IS by hyperinsulinaemic–euglycaemic clamp, and circulating and skeletal muscle amino acids, branched-chain α-keto acids and acylcarnitines were measured in ten healthy controls (Control) and nine OW, untrained, insulin-resistant individuals (OW-Untrained). OW-Untrained then underwent a 6 month aerobic and resistance exercise programme and repeated testing (OW-Trained).
Results
IS was higher in Control vs OW-Untrained and increased significantly following exercise. IS was lower in OW-Trained vs Control expressed relative to body mass, but was not different from Control when normalised to fat-free mass (FFM). Plasma BCAAs and leucine turnover (relative to FFM) were higher in OW-Untrained vs Control, but did not change on average with exercise. Despite this, within individuals, the decrease in molar sum of circulating BCAAs was the best metabolic predictor of improvement in IS. Circulating glycine levels were higher in Control and OW-Trained vs OW-Untrained, and urinary metabolic profiling suggests that exercise induces more efficient elimination of excess acyl groups derived from BCAA and aromatic amino acid (AA) metabolism via formation of urinary glycine adducts.
Conclusions/interpretation
A mechanism involving more efficient elimination of excess acyl groups derived from BCAA and aromatic AA metabolism via glycine conjugation in the liver, rather than increased BCAA disposal through oxidation and turnover, may mediate interactions between exercise, BCAA metabolism and IS.
Trial registration
Keywords: Branched-chain amino acids, Exercise, Insulin resistance, Metabolomics, Obesity, Protein
Introduction
Obesity is characterised by metabolic aberrations, including insulin resistance (IR) and impaired macronutrient metabolism. Traditionally, attention has focused on the interplay of glucose and lipid metabolism in obesity-associated metabolic diseases. More recently, studies involving comprehensive metabolic profiling—or ‘metabolomics’—have highlighted the importance of protein metabolism in the aetiology of such disorders [1]. Although obesity is associated with elevated plasma levels of certain amino acids (AAs), including the branched-chain AAs (BCAAs), phenylalanine and tyrosine [2–4], their source and contribution to the development of IR remain unclear.
We previously identified a plasma signature composed of the BCAAs, their acylcarnitine metabolites (C3 and C5), and aromatic AAs phenylalanine and tyrosine that distinguishes lean from obese individuals, is strongly associated with IR and implicates altered flux through BCAA catabolic pathways in obesity [5–7]. Further, a similar group of metabolites measured at baseline predicts improvement of IR in response to moderate weight loss [8] and is prognostic for future development of type 2 diabetes in normoglycaemic individuals [9]. In muscle, a commonly observed signature of obesity and IR is the accumulation of a broad array of acylcarnitines, derived from mitochondrial oxidation of lipids, glucose and AAs [10, 11]. One model proposes that diet-induced obesity leads to a compensatory increase in β-oxidation in skeletal muscle, but without a coordinate increase in capacity of the tricarboxylic acid (TCA) cycle and electron transport chain (ETC), resulting in accumulation of incompletely oxidised lipid species (represented by acylcarnitines) in muscle mitochondria [10, 11]. Further, accumulation of acylcarnitines is associated with mitochondrial stress and impaired insulin action [10, 11]. Consistent with this model, BCAA consumption potentiates high-fat diet-induced accumulation of acylcarnitines in rodent skeletal muscle [5].
Skeletal muscle is a major site of insulin action [12], and thus, a practical target for therapeutic interventions to improve insulin sensitivity (IS). Exercise is a readily available and effective intervention for improving metabolic dysfunction in obesity [7, 13]. Both aerobic and resistance exercise have been shown to enhance oxidative potential by increasing mitochondrial density and/or function [14, 15], and resistance exercise stimulates muscle protein turnover, generally improving net protein balance [16]. We designed a study to test the impact of a combined aerobic and resistance exercise regimen on BCAA and acylcarnitine homeostasis and IS in overweight (OW), insulin-resistant individuals. We hypothesised that the combined exercise programme would drive BCAAs into exercising muscle for oxidation in response to both components, and for protein synthesis in response to the resistance component, consuming excess plasma AAs and improving plasma and muscle AA and acylcarnitine profiles, with associated improvements in IS.
Methods
Participants
We studied 23 individuals who qualified as lean controls (Control; BMI ≤24.9, no activity restrictions) or overweight, insulin-resistant and untrained (OW; BMI 25–≤35.4, exercise <2 days/week). Experimental procedures were approved by the Institutional Review Board at Duke University Medical Center (which is in compliance with the Declaration of Helsinki, revised in 1983). All participants provided informed, written consent prior to enrolment. Participants completed testing at baseline (Control, OW-Untrained), and OW repeated testing following a 6-month exercise intervention (OW-Trained). Four OW participants (one man and three women) did not complete the exercise intervention and were only included in OW-Untrained. See Electronic Supplementary Materials (ESM) Methods.
Experimental design
Screening visits and study timeline are shown in ESM Fig. 1. Participants underwent an OGTT to qualify for the Control (BMI≤24.9, no activity restrictions, fasting plasma glucose [FPG] ≤5.5, 2 h plasma glucose ≤7.72 mmol/l) or OW (BMI 25 to ≤35.4, exercise <2 days/week, FPG 5.83 to <7 mmol/l, 2 h glucose 7.8 to <11.1 mmol/l) groups. On separate days (≥13 days apart), whole-body leucine turnover was measured, and hyperinsulinaemic–euglycaemic clamps were used to assess IS.
Protein turnover
Following ingestion of a standardised evening meal and overnight fast, participants reported to the clinic at 08:00 hours (Fig. 1). A basal urine sample was obtained. Catheters were inserted into an antecubital vein for stable-isotope tracer infusion and in a vein of the opposite hand for heated (arterialised) blood sampling. Following collection of baseline blood and breath samples, primed, continuous infusions of 1-[13C]leucine and ring-[2H5]phenylalanine were initiated and continued through the study. Nutrition assessment and other details can be found in ESM Methods.
Fig. 1.
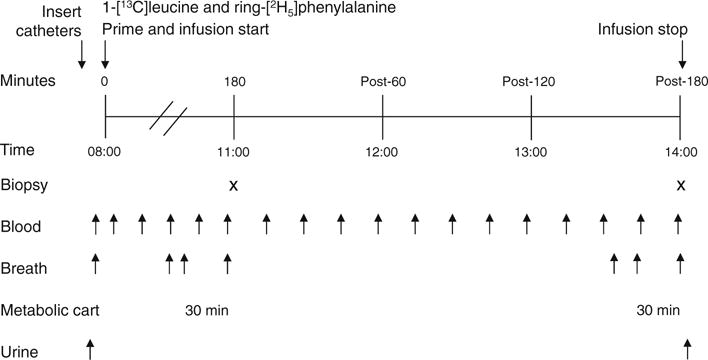
Protocol for measurement of whole-body protein turnover. X indicates muscle biopsy and arrows below the figure show time points for blood, breath and urine samples
Hyperinsulinaemic–euglycaemic clamp
Procedures were standard for hyperinsulinaemic–euglycaemic clamp. See ESM Fig. 2 and ESM Methods.
Plasma and breath analyses
A targeted, MS-based platform (MS-MS) was used to measure a total of 15 AAs and 45 acylcarnitines in plasma [5, 17]. Alpha-keto acids of leucine (α-keto-isocaproate, α-KIC), isoleucine (α-keto-β-methylvalerate, α-KMV) and valine (α-keto-valerate, KIV) were measured as previously described [18]. Plasma α-KIC, leucine and phenylalanine tracer-to-tracee ratios were determined on their tert-butyldimethylsilyl derivatives by GC-MS (6890 GC/5975B inert XL EI/CI MSD; Agilent Technologies, Santa Clara, CA, USA) [19, 20]. See Methods for additional plasma analyses information. 13CO2 isotopic enrichments in breath samples were measured by a GC-isotope ratio MS (DeltaPlus XP with Gas Bench II; Thermo Scientific, Waltham, MA, USA).
Muscle and urine analyses
Following saline rinse and removal of visible fat and connective tissue, muscle biopsies were immediately flash frozen in liquid nitrogen and stored at −80°C. Fifteen AAs, 66 acylcarnitines, 26 ceramides and seven acyl-CoAs were analysed by MS-MS, and seven organic acids by GC-MS [21–23]. ATP, creatine and phosphocreatine content were determined as described [24]. Urine samples were analysed by GC-MS using a non-targeted approach [25, 26]. See ESM Methods.
Calculations
Calculations were made in the steady state. During hyperinsulinaemic–euglycaemic clamp, glucose infusion rate (GIR) was averaged over 30 min of steady state euglycaemia, generally the final 30 min. Standard equations were used to calculate leucine rate of appearance (Ra), leucine oxidation and non-oxidative leucine disposal (NOLD) [20, 27]. See ESM Methods.
Exercise training
OW individuals participated in a 6 month training programme that included aerobic training three to four sessions/week (50,201 kJ/week at 65–80% peak oxygen consumption [ ]) and whole-body resistance training on eight machines. The adherence goal was 80% for both components. See ESM Methods.
Statistical methods
Values are expressed as means±SEM. Unpaired Student’s t tests were used to compare OW groups to Controls, and paired t tests were used to compare OW-Untrained to OW-Trained. As this type of analysis is exploratory in nature and measures large numbers of metabolites, two-sided p values unadjusted for multiple comparisons are presented [8, 28, 29]. For metabolic profiling data with large numbers of comparisons (conventional metabolites, AAs, acylcarnitines, etc.), p≤0.01 was considered significant. For statistical tests of other measures (protein turnover, creatine, clamp, α-keto acids, etc.), p≤0.05 was considered significant. Alpha levels are indicated in table and figure legends.
Principal components analysis (PCA) was used to reduce the large number of metabolites to a smaller number of factors [5, 8, 29, 30]. Factors that were correlated (r2 > 0.3) with HOMA-IR and/or clamp GIR were retained for further analysis. Pearson’s correlation coefficients were used to assess the correlation between HOMA-IR and GIR with metabolic factors and groups of metabolites. If a variable was not normally distributed, Spearman’s correlation test was used. Statistical analyses were performed using SAS version 9.3 (SAS Institute, Cary, NC, USA). See ESM Methods.
Results
Physical characteristics and physiological measures
OW-Untrained participants were OW or class I obese (BMI 25.00–29.99 or 30.00–34.99 kg m−2) (Table 1). Other physical characteristics are reported in Table 1.
Table 1.
Physical characteristics, physiological measures, dietary intake and exercise training
| Control | OW-Untrained | OW-Trained | |
|---|---|---|---|
| Participant characteristics | n=10 | n=13 | n=9 |
| Age (years) | 50±3 | 52±2 | 52±2 |
| Women (%) | 50 | 54 | 44 |
| Body mass (kg) | 65.3±2.7 | 87.3±3.7** | 86.3±5.2** |
| BMI (kg/m2) | 22.6±0.5 | 30.9±0.8** | 30.3±0.8** |
| FFM (%) | 78±3 | 61±2** | 64±2**,†† |
| Fat mass (%) | 22±3 | 39±2** | 36±2**,†† |
| Physiological measures | |||
| FPG (mmol/l) | 4.96±0.09 | 6.20±0.14** | 5.97±0.25** |
| Fasting plasma insulin (pmol/l) | 16±4 | 56±9** | 41±9**,†† |
| HOMA-IR | 0.6±0.1 | 2.6±0.5** | 1.9±0.5**,†† |
| 2 h glucose, OGTT (mmol/l) | 5.51±0.33 | 9.24±0.45** | 7.26±0.31**,†† |
| Total cholesterol (mmol/l) | 4.73±0.31 | 5.12±0.22 | 5.03±0.37 |
| Triacylglycerol (mmol/l) | 0.94±0.13 | 1.7±0.29** | 1.93±0.27 |
| REE/kg FFM (kJ/day) | 120.6±3.8 | 127.3±4.6 | 124±5.0 |
| RER | 0.80±0.01 | 0.78±0.01 | 0.79±0.01 |
| Dietary intake | n=9 | n=9 | n=9 |
| Total daily intake (kJ) | 7,603±481 | 9,551±953 | 9,211±1,297 |
| Protein (% of energy) | 16.3±1.0 | 18.0±1.1 | 18.0±0.8 |
| Fat (% of energy) | 37.4±2.5 | 34.1±1.8 | 35.0±1.9 |
| Exercise training | |||
| Adherence (resistance exercise, %) | NA | 82±5 | |
| Adherence (aerobic exercise, %) | NA | 87±5 | |
| (ml O2 kg−1 min−1) | ITTa | 25.8±1.8 | 28.9±2.7b |
| PPc | 26.7±1.8 | 30.0±2.2†† | |
| Time to exhaustion (s) | ITTd | 753±60 | 950±56†† |
| PPe | 769±62 | 969±52†† | |
| Leg press working weight (% change) | 30±7 | ||
| Chest press working weight (% change) | 55±20 |
Values are expressed as means±SEM
Dietary intake values averaged from 3-day dietary records and 24 h food recalls
n=7,
p=0.07,
n=5,
n=9,
n=7
α=0.01.
p<0.01 vs Control;
p<0.01 vs OW-Untrained
ITT, intent to treat population; PP, per protocol population; REE, resting energy expenditure
Exercise training
Baseline and training outcomes are presented in Table 1 and ESM Table 1.
Glucose control
OW-Untrained had higher FPG and insulin, HOMA-IR and 2 h OGTT glucose levels than Control (p<0.01, Table 1). Fasting insulin, HOMA-IR, and 2 h OGTT glucose were lowered by exercise (p<0.01), but remained greater than Control. FPG was not altered by exercise (p=0.14). OW-Untrained had greater glucose and insulin excursions during OGTT than Control (Fig. 2a–c), which improved in OW-Trained, but remained greater than Control. Hyperinsulinaemic–euglycaemic clamp studies indicated a moderate degree of IR in OW-Untrained vs Control (p<0.01, Fig. 2d). IS (GIR) improved by an average of 54% in OW-Trained (p<0.01 vs OW-Untrained), but did not normalise completely vs Control when expressed relative to body mass (p<0.01). However, expressed relative to fat-free mass (FFM), OW-Trained GIR was not different from Control (Fig. 2e).
Fig. 2.
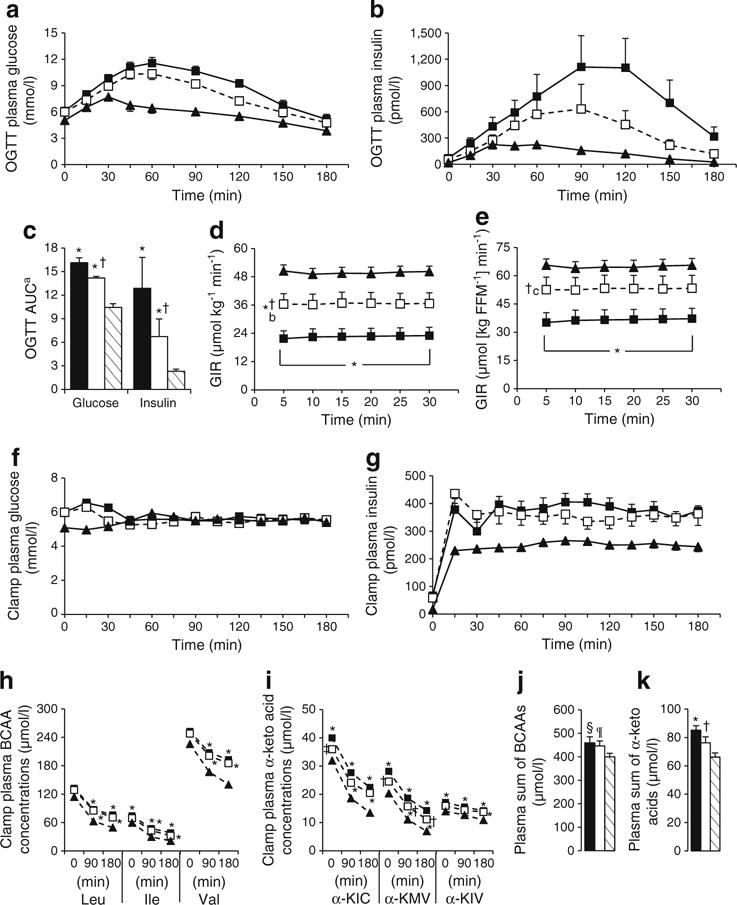
Glucose and BCAA homeostasis. OW-Untrained (black bars/squares); OW-Trained (white bars/squares); Control (striped bars/black triangles). OGTT plasma glucose (a), insulin (b), glucose and insulin AUC (c). Steady state GIR during hyperinsulinaemic–euglycaemic clamp relative to body weight (d) and FFM (e). Clamp glucose (f), insulin (g), BCAA (h) and BCAA α-keto acid (i) concentrations. Basal plasma molar sum of BCAAs (j) and BCAA α-keto acids (k). α=0.05. *p<0.05 vs Control; †p<0.05 vs OW-Untrained; ‡p=0.095 vs OW-Untrained at 0 min; §p=0.054, ¶p=0.088 vs Control. Means± SEM. n=9, OW groups; n=10, Controls. aGlucose AUC as (mmol/l×min)/100, Insulin AUC as pmol/l×min (×10−3).
bStatistical symbols apply to OW-Trained vs Control and OW-Untrained across all time points.
cStatistical symbol applies to OW-Trained vs OW-Untrained across all time points
BCAA and α-keto acid levels during hyperinsulinaemic–euglycaemic clamp
BCAAs and their corresponding α-keto acids are reported prior to insulin infusion, and at 90 and 180 min of hyperinsulinaemic–euglycaemic clamp in Fig. 2h, i. Expressed as % change from 0–180 min, all BCAA and α-keto acids except α-KIV were lowered to a greater extent in Control vs OW groups, but there were no differences between groups when expressed as absolute change. Absolute values of the OW groups were generally higher than Control. All three BCAAs were greater in OW-Untrained compared with Control at 90 and 180 min, and were not lowered on average by exercise. At Time 0, plasma levels of the BCAA-derived α-keto acids were greater in OW-Untrained vs Control. Basal α-KIC and α-KMV were reduced following exercise. The molar sum of BCAAs was elevated in OW-Untrained and OW-Trained vs Control (Fig. 2j), whereas the molar sum of the BCAA α-keto acids was elevated in OW-Untrained vs Control (p<0.05) and significantly reduced by exercise (Fig. 2k).
Hormones, cytokines and conventional metabolites
Compared with Control, OW-Untrained had greater levels of metabolites shown in Table 2 and decreased levels of adiponectin. C-peptide, leptin and glucose-dependent insulinotropic peptide (GIP) were significantly lowered by exercise (p<0.01). Other metabolites are reported in ESM Table 2.
Table 2.
Hormones, cytokines and conventional metabolites
| Control | OW-Untrained | OW-Trained | |
|---|---|---|---|
| Hormones and cytokines in plasma | n=10 | n=13 | n=9 |
| C-peptide (nmol/l) | 0.24±0.04 | 0.51±0.05** | 0.37±0.05†† |
| Glucagon (ng/l) | 1.2±0.3 | 5.2±0.9** | 4.1±1.0** |
| Leptin (μg/l) | 6.3±3.1 | 31.6±7.4** | 23.4±7.8†† |
| Adiponectin (μg/ml) | 20.5±3.0 | 11.8±1.4** | 9.1±1.3** |
| GLP-1 (pg/ml) | 6.7±0.8 | 8.9±0.9 | 8.9±2.0 |
| GIP (pg/ml) | 33±6 | 71±10** | 56±12†† |
| Growth hormone (μg/l) | 2.5±1.0 | 0.2±0.1 | 0.9±0.5 |
| Total IGF-1 (nmol/l) | 16.2±0.6 | 18.1±1.6 | 16.01±1.4 |
| TNF-α (pg/ml) | 2.2±0.1 | 2.7±0.2 | 2.4±0.1 |
| hsCRP (nmol/l) | 10.6±3.3 | 32.5±5.2** | 26.1±4.9 |
| Conventional metabolites in plasma | |||
| Pyruvate (mmol/l) | 0.04±0.01 | 0.07±0.01 | 0.06±0.01 |
| Lactate (mmol/l) | 1.03±0.05 | 1.21±0.09 | 1.14±0.13 |
| Glycerol (mmol/l) | 0.09±0.01 | 0.16±0.02** | 0.14±0.02 |
| NEFA (mmol/l) | 0.47±0.03 | 0.65±0.05 | 0.64±0.06 |
| Ketones (μmol/l) | 77±13 | 100±23 | 113±46 |
| β-Hydroxybutyrate (μmol/l) | 69±12 | 91±21 | 98±42 |
| ALT (μkat/l) | 0.14±0.02 | 0.30±0.03** | 0.24±0.02** |
| AST (μkat/l) | 0.46±0.04 | 0.59±0.07 | 0.53±0.03 |
| Muscle metabolites | n=8 | n=7 | n=7 |
| ATP (μmol l−1 g tissue−1) | 10.9±1.5 | 10.0±0.7 | 10.2±1.4 |
| Phosphocreatine (μmol/l l−1 g tissue−1) | 16.8±2.0 | 24.5±2.0‡ | 22.2±2.1 |
| Total creatine (μmol/l l−1 g tissue−1) | 33.1±3.1 | 45.0±4.1‡ | 40.7±3.1 |
Values are expressed as means±SEM from fasting plasma sample or first muscle biopsy on protein turnover test day
Plasma α=0.01, muscle α=0.05
p<0.01 vs Control;
p<0.01 vs OW-Untrained. For muscle metabolites only,
p<0.05 vs Control
ALT: alanine transaminase; AST: aspartate transaminase; GLP-1: glucagon-like peptide-1; hsCRP: high sensitivity C-reactive protein
Protein turnover
Relative to body mass, there were no differences between groups for endogenous whole-body leucine Ra, oxidation or NOLD (Fig. 3a). Relative to FFM, leucine Ra, oxidation and NOLD were greater in OW-Untrained and OW-Trained compared with Control, with no effect of exercise (Fig. 3b). In studies of mixed muscle, protein fractional synthesis rate (FSR), venous phenylalanine and leucine concentrations reached steady state by 90 min and were not different between groups (Fig. 3e, f). Phenylalanine incorporation into total protein (FSR) was not different between OW-Untrained and Control (p>0.05), but increased significantly following exercise (p<0.05 OW-Trained vs Control; Fig. 3c, d).
Fig. 3.
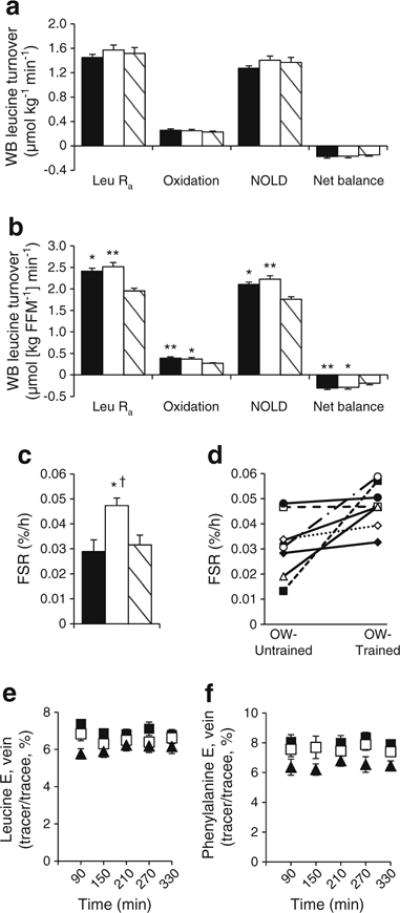
Whole-body (WB) leucine turnover and MPS. OW-Untrained (black bars/squares); OW-Trained (white bars/squares); Control (striped bars/black triangles). Leucine turnover relative to body mass (a) and FFM (b). Mixed muscle protein FSR group averages (c) and individual changes in OW groups (d). Steady state venous leucine (e) and phenylalanine (f) enrichment (E). α=0.05. *p<0.05, **p<0.01 vs Control; †p<0.05 vs OW-Untrained. Means±SEM, except in (d). n=9, OW groups (a, b); n=8, OW groups (c–f); n=10, Control
Plasma metabolites
Plasma AAs and acylcarnitines are shown in Figs 4a, d and 5a–d. Glycine and serine were significantly lower, and BCAAs, phenylalanine, tyrosine and glutamate/glutamine significantly higher in OW-Untrained vs Control. Glycine and citrulline increased in OW-Trained (p<0.05 vs OW-Untrained). The sum of BCAA was greater in both OW groups compared with Controls (p<0.05). Among plasma acylcarnitines, only C8:1 was significantly greater in OW-Untrained vs Control (p<0.01).
Fig. 4.
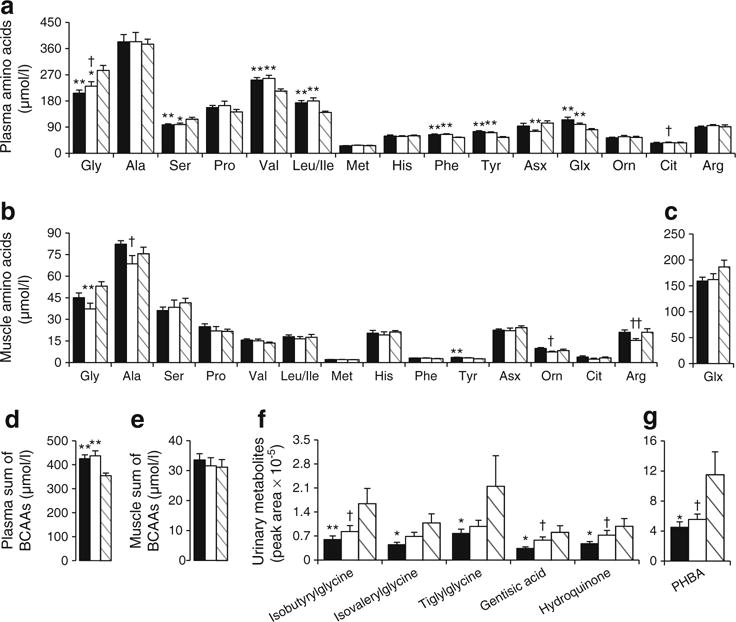
AAs and urinary metabolites. OW-Untrained (black); OW-Trained (white); Control (striped). AA concentrations (μmol/l) in plasma (a, d) and muscle (b, c, e). Relative abundance of urinary metabolites (f, g). (a–c) α=0.01; (d–g) α=0.05. *p<0.05, **p<0.01 vs Control; †p<0.05, ††p<0.01 vs OW-Untrained. Means±SEM. n=13, OW-Untrained; n=9, OW-Trained; n=10, Control
Fig. 5.
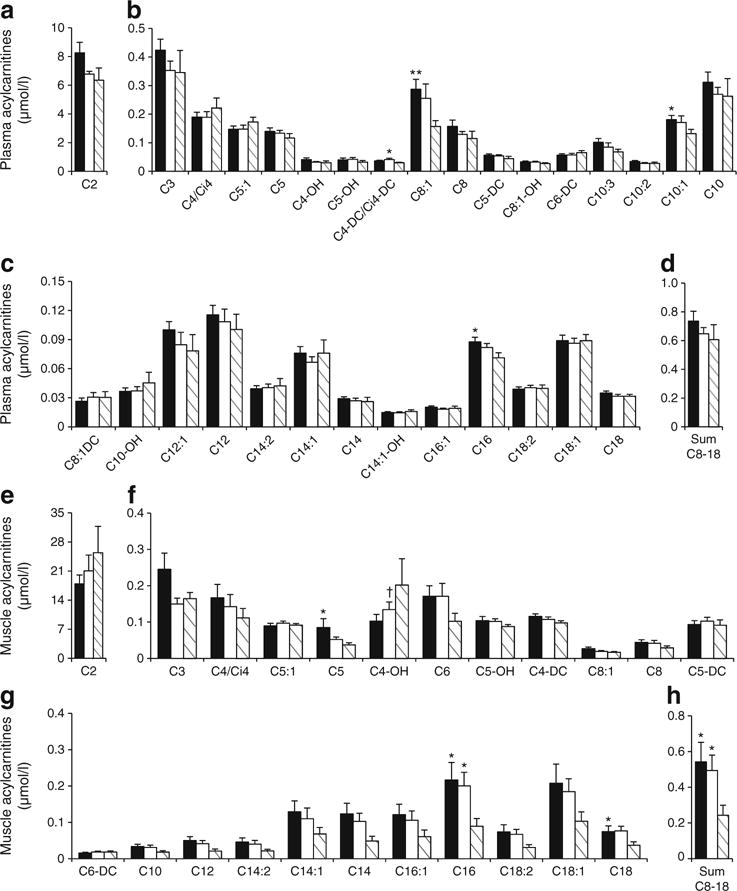
Acylcarnitine concentrations in plasma (a–d) and muscle (e–h). OW-Untrained (black); OW-Trained (white); Control (striped). α=0.01. *p<0.05, **p<0.01 vs Control; †p<0.05 vs OW-Untrained. Means±SEM. n=13, OW-Untrained; n=9, OW-Trained; n=10, Control
Muscle metabolites
Muscle AAs and acylcarnitines are shown in Figs 4b, c, e and 5e–h. Arginine was significantly lowered by exercise in OW (p<0.01). No individual muscle acylcarnitines were significantly different between groups (p>0.01), but the sum of C8–C18 even-chained, saturated species was elevated in both OW groups compared with Control (p<0.05).
Urinary metabolites
BCAA-related urine metabolites are shown in Fig. 4f, g. Glycine conjugates of BCAA catabolites (isobutyrylglycine, isovalerylglycine, tiglylglycine) were significantly lower in OW-Untrained vs Control (p<0.05), and tended to increase or significantly increased following exercise. Similarly, gentisic acid, 4-hydroxybenzoic acid (PHBA) and hydroquinone were lower in OW-Untrained vs Control and increased following exercise (p<0.05).
Baseline levels and training-induced changes in metabolites correlate with IS
ESM Table 3 reports individual components of factors generated from PCA analyses. The plasma BCAA-related factor, conventional metabolite factor, sum of isoleucine/phenylalanine/tyrosine and sum of the BCAA α-keto acids were most strongly associated with measures of IS (GIR, HOMA-IR) (ESM Fig. 3, ESM Table 4). At baseline, the sum of medium-long chain muscle acylcarnitines was the best predictor of improvement in GIR by exercise, with lower levels being associated with the largest improvements (Fig. 6e). Baseline plasma BCAAs and α-keto acids were not predictive of ΔGIR (Fig. 6a, c), but change in the sum of BCAAs showed a strong positive correlation (Fig. 6b). These analyses were performed on the basal blood sample collected on the morning of the clamp procedure using liquid chromatography (LC)-MS/MS to separate leucine and isoleucine peaks (as opposed to a single leucine/isoleucine peak when measured by flow-injection-MS/MS). In contrast, change in sum plasma BCAA α-keto acids was not correlated with ΔGIR (Fig. 6d). The small changes that occurred in body mass, fat mass or FFM were not correlated with ΔGIR or metabolite levels reported in Fig. 6 (data not shown).
Fig. 6.
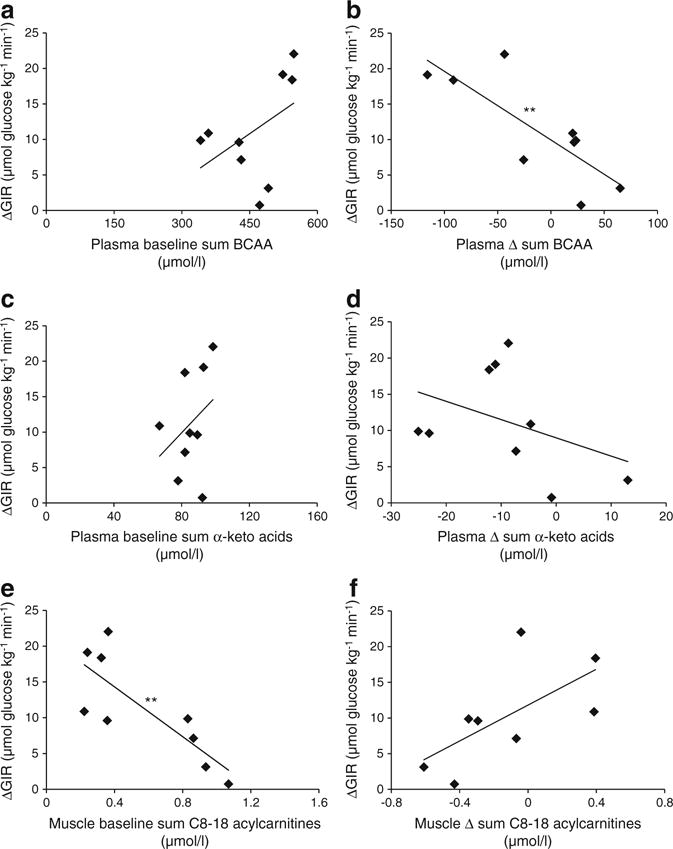
Plasma and muscle metabolite factor relationships with GIR. Scatter plots depicting plasma baseline sum of BCAAs (a), Δ sum of BCAAs (b), baseline sum of the BCAA α-keto acids (c), Δ sum of α-keto acids (d) in plasma, and baseline sum of even-chain unsaturated acylcarnitines C8–C18 (e), and Δ sum of C8–18 acylcarnitines (f) in muscle vs ΔGIR, OW participants. **p<0.01. Correlation matrices in ESM Table 4
Discussion
In this study, we sought to understand the relationships between whole-body leucine flux, muscle protein synthesis (MPS), small molecule metabolites and glucose homeostasis in lean, insulin sensitive and OW, insulin-resistant individuals, and to understand the effects of a combined aerobic and resistance exercise intervention in the OW participants on these variables. We hypothesised that the combined exercise programme would drive BCAAs into exercising muscle for oxidation in response to both components, and for protein synthesis in response to the resistance component, and that the resultant lowering of plasma BCAAs in the OW individuals would be correlated with improvements in glucose handling and homeostasis.
Our hypotheses were based on known adaptations that occur in muscle during aerobic and resistance exercise. Independently, aerobic and resistance exercise training can improve the oxidative potential (i.e. number and/or function) of muscle mitochondria [14, 15]. Because significant portions of BCAA and fatty acid catabolism occur in mitochondria, improvement in mitochondrial oxidative capacity will likely impact these processes. We did not directly assess mitochondrial density or function, but measures of aerobic fitness and endurance including and time to exhaustion (TTE) were improved, comparable with previous findings in participants completing a similar exercise programme [28]. Despite aerobic improvements, the rate of whole-body leucine oxidation was not altered following training. Instead, leucine oxidation relative to FFM was elevated at baseline in OW-Untrained vs Controls, suggesting that a compensatory increase in muscle BCAA oxidation may have been activated in the OW state [31]. This is consistent with an increase in BCAA-derived metabolites in obese compared with lean individuals that we have reported previously [5], as well as other studies reporting increases in mitochondrial oxidation of substrates in obese states [10, 31]. However, increases in following training in this cohort were moderate, suggesting a more intense aerobic component may have elicited a larger change in aerobic capacity with a more pronounced impact on substrate oxidation.
Resistance exercise is a potent stimulator of MPS [32, 33]. We observed an increase in MPS (FSR) in OW-Trained, likely driven in part by the acute response to the last exercise session. As might be predicted, increases in FSR were correlated with increases in FFM (R=0.881, p=0.004). However, changes in body composition including body mass, fat mass and FFM did not correlate to changes in BCAA levels or IS. This is most likely explained by the fact that changes in body composition measures were relatively small compared with changes in variables correlating with improved IS, such as the change in molar sum of BCAAs. Participants were asked not to change their diets, and dietary records collected throughout the study indicate caloric intake and macronutrient distribution did not change, nor were any of these variables associated with changes in protein turnover or IS. Nevertheless, we acknowledge the limitations of dietary assessment methodologies, and we cannot rule out that other factors, such as energy balance state and protein intake, could affect adaptive responses to training [34]. In particular, energy deficit may be required to induce more favourable metabolic outcomes. However, we note that estimated energy requirements vs actual intake (less estimated energy cost of exercise) in our participants were not correlated with protein turnover or IS measures (data not shown).
Although exercise did not affect fasting measures of whole-body leucine breakdown, synthesis or oxidation, it is possible that exercise could have resulted in an improved response of proteolysis to insulin and/or better AA disposal in the postprandial state. In terms of metabolic flexibility, exercise did not significantly alter respiratory exchange ratio (RER), fasting glycerol or NEFA, or glycerol/NEFA responses (AUCs) during OGTT. However, glycerol and NEFA AUCs during hyperinsulinaemic–euglycaemic clamp decreased in OW-Trained towards Control values (ESM Fig. 4), indicating lipolysis is more responsive to the suppressive effects of insulin following exercise. While we cannot speculate on the response of protein metabolism to glucose and insulin, OW-Trained exhibit improved metabolic flexibility with regard to lipid metabolism.
Our understanding of the mechanisms contributing to elevated circulating BCAAs in OW/obese states has improved as tissue-specific roles in BCAA homeostasis become clearer. Obesity is associated with downregulation of BCAA catabolic enzymes in adipose tissue, which may contribute to accumulation of BCAA in plasma [31, 35]. In liver, expression of branched-chain α-keto acid dehydrogenase kinase is increased with obesity, resulting in increased phosphorylation of branched-chain keto acid dehydrogenase (BCKDH) and inhibition of its enzyme activity [31]. Our finding that OW-Untrained individuals had increased plasma levels of all three branched-chain α-keto acids—the substrates of BCKDH—is consistent with this idea. Because liver is the tissue that has the largest quantitative impact on BCAA oxidation, our findings suggest that obesity-related suppression of BCKDH activity may have been partially reversed in response to exercise, as the intervention caused mean levels of two branched-chain keto acids to fall in plasma. Obesity does not appear to alter expression of BCAA catabolic genes or their post-translational modification in skeletal muscle [31], suggesting that rates of BCAA oxidation in muscle could increase in concert with increases in circulating BCAA. Our previous observation of increases in circulating C3 and C5 acylcarnitines in a more obese cohort than the current one are consistent with this idea [5]. The current study shows that exercise intervention had no impact on measures of whole-body leucine catabolism. The dominant role of the liver in BCAA catabolism could have obscured significant increases in adipose or muscle BCAA oxidation that contributed to the relationship between ΔGIR and ΔBCAA. Further studies are required to resolve the relative contributions of BCAA metabolism in liver, muscle and fat to overall BCAA homeostasis.
Acylcarnitines in metabolic profiles report on the pool of mitochondrial CoA metabolites and the β-oxidative pathway, and skeletal muscle is thought to be a principal contributor to the plasma acylcarnitine pool [10, 36]. A cluster of medium- to long-chain acylcarnitines is elevated in the fed state in skeletal muscle of obese and/or insulin-resistant animals and humans [10, 36, 37]. Rodent studies demonstrate that BCAA supplementation of high-fat diets exacerbates accumulation of these lipid metabolites in muscle [5]. In the current study, we observed trends for decreases in these metabolites in muscle and plasma of Control and OW-Trained participants compared with OW-Untrained, but no decrease in the average molar sum of muscle C8–18 species. Instead, there was a modest association between increases in muscle sum of C8–18 acylcarnitines and improvement in GIR. This is consistent with a recent report in which various exercise regimens produced increases in several even-chain muscle acylcarnitines, which positively correlated with increased expression of genes involved in uptake and oxidation of fatty acids in muscle and improved IS [28]. Elevated levels of these by-products of β-oxidation in the fasted state in OW-Trained suggest an improvement in metabolic flexibility [38]. Improvement of GIR with exercise was greater in those with lower baseline C8–C18 levels in muscle, which may indicate these individuals had the least constraint to increase flux from C18 to C2 in response to exercise.
Consistent with previous reports, we found decreased levels of circulating glycine in the OW-Untrained group, which increased towards Control values following exercise [5, 39]. Glycine is important for Phase II detoxification in the liver, where excess metabolites are conjugated to glycine for excretion [40]. Consistent with this, several glycine conjugates (products of BCAA catabolism: isobutyrylglycine, 2-methylbutyryl-glycine/isovalerylglycine and tiglylglycine) were decreased in urine of OW-Untrained individuals compared with Controls, but not in OW-Trained. Levels of other urinary metabolites were also decreased in OW-Untrained vs Control, and increased following exercise. These changes might reflect alterations in gut-microbial catabolism of tyrosine, phenylalanine and dietary polyphenolic compounds [41, 42]. A recent study supports an important role of the gut microbiota in regulation of BCAA and aromatic AA homeostasis, demonstrating increases in these AAs and their metabolites in germ-free mice that received microbiota transplants from obese compared with lean human twins [43]. These data suggest an important role for glycine and the microbiome in eliminating excess acyl groups derived from BCAA and aromatic AA metabolism. Our data suggest that these processes are more efficient in Controls vs OW-Untrained, and that they improve following exercise. Thus, the main finding of our study is that rather than increasing BCAA disposal through oxidation and turnover, exercise may mediate interactions between BCAA metabolism and IS via more efficient elimination of BCAA- and aromatic AA-derived acyl groups through formation of glycine adducts.
We acknowledge several limitations of our study. Our small sample size may limit the power to detect certain differences between groups, limiting extrapolation of our findings to a wider population without confirmatory cohorts. We chose to assess post-training measures 24–36 h after the last bout of exercise. While it is known that exercise has acute effects on measures of IS and protein turnover [32, 44], the participants were exercising 3 days/week. Therefore, 24–36 h after an exercise session represents their ‘new normal’ metabolic state on days they were not exercising and represents a combination of chronic and acute exercise effects. With regard to nutrition, we acknowledge that diet could influence the individual response to training, and we also appreciate the limitations of dietary assessment methodologies. It is possible that the energy content and macronutrient composition of individual dietary practices influenced study outcomes.
In summary, a decrease in the molar sum of circulating BCAAs was the best predictor of improvement in IS induced by a combined resistance and aerobic exercise intervention. High levels of circulating glycine in lean individuals and increased glycine in the OW group with exercise training, along with altered levels of several urinary glycine adducts and other metabolites, suggest that exercise induces more efficient elimination of excess acyl groups derived from BCAA and aromatic AA metabolism by urinary excretion. These findings, coupled with other reports of strong negative associations between glycine and insulin-resistant states [5, 45], suggest that stimulation of glycine adduct formation may be responsible for part of the exercise-induced changes in whole-body insulin action. A better understanding of the contributions of liver, muscle, adipose tissue and the gut microbiota to these processes during nutrient excess and with exercise will further our understanding of the systemic changes that occur during the development of IR and may help to identify novel targets for therapy.
Supplementary Material
Acknowledgments
We thank the study participants, and undergraduate interns (of Duke Cardiology) who helped with exercise training; and M-Q. Zheng and S. Medina of the University of Texas Medical Branch for technical assistance. We acknowledge funding support from the National Institutes of Health, the Claude D. Pepper Older Americans Independence Center and the CV and Metabolic Research Unit of Pfizer®.
Funding This work was supported by grant P01-DK58398 (National Institutes of Health, National Institute of Diabetes and Digestive and Kidney Diseases), a grant from the Claude D. Pepper Older Americans Independence Center (P30 AG024832) and a grant from the CV and Metabolic Research Unit of Pfizer®. KNPS was supported by NIH grant 5T32 AG000029.
Abbreviations
- α-KIC
α-Keto-isocaproate
- α-KIV
α-Keto-valerate
- α-KMV
α-Keto-β-methylvalerate
- AAs
Amino acids
- BCAAs
Branched-chain amino acids
- BCKDH
Branched-chain keto acid dehydrogenase
- FFM
Fat-free mass
- FPG
Fasting plasma glucose
- FSR
Fractional synthesis rate
- GIP
Glucose-dependent insulinotropic peptide
- GIR
Glucose infusion rate
- IR
Insulin resistance
- IS
Insulin sensitivity
- MPS
Muscle protein synthesis
- NOLD
Non-oxidative leucine disposal
- OW
Overweight
- PCA
Principal components analysis
- Ra
Rate of appearance
- RER
Respiratory exchange ratio
Peak oxygen consumption
Footnotes
Duality of interest MJB, JKT and TPR are or were employees of the CV and Metabolic Research Unit, Pfizer. CBN is a paid consultant for the CV and Metabolic Research Unit of Pfizer. All other authors declare that there is no duality of interest associated with their contribution to this manuscript.
Author contributions ELG participated in all aspects of the study and wrote the manuscript. CAS, HNA, EV, MJB, JKT, TPR, CWB, CBN and WEK participated in conceptual design. LWP, KMH, CAS, LEP, HNA, KPS and WEK participated in data collection. LWP, PJW, JRB, MJM, ORI, RDS, KNPS and EV participated in data analyses. KMH, CAS, JRB, MJM, MJB, JKT, TPR, CBN and WEK participated in data interpretation. JRB, RDS, MJB, CBN and WEK contributed to writing the manuscript; all authors revised the manuscript critically for important intellectual content and approved the final version. ELG, CBN and WEK take full responsibility for the study design, access to data and the decision to submit and publish the manuscript.
Electronic supplementary material The online version of this article (doi:10.1007/s00125-015-3705-6) contains peer-reviewed but unedited supplementary material, which is available to authorised users.
Contributor Information
Christopher B. Newgard, Email: Chris.Newgard@dm.duke.edu.
William E. Kraus, Email: William.Kraus@dm.duke.edu.
References
- 1.Newgard CB. Interplay between lipids and branched-chain amino acids in development of insulin resistance. Cell Metab. 2012;15:606–614. doi: 10.1016/j.cmet.2012.01.024. [DOI] [PMC free article] [PubMed] [Google Scholar]
- 2.Felig P, Marliss E, Cahill GF. Plasma amino acid levels and insulin secretion in obesity. N Engl J Med. 1969;281:811–816. doi: 10.1056/NEJM196910092811503. [DOI] [PubMed] [Google Scholar]
- 3.Caballero B, Finer N, Wurtman RJ. Plasma amino acids and insulin levels in obesity: response to carbohydrate intake and tryptophan supplements. Metabolism. 1988;37:672–676. doi: 10.1016/0026-0495(88)90089-3. [DOI] [PubMed] [Google Scholar]
- 4.Solini A, Bonora E, Bonadonna R, Castellino P, DeFronzo RA. Protein metabolism in human obesity: relationship with glucose and lipid metabolism and with visceral adipose tissue. J Clin Endocrinol Metab. 1997;82:2552–2558. doi: 10.1210/jcem.82.8.4182. [DOI] [PubMed] [Google Scholar]
- 5.Newgard CB, An J, Bain JR, et al. A branched-chain amino acid-related metabolic signature that differentiates obese and lean humans and contributes to insulin resistance. Cell Metab. 2009;9:311–326. doi: 10.1016/j.cmet.2009.02.002. [DOI] [PMC free article] [PubMed] [Google Scholar]
- 6.Tai ES, Tan ML, Stevens RD, et al. Insulin resistance is associated with a metabolic profile of altered protein metabolism in Chinese and Asian-Indian men. Diabetologia. 2010;53:757–767. doi: 10.1007/s00125-009-1637-8. [DOI] [PMC free article] [PubMed] [Google Scholar]
- 7.Huffman KM, Shah SH, Stevens RD, et al. Relationships between circulating metabolic intermediates and insulin action in overweight to obese, inactive men and women. Diabetes Care. 2009;32:1678–1683. doi: 10.2337/dc08-2075. [DOI] [PMC free article] [PubMed] [Google Scholar]
- 8.Shah SH, Crosslin DR, Haynes CS, et al. Branched-chain amino acid levels are associated with improvement in insulin resistance with weight loss. Diabetologia. 2012;55:321–330. doi: 10.1007/s00125-011-2356-5. [DOI] [PMC free article] [PubMed] [Google Scholar]
- 9.Wang TJ, Larson MG, Vasan RS, et al. Metabolite profiles and the risk of developing diabetes. Nat Med. 2011;17:448–453. doi: 10.1038/nm.2307. [DOI] [PMC free article] [PubMed] [Google Scholar]
- 10.Koves TR, Ussher JR, Noland RC, et al. Mitochondrial overload and incomplete fatty acid oxidation contribute to skeletal muscle insulin resistance. Cell Metab. 2008;7:45–56. doi: 10.1016/j.cmet.2007.10.013. [DOI] [PubMed] [Google Scholar]
- 11.Muoio DM, Newgard CB. Molecular and metabolic mechanisms of insulin resistance and beta-cell failure in type 2 diabetes. Nat Rev Mol Cell Biol. 2008;9:193–205. doi: 10.1038/nrm2327. [DOI] [PubMed] [Google Scholar]
- 12.Saltiel AR, Kahn CR. Insulin signalling and the regulation of glucose and lipid metabolism. Nature. 2001;414:799–806. doi: 10.1038/414799a. [DOI] [PubMed] [Google Scholar]
- 13.Katzmarzyk PT, Leon AS, Wilmore JH, et al. Targeting the metabolic syndrome with exercise: evidence from the HERITAGE Family Study. Med Sci Sports Exerc. 2003;35:1703–1709. doi: 10.1249/01.MSS.0000089337.73244.9B. [DOI] [PubMed] [Google Scholar]
- 14.Jacobs RA, Lundby C. Mitochondria express enhanced quality as well as quantity in association with aerobic fitness across recreationally active individuals up to elite athletes. J Appl Physiol. 2013;114:344–350. doi: 10.1152/japplphysiol.01081.2012. [DOI] [PubMed] [Google Scholar]
- 15.Sparks LM, Johannsen NM, Church TS, et al. Nine months of combined training improves ex vivo skeletal muscle metabolism in individuals with type 2 diabetes. J Clin Endocrinol Metab. 2013;98:1694–1702. doi: 10.1210/jc.2012-3874. [DOI] [PMC free article] [PubMed] [Google Scholar]
- 16.Atherton PJ, Smith K. Muscle protein synthesis in response to nutrition and exercise. J Physiol. 2012;590:1049–1057. doi: 10.1113/jphysiol.2011.225003. [DOI] [PMC free article] [PubMed] [Google Scholar]
- 17.Millington DS, Kodo N, Norwood DL, Roe CR. Tandem mass spectrometry: a new method for acylcarnitine profiling with potential for neonatal screening for inborn errors of metabolism. J Inherit Metab Dis. 1990;13:321–324. doi: 10.1007/BF01799385. [DOI] [PubMed] [Google Scholar]
- 18.Olson KC, Chen G, Lynch CJ. Quantification of branched-chain keto acids in tissue by ultra fast liquid chromatography-mass spectrometry. Anal Biochem. 2013;439:116–122. doi: 10.1016/j.ab.2013.05.002. [DOI] [PMC free article] [PubMed] [Google Scholar]
- 19.Patterson BW, Carraro F, Wolfe RR. Measurement of 15N enrichment in multiple amino acids and urea in a single analysis by gas chromatography/mass spectrometry. Biol Mass Spectrom. 1993;22:518–523. doi: 10.1002/bms.1200220905. [DOI] [PubMed] [Google Scholar]
- 20.Wolfe RR, Chinkes DL. Isotope tracers in metabolic research principles and practice of kinetic analysis. Wiley-Liss; Hobokon: 2005. [Google Scholar]
- 21.Magnes C, Sinner FM, Regittnig W, Pieber TR. LC/MS/MS method for quantitative determination of long-chain fatty acyl-CoAs. Anal Chem. 2005;77:2889–2894. doi: 10.1021/ac048314i. [DOI] [PubMed] [Google Scholar]
- 22.Ferrara CT, Wang P, Neto EC, et al. Genetic networks of liver metabolism revealed by integration of metabolic and transcriptional profiling. PLoS Genet. 2008;4:e1000034. doi: 10.1371/journal.pgen.1000034. [DOI] [PMC free article] [PubMed] [Google Scholar]
- 23.Minkler PE, Kerner J, Ingalls ST, Hoppel CL. Novel isolation procedure for short-, medium-, and long-chain acyl-coenzyme A esters from tissue. Anal Biochem. 2008;376:275–276. doi: 10.1016/j.ab.2008.02.022. [DOI] [PMC free article] [PubMed] [Google Scholar]
- 24.Harris RC, Hultman E, Nordesjo LO. Glycogen, glycolytic intermediates and high-energy phosphates determined in biopsy samples of musculus quadriceps femoris of man at rest. Methods and variance of values. Scand J Clin Lab Invest. 1974;33:109–120. [PubMed] [Google Scholar]
- 25.Stein SE. An integrated method for spectrum extraction and compound identification from gas chromatography/mass spectrometry data. J Am Soc Mass Spectrom. 1999;10:770–781. [Google Scholar]
- 26.Halket JM, Przyborowska A, Stein SE, et al. Deconvolution gas chromatography/mass spectrometry of urinary organic acids–potential for pattern recognition and automated identification of metabolic disorders. Rapid Commun Mass Spectrom. 1999;13:279–284. doi: 10.1002/(SICI)1097-0231(19990228)13:4<279::AID-RCM478>3.0.CO;2-I. [DOI] [PubMed] [Google Scholar]
- 27.Schwenk WF, Beaufrere B, Haymond MW. Use of reciprocal pool specific activities to model leucine metabolism in humans. Am J Physiol. 1985;249:E646–E650. doi: 10.1152/ajpendo.1985.249.6.E646. [DOI] [PubMed] [Google Scholar]
- 28.Huffman KM, Koves TR, Hubal MJ, et al. Metabolite signatures of exercise training in human skeletal muscle relate to mitochondrial remodelling and cardiometabolic fitness. Diabetologia. 2014;57:2282–2295. doi: 10.1007/s00125-014-3343-4. [DOI] [PMC free article] [PubMed] [Google Scholar]
- 29.Shah SH, Bain JR, Muehlbauer MJ, et al. Association of a peripheral blood metabolic profile with coronary artery disease and risk of subsequent cardiovascular events. Circ Cardiovasc Genet. 2010;3:207–U233. doi: 10.1161/CIRCGENETICS.109.852814. [DOI] [PubMed] [Google Scholar]
- 30.Batch BC, Shah SH, Newgard CB, et al. Branched chain amino acids are novel biomarkers for discrimination of metabolic wellness. Metabolism. 2013;62:961–969. doi: 10.1016/j.metabol.2013.01.007. [DOI] [PMC free article] [PubMed] [Google Scholar]
- 31.She P, Van Horn C, Reid T, Hutson SM, Cooney RN, Lynch CJ. Obesity-related elevations in plasma leucine are associated with alterations in enzymes involved in branched-chain amino acid metabolism. Am J Physiol Endocrinol Metab. 2007;293:E1552–E1563. doi: 10.1152/ajpendo.00134.2007. [DOI] [PMC free article] [PubMed] [Google Scholar]
- 32.Biolo G, Maggi SP, Williams BD, Tipton KD, Wolfe RR. Increased rates of muscle protein turnover and amino acid transport after resistance exercise in humans. Am J Physiol. 1995;268:E514–E520. doi: 10.1152/ajpendo.1995.268.3.E514. [DOI] [PubMed] [Google Scholar]
- 33.Phillips SM, Parise G, Roy BD, Tipton KD, Wolfe RR, Tamopolsky MA. Resistance-training-induced adaptations in skeletal muscle protein turnover in the fed state. Can J Physiol Pharmacol. 2002;80:1045–1053. doi: 10.1139/y02-134. [DOI] [PubMed] [Google Scholar]
- 34.Pasiakos SM, Cao JJ, Margolis LM, et al. Effects of high-protein diets on fat-free mass and muscle protein synthesis following weight loss: a randomized controlled trial. FASEB J. 2013;27:3837–3847. doi: 10.1096/fj.13-230227. [DOI] [PubMed] [Google Scholar]
- 35.Herman MA, She P, Peroni OD, et al. Adipose tissue branched chain amino acid (BCAA) metabolism modulates circulating BCAA levels. J Biol Chem. 2010;285:11348–11356. doi: 10.1074/jbc.M109.075184. [DOI] [PMC free article] [PubMed] [Google Scholar]
- 36.Koves TR, Li P, An J, et al. Peroxisome proliferator-activated receptor-gamma co-activator 1 alpha-mediated metabolic remodeling of skeletal myocytes mimics exercise training and reverses lipid-induced mitochondrial inefficiency. J Biol Chem. 2005;280:33588–33598. doi: 10.1074/jbc.M507621200. [DOI] [PubMed] [Google Scholar]
- 37.Kien CL, Bunn JY, Poynter ME, et al. A lipidomics analysis of the relationship between dietary fatty acid composition and insulin sensitivity in young adults. Diabetes. 2013;62:1054–1063. doi: 10.2337/db12-0363. [DOI] [PMC free article] [PubMed] [Google Scholar]
- 38.Galgani JE, Moro C, Ravussin E. Metabolic flexibility and insulin resistance. Am J Physiol Endocrinol Metab. 2008;295:E1009–E1017. doi: 10.1152/ajpendo.90558.2008. [DOI] [PMC free article] [PubMed] [Google Scholar]
- 39.Huffman KM, Slentz CA, Bateman LA, et al. Exercise-induced changes in metabolic intermediates, hormones, and inflammatory markers associated with improvements in insulin sensitivity. Diabetes Care. 2011;34:174–176. doi: 10.2337/dc10-0709. [DOI] [PMC free article] [PubMed] [Google Scholar]
- 40.Costa CG, Guerand WS, Struys EA, et al. Quantitative analysis of urinary acylglycines for the diagnosis of beta-oxidation defects using GC-NCI-MS. J Pharm Biomed Anal. 2000;21:1215–1224. doi: 10.1016/s0731-7085(99)00235-6. [DOI] [PubMed] [Google Scholar]
- 41.Zheng X, Xie G, Zhao A, et al. The footprints of gut microbial-mammalian co-metabolism. J Proteome Res. 2011;10:5512–5522. doi: 10.1021/pr2007945. [DOI] [PubMed] [Google Scholar]
- 42.Moco S, Martin FP, Rezzi S. Metabolomics view on gut microbiome modulation by polyphenol-rich foods. J Proteome Res. 2012;11:4781–4790. doi: 10.1021/pr300581s. [DOI] [PubMed] [Google Scholar]
- 43.Ridaura VK, Faith JJ, Rey FE, et al. Gut microbiota from twins discordant for obesity modulate metabolism in mice. Science. 2013;341:1241214. doi: 10.1126/science.1241214. [DOI] [PMC free article] [PubMed] [Google Scholar]
- 44.Goodyear LJ, Kahn BB. Exercise, glucose transport, and insulin sensitivity. Annu Rev Med. 1998;49:235–261. doi: 10.1146/annurev.med.49.1.235. [DOI] [PubMed] [Google Scholar]
- 45.Thalacker-Mercer AE, Ingram KH, Guo F, Ilkayeva O, Newgard CB, Garvey WT. BMI, RQ, diabetes, and sex affect the relationships between amino acids and clamp measures of insulin action in humans. Diabetes. 2014;63:791–800. doi: 10.2337/db13-0396. [DOI] [PMC free article] [PubMed] [Google Scholar]
Associated Data
This section collects any data citations, data availability statements, or supplementary materials included in this article.