Abstract
BACKGROUND & AIMS
Interstitial cells of Cajal (ICC) express the receptor tyrosine kinase, KIT, the receptor for stem cell factor. In the gastrointestinal (GI) tract, ICC are pacemaker cells that generate spontaneous electrical slow waves, and mediate inputs from motor neurons. Absence or loss of ICC are associated with GI motility disorders, including those consequent of diabetes. Studies of ICC have been hampered by the low density of these cells and difficulties in recognizing these cells in cell dispersions.
METHODS
Kit+/copGFP mice harboring a copepod super green fluorescent protein (copGFP) complementary DNA, inserted at the Kit locus, were generated. copGFP+ ICC from GI muscles were analyzed using confocal microscopy and flow cytometry. copGFP+ ICC from the jejunum were purified by a fluorescence-activated cell sorter and validated by cell-specific markers. Kit+/copGFP mice were crossbred with diabetic Lep+/obmice to generate mice compound Kit+/copGFP;Lepob/ob mutant mice. copGFP+ ICC from compound transgenic mice were analyzed by confocal microscopy.
RESULTS
copGFP in Kit+/copGFP mice colocalized with KIT immunofluorescence and thus was predominantly found in ICC. In other smooth muscles, mast cells were also labeled, but these cells were relatively rare in the murine GI tract. copGFP+ cells from jejunal muscles were Kit+ and free of contaminating cell-specific markers. Kit+/copGFP; Lepob/ob mice displayed ICC networks that were dramatically disrupted during the development of diabetes.
CONCLUSIONS
Kit+/copGFP mice offer a powerful new model to study the function and genetic regulation of ICC phenotypes. Isolation of ICC from animal models will help determine the causes and responses of ICC to therapeutic agents.
Keywords: Kit, Gastrointestinal Tract, Diabetes, copGFP
An important step in understanding the role of interstitial cells of Cajal (ICC) in the gastrointestinal (GI) tract was the finding that tyrosine kinase, KIT, is expressed by ICC and that anti-KIT antibodies label these cells.1,2 After this discovery, the majority of morphologic studies on ICC has utilized KIT immuolabeling to characterize the distribution of ICC and the consequences of disease processes on ICC. Mast cells are the only other cells expressing KIT in the tunica muscularis, but the distinctive size, shape, and relative distributions of these cells makes cross labeling of mast cells a minor interference in identification of ICC. Identifying ICC with KIT antibodies (CD117) and immunohistochemical techniques has been difficult in vivo and in dispersed cells, making it difficult to exam time-dependent changes in a single tissue and to characterize changes in gene expression as the cells are negatively impacted by disease. Difficulties in identifying ICC in enzymatically dispersed, mixed cell populations may be due to damage to the epitopes for KIT antibodies. In addition, data from different laboratories have suggested that detection of KIT-immunoreactive ICC is not uniformly reliable, and some investigators have suggested that not all ICC express or can be detected by CD117 or that ICC loss is more significant than in other comparable studies.3
ICC are electrically active cells that generate and propagate electrical slow waves, and these events are conducted to smooth muscle cells in the gut to organize phasic contractions and peristalsis.1,4 ICC are also involved in transduction of inputs from excitatory and inhibitory motor neurons and therefore play a fundamental role in regulation of motility by the enteric nervous system.5,6 Loss of ICC function can lead to symptoms that might traditionally have been considered defects in myogenic or neurogenic control mechanisms. However, KIT labeling showed that the structural integrity of ICC is aberrant in a variety of GI dysmotilities, including achalasia,7,8 diabetic gastroenteropathy,9–11 hypertrophic pyloric stenosis,12 gastroschisis,13 intestinal pseudoobstruction,14–17 slow transit constipation,18–20 Hirschsprung’s disease,21,22 Crohn’s disease,23,24 and inflammatory bowel disease.25–27
Patients with long-standing diabetes mellitus develop gastroparesis, which is a growing health care problem.28 A growing body of evidence from clinical and animal model studies indicate that destruction of ICC networks or loss of ICC in diabetes is a major pathophysiologic feature of diabetic gastroenteropathy.29 All of these studies were carried out on fixed tissues and labeling with KIT antibodies. Thus, it has been difficult to visualize ICC networks in vivo or to isolate sufficient ICC for genomic studies of the changes that occur in these cells. Hence, the consequences of diabetes on ICC are poorly understood. In this study, we developed a new animal model in which ICC are labeled by a transgenic technique, and we bred the constitutive label into an animal model (Lepob/ob), creating Kit+/copGFP and KitcopGFP;Lepob/ob mice. Tissues and cells of these animals provide a powerful new means of studying the disease processes leading to ICC lesions. As with Lepob/ob mice, it should be possible to crossbreed Kit+/copGFP with a variety of murine models of GI disease, providing the opportunity to more thoroughly understand the diparate or common factors impacting the ICC phenotype in such a variety of GI motility disorders.
Materials and Methods
Generation of Kit+/copGFP Knock-In Construct
The RPCI-21 P1 artificial chromosome (PAC) library constructed from a female 129S6/SvEvTac mouse spleen genomic DNA in pPAC4 vector30 was screened with a probe corresponding to a region spanning the first exon of Kit gene (Children’s Hospital Oakland Research Institute, Oakland, CA). Five positive clone cells (SS4-D1, S74-C7, 611-H4, S01-P3, and S3S–H12) were obtained from Children’s Hospital Oakland Research Institute. A colony direct polymerase chain reaction (PCR) was performed with pairs of primers spanning a region of the 5′ upstream 5 kilobase (kb) from exon 1 and spanning a region of exon 5 as described.31 PCR detected 2 clones: SS4-D1 and S3S–H12. PAC DNAs were isolated from the 2 clones using BACMAX DNA purification Kit as described in the manufacturer’s instructions (EPICENTE Biotechnologies, Madison, WI). Clone SS4-D1 PAC DNA was sequenced with T7 and SP6 and mkit11r at the Nevada Genomic Center, Reno, NV. Clone SS4-D1 contains 81,857 base pair (bp) of genomic DNA (chrS: 75,926,271–76,008,127), which consists of 37,116 bp of the 5′ upstream, exons 1–4, and a partial intron 4. This PAC clone was used to construct a KitxopGFP KI targeting vector. A 5.2-kb fragment (5′ arm) digested with HindIII and KasI and a 3.6-kb fragment (3′ arm) digested with SacII and XbaI from the PAC clone were subcloned into a modified vector from pCR-XL vector (Invitrogen, Carlsbad, CA). A 0.8-kb fragment of the copGFP gene originally from the copepod Pontellina plumata was amplified from a pFIV-copGFP reporter vector (System Bio-sciences, Mountain View, CA) by PCR and subcloned into the pcDNA 3.1/V5-His TOPO TA Cloning vector (Invitrogen). A 0.23-kb fragment of the SV40 poly A signal (terminator) was amplified from pd2EYFP-Nl (BD Bio-sciences, San Jose, CA) by PCR and subloned into the pcDNA3.1 vector. The copGFP gene and the SV 40 terminator were ligated in the 5.2 kb of the 5′ arm in a way that the copGFP open reading frame directly inserted with Kozak consensus sequence32 after 12 bp from the actual start codon “ATG” of Kit. This 5.2 kb-copGFP construct and a 3.6 kb of the 3′ arm were subcloned into a pHWloxp1 vector, which contains a promoter of the mouse phosphoglycerate kinase gene (Pgk1) and hypo-xanthine phosphoribosyltransferase (Hprt1) gene for selection (gifted from Dr. Klaus Willecke).33 The final targeting construct, Kit-copGFP/pHW (patent in submission), was sequenced with many sets of primers for confirmation (see DNA sequencing and analysis). The construct plasmids, prepared using a Plasmid Maxi Kit (QIAGEN, Valencia, CA), were digested with KpnI followed by purification with phenol-chloroform extraction. The linearized and purified targeting vectors were electroporated into the AB2.2 embryonic stem (ES) cells, and HAT and FIAU double-selected ES cell clones were screened by Southern blot analysis (see Supplementary Material).
Generation of Kit+/coPGFP and Kit+/copGFP;Lepob/ob Type 2 Diabetes Mellitus Mutants
Two ES cell clones carrying the mutant KitxopGFP allele were injected into CS7BL/6J blastocysts and implanted into pseudopregnant females (CD1 strain). A high percentage of male chimeras were bred with CS7BL/6J female mice to produce heterozygous mice (Kit+/copGFP). Intercrossing Kit+/copGFP mice yielded approximately 50% of F2 Kit+/copGFP mice (patent in submission). F1 mice were genotyped using Southern blot analysis. After F2, PCR-based genotyping was performed using primers Kit-g1 and Kit-g1r, specific to the wild-type (WT) allele and knock-in (KI) primers, copGFP-1 and copGFP-1r, specific for the KI allele copGFP gene (Supplementary Table 1). A Kit+/copGFP male mouse was crossbred with a Lep+/ob type 2 diabetes mellitus (DM) female heterozygote mouse (The Jackson Laboratory, Bar Harbor, ME) to generate Kit+/copGFP;Lep+/ob heterozygote mice. Kit+/copGFP; Lep+/oh heterozygote mice were backcrossed to generate Kit+/copGFP;Lepob/ob mutants (patent in submission). The offspring mice were genotyped with 2 sets of primers, Lep-1 and Lep-1r for the Lepob/ob mutation and copGFP-1 and copGFP-1r for the Kit+/copGFP KI (see Supplementary Table 1). The 155-bp PCR products amplified with a set of Lep-1 and Lep-1r from the mice were sequenced for confirmation of mutation. All procedures used in generating and analyzing mutant mice were approved by the Institutional Animal Care and Use Committee of the University of Nevada, Reno, NV. The mice used in this study were maintained on 129S6Sv/Ev-C57BL/6J mixed background.
Flow Cytometry and Fluorescence-Activated Cell Sortering
Colon and small intestine tunica musuraris were incubated in Ca2+-free solution containing collagenase (4 mg/mL, Worthington type II; Worthington Biochemical, Lakewood, NJ), bovine serum albumin (6 mg/mL), trypsin inhibitor (6 mg/mL), and papain (1 mg/mL) (all from Sigma-Aldrich, St. Louis, MO) for ∼30–45 minutes. After washing with Ca2+-free buffer, the muscles were triturated through a series of 3 blunt pipettes of decreasing tip diameter. Resultant cell suspensions were sedimented by centrifugation (300g; 5 minutes), resuspended in 1 mL of Ca2+- and Mg2+-free Hank’s solution containing 5% fetal bovine serum (Invitrogen), and filtered through a polyester filter with 100-µm mesh size (Miltenyi Biotec, Auburn, CA) to obtain single-cell suspensions. Abbreviations for antibodies used are as follows: R-phycoerythrin (PE), Texas Red (TxR), streptavidin (SA), biotin (Bio), PE-cyanine 7 tandem (PC7), 7-amino-actinomycin D (7-AAD), anti-mouse CD16/32 (Fc block) (Supplementary Table 2). Dispersed cells were suspended in ∼450 µL of staining buffer to which 90 µL containing 2.25 µg Fc block and 21 µg rat immunoglobulin (Ig) G was added. After ∼10–15 minutes, two 50-µL aliquots were dispensed for labeling. Both samples received 20 µL containing Bio-anti-CD45 (250 ng), Bio-anti-CD 11b (125 ng), Bio-anti-CD11c (63 ng), and Bio-anti-F4/80 (250 ng). The test sample additionally received 25 µL containing PE-anti-CD117 (125 ng), PC7-anti-Gr-1 (63 ng), and 7-AAD (250 ng) (Supplementary Table 2). After ∼30 minutes incubation with the antibodies, the samples were resuspended in 4 mL of staining buffer and centrifuged. The pelleted cells were resuspended in 50–100 µL, and both samples were labeled with 10 µL containing PE-TxR-SA (50 ng). After an additional 20–30 minutes, the cells were washed with ∼3 mL staining buffer and resuspended in ∼700 µL staining buffer for flow cytometric analysis. Fluorescence compensation controls were created using antibody capture beads with anti-rat immunoglobulin, cells labeled with 7-AAD only, and transgenic cells containing copGFP-expressing cells. Flow Cytometer (Beckman Coulter, Brea, CA) FC500/MPL, equipped with 488 nm and 633 nm lasers, 5 detectors configured to measure 525 nm (fluorescein, green fluorescence protein [GFP]), 575 nm (PE), 610 nm (PE-TxR), 670 nm (PC5, 7-AAD, APC, AF647), and >740 nm (PC7), was used. Flow cytometric analytical software (FlowJo; Tree Star, Ashland, OR) was used. Staining Buffer (BioSure, Grass Valley, CA) flow cytometry sheath solution diluted from 8× stock solution with 1% fetal bovine serum and 0.09% sodium azide was used. Sorted cells were used for isolation of total RNAs.
RNA Isolation, Reverse-Transcription PCR, and Quantitative PCR
Total RNA was extracted from tissues and sorted ICC from Kit+/copGFP transgenic and WT mice using TRIzol (Invitrogen), and complementary DNA (cDNA) was made from each sample of total RNA as discribed.34 Gene-specific oligonucleotide primers (Supplementary Table 1) were designed and synthesized for reverse-transcription (RT)-PCR and quantitative PCR (qPCR). The PCR was performed using 12.5 µL of 2× AmpliTaq Gold PCR Master Mix (Applied Biosystems, Foster City, CA), 1 µL of the synthesized cDNA, and 1 µL of 10 µmol/L primers in a 25-µL reaction volume on the GeneAmp PCR System 2700 (Applied Biosystems). A 2-step PCR method (95 °C for 10 minutes and then 40 cycles of 95 °C for 15 seconds and 60°C for 1 minute) was used. After PCR, 2 µL of the RT-PCR product was analyzed on a 1.5% agarose gel. The fragments amplified by RT-PCR were gel eluted using the QIAquick PCR Purification Kit (QIAGEN) and analyzed by direct sequencing. qPCR was performed with primer sets for Kit, copGFP, and glyceraldehyde-3-phosphate dehydrogenase (Gapdh) (Supplementary Table 1) using Syber green chemistry on the 7300 Real Time PCR System (Applied Biosystems). Regression analysis of the mean values of 8 multiplex qPCRs for the log10 diluted cDNA was used to generate standard curves. Unknown amounts of messenger RNA (mRNA) were plotted relative to the standard curve for each set of primers and graphical plotted using Microsoft Excel (Microsoft Corp, Redmond, WA). This gave transcriptional quantitation of each gene relative to the endogenous Gapdh standard after log transformation of the corresponding raw data. The data were plotted and graphed using SigmaPlot (Systat Software Inc, San Jose, CA). Significant differences of each gene among Kit+/copGFPtransgenic and WT mice were analyzed using 1-way analysis of variance with Newman-Keul post hoc test. The PCR products were also analyzed on a 1.5% agarose gel.
Results
Generated Kit+/copGFP Mice
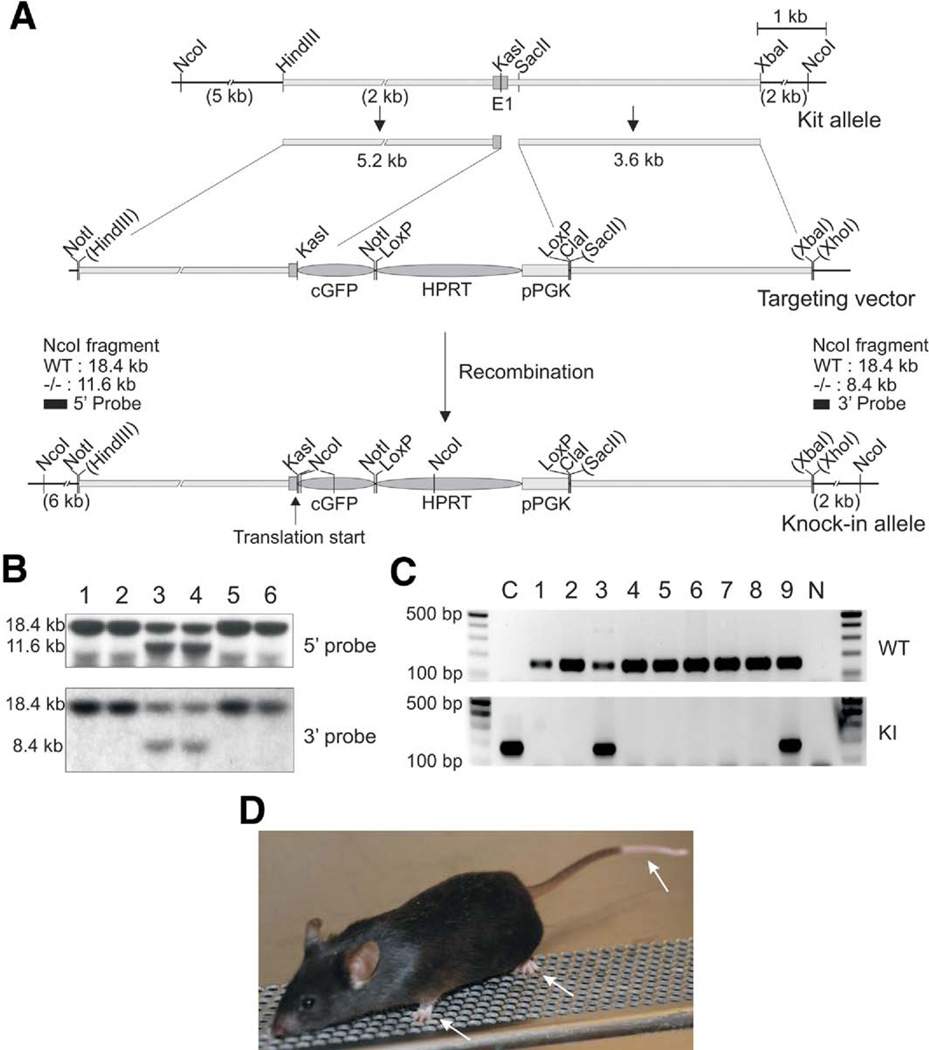
Transgenic Kit+/copGFP mice expressing a bright green fluorescent protein copGFP in a Kit-specific manner were generated. A KitxopGFP KI targeting vector was constructed from a mouse RPCI-21 PAC library. In the construct, the open reading frame of copGFP cDNA35 was fused to the exon 1 of the Kit gene with the Kozak consensus sequence (Figure 1A). The final targeting construct Kit-copGFP/pHW (15.5 kb) was sequenced for confirmation. We found some sequencing errors or sequence polymorphisms in the published mouse genome.36 In the 5′ arm of Kit (5140 bp) and the 3′ arm of Kit (3598 bp), 25 and 40 nucleotides failed to match those at the USCS Genome Browser (the Build 37 assembly by National Center for Biotechnology Information [NCBI] and the Mouse Genome Sequencing Consortium),36 respectively. Mismatches were found throughout the sequences. We also sequenced the 185-bp gap between the 2 clones from the genomic clone, in which our sequence matched the published sequence. The corrected Kit gene sequence (8923 bp) containing the promoter region, exon 1, and partial intron 1 was submitted and registered to the NCBI (GQ281541). Targeted ES cell clones were screened with the 5′ and the 3′ probes by Southern blots. Two positive clones were found in the 6 clones (Figure 1B). One (No. 3) of these 2 clones was used to generate F1 progeny. The F1 mice genotyped by PCR showed that 3 progenies contained both KI and WT alleles (heterozygote Kit+/copGFP) (Figure 1C). The colony of Kit+/copGFP was expanded by breeding the F1 progeny. Kit+/copGFP mice displayed a gross phenotype characterized by white patches at the end of the tail and on the belly and white paws (Figure 1D). As expected, homozygotes for the transgene (Kit copGFP/copGFP) were embryonic lethal and did not survive to birth.
Figure 1.
Generation of the Kit+/copGFP Kl mice. (A) Targeted Kl strategy. A copGFP gene was inserted into the first exon of Kit along with the PGK-Hprt cassette. Restriction enzymes on the map indicate cleavage sites used for construction of the targeting vector. (B) Southern blot analysis to identify correctly targeted embryonic stem (ES) cell clones (clones 3 and 4). (C) PCR-based genotyping analyses of a litter of 9 pups. Pups No. 3 and 9 are heterozygous (Kit+/copGFP) mice containing both the Kl and WT (WT) alleles. C and N are controls of the targeting vector plasmid and nontemplate control, respectively. (D) Gross phenotype of a Kit+/copGFP mouse showing white paws and tail (arrows). Abbreviations: E1, exon 1; cGFP, copGFP gene; HPRT, hypoxanthine-guanine phosphoribosyltransferase gene; pPGK, phosphoglycerate kinase promoter.
copGFP Expression Mirrors Kit Expression
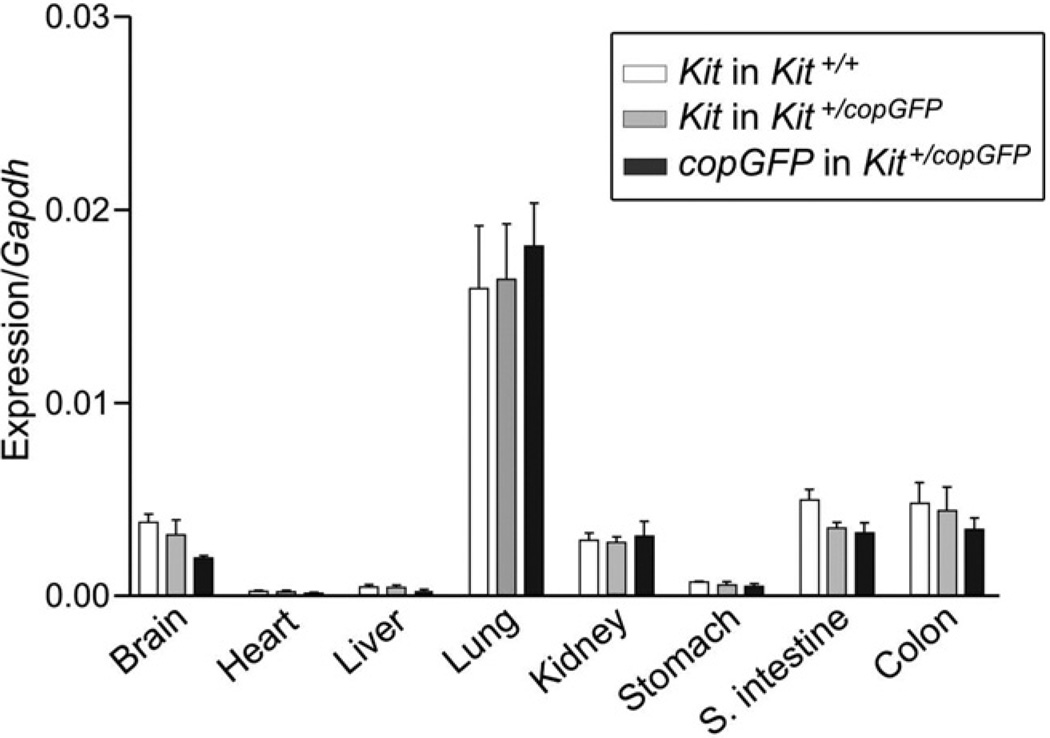
Expression levels of Kit and copGFP were tested in multiple tissues from both the heterozygote KI and homozygote WT mice were examined by qPCR (Figure 2). The Kit expression levels of the heterozygote KI were parallel to the homozygote WT mice, suggesting that the heterozygote Kit+/copGFP mice maintained typical expression levels of Kit. The Kit expression levels were also mimicked by copGFP expression in the heterozygote KI mice, suggesting that copGFP expression was under control of Kit specific promoters, and its expression can represent Kit expression. In addition, qPCR confirmed that lung expresses c-kit abundantly. Approximately 3% of lung cells are lymphohematopoietic stem/progenitor cells, which are KIT+/CD45+.37
Figure 2.
Expression of Kit and copGFP in multiple tissues from 3 wild-type (Kit+/+) and 3 Kit+/copGFP mice. Expression levels of Kit or copGFP mRNAs were examined by qPCR in 8 tissues dissected from wild-type or Kit+/copGFP mice. Expression level for each gene was normalized to glyceraldehyde-3-phosphate dehydrogenase (Gapdh).
Expression of copGFP in ICC in the GI Tract Is Specific and Intensive
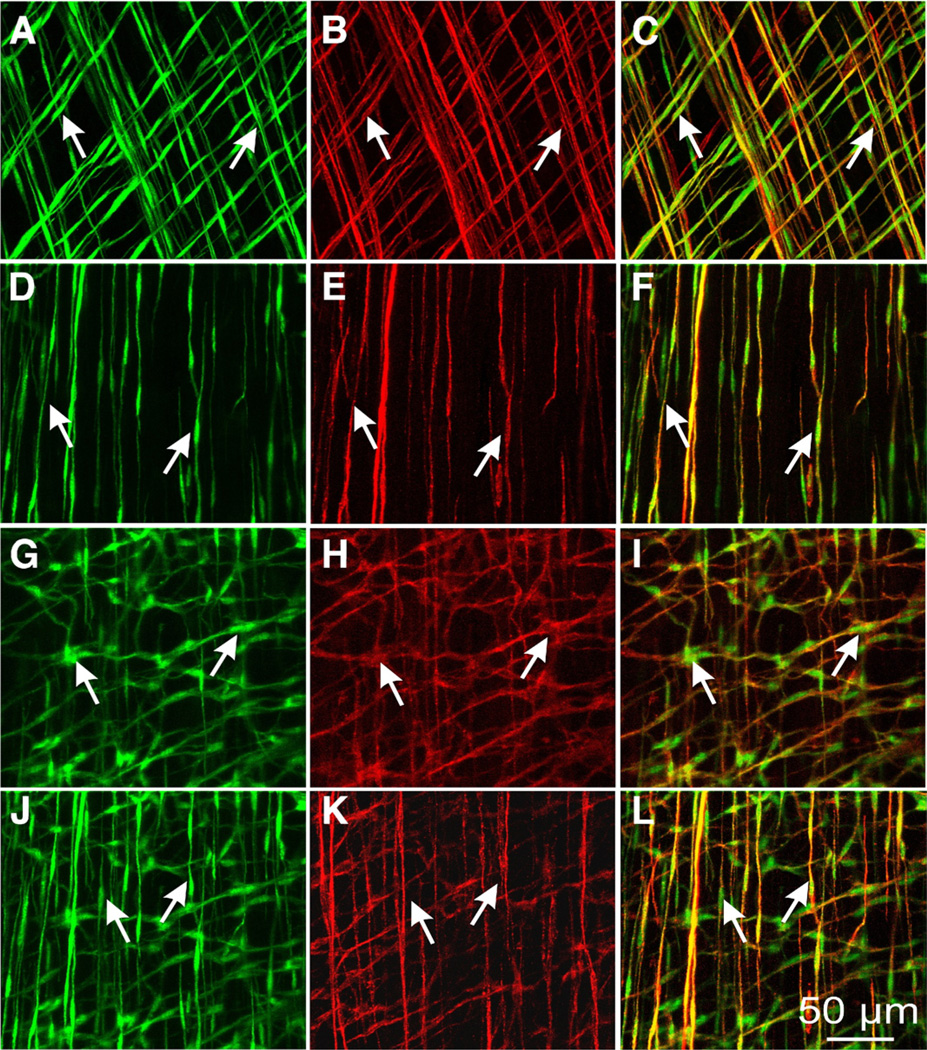
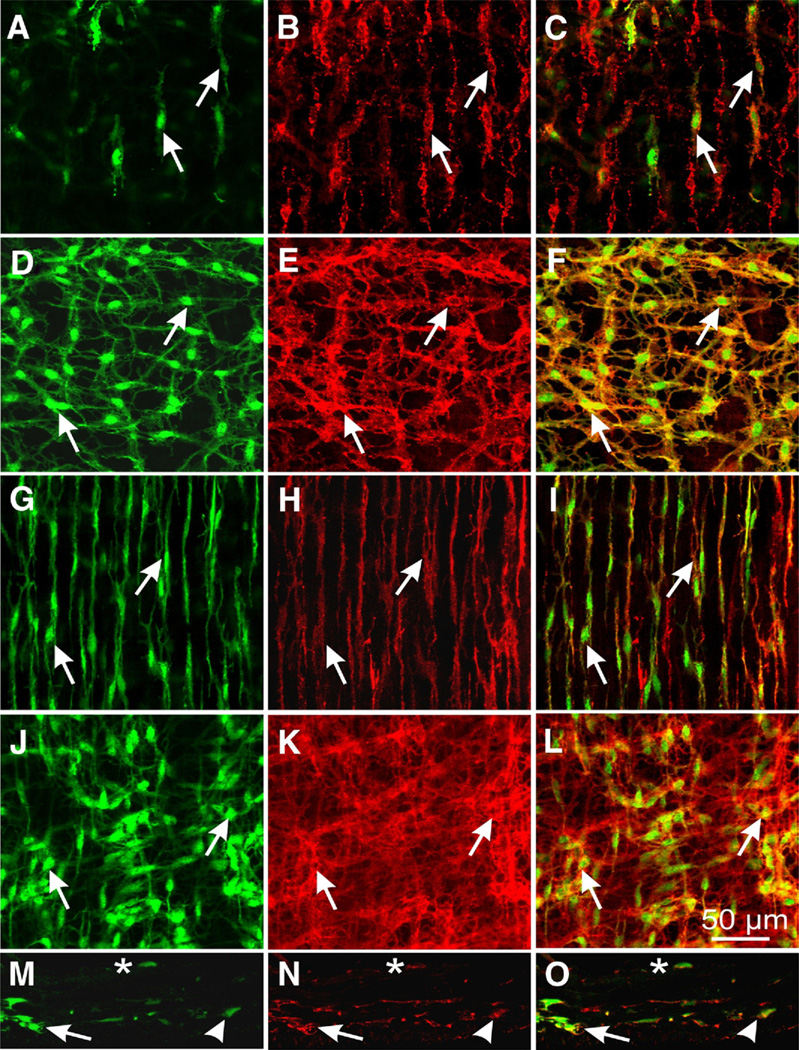
copGFP expression in ICC in the GI tracts of the Kit+/copGFP mice was investigated with confocal microscopy. Images of muscles from Kit+/copGFP mice showed networks of cells with interconnecting processes or spindle shaped cells in the anatomical localities typically occupied by ICC in GI muscles. copGFP+ cells were found throughout the stomach (Figure 3), small intestine, and colon (Figure 4). copGFP fluorescence was primarily located in the perinuclear cytoplasm of cells. Cellular processes also displayed labeling but to a lesser extent than the perinuclear region. The morphology of cells varied depending on their anatomical positions, but each population of copGFP+ cells had structures reminiscent of the specific populations of ICC (Figure 3A, D, G, J and Figure 4A, D, G, J, and M). The identity of copGFP+ cells was confirmed using KIT immunohistochemistry (Figure 3B, E, H, K, and Figure 4B, E, H, K, and N). Double labeling with KIT antibodies, confirmed that cells with copGFP+ were ICC. In the stomach, 2 different populations of ICC were positive, spindle-shaped intramuscular ICC (ICC-IM) that ran parallel to the circular and longitudinal muscle fibers in the fundus (Figure 3A) and the circular muscle fibers in the antrum (Figure 3D). A secondary population of cells, termed myenteric ICC (ICC-MY) was also positive in the body and antrum (Figure 3G). In the small intestine, ICC at the level of the deep muscular plexus (ICC-DMP) and ICC-MY were positive (Figure 4A and D). ICC-IM, ICC-MY, and submucosal ICC (ICC-SM) were copGFP positive in the colon (Figure 4G, J, and M).
Figure 3.
Expression of copGFP in gastric ICC. copGFP+ cells (A, green, arrows) also labeled with KIT antibody (B, red, arrows) in gastric fundus. Merged images are in C. copGFP+ cells were spindle shaped, typical of ICC-IM, in both the circular and longitudinal layers. D–F show copGFP+ and KIT+ cells (arrows) in the circular layer. G-I show copGFP+ and KIT+ cells (arrows) at the level of the myenteric plexus in gastric antrum. J–L show ICC-IM (arrows) within the circular layer of the antrum. Both ICC-MY (arrows, G–l) and ICC-IM (arrows, J–L) expressed copGFP (G and J; green) and KIT (H and K, red). Merged images are in I and L. Scale bar in L applies to all panels.
Figure 4.
Expression of copGFP in ICC of small intestine and colon. copGFP+ cells (A; green, arrows) were also labeled with KIT antibody (B, red, arrows) in the deep muscular plexus of small intestine. Merged images are in C (copGFP+; KIT+ cells, arrows). copGFP+ cells were spindle shaped, typical of ICC-deep muscular plexus (ICC-DMP). copGFP+ cells in the myenteric plexus region of small intestine (D, green, arrows), also labeled with KIT antibody (E, red, arrows). Merged image shown in F. copGFP (G and J, arrows) and KIT (H and K, arrows) were expressed in ICC-IM (G–l) and CC-MY (J–L) in the proximal colon. copGFP (M) and KIT (N) were expressed in ICC (ICC-IM; [arrowheads], ICC-MY [arrows], and ICC-SM [asterisks]) on cryostat cross sections (M–O) in the proximal colon. Merged images are in I, L, and O. Scale bar in L applies to all panels.
copGFP+ Cells Are ICC
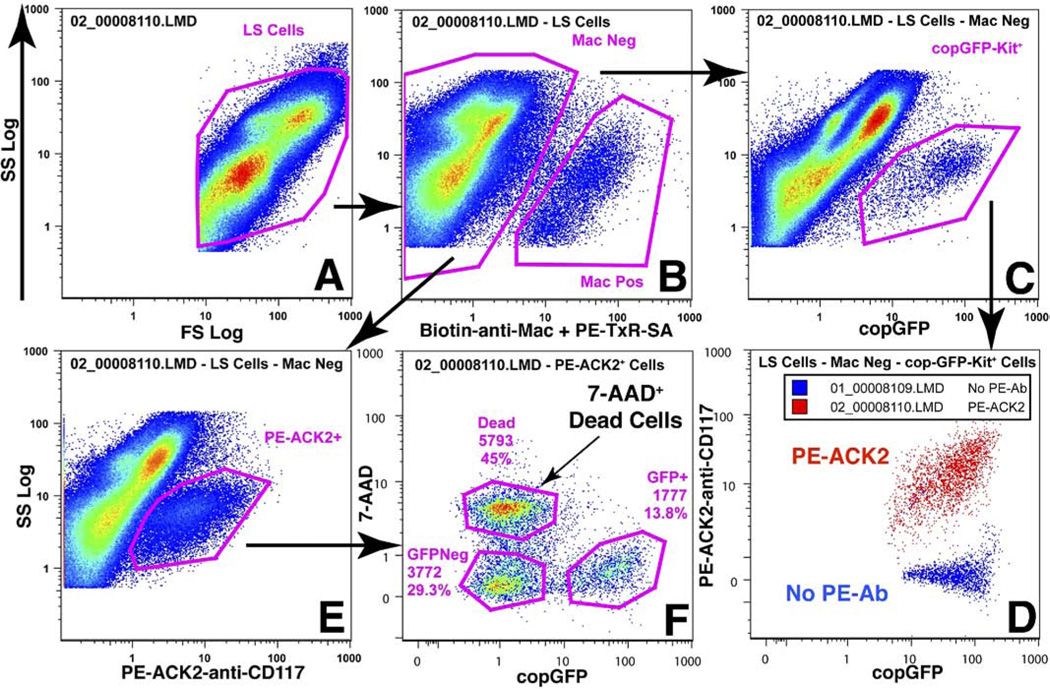
We tested whether dispersed GI muscle cells from Kit+/copGFP mice contained copGFP that was detectable by flow cytometry (Figure 5A). Cells from jejunum of Kit+/copGFP mice were labeled with the anti-macrophage antibodies (Mac) alone or also with PE-ACK2 (anti-KIT antibody) and 7-AAD prior to flow cytometric examination. The copGFP+ cells (Figure 5C) detected from the Mac− cells (Figure 5B) were all PE-ACK2+ (Figure 5D). The PE-ACK2+ cells (Figure 5E) from the Mac− cells could be divided into 3 populations (Figure 5F). The largest population did not have detectable copGFP and were 7-AAD+ (dead cells). Among the 7-AAD− cells were cells that were copGFP− and copGFP+. The copGFP− cells may have been PE-ACK2+ cells that lost copGFP during cell dispersion and/or cytometric analysis. Comparable results were obtained with 2B8-anti-KIT and Hoechst 33258 labeling to detect cells with damaged membranes (data not shown). Confocal microscope and cytometric analyses suggest that all copGFP+ cells, however, are ICC.
Figure 5.
Flow cytometric detection of copGFP+ ICC from intestinal smooth muscle in Kit+/copGFP mice. Jejunum muscle from a transgenic Kit+/copGFPmouse was dispersed and labeled ± PE-ACK2. Cells were initially gated by forward angle and orthogonal light scatter, ie, Log FS and Log SS, respectively (A). Those cells were then divided into 2 populations that did (Mac+ [Mac Pos]) or did not (Mac [Mac Neg]) express hematopoietic/macrophage markers CD45, CD11 b, CD11 c, and F4/80 (B). Mac− cells were examined for expression of copGFP (C) or surface KIT (E). The copGFP+ cells were examined for labeling with PE-ACK2-anti-CD117 (PE-ACK2), and samples with and without PE-ACK2 were overlaid (D). All copGFP+ cells were also labeled with PE-ACK2 antibody (D; plus PE-ACK2, red; minus PE-Ab, blue). The PE-ACK2+ cells (E) were examined for expression of copGFP and for labeling with 7-AAD. As shown, 3 populations could be identified (F).
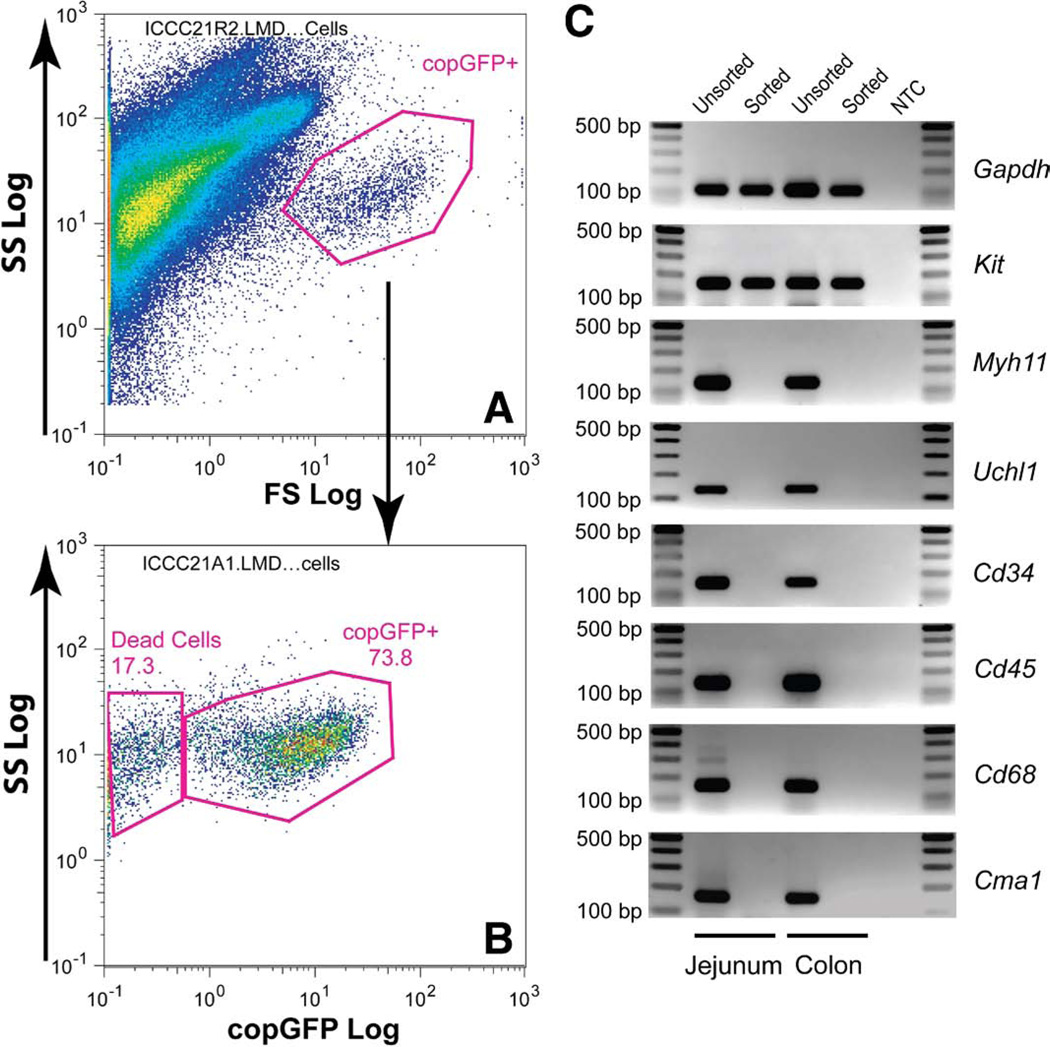
copGFP+ ICC from jejunum and colon were purified by fluorescence-activated cell sorter (FACS) (Figure 6A). After sorting, the copGFP+ cells were reanalyzed. The copGFP+ cells were enriched from 0.8% to 73.8% (Figure 6B). In a separated test, we established that the dead cells (17.3%) shift to the left is the same population of cells that had lost copGFP florescence. Gene expression of sorted ICC was examined with cell specific markers by PCR. Sorted ICC samples (jejunum and colon) robustly expressed Kit but were negative for expression of neural (Uchl1), smooth muscle cell (Myh11), and other hematopoietic cells/macrophages (Cd34, Cd43, Cd68, and Cmα1) markers (Figure 6C).
Figure 6.
Flow cytometric identification and molecular confirmation of copGFP+ ICC from intestinal smooth muscle in Kit+/copGFP mice. Jejunum muscle from a transgenic Kit+/copGFP mouse was dissociated. copGFP+ ICC were gated out as shown (A) and sorted and enriched (B). mRNA expression of cell markers in sorted ICC (C). Total RNAs isolated from sorted and unsorted ICC from jejunum or colon were reverse transcribed. Cell marker expression was examined by RT-PCR. Gapdh (a control gene); Kit (a marker for ICC); Myh11, myosin, heavy polypeptide 11, smooth muscle (SMCs); Uchl1 (PGP9.5), ubiquitin carboxy-terminal hydrolase L1 (neuronal cells); Cd34, Cd34 antigen (hemopoietic and endothelial precursors, and mature endothelial cells); Cd45 (Ptprc), protein tyrosine phosphatase, receptor type C (pan-leukocytes); Cd68, Cd68 antigen (macrophages); Cma1, chymase 1 (mast cells).
The ICC Network Was Dramatically Disrupted in Type 2 Diabetes
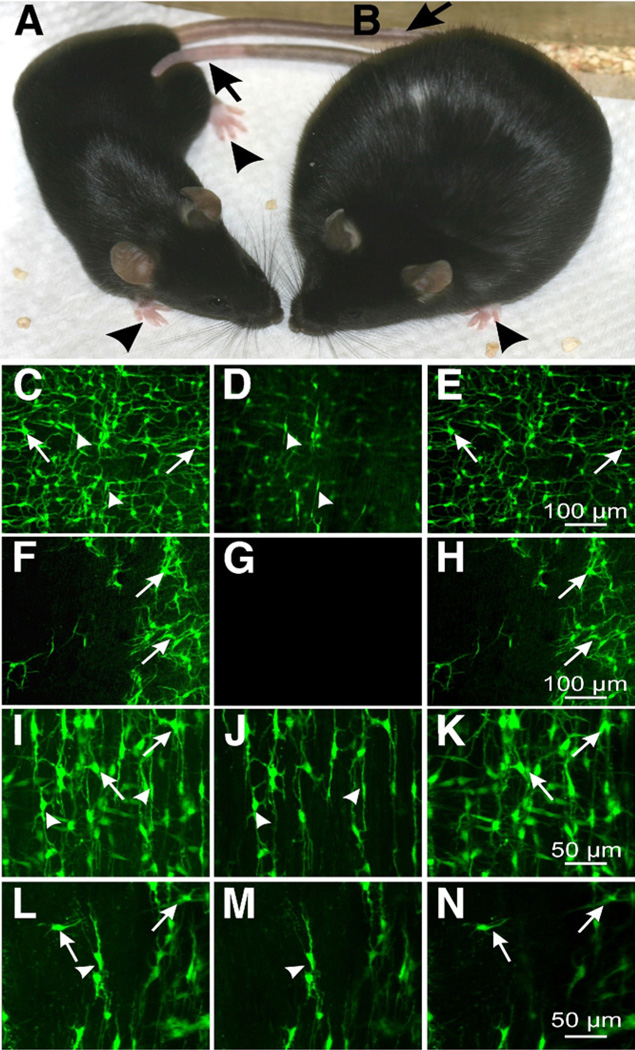
Breeding Kit+/copGFP mice with animal models of GI disease provides the opportunity to image ICC and examine the genomic changes that accompany loss of these cells in a variety of animal models. As an example of these new animal models, we crossed the Kit+/copGFP mouse with Lep+/ob mice38 (Lepob/ob homozygotes are infertile) to produce Kit+/copGFP;Lep+/ob heterozygotes. Progeny were backcrossed to Kit+/copGFP;Lep+/ob heterozygotes to obtain Kit+/copGFP;Lepob/ob mutants. By 4–6 weeks, these animals developed signs of obesity, and, by 10–12 weeks, the animals were hyperglycemic (Figure 7B) compared with control WT Kit+/copGFP mice (Figure 7A). Examination of ICC networks in the small intestine and colon showed disruption in both ICC-MY and ICC-IM. ICC networks were patchy in areas of both intestine and colon, and some areas were devoid of copGFP+ ICC (Figure 7G and H and M and N show intestine and colon, respectively) compared with the controls from the WT Kit+/copGFP mouse (Figure 7D and E and J and K for intestines and colons, respectively). Loss of ICC from Kit+/copGFP;Lepob/ob compound mutants was confirmed in merged images using with confocal microscopy (Figure 7F and L).
Figure 7.
ICC in small intestine and colon of Kit+/copGFP (A) and Kit+/copGFP;Lepob/ob (B) mice. These mice have white paws (arrowheads) and tail (arrows). C–H show ICC-MY (arrows) and ICC-DMP (arrowheads) in small intestines of Kit+/copGFP (C–E) and Kit+/copGFP;Lepob/ob mice (F–H) I–N show ICC in colons of Kit+/copGFP (l–K) and Kit+/copGFP;Lepob/ob (L–N) mice (ICC-MY, arrows; ICC-IM, arrowheads). Note the marked disruption of ICC networks in Kit+/copGFP; Lepob/obmice (F–H) intestine; and L–N, colon) compared with Kit+/copGFP mice (C–E, intestine; and l-K, colon). C, F, I, and L are confocal stacks representing full-thickness composite images. D, G, J, and M show optical sections of ICC-deep muscular plexus or ICC-IM, and E, H, K, and N show ICC at the myenteric plexus. Scale bars are in the far right panels.
Discussion
Since KIT was recognized as a specific biomarker for ICC in the GI tract, it has been a widely employed to characterize ICC distribution, the relation of ICC to other cells with which they interact, and to assess the integrity in animal models of GI disease and in samples of tissue from human patients. A useful next step in utilizing the relative selective expression of Kit is to exploit the cell-specific sequences that direct expression of Kit to ICC to make transgenic mice with constitutive expression of a robust reporter in ICC. A first Kit transgenic mouse (WlαcZ/+), with a reporter lαcZ gene, was generated by Bernex et al (1996).39 Kit+ cells and sites of Kit expression during embryogenesis were apparent in these mice, and expression of lacZ was useful for morphologic studies. However, visualization of β-gal, the gene product of lacZ, requires fixation and histochemical processing, restricting the usefulness of these mice for physiologic and genomic studies of ICC.
For physiologic and genomic studies, it is desirable to engineer mice with constitutive fluorescent reporters to facilitate identification and isolation of living cells. Two Kit-GFP transgenic lines were generated previously using pronuclear injection by Cairns et al40 and Berrozpe et al.41 These groups have studied the role of tissue-specific, transcriptional regulatory elements in the vicinity of the Kit gene in developing hematopoietic and germ cell lineages and mast cells, respectively. Pronuclear injection is a common method to create transgenic mice. However, this strategy has disadvantages over a targeted gene KI strategy: (1) random integration of a targeting construct in the genome, (2) multiple copy numbers of integration, (3) possibility of missing regulatory elements in the flanking regions of a gene, and (4) instability of integration in generation. The 2 Kit GFP transgenic lines showed enhanced green fluorescent protein (eGFP) expression in progenitor cells of the hematopoietic and germ cell lineages and mast cells respectively, but expression of eGFP in ICC in the GI tract was not reported in these mice. Targeted KI green mice were generated previously,42 using a construct containing the cDNA sequence of a Zoαnthus sp. green fluorescent protein (ZsGreen), and an N1 nuclear localization signal,43 fused to the first exon of Kit. However, ZsGreen expression in the mice was disappointing. First, ZsGreen was not homogeneously localized in the nucleus but rather sublocalized in an irregular shape in the nucleolus.42 ZsGreen was noted in ICC of the GI tract, but labeling appeared to be weak, and only 1 or a few particles per cell were detected.42 Subsequent use of this model for identification of ICC has not been reported.
The Kit+/copGFP mice generated in this study are distinguished from other transgenic mice with reporter localization in ICC in several ways. First, Kit+/copGFP mice are Kit locus targeted KI mice. Second, a new super bright copGFP gene was inserted at the first ATG of the first exon with a Kozak consensus sequence.32 This copGFP is characterized by bright green fluorescence (excitation/emission maximum 482/502 nm) and extra fast maturation at a wide range of temperatures.35 Third, no nuclear localization signal was added to the copGFP. The copGFP was expressed in the cytoplasmic region, allowing labeling cell bodies and processes of ICC (Figures 3 and 4). Fourth, Kit+/copGFP mice express sufficient reporter to provide excellent resolution of ICC and can be readily crossbred with animal models with GI disease to study effects on the ICC phenotype.
As a prototypic example of this latter advantage, we generated diabetic mice (Kit+/copGFP;Lepob/ob) that recapitulated both disruption of ICC-MY and ICC-IM (Figure 7) in diabetic GI tunica muscularis, as previously shown in Leprdb/db mice,44 and bright labeling of ICC remaining in these tissues. The loss of ICC in diabetes is progressive, beginning at approximately 16 weeks in the Lepob/ob mice. Thus, constitutive labeling of ICC will make it possible to sort ICC at various time points during the development of lesions of the ICC network and allow assessment of the genomic changes occurring within this specific population of cells. Discovering the pathways that are affected in ICC during loss of these cells may provide a means to prevent or retard loss so that restorative mechanisms might maintain functional ICC networks.
Supplementary Material
Acknowledgments
Funding
Supported by R37 DK-40569 (to K.M.S.) and P01 DK-41315 (to K.M.S.) from the National Institutes of Health (NIH); the Nevada Genomics Center for sequencing services; the UNR Cytometry Center for cytometric services, supported in part by the Nevada INBRE, P20 RR-016464; Whittemore Peterson Institute for providing the FC500 flow cytometer; and Zeiss LSM510 confocal microscope obtained with support from NIH1 S10 RR16871.
Abbreviations used in this paper
- 7-AAD
7-amino-actinomycin D
- Bio
biotin
- ES
embryonic stem
- Fc block
anti-mouse CD16/32
- ICC
interstitial cells of Cajal
- ICC-IM
intramuscular ICC
- ICC-MY
myenteric ICC
- ICC-SM
submucosal ICC
- Kl
knock-in
- KIT
tyrosine kinase
- PC7
PE-cyanine 7 tandem
- PCR
polymerase chain reaction
- PE
R-phyco-erythrin
- SA
streptavidin
- TxR
Texas Red
- eGFP
enhanced green fluorescent protein
- ZsGree
Zoanthus sp. green fluorescent protein
Footnotes
Supplementary Material
Note: To access the supplementary material accompanying this article, visit the online version of Gastroenterology at www.gastrojournal.org, and at doi: 10.1053/j.gastro.2009.11.007.
Conflicts of interest
The authors disclose no conflicts.
References
- 1.Huizinga JD, Thuneberg L, Kluppel M, et al. W/Kit gene required for interstitial cells of Cajal and for intestinal pacemaker activity. Nature. 1995;373:347–349. doi: 10.1038/373347a0. [DOI] [PubMed] [Google Scholar]
- 2.Torihashi S, Yokoi K, Nagaya H, et al. New monoclonal antibody (AIC) identifies interstitial cells of Cajal in the musculature of the mouse gastrointestinal tract. Auto Neurosci. 2004;113:16–23. doi: 10.1016/j.autneu.2004.05.004. [DOI] [PubMed] [Google Scholar]
- 3.Farrugia G. Interstitial cells of Cajal in health and disease. Neurogastroenterol Motil. 2008;20:54–63. doi: 10.1111/j.1365-2982.2008.01109.x. [DOI] [PubMed] [Google Scholar]
- 4.Ward SM, Burns AJ, Torihashi S, et al. Mutation of the protooncogene C-Kit blocks development of interstitial cells and electrical rhythmicity in murine intestine. J Physiol London. 1994;480:91–97. doi: 10.1113/jphysiol.1994.sp020343. [DOI] [PMC free article] [PubMed] [Google Scholar]
- 5.Burns AJ, Lomax AEJ, Torihashi S, et al. Interstitial cells of Cajal mediate inhibitory neurotransmission in the stomach. Proc Natl Acad Sci U S A. 1996;93:12008–12013. doi: 10.1073/pnas.93.21.12008. [DOI] [PMC free article] [PubMed] [Google Scholar]
- 6.Ward SM, Beckett EAH, Wang XY, et al. Interstitial cells of Cajal mediate cholinergic neurotransmission from enteric motor neurons. J Neurosci. 2000;20:1393–1403. doi: 10.1523/JNEUROSCI.20-04-01393.2000. [DOI] [PMC free article] [PubMed] [Google Scholar]
- 7.Gockel I, Bohl JRE, Eckardt VF, et al. Reduction of interstitial cells of Cajal (ICC) associated with neuronal nitric oxide synthase (n-NOS) in patients with achalasia. Am J Gastroenterol. 2008;103:856–864. doi: 10.1111/j.1572-0241.2007.01667.x. [DOI] [PubMed] [Google Scholar]
- 8.Khelif K, De Laet MH, Chaouachi B, et al. Achalasia of the cardia in Allgrove’s (triple A) syndrome—histopathologic study of 10 cases. Am J Surg Pathol. 2003;27:667–672. doi: 10.1097/00000478-200305000-00010. [DOI] [PubMed] [Google Scholar]
- 9.He CL, Soffer EE, Ferris CD, et al. Loss of interstitial cells of Cajal and inhibitory innervation in insulin-dependent diabetes. Gastroenterology. 2001;121:427–434. doi: 10.1053/gast.2001.26264. [DOI] [PubMed] [Google Scholar]
- 10.Ordog T, Takayama I, Cheung WKT, et al. Remodeling of networks of interstitial cells of Cajal in a murine model of diabetic gastroparesis. Diabetes. 2000;49:1731–1739. doi: 10.2337/diabetes.49.10.1731. [DOI] [PubMed] [Google Scholar]
- 11.Zarate N, Mearin F, Wang XY, et al. Severe idiopathic gastroparesis due to neuronal and interstitial cells of Cajal degeneration: pathological findings and management. Gut. 2003;52:966–970. doi: 10.1136/gut.52.7.966. [DOI] [PMC free article] [PubMed] [Google Scholar]
- 12.Vanderwinden JM, Liu H, Delaet MH, et al. Study of the interstitial cells of Cajal in infantile hypertrophic pyloric stenosis. Gastroenterology. 1996;111:279–288. doi: 10.1053/gast.1996.v111.pm8690192. [DOI] [PubMed] [Google Scholar]
- 13.Midrio P, Vannucchi MG, Pieri L, et al. Delayed development of interstitial cells of Cajal in the ileum of a human case of gastroschisis. J Cell Mol Med. 2008;12:471–478. doi: 10.1111/j.1582-4934.2008.00277.x. [DOI] [PMC free article] [PubMed] [Google Scholar]
- 14.Boeckxstaens GE, Rumessen JJ, de Wit L, et al. Abnormal distribution of the interstitial cells of Cajal in an adult patient with pseudo-obstruction and megaduodenum. Am J Gastroenterol. 2002;97:2120–2126. doi: 10.1111/j.1572-0241.2002.05932.x. [DOI] [PubMed] [Google Scholar]
- 15.Huizinga JD, Berezin I, Sircar K, et al. Development of interstitial cells of Cajal in a full-term infant without an enteric nervous system. Gastroenterology. 2001;120:561–567. doi: 10.1053/gast.2001.21200. [DOI] [PubMed] [Google Scholar]
- 16.Isozaki K, Hirota S, Miyagawa J, et al. Deficiency of c-kit( + ) cells in patients with a myopathic form of chronic idiopathic intestinal pseudo-obstruction. Am J Gastroenterol. 1997;92:332–334. [PubMed] [Google Scholar]
- 17.Jain D, Moussa K, Tandon M, et al. Role of interstitial cells of Cajal in motility disorders of the bowel. Am J Gastroenterol. 2003;98:618–624. doi: 10.1111/j.1572-0241.2003.07295.x. [DOI] [PubMed] [Google Scholar]
- 18.He CL, Burgart L, Wang LN, et al. Decreased interstitial cell of Cajal volume in patients with slow-transit constipation. Gastroenterology. 2000;118:14–21. doi: 10.1016/s0016-5085(00)70409-4. [DOI] [PubMed] [Google Scholar]
- 19.Lyford GL, He CL, Soffer E, et al. Pan-colonic decrease in interstitial cells of Cajal in patients with slow transit constipation. Gut. 2002;51:496–501. doi: 10.1136/gut.51.4.496. [DOI] [PMC free article] [PubMed] [Google Scholar]
- 20.Wedel T, Spiegler J, Soellner S, et al. Enteric nerves and interstitial cells of Cajal are altered in patients with slow-transit constipation and megacolon. Gastroenterology. 2002;123:1459–1467. doi: 10.1053/gast.2002.36600. [DOI] [PubMed] [Google Scholar]
- 21.Vanderwinden JM, Rumessen JJ, Liu H, et al. Interstitial cells of Cajal in human colon and in Hirschsprung’s disease. Gastroenterology. 1996;111:901–910. doi: 10.1016/s0016-5085(96)70057-4. [DOI] [PubMed] [Google Scholar]
- 22.Ward SM, Gershon MD, Keef K, et al. Interstitial cells of Cajal and electrical activity in ganglionic and aganglionic colons of mice. Am J Physiol Gastrointest Liver Physiol. 2002;283:G445–G456. doi: 10.1152/ajpgi.00475.2001. [DOI] [PubMed] [Google Scholar]
- 23.Wang XY, Zarate N, Soderholm JD, et al. Ultrastructural injury to interstitial cells of Cajal and communication with mast cells in Crohn’s disease. Neurogastroenterol Motil. 2007;19:349–364. doi: 10.1111/j.1365-2982.2006.00894.x. [DOI] [PubMed] [Google Scholar]
- 24.Porcher C, Baldo M, Henry M, et al. Deficiency of interstitial cells of Cajal in the small intestine of patients with Crohn’s disease. Am J Gastroenterol. 2002;97:118–125. doi: 10.1111/j.1572-0241.2002.05430.x. [DOI] [PubMed] [Google Scholar]
- 25.Lu G, Qian X, Berezin I, et al. Inflammation modulates in vitro colonic myoelectric and contractile activity and interstitial cells of Cajal. Am J Physiol Gastrointest Liver Physiol. 1997;36:G1233–G1245. doi: 10.1152/ajpgi.1997.273.6.G1233. [DOI] [PubMed] [Google Scholar]
- 26.Ohlsson B, Veress B, Lindgren S, et al. Enteric ganglioneuritis and abnormal interstitial cells of Cajal: features of inflammatory bowel disease. Inflamm Bowel Dis. 2007;13:721–726. doi: 10.1002/ibd.20095. [DOI] [PubMed] [Google Scholar]
- 27.Rumessen JJ. Ultrastructure of interstitial cells of Cajal at the colonic submuscular border in patients with ulcerative colitis. Gastroenterology. 1996;111:1447–1455. doi: 10.1016/s0016-5085(96)70005-7. [DOI] [PubMed] [Google Scholar]
- 28.Patterson D, Koch K, Abell T, et al. A multicenter placebo-controlled study of domperidone in diabetic gastroparesis. Gastroenterology. 1993;104:A564. [Google Scholar]
- 29.Ordog T. Interstitial cells of Cajal in diabetic gastroenteropathy. Neurogastroenterol Motil. 2008;20:8–18. doi: 10.1111/j.1365-2982.2007.01056.x. [DOI] [PubMed] [Google Scholar]
- 30.Osoegawa K, Tateno M, Woon PY, et al. Bacterial artificial chromosome libraries for mouse sequencing and functional analysis. Genome Res. 2000;10:116–128. [PMC free article] [PubMed] [Google Scholar]
- 31.Ro S, Hwang SJ, Ordog T, et al. Adenovirus-based short hairpin RNA vectors containing an eGFP marker and mouse U6, human H1 or human U6 promoter. Bio Techniques. 2005;38:625–627. doi: 10.2144/05384RN01. [DOI] [PubMed] [Google Scholar]
- 32.Kozak M. An analysis of 5’-noncoding sequences from 699 vertebrate messenger RNAs. Nucleic Acids Res. 1987;15:8125–8148. doi: 10.1093/nar/15.20.8125. [DOI] [PMC free article] [PubMed] [Google Scholar]
- 33.Wellershaus K, Degen J, Deuchars J, et al. A new conditional mouse mutant reveals specific expression and functions of connexin36 in neurons and pancreatic β-cells. Exp Cell Res. 2008;314:997–1012. doi: 10.1016/j.yexcr.2007.12.024. [DOI] [PubMed] [Google Scholar]
- 34.Ro S, Hwang SJ, Muto M, et al. Anatomic modifications in the enteric nervous system of piebald mice and physiological consequences to colonic motor activity. Am J Physiol Gastrointest Liver Physiol. 2006;290:G710–G718. doi: 10.1152/ajpgi.00420.2005. [DOI] [PubMed] [Google Scholar]
- 35.Shagin DA, Barsova EV, Yanushevich YG, et al. GFP-like proteins as ubiquitous metazoan superfamily: evolution of functional features and structural complexity. Mol Biol Evol. 2004;21:841–850. doi: 10.1093/molbev/msh079. [DOI] [PubMed] [Google Scholar]
- 36.Karolchik D, Kuhn RM, Baertsch R, et al. The UCSC genome browser database: 2008 update. Nucleic Acids Res. 2008;36:D773–D779. doi: 10.1093/nar/gkm966. [DOI] [PMC free article] [PubMed] [Google Scholar]
- 37.Abe S, Lauby G, Boyer C, et al. Lung cells transplanted to irradiated recipients generate lymphohematopoietic progeny. Am J Respir Cell Mol Biol. 2004;30:491–499. doi: 10.1165/rcmb.2003-0140OC. [DOI] [PubMed] [Google Scholar]
- 38.Ingalls AM, Dickie MM, Snell GD. Obese, a new mutation in the house mouse. Obes Res. 1996;4:101. doi: 10.1002/j.1550-8528.1996.tb00519.x. [DOI] [PubMed] [Google Scholar]
- 39.Bernex F, DeSepulveda P, Kress C, et al. Spatial and temporal patterns of c-kit-expressing cells in W-lacZ/+ and W-lacZ/W-lacZ mouse embryos. Development. 1996;122:3023–3033. doi: 10.1242/dev.122.10.3023. [DOI] [PubMed] [Google Scholar]
- 40.Cairns LA, Moroni E, Levantini E, et al. Kit regulatory elements required for expression in developing hematopoietic and germ cell lineages. Blood. 2003;102:3954–3962. doi: 10.1182/blood-2003-04-1296. [DOI] [PubMed] [Google Scholar]
- 41.Berrozpe G, Agosti V, Tucker C, et al. A distant upstream locus control region is critical for expression of the Kit receptor gene in mast cells. Mol Cell Biol. 2006;26:5850–5860. doi: 10.1128/MCB.01854-05. [DOI] [PMC free article] [PubMed] [Google Scholar]
- 42.Wouters M, Smans K, Vanderwinden JM. W-ZsGreen/+: a new green fluorescent protein knock-in mouse model for the study of KIT-expressing cells in gut and cerebellum. Physiol Genomics. 2005;22:412–421. doi: 10.1152/physiolgenomics.00105.2005. [DOI] [PubMed] [Google Scholar]
- 43.Quaye IKE, Toku S, Tanaka T. Sequence requirement for nucleolar localisation of rat ribosomal protein L31. Eur J Cell Biol. 1996;69:151–155. [PubMed] [Google Scholar]
- 44.Yamamoto T, Watabe K, Nakahara M, et al. Disturbed gastrointestinal motility and decreased interstitial cells of Cajal in diabetic db/db mice. J Gastroenterol Hepatol. 2008;23:660–667. doi: 10.1111/j.1440-1746.2008.05326.x. [DOI] [PubMed] [Google Scholar]
Associated Data
This section collects any data citations, data availability statements, or supplementary materials included in this article.


