

Abstract
Climatic fluctuations during the Quaternary period governed the demography of species and contributed to population differentiation and ultimately speciation. Studies of these past processes have previously been hindered by a lack of means and genetic data to model changes in effective population size (N e) through time. However, based on diploid genome sequences of high quality, the recently developed pairwise sequentially Markovian coalescent (PSMC) can estimate trajectories of changes in N e over considerable time periods. We applied this approach to resequencing data from nearly 200 genomes of four species and several populations of the Ficedula species complex of black‐and‐white flycatchers. N e curves of Atlas, collared, pied and semicollared flycatcher converged 1–2 million years ago (Ma) at an N e of ≈ 200 000, likely reflecting the time when all four species last shared a common ancestor. Subsequent separate N e trajectories are consistent with lineage splitting and speciation. All species showed evidence of population growth up until 100–200 thousand years ago (kya), followed by decline and then start of a new phase of population expansion. However, timing and amplitude of changes in N e differed among species, and for pied flycatcher, the temporal dynamics of N e differed between Spanish birds and central/northern European populations. This cautions against extrapolation of demographic inference between lineages and calls for adequate sampling to provide representative pictures of the coalescence process in different species or populations. We also empirically evaluate criteria for proper inference of demographic histories using PSMC and arrive at recommendations of using sequencing data with a mean genome coverage of ≥18X, a per‐site filter of ≥10 reads and no more than 25% of missing data.
Keywords: Atlas flycatcher, collared flycatcher, coverage, effective population size, pied flycatcher, PSMC, semicollared flycatcher, whole‐genome sequencing
Introduction
Patterns of genetic diversity within and among species are mainly a consequence of their evolutionary history. Among other factors, Quaternary (2.4 Myr to the present) climatic fluctuations strongly influenced species’ demography and distribution (Hewitt 2000, 2004). During glaciation periods, many suitable habitats disappeared or, in case of the Northern Hemisphere, shifted to the south because of ice and permafrost. As a consequence, species went extinct or shifted to new areas where they survived in glacial refugia and/or adapted to new conditions (Arenas et al. 2012). During interglacial periods, large areas of suitable habitats again became available and were recolonized.
These range shifts likely had several genetic consequences (Hewitt 2004; Arenas et al. 2012). For example, previously large populations may have lost significant amounts of genetic diversity due to bottlenecks in glacial refugia and/or founder effects during postglacial expansions. Geographic separation of populations in glacial refugia promoted differentiation between populations and in some cases led to allopatric speciation (Hewitt 2004). Moreover, newly established species came into secondary contact during expansions from different refugia, exchanged migrants and sometimes formed stable hybrid zones (Barton & Gale 1993; Hewitt 2001).
In Europe, the main southern refugial areas included Iberia, Italy, the Balkans and the Caucasus. Their contribution to recolonization of northern Europe via relatively well‐defined postglacial migration routes has differed from species to species (Taberlet et al. 1998; Hewitt 1999, 2000). Growing evidence also suggests more complex patterns of spatial separation of species during glacial periods (Stewart & Lister 2001; Gómez & Lunt 2007; Schmitt 2007). For example, some species had their refugia in more northern parts of Europe (Kotlík et al. 2006; Parducci et al. 2012; Ruiz‐González et al. 2013), while southern refugia likely consisted of heterogeneous climatic niches/regions that created complex ‘refugia‐within‐refugium’ patterns (Canestrelli & Nascetti 2008; Dubreuil et al. 2008; Ursenbacher et al. 2008; Ferrero et al. 2011; Miraldo et al. 2011; Velo‐Antón et al. 2012; Pabijan et al. 2015).
Demographic inference based on genetic data and the pairwise sequentially Markovian coalescent
A wide range of approaches based on genetic data have been developed to infer the demographic history of species (Emerson et al. 2001; Hey & Machado 2003). For example, relatively recent examples that attracted a great deal of interest are Skyline plots (Ho & Shapiro 2011) and methods based on approximate Bayesian computation (Beaumont 2010; Csilléry et al. 2010). However, many demographic methods are restricted to particular molecular markers (Pybus et al. 2000; Drummond et al. 2005; Nikolic & Chevalet 2014), can only use a limited number of loci (Hey & Nielsen 2004; Heled & Drummond 2008) and/or are computational intensive when applied to large data sets (Beaumont et al. 2002; Heled & Drummond 2008; Csilléry et al. 2010). Sampling large numbers of unlinked loci spread across the genome may be needed to accurately estimate population genetic parameters and determine the timing of speciation events and rates of gene flow (Edwards & Beerli 2000; Arbogast et al. 2002; Ballard & Whitlock 2004). But until recently, the application of genomewide approaches has been limited by the access to genomewide population genetic data, although this is about to change with the rapid developments in sequencing technology and population genomics (Ellegren 2014).
New analytical methods have been developed that provide unique opportunities to model changes in effective population size (N e) through time using information from whole‐genome sequences (Li & Durbin 2011). Specifically, the pairwise sequentially Markovian coalescent (PSMC) model uses a hidden Markov framework and identifies historical recombination events across a single diploid genome. It also infers the time to the most recent common ancestor (TMRCA) for each independent DNA segment and, based on the rate of coalescent events and the TMRCA distribution, infers ancestral N e at a given time epoch (Li & Durbin 2011). The approach capitalizes on coalescent theory according to which pairwise sequence divergence is proportional to the time of the coalescent, with long stretches of low heterozygosity corresponding to recent coalescent events and short stretches of high heterozygosity corresponding to more ancient coalescent events. The rate of the inferred coalescent events at a given time is inversely proportional to N e. A major strength of the method is that capitalizes on the combined pattern of the distributions of the TMRCA between two alleles in an individual at a very large number of loci spread across the genome. This is in contrast to previous coalescent work analysing nonrecombining loci like mtDNA.
The PSMC approach has recently been applied in several genome sequencing projects (e.g. Groenen et al. 2012; Cho et al. 2013; Zhan et al. 2013; Zhao et al. 2013; Carbone et al. 2014; Lamichhaney et al. 2015), including investigation of past population‐size changes of endangered species (Zhao et al. 2013; Li et al. 2014; Nadachowska‐Brzyska et al. 2015), detection of population declines or expansions to assist in the interpretation of population genomic statistics (Deinum et al. 2015), or to complement other demographic history inference (Nadachowska‐Brzyska et al. 2013; Freedman et al. 2014). However, in spite of its recent wide usage, it is still not clear how the quality and quantity of sequence data affect the outcome of PSMC analyses.
Study system
Western Palearctic black‐and‐white flycatchers of the genus Ficedula are represented by four closely related species: Atlas flycatcher (F. speculigera), collared flycatcher (F. albicollis), pied flycatcher (F. hypoleuca) and semicollared flycatcher (F. semitorquata). They are all small‐bodied (15 g), migratory, forest‐dwelling passerine birds. The pied flycatcher (von Haartman 1949, 1956; Campbell 1968; Harvey et al. 1985; Alatalo et al. 1986; Lundberg & Alatalo 1992) and the collared flycatcher (Gustafsson & Sutherland 1988; Gustafsson & Pärt 1990; Gustafsson et al. 1995; Merilä & Sheldon 2000; Qvarnström et al. 2000, 2006; Both & Visser 2001; Merilä et al. 2001) represent two of the most well‐studied bird species in ecological and evolutionary research, including aspects of how the two species diverged and speciated (Alatalo et al. 1982, 1990; Sætre et al. 1997; Veen et al. 2001; Saether et al. 2007; Qvarnström et al. 2010; Sætre & Saether 2010; Ellegren et al. 2012). Whereas collared flycatcher and semicollared flycatcher occur in restricted ranges in eastern and southeastern Europe (with semicollared extending into the Middle East and southwestern Asia), and Atlas flycatchers are endemic to northwestern Africa, pied flycatcher is widely distributed from the Iberian peninsula over central and northern Europe to Western Asia (Fig. 1). Their current range distributions must have been shaped by climate changes during Pleistocene, with species origins likely reflecting survival in separate glacial refugia (Sætre et al. 2001a). In a previous study, we found that the demographic model with the highest support in approximate Bayesian computation modelling was one with significant declines in N e in both collared flycatcher and pied flycatcher since their divergence from a common ancestor (Nadachowska‐Brzyska et al. 2013). Secondary contact has been established at least between collared flycatcher and pied flycatcher in central Europe and on the Baltic Sea islands (Tegelstrom & Gelter 1990; Sætre et al. 1999a; Veen et al. 2001). Previous genetic studies of flycatchers have indicated no or very low levels of gene flow between allopatric populations of the species, and moderate gene flow in the area of recent sympatry on the Baltic Sea islands (Hogner et al. 2012; Backström et al. 2013; Nadachowska‐Brzyska et al. 2013).
Figure 1.
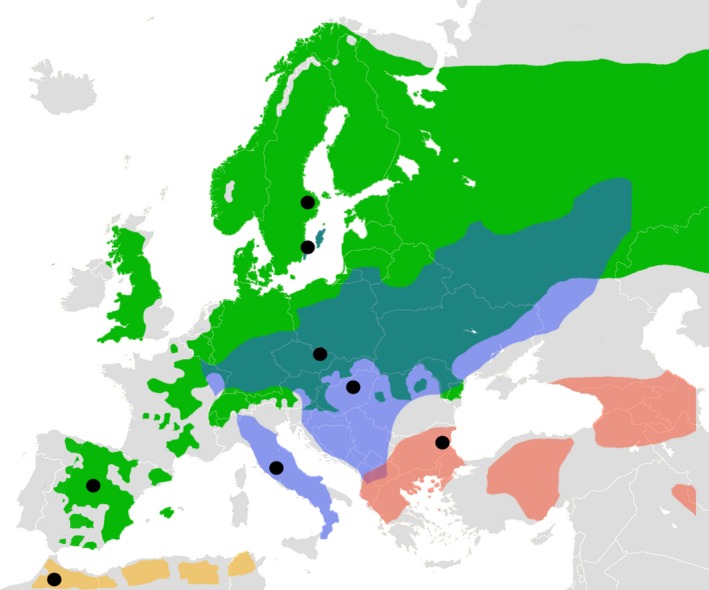
Range distributions of the four black‐and‐white Ficedula species: pied flycatcher (green), collared flycatcher (violet), semicollared flycatcher (red) and Atlas flycatcher (yellow). Black circles indicate sampling locations.
We have recently sequenced and de novo assembled the genome of collared flycatcher (Ellegren et al. 2012; Kawakami et al. 2014), providing an excellent platform for in‐depth population genomic analyses. Here, we use whole‐genome resequencing data from 200 individuals, representing 10 different populations of the four flycatcher species, to infer changes in N e over time using PSMC modelling. We first analyse how the quality and quantity of sequence data affect the outcome of PSMC analyses and then go on to test for concordance in the demographic history of populations and species, and examine when they are likely to have had a common ancestry.
Material and methods
Sampling
We analysed 200 individuals of four closely related Ficedula flycatcher species that have been recently subject to whole‐genome resequencing (Burri et al. 2015). In brief, sequencing was performed with Illumina paired‐end sequencing technology on a HiSeq 2000 instrument at the SNP&SEQ Technology Platform of Uppsala University. Individually tagged libraries with an insert size of approximately 450 bp were created and sequenced from both ends using 100 cycles. All raw sequencing reads were mapped to a repeat‐masked version of the collared flycatcher genome assembly version ficalb1.5 (Kawakami et al. 2014) using bwa 0.7.4 (Li & Durbin 2009). Alignment quality was enhanced by local realignment with gatk (McKenna et al. 2010; DePristo et al. 2011), and duplicates were marked with picard (http://picard.sourceforge.net). Base quality score recalibrations (BQSR) were performed for each population separately.
Eighty individuals were sequenced of each of collared flycatcher and pied flycatcher, with two samples (one from each taxon set) excluded after identification as F1 hybrids, 20 of Atlas flycatcher and 20 of semicollared flycatcher. Collared flycatchers were sampled at four distinct locations in Italy, Hungary, the Czech Republic and on the Baltic Sea island Öland (Sweden), and pied flycatchers were sampled in Spain, Sweden (mainland), Czech Republic and on Öland. We will for simplicity refer to these birds as representing populations from their geographical origin of sampling and are well aware of that their geographical distribution during glaciation cycles must have been different. Atlas flycatchers were sampled in the Moroccan Atlas Mountains and semicollared flycatchers in Bulgaria.
PSMC analysis
PSMC analysis requires a consensus genome sequence (fastq) that can be filtered to account for coverage and sequencing errors. For each sampled individual, we obtained a fastq sequence for autosomal regions using the ‘mpileup’ command in samtools (Li et al. 2009). The samtools pipeline uses single individuals for SNP calling, that is it is not based on population frequencies for variant calling and does not assume Hardy–Weinberg equilibrium. This approach has been used in the majority of PSMC‐based studies so far. By default, sites were marked as missing data if the root‐mean‐squared mapping quality of reads covering the site was below 25, the site was within 10 bp of a predicted insertion–deletion polymorphism or the inferred consensus quality (i.e. the Phred‐scaled probability that the consensus is wrong) was below 20. To minimize the impact of collapsed regions in the assembly, we also masked all sites at which read depth was more than twice the average read depth across the genome.
As our data included individuals for which the mean genomewide coverage varied from 7 to 29, we had the opportunity to investigate the influence of the combined effect of mean coverage and minimum per‐site coverage thresholds on the results of the PSMC analysis. To perform such a test, we applied a set of four additional filters to the sequence data from one collared flycatcher population (Baltic Sea, n = 19). First, we ran PSMC analysis without coverage filtering. Second, we excluded sites for which read depth was less than one‐third of the average read depth (representing default settings in PSMC when analysing highly covered genomes, https://github.com/lh3/psmc). Third, we excluded sites for which read depth was less than six. Finally, we included only sites for which read depth ≥10. The last two filters were based on the results from several simulation studies (Crawford & Lazzaro 2012; Alex Buerkle & Gompert 2013; Korneliussen et al. 2013; Han et al. 2014) and led to the elimination of sites in the focal individual. We also noted how much missing data different coverage filters generated.
Based on the results from the test described above (see Results and Discussion), we ran the PSMC analyses for all other populations with a minimum read depth per site of 10. The settings of the PSMC analysis (−p and −t options) were chosen manually according to suggestions given by H. Li and R. Durbin (2011, https://github.com/lh3/psmc) and based on our previous experience (Nadachowska‐Brzyska et al. 2013). The upper limit of the TMRCA was set to 5 (this is set by ‐t option) and the initial θ/ρ value to 1 (this is set by ‐r option). N e was inferred across 34 free atomic time intervals (4 + 30*2 + 4+6 + 10), which means that the first population‐size parameter spans the first four atomic time intervals, each of the next 30 parameters spans two intervals, while the last three parameters span four, six and 10 intervals, respectively (this is set by the −p option). To check for variance in N e, we performed 100 bootstrap replicates (the number of replicates limited by computational time). Bootstrapping was conducted by randomly sampling with replacement 5‐Mb sequence segments obtained from the consensus genome sequence. For denoting estimates of N e, we use . A generation time of 2 years (Brommer et al. 2004) and a mutation rate of 1.4 × 10⁻⁹ year/site (Ellegren et al. 2012) were applied.
Results
Influence of per‐site coverage filter
We started by examining the effect of different filters for the per‐site coverage (no filter, ≥1/3 of mean genomewide coverage, ≥6 reads or ≥10 reads) in one collared flycatcher population. Overall, the shape of the N e curve was not strongly affected by varying the filtering criteria for individuals with high (≥20X) mean genome coverage. However, N e estimates increased with increased filter level, with estimates on average ≈30% higher at a filter of ≥10 than when no filter was used (Fig. 2A, Fig. S1, Supporting information). Moreover, there was slight shift in the N e curve towards more recent times when filtering level was increased (Fig. 2A, Fig. S1, Supporting information).
Figure 2.
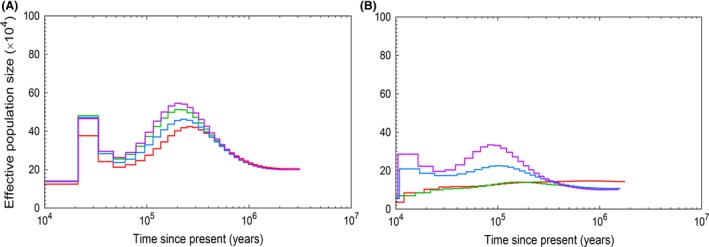
Influence of different per‐site filtering regimes on PSMC plots for example individuals with high (A; coverage 23) and low (B; coverage 8) mean genomewide coverage. Colours of the lines indicate filtering thresholds: no filtering (red), read depth ≥1/3 of the average read depth (green), read depth ≥6 (blue) and read depth ≥10 (violet). Note that each panel shows data from a single individual subject to different filtering thresholds.
For individuals with lower mean genome coverage (especially ≤10X), the per‐site filtering criteria had a significant effect not only on the magnitude of N e estimates but also on the shape of the N e curve, such that population expansions and contractions were poorly captured at low filters (Fig. 2B). The lower the mean coverage, the more pronounced were the differences among different filtering regimes. A filter of one‐third of the mean coverage or less in individuals with a mean genome coverage ≤10X produced nearly flat lines without signals of population‐size changes, while expansions and contractions were visible with a stringent filter of 10 (Fig. 2B). In all further analyses, we therefore applied a per‐site filter of 10.
The effect of mean genome coverage and missing data
A similar shape of the N e curve was seen among all individuals in the test population although amplitudes were less pronounced at low coverage (Fig. 3), likely reflecting a failure to correctly call heterozygous sites. The tendency of more marked N e dynamics at higher mean genome coverage was manifested in a strong positive correlation between coverage and the maximum N e estimate along the N e curve (r = 0.83, P < 0.00001; Fig. 4A). A similar correlation was found between mean coverage and the timing of the maximum N e (r = 0.91, P < 0.00001; Fig. 4B). Individual N e curves did not converge until a mean genome coverage of ≥18X. On the other hand, the precise shapes were then remarkably similar among individuals.
Figure 3.
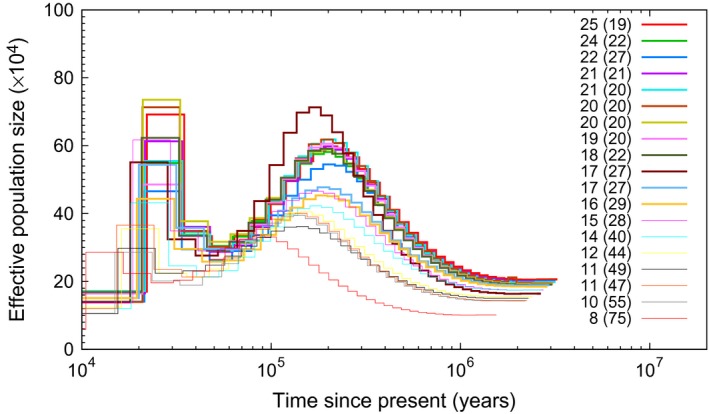
PSMC results for a test population of collared flycatcher. The numbers in figure legend indicate mean genomewide coverage with percentage of missing data in brackets.
Figure 4.
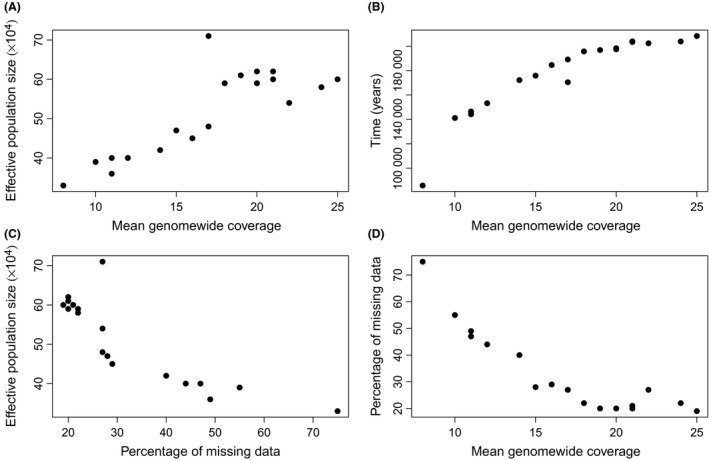
Correlations between maximum N e estimate and mean genomewide coverage (A), timing of the maximum N e estimate and mean coverage (B), maximum N e estimate and percentage of missing data (C), and percentage of missing data and mean coverage (D).
The proportion of sites with missing data (which may either be due to failure to meet the per‐site filter or because of poor sequencing quality) in the test population ranged from 19% to 75% per individual. Not surprisingly, there was a strong negative correlation between amount of missing data and mean coverage (r = −0.89; P < 0.00001), but some outliers (relatively high coverage coupled with relatively high amount of missing data) were also seen (Fig. 4C; Fig. 3). There was also a strong negative correlation between maximum N e and amount of missing data (r = −0.85, P < 0.00001; Fig. 4D). For individuals where the amount of missing data was less than 25%, N e curves were essentially identical (Fig. 3). This suggests that both mean coverage and percentage of missing data should be use as filtering thresholds in PSMC analysis.
Based on these results, we will address and discuss patterns of N e variation among populations and species of Ficedula flycatchers by only considering individuals that have no more than 25% of missing data and a mean genomewide coverage of ≥18X (and applying a per‐site coverage filter of ≥10; Table S1, Supporting information). We present PSMC plots for all individuals not meeting these criteria in Figs S2–S10 (Supporting information).
Variation in patterns of N e dynamics among collared flycatcher populations
The PSMC results clearly indicated that all four analysed collared flycatcher populations shared ancestry and demography for most of the investigated time period (Fig. 5, Fig. S11, Supporting information). The species’ started to increase from a level of ≈200 000 approximately 1 Ma, reached its highest population size ( ≈ 600,000) at approximately 200 kya and then declined for a period of about hundred thousand years. A minimum of ≈ 300,000 was reached about 50 kya for the populations from Hungary, Czech Republic and Baltic Sea; the minimum of the Italian population was ≈ 400,000 at the same time point. Then, a new and significant population expansion occurred 20–50 kya, visible for all four populations. Up until this time point, all populations thus showed similar N e curves. However, the Baltic Sea population declined to a level of ≈ 170 000 at 10–20 kya. The Baltic Sea islands (including Gotland) are thought to have been colonized by collared flycatchers in modern times, perhaps in the 18th or 19th century (Lundberg & Alatalo 1992). To exclude that inbreeding in connection with founding of these island populations affected PSMC estimates, we filtered identity‐by‐descent (IBD) regions larger than 10 kb, that is regions with runs of homozygosity (runs of consecutive homozygous SNPs) in individual birds. However, this had essentially no effect on the PSMC curves (Fig. S12, Supporting information; thresholds of 5 kb and 20 kb had similarly no effect).
Figure 5.
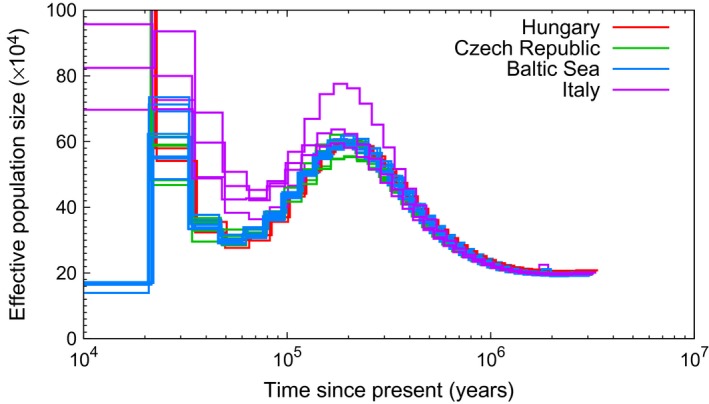
PSMC estimates of the changes in effective population size over time for four populations of collared flycatcher. Each line represents one individual and only individuals with no more than 25% of missing data and a mean genomewide coverage of ≥18X are included (Italy, n = 4; Hungary, n = 2; Czech Republic, n = 5; Baltic Sea, n = 8).
Variation in patterns of N e dynamics among pied flycatcher populations
Patterns in pied flycatcher differed from collared flycatcher both in terms of the shape of the N e curve and in the consistency among populations (Fig. 6, Fig. S13, Supporting information). Populations from Sweden (mainland), the Baltic Sea and the Czech Republic shared similar N e dynamics through time. They had a stable of ≈ 200 000 from approximately 3 Ma to 700–800 kya and then started to slowly increase in size. From ≈ 50 kya, a significant population expansion took off, with the most recent N e estimates >1 000 000. These pied flycatcher populations did not show any signs of population decline during the investigated time period.
Figure 6.
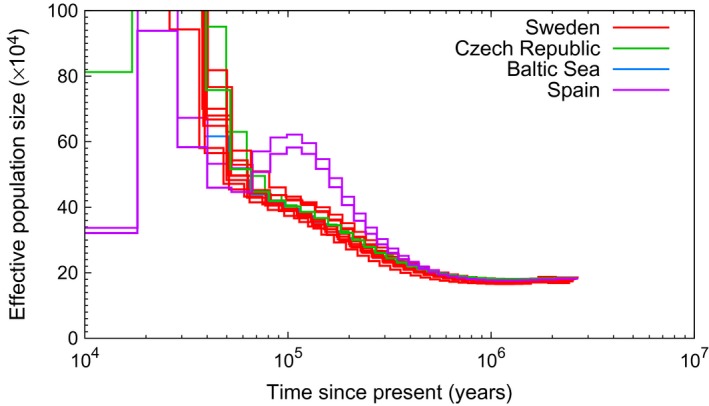
PSMC estimates of the changes in effective population size over time for four populations of pied flycatcher. Each line represents one individual and only individuals with no more than 25% of missing data and a mean genomewide coverage of ≥18X are included (Spain, n = 2; Sweden, n = 8; Czech Republic, n = 2; Baltic Sea, n = 1).
PSMC analysis of Spanish pied flycatchers revealed similar N e dynamics up until 300–400 kya. However, from then on, the Spanish population experienced a significant expansion much earlier than the central/northern European populations. Moreover, in sharp contrast to the other populations, the expansion halted at an ≈ 600 000 at 100 kya and was followed by a population decline at the beginning of the last glacial period (LGP). Another cycle of expansion–contraction took place subsequently within a relatively short period of time, with reaching ≈ 1 000 000 20–30 kya but then decreasing to ≈ 340 000 by the end of the LGP.
N e dynamics in Atlas flycatcher and semicollared flycatcher
For the two remaining Ficedula species, we had data from one population of each species. Atlas flycatchers increased in numbers from ≈ 200 000 1 Ma to 500 000–600 000 about 150 kya. Then, the species went through a cycle of population contraction and expansion, with a minimum of ≈ 300 000 50 kya and up again to ≈ 600 000 at the end of the LGP (Fig. 7). The semicollared flycatcher was the one of the four species that showed the least fluctuations in over time; was relatively constant between 200 000 and 300 000 up until 50 kya (Fig. 7). More recently, increased to ≈ 800 000 by the end of the LGP.
Figure 7.
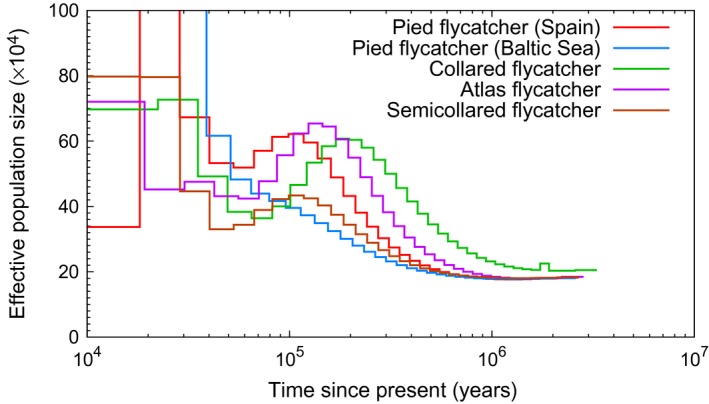
PSMC estimates of the changes in effective population size over time for four black‐and‐white Ficedula species.
Among‐species variation in the dynamics of N e trajectories and statistical inference of PSMC curves
Our results showed that the N e curves of the four species converged back in time around 1–2 Ma, at ≈ 200 000 and then started to diverge (Fig. 7). This is consistent with the existence of a common ancestor at this time, followed by rapid radiation and speciation. The curve for the collared flycatcher indicates a slightly higher ancestral than for the other species (240 000 vs 200 000), but the difference is small and could be related to a minor difference in generation time or some methodological aspect.
To our knowledge, there is no specifically developed statistics available to test if PSMC curves from two or more populations differ significantly. However, by bootstrapping, we can analyse to what extent curves from different populations overlap at certain time points. Figure 8 shows bootstrapped PSMC curves for each of the four species, and Figs S11 and S13 (Supporting information) show bootstrapped curves for different populations of collared flycatcher and pied flycatcher, respectively. Some important conclusion can be made from these plots. For example, the separation into four different N e curves, one for each species, starting about 1 Ma is well supported by separated confidence intervals. The recent decrease in N e of the Baltic Sea collared flycatcher is supported by separated confidence intervals compared to other collared flycatcher populations. Finally, the rapid increase in N e of Spanish pied flycatcher 200–80 kya is supported by separated confidence intervals compared to other pied flycatcher populations. As a general note, the bootstrap curves clearly confirm the limitations of PSMC analysis to infer demography in the more recent past; there is considerable variation in N e estimates among bootstrap replicates for the most recent time intervals.
Figure 8.
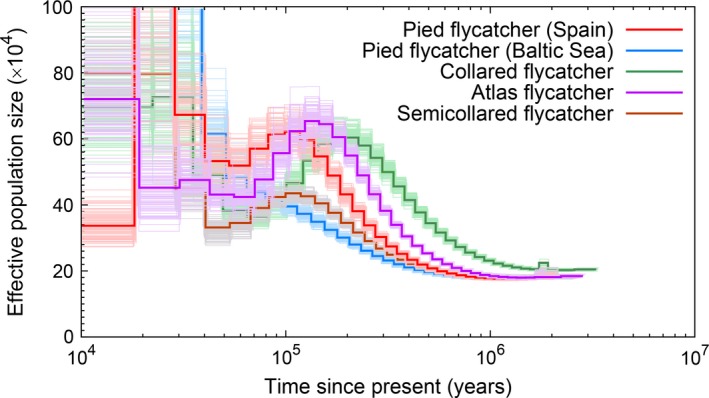
PSMC estimates of changes in the effective population size over time for four Ficedula flycatcher species, with bootstrap results indicated with thin lines.
Discussion
PSMC in molecular ecology
Stimulated by the work of McVean & Cardin (2005), the PSMC approach was developed by Li & Durbin (2011). PSMC is a rare example of a method that uses whole‐genome sequence information and at the same time is relatively fast and straightforward to apply to any organisms. Indeed, it has been common in recent genome assembly projects to analyse the data in a PSMC framework (e.g. Cho et al. 2013; Zhan et al. 2013; Zhao et al. 2013; Carbone et al. 2014; Kelley et al. 2014; Lamichhaney et al. 2015). An obvious advantage of the PSMC method is that it gives detailed information on historical‐ancient N e dynamics, information that is often impossible or very hard to obtain from other demographic methods (e.g. Beaumont et al. 2002; Hey & Nielsen 2004).
As for any other population genetic method that uses NGS data, PSMC is prone to biases that are the result of sequencing/genotyping errors and missing data (Crawford & Lazzaro 2012; MacLeod et al. 2013; Han et al. 2014). Not filtering out sites with low coverage will intuitively lead to heterozygous positions being erroneously called homozygous (Han et al. 2014). Alex Buerkle and Gompert (2013) noted that six or more reads of the same allele are needed to call an individual homozygous at a particular site with >95% confidence (using binomial probability for an individual's genotype at a locus). Filtering is likely to be particularly critical to PSMC analysis because it estimates the TMRCA based on the observed patterns of local heterozygosity across the genome sequence. At least two types of coverage parameters may be important: coverage at individual sites and mean genomewide coverage. The latter will affect the confidence with which SNP calling can capture the true genotype state across the genome (Crawford & Lazzaro 2012; Han et al. 2014). Our results suggested that a mean genomewide coverage of 18X and no more than 25% of missing data is necessary to make reliable demographic inference using PSMC analysis. These filters may provide a general recommendation to similar studies in other species. Importantly, we note that this recommendation is more stringent than what has been used in some recent PSMC‐based demographic studies (Li et al. 2013; Lamichhaney et al. 2015).
As many other methods that infer demography from sequence data, PSMC suffers from uncertainty in parameter estimation due to factors unrelated to data quality, like scaling parameters used to interpret the results and/or confounding effects of selection or particular demographic situations [e.g. PSMC does not deal well with very sudden changes in population size and may smooth them out; (Li & Durbin 2011)]. Mutation rate and generation time estimates are necessary to scale the results of PSMC analyses and if these estimates are under‐ or overestimated, the PSMC would also be biased. However, mutation rate and generation time estimates influence the PSMC outputs in a predictable manner: they do not change the principal shape of the PSMC curve but only move the curve along the axes (Nadachowska‐Brzyska et al. 2015). For example, a halved generation time will double the estimate of N e (given a fixed mutation rate per year) and a halved mutation rate per year will move the curve to older times and also double the estimate of N e.
In the context of PSMC analysis, mutation rate estimates are related to the influence of selection on sequence variation. Heterozygosity is reduced in regions subject to purifying selection (or to selective sweeps), as well as in genomic regions linked to loci under selection. The rate of mutation is typically considered independent of the fitness effects of new mutations, but (Li & Durbin 2011) noted that the influence of reduced heterozygosity due to selection is similar to the effect of reduced mutation rate. When masking coding sequences in the human genome they found 5% higher heterozygosity than the genomewide average and by making a corresponding correction of the mutation rate, the PSMC estimates from both data sets were nearly identical.
In general, species‐wide (global) N e estimates can be biased if there is population structure. In the case of PSMC analysis, historical‐ancient population structure would imply that coalescences occur less frequently. As a consequence, PSMC may overestimate N e at any period of time when the species has been subdivided into separated populations (Li & Durbin 2011). Broadly speaking, the effect should be positively correlated with the number of isolated populations; the more structure within species, the more overestimated will N e be at the time of separation. As the extent and character of ancient population structure (and how this has varied over time, for example during glacial cycles) is hard to know for most species, it is difficult to judge the effect on PSMC analyses, or on other coalescent‐based demographic methods for that matter.
In summary, applying genetic methods for inferring demography comes with several caveats and so is the case also with PSMC analysis (see further Freedman et al. 2014; Deinum et al. 2015; Nadachowska‐Brzyska et al. 2015). An important aspect in future work using the PSMC approach should be to keep the caveats in mind when interpreting results. Also, attempts should be made to reduce biases caused by the quality of data. In the present study, we feel that we have been able to reduce the impact of several potential biases. We made an extensive investigation of the effects of variable data quality, and based on the results of this analysis, we used stringent filtering criteria. Moreover, with the access to a flycatcher genome assembly and a wealth of comparative genomic data based on sequence alignment to other bird species (Ellegren et al. 2012), we have access to detailed mutation rate estimates for the flycatcher lineage. Furthermore, accurate generation time estimates are available from life tables on fecundity and survivorship (Brommer et al. 2004). Importantly, the possibility of substantial differences in genomewide mutation rate and/or generation time among the investigated species seems negligible given their close relatedness and similar ecology.
As a final remark it should be emphasized that the PSMC cannot accurately resolve demography in times relatively recent compared to the average TMRCA (the number of recent coalescent events joining sequences will in most cases be very small). An interesting solution to this limitation has recently been presented by Schiffels & Durbin (2014) by the introduction of the multiple sequential Markovian coalescent (MSMC). This method uses genome sequences from several individuals (but not too many, for reasons of the approximations involved and computational complexity) and focuses on the first coalescence between all pairs of haplotypes. It can also handle population structure. At present, the MSMC framework builds on haploid sequences and thus requires phased data, which can be difficult to retrieve for many organisms.
Demography of Ficedula flycatchers
The phylogenetic relationships among the four black‐and‐white Ficedula flycatchers have been a matter of discussion (Lundberg & Alatalo 1992; Sætre et al. 2001ab). Mitochondrial DNA (mtDNA) data suggested that they shared a common ancestor <1.5–2.0 Ma (Sætre et al. 2001a) and ABC modelling of whole‐genome sequences indicated that collared flycatcher and pied flycatcher diverged <1 Ma (Nadachowska‐Brzyska et al. 2013). An extensive phylogenomic analysis indicates that the four species radiated in quick succession (Nater at al. 2015). Several coalescence‐based species tree methods support an asymmetric topology with a sister relationship between Atlas flycatcher and pied flycatcher, with collared flycatcher as outgroup and semicollared flycatcher at the root. Parameter estimation suggest a 90% highest posterior density interval (HPDI) for divergence time between semicollared flycatcher and the other species of 815–1731 kya, between collared flycatcher and Atlas flycatcher‐pied flycatcher of 386–888 kya, and between Atlas flycatcher and pied flycatcher of 185–645 kya (Nater et al. 2015).
Formally, identical shapes of N e curves do not exclude that two or more populations were differentiated yet showed similar N e dynamics. For example, divergent lineages may have been similarly affected by glacial cycles. However, the different PSMC curves displayed by the four species <1 Ma demonstrate that this has not been the case at least during that time period and it seems indeed unlikely that four species with geographically distinct distributions and variation in habit preferences (see further below) would have nearly identical N e. We therefore favour the interpretation of convergent PSMC curves (similar N e trajectories) of all four species up until 1–2 Ma as shared ancestry and demographic history at that time. This is consistent with what has previously been found and suggests that PSMC analyses of multiple species can accurately pinpoint the timing of lineage splitting.
All four species (but only the Spanish population of pied flycatchers) have experienced at least one cycle of population expansion and decline, which is not unexpected for western Palearctic species during Quaternary periods of alternating glacials and interglacials (Fig. 7). We estimated that the first decline in all species started 100–200 kya, which means that it approximately corresponds to the time of glaciation period MIS 6 (191–130 kya; Lisiecki & Raymo 2005), indicating range contraction and associated reduction in abundance. The decline continued through the warmer MIS5e period (130–109 kya) and during the LGP.
In contrast, pied flycatchers from central/northern populations increased in throughout the whole investigated time period, especially in more recent times. Given its current distribution over large parts of Europe including boreal forests up to a latitude of 70°N, and its tolerance of higher altitudes in central Europe than other Ficedula species, it may have been less sensitive to glacial periods and able to maintain stable and widespread populations even under such periods. While pied flycatchers breed in both coniferous and deciduous forests, collared flycatcher and semicollared flycatcher are limited to deciduous forests and their current distributions are restricted to southern Europe. It is interesting to note that after a long period of relatively slow increase in , the start of the more exponential increase of central/northern European pied flycatchers ≈ 50 kya approximately coincides with a relatively long period of decline of both collared flycatcher and semicollared flycatcher. It is tempting to see these as related events with a possible scenario being that declining collared flycatcher populations allowed pied flycatchers to expand into new habitats, or, conversely, that expanding pied flycatcher populations led to contraction of collared flycatchers. In areas where pied flycatcher and collared flycatcher currently occur in sympatry, there is strong interspecific competition for food sources and suitable nest cavities (Löhrl 1955; Alerstam et al. 1978;. Collared flycatcher has a more aggressive behaviour than its sister species and is dominant in competition over nest sites (Lundberg & Alatalo 1992). This may lead to the exclusion of pied flycatchers in areas where they co‐occur and forced use of less preferred habitats (Sætre et al. 1999a), seemingly inconsistent with the observed expansion of pied flycatcher populations concurrent with reduction of collared flycatcher populations. However, it has been suggested that the collared flycatcher is more sensitive to climate fluctuations, a hypothesis supported by the finding of a correlation between index of large‐scale climate variation and annual density fluctuations in collared flycatcher but not in pied flycatcher (Sætre et al. 1999b). An interesting topic for further research would therefore be to use climate data to model the change in distribution of the two species over time.
The pronounced increase in of Spanish pied flycatchers starting 300–400 kya, not seen in other pied flycatcher populations, could potentially be due to gene flow. The trajectory of the N e curve of Spanish pied flycatchers resembles that of Atlas flycatchers and its geographical vicinity (in the Atlas Mountains of Morocco, Algeria and Tunisia) and phylogenetic sister relationship to the pied flycatcher (Nater et al. in 2015) makes gene flow between these adjacent populations a possible explanation to a common pattern of change in . The Atlas flycatcher was previously regarded as a subspecies of pied flycatcher but its taxonomic status was revised by DNA evidence suggesting that is should be seen as a distinct species (Sætre et al. 2001a, b), a conclusion more recently supported by genomewide data (Nater et al. in 2015).
The discrepancy in the timing of significant population expansion and the contrasting patterns of population dynamics subsequently shown by Spanish and other pied flycatcher populations could suggest long‐term structure in refugial populations on the Iberian Peninsula. For example, central/northern Europe populations may represent postglacial expansions from a distinct origin compared to the refugial Spanish population. This scenario would be compatible with the geographical heterogeneity of the Iberian Peninsula and its refugia‐within‐refugium structure (Gómez & Lunt 2007). The existence of distinct genetic lineages in Iberia has been reported for other species including birds (Centeno‐Cuadros et al. 2009; Ferrero et al. 2011; Miraldo et al. 2011; Velo‐Antón et al. 2012). Moreover, our results fit well with observed degrees of genetic differentiation among pied flycatcher populations in Europe with significant F ST estimates between Spanish and central/northern European populations (Lehtonen et al. 2009; Hogner et al. 2012; Backström et al. 2013).
Changes in N e in the more recent past
Table 1 summarizes population‐size estimates through time in the investigated species, with focus on the recent past including the most recent PSMC estimates of N e towards the end of LGP, ABC and IMa estimates of current N e, and current census sizes (N). These numbers suggest dramatic fluctuations in population size in connection with the last glacial maximum (LGM) and subsequently during Holocene up to present. For example, PSMC estimated the N e of central/northern European pied flycatchers at >1 000 000 40 kya. This is about an order of magnitude higher than current N e, indicating a severe population decline after 40 kya (Table 1). On the other hand, the current census size of pied flycatchers in Europe – 36–60 million birds – indicating a striking recent population expansion. The combined data from estimates of population sizes in pied flycatcher thus suggest that range contractions by the end of LGM implied a significant reduction in population size. Then, as the ice sheet disappeared after the LGM, a dramatic population expansion took place, compatible with the successful recolonization of large parts of Europe including subarctic areas. Clearly, census and effective population size are two very different parameters and we note that the N e/N ratio for pied flycatcher (≈0.001) is much lower than what is often estimated or assumed for many species (≈0.1; Frankham 1995). Such low N e/N ratios as seen in pied flycatchers are indeed expected after population expansions (Kalinowski & Waples 2002; Hedrick 2005).
Table 1.
Point estimates of recent (0–40 kya) N e and current census sizes of the four black‐and‐white Ficedula species
| Species | Census size | Current N e (ABC estimate)a | Current N e (IMa estimate)b | N e at the end of LGP estimated by PSMC |
|---|---|---|---|---|
| Atlas flycatcher | ? | — | 111 000–176 000 | 600 000 |
| Collared flycatcher | 4 200 000–7 200 000 | 79 000 | 232 000–435 000 | 700 000–1 000 000 |
| Pied flycatcher | 36 000 000–60 000 000 | 31 000 | 106 000–269 000 | >1 000 000 |
| Semicollared flycatcher | 40 000–210 000 | — | 136 000–235 000 | 800 000 |
Collared flycatcher also shows recent fluctuations in population size, although less pronounced than in the case of the pied flycatcher. decreased from the LGM to the present and the species may recently have increased in size again. A different pattern is seen in the semicollared flycatcher (Fig. 7). As for the other species, decreased from the LGM to the present but there is no sign of recovery as census size is similar to current N e (i.e. N e/N ≈ 1). Habitat destruction is likely to underlie an ongoing decline (BirdLife International 2004) and the distribution is fragmented and the species listed a near‐threatened on the IUCN Red List (http://www.iucnredlist.org/details/full/22709319/0).
Conclusions
PSMC analysis offer unique possibilities to investigate population dynamics back in time. As illustrated in this study of four species and multiple populations of Ficedula flycatchers, it can reveal fluctuations in N e during a time period when glacial cycles profoundly affected the climate and thereby the distribution of habitats and species. The fluctuations observed in this system suggest that demographic modelling including scenarios of constant population size or relatively simple trends of declines or expansions may be biologically less relevant and misleading. Coupled with recent effects of the LGP and LGM on the distribution and abundance of species, the complex demographic history displayed by these species with several cycles of population expansion and decline may very well be representative for many species in temperate regions of the Northern Hemisphere.
It may also be of some general significance that our results demonstrate heterogeneity in N e dynamics among closely related species, and even between populations within species (like in the case of the pied flycatcher). This would caution against extrapolation of demographic inference between lineages and call for adequate sampling to provide representative pictures of the coalescence process in different species or populations. Moreover, our results provide important recommendations and guidelines for the amount and quality of sequence data needed to make reliable inference of N e dynamics.
K.N.B. and H.E. conceived of the study and wrote the manuscript. K.N.B. performed the PSMC analyses. R.B. and L.S. processed raw sequencing data.
Data accessibility
DNA sequences: All sequences have been deposited to the European Nucleotide Archive under the BioProject Accession no. PRJEB7359.
Supporting information
Table S1 Number of individuals per population with a mean genome coverage of ≥18X, and meeting the criteria of a per‐site filter of ≥10 reads and with no more than 25% of missing data.
Fig. S1 PSMC results for a test population of collared flycatchers for different per‐site filtering regimes: no filtering (A), read depth ≥1/3 of the average read depth (B), read depth ≥6 (C).
Fig. S2 PSMC estimates of changes in the effective population size over time for collared flycatchers from Italy. The numbers in the figure legend indicate mean coverage with percentage of missing data in brackets.
Fig. S3 PSMC estimate of the effective population size change over time for collared flycatcher from Hungary. The numbers in figure legend indicate mean coverage and percentage of missing data in brackets.
Fig. S4 PSMC estimate of the effective population size change over time for collared flycatcher from Czech Republic. The numbers in figure legend indicate mean coverage and percentage of missing data in brackets.
Fig. S5 PSMC estimate of the effective population size change over time for pied flycatcher from Spain. The numbers in figure legend indicate mean coverage and percentage of missing data in brackets.
Fig. S6 PSMC estimate of the effective population size change over time for pied flycatcher from Sweden. The numbers in figure legend indicate mean coverage and percentage of missing data in brackets.
Fig. S7 PSMC estimate of the effective population size change over time for pied flycatcher from Czech Republic. The numbers in figure legend indicate mean coverage and percentage of missing data in brackets.
Fig. S8 PSMC estimate of the effective population size change over time for pied flycatcher from Ӧland. The numbers in figure legend indicate mean coverage and percentage of missing data in brackets.
Fig. S9 PSMC estimate of the effective population size change over time for Atlas flycatcher. The numbers in figure legend indicate mean coverage and percentage of missing data in brackets.
Fig. S10 PSMC estimate of the effective population size change over time for semicollared flycatcher. The numbers in figure legend indicate mean coverage and percentage of missing data in brackets.
Fig. S11 PSMC estimates of changes in the effective population size over time for example individuals from four collared flycatcher populations, with bootstrap results indicated with thin lines.
Fig. S12 Comparison of original PSMC results (red line) and PSMC results obtained after removing long runs (10 kb) of homozygosity (green line).
Fig. S13 PSMC estimates of changes in the effective population size over time for example individuals from four pied flycatcher populations, with bootstrap results indicated with thin lines.
Acknowledgements
We thank Wieslaw Babik for discussions about PSMC modelling, two anonymous reviewers for helpful suggestions and members of the Ellegren and Jochen Wolf laboratory groups for helpful discussions. Financial support was obtained from the European Research Council (AdG 249976), Knut and Alice Wallenberg Foundation and the Swedish Research Council (2007‐8731, 2010‐5650 and 2013‐8271).
References
- Alatalo R, Gustafsson L, Lundberg A (1982) Hybridization and breeding success of collared and pied flycatchers on the island of Gotland. The Auk, 99, 285–291. [Google Scholar]
- Alatalo RV, Lundberg A, Glynn C (1986) Female pied flycatchers choose territory quality and not male characteristics. Nature, 323, 152–153. [Google Scholar]
- Alatalo RV, Eriksson D, Gustafsson L, Lundberg A (1990) Hybridization between pied and collared flycatchers sexual and speciation theory. Journal of Evolutionary Biology, 3, 375–390. [Google Scholar]
- Alerstam T, Ebenman B, Sylven M, Tamm S, Ulfstrand S (1978) Hybridization as an agent of competition between two bird allospecies: Ficedula albicollis and F. hypoleuca on the island of Gotland in the Baltic. Oikos, 31, 326–331. [Google Scholar]
- Alex Buerkle C, Gompert Z (2013) Population genomics based on low coverage sequencing: how low should we go? Molecular Ecology, 22, 3028–3035. [DOI] [PubMed] [Google Scholar]
- Arbogast BS, Edwards Scott, Wakeley J et al (2002) Estimating divergence times from molecular data on phylogenetic and population genetic timescales. Annual Review of Ecology and Systematics, 33, 707–740. [Google Scholar]
- Arenas M, Ray N, Currat M, Excoffier L (2012) Consequences of range contractions and range shifts on molecular diversity. Molecular Biology and Evolution, 29, 207–218. [DOI] [PubMed] [Google Scholar]
- Backström N, Sætre G‐P, Ellegren H (2013) Inferring the demographic history of European Ficedula flycatcher populations. BMC Evolutionary Biology, 13, 2. [DOI] [PMC free article] [PubMed] [Google Scholar]
- Ballard JWO, Whitlock MC (2004) The incomplete natural history of mitochondria. Molecular Ecology, 13, 729–744. [DOI] [PubMed] [Google Scholar]
- Beaumont M (2010) Approximate Bayesian Computation in evolution and ecology. Annual Review of Ecology, Evolution, and Systematics, 41, 379–406. [Google Scholar]
- Beaumont M, Zhang W, Balding DJ (2002) Approximate Bayesian computation in population genetics. Genetics, 162, 2025–2035. [DOI] [PMC free article] [PubMed] [Google Scholar]
- BirdLife International (2004) Birds in Europe: Population Estimates, Trends and Conservation Status. BirdLife International, Cambridge, UK. [Google Scholar]
- Both C, Visser ME (2001) Adjustment to climate change is constrained by arrival date in a long‐distance migrant bird. Nature, 411, 296–298. [DOI] [PubMed] [Google Scholar]
- Brommer J, Gustafsson L, Pietiäinen H, Merilä J (2004) Single‐generation estimates of individual fitness as proxies for long‐term genetic contribution. American Naturalist, 163, 505–517. [DOI] [PubMed] [Google Scholar]
- Burri R, Nater A, Kawakami T et al (2015) Linked selection and recombination rate variation drive the evolution of the genomic landscape of differentiation across the speciation continuum of Ficedula flycatchers. Genome Research, 25, 1656–1665. [DOI] [PMC free article] [PubMed] [Google Scholar]
- Campbell B (1968) The Dean nestbox study. Forestry, 41, 27–46. [Google Scholar]
- Canestrelli D, Nascetti G (2008) Phylogeography of the pool frog Rana (Pelophylax) lessonae in the Italian peninsula and Sicily: multiple refugia, glacial expansions and nuclear‐mitochondrial discordance. Journal of Biogeography, 35, 1923–1936. [Google Scholar]
- Carbone L, Alan Harris R, Gnerre S et al (2014) Gibbon genome and the fast karyotype evolution of small apes. Nature, 513, 195–201. [DOI] [PMC free article] [PubMed] [Google Scholar]
- Centeno‐Cuadros A, Delibes M, Godoy JA (2009) Phylogeography of Southern Water Vole (Arvicola sapidus): evidence for refugia within the Iberian glacial refugium? Molecular Ecology, 18, 3652–3667. [DOI] [PubMed] [Google Scholar]
- Cho YS, Hu L, Hou H et al (2013) The tiger genome and comparative analysis with lion and snow leopard genomes. Nature Communications, 4, 2433. [DOI] [PMC free article] [PubMed] [Google Scholar]
- Crawford JE, Lazzaro BP (2012) Assessing the accuracy and power of population genetic inference from low‐pass next‐generation sequencing data. Frontiers in Genetics, 3, 1–13. [DOI] [PMC free article] [PubMed] [Google Scholar]
- Csilléry K, Blum MGB, Gaggiotti OE, François O (2010) Approximate Bayesian Computation (ABC) in practice. Trends in Ecology and Evolution, 25, 410–418. [DOI] [PubMed] [Google Scholar]
- Deinum EE, Halligan DL, Ness RW et al (2015) Recent evolution in Rattus norvegicus is shaped by declining effective population size. Molecular Biology and Evolution, 32, 2547–2558. [DOI] [PMC free article] [PubMed] [Google Scholar]
- DePristo MA, Banks E, Poplin R et al (2011) A framework for variation discovery and genotyping using next‐generation DNA sequencing data. Nature Genetics, 43, 491–498. [DOI] [PMC free article] [PubMed] [Google Scholar]
- Drummond AJ, Rambaut A, Shapiro B, Pybus OG (2005) Bayesian coalescent inference of past population dynamics from molecular sequences. Molecular Biology and Evolution, 22, 1185–1192. [DOI] [PubMed] [Google Scholar]
- Dubreuil M, Riba M, Mayol M (2008) Genetic structure and diversity in Ramonda myconi (Gesneriaceae): effects of historical climate change on a preglacial relict species. American Journal of Botany, 95, 577–587. [DOI] [PubMed] [Google Scholar]
- Edwards S, Beerli P (2000) Perspective: gene divergence, population divergence, and the variance in coalescence time in phylogeographic studies. Evolution, 54, 1839–1854. [DOI] [PubMed] [Google Scholar]
- Ellegren H (2014) Genome sequencing and population genomics in non‐model organisms. Trends in Ecology and Evolution, 29, 51–63. [DOI] [PubMed] [Google Scholar]
- Ellegren H, Smeds L, Burri R et al (2012) The genomic landscape of species divergence in Ficedula flycatchers. Nature, 491, 756–760. [DOI] [PubMed] [Google Scholar]
- Emerson BC, Paradis E, Thébaud C (2001) Revealing the demographic histories of species using DNA sequences. Trends in Ecology and Evolution, 16, 707–716. [Google Scholar]
- Ferrero ME, Blanco‐Aguiar JA, Lougheed SC et al (2011) Phylogeography and genetic structure of the red‐legged partridge (Alectoris rufa): more evidence for refugia within the Iberian glacial refugium. Molecular Ecology, 20, 2628–2642. [DOI] [PubMed] [Google Scholar]
- Frankham R (1995) Effective population size/adult population size ratios in wildlife: a review. Genetical Research, 66, 95–107. [DOI] [PubMed] [Google Scholar]
- Freedman AH, Gronau I, Schweizer RM et al (2014) Genome sequencing highlights the dynamic early history of dogs. PLoS Genetics, 10, e1004016. [DOI] [PMC free article] [PubMed] [Google Scholar]
- Gómez A, Lunt L (2007) Refugia within refugia: patterns of phylogeographic concordance in the Iberian Peninsula In: Phylogeography of Southern European Refugia: Evolutionary Perspectives on the Origins and Conservation of European Biodiversity (eds Weiss S, Ferrand N.), pp. 155–188. Springer, Amsterdam. [Google Scholar]
- Groenen M, Archibald AL, Uenishi H et al (2012) Analyses of pig genomes provide insight into porcine demography and evolution. Nature, 491, 393–398. [DOI] [PMC free article] [PubMed] [Google Scholar]
- Gustafsson L, Pärt T (1990) Acceleration of senescence in the collared flycatcher Ficedula albicollis by reproductive costs. Nature, 347, 279–281. [Google Scholar]
- Gustafsson L, Sutherland WJ (1988) The cost of reproduction in the collared flycatcher Ficedula albicollis . Nature, 335, 813–815. [Google Scholar]
- Gustafsson L, Qvarnström A, Sheldon BC (1995) Trade‐offs between life‐history traits and a secondary sexual character in male collared flycatchers. Nature, 375, 311–313. [Google Scholar]
- von Haartman L (1949) Der Trauerfliegenschnäpper I. Ortstreue und Rassenbildung. Acta Zoologica Fennica, 56, 1–104. [Google Scholar]
- von Haartman L (1956) Territory in the pied flycatcher Muscicapa hypoleuca. Ibis, 3, 460–475. [Google Scholar]
- Han E, Sinsheimer JS, Novembre J (2014) Characterizing bias in population genetic inferences from low‐coverage sequencing data. Molecular Biology and Evolution, 31, 723–735. [DOI] [PMC free article] [PubMed] [Google Scholar]
- Barton NH, Gale KS (1993) Genetic analysis of hybrid zones In: Hybrid Zones and the Evolutionary Process (ed. Harrison R.), pp. 13–45. Oxford University Press, New York. [Google Scholar]
- Harvey PH, Stenning MJ, Campbell B (1985) Individual variation in seasonal breeding success of pied flycatchers (Ficedula hypoleuca). Journal of Animal Ecology, 54, 391–398. [Google Scholar]
- Hedrick P (2005) Large variance in reproductive success and the Ne/N ratio. Evolution, 59, 1596–1599. [PubMed] [Google Scholar]
- Heled J, Drummond AJ (2008) Bayesian inference of population size history from multiple loci. BMC Evolutionary Biology, 8, 289. [DOI] [PMC free article] [PubMed] [Google Scholar]
- Hewitt G (1999) Post‐glacial re‐colonization of European biota. Biological Journal of the Linnean Society, 68, 87–112. [Google Scholar]
- Hewitt GM (2000) The genetic legacy of the Quaternary ice ages. Nature, 405, 907–913. [DOI] [PubMed] [Google Scholar]
- Hewitt GM (2001) Speciation, hybrid zones and phylogeography – or seeing genes in space and time. Molecular Ecology, 10, 537–549. [DOI] [PubMed] [Google Scholar]
- Hewitt GM (2004) Genetic consequences of climatic oscillations in the Quaternary. Philosophical Transactions of the Royal Society of London, Series B, 359, 183–195. [DOI] [PMC free article] [PubMed] [Google Scholar]
- Hey J, Machado CA (2003) The study of structured populations – new hope for a difficult and divided science. Nature Reviews Genetics, 4, 535–543. [DOI] [PubMed] [Google Scholar]
- Hey J, Nielsen R (2004) Multilocus methods for estimating population sizes, migration rates and divergence time, with applications to the divergence of Drosophila pseudoobscura and D. persimilis . Genetics, 167, 747–760. [DOI] [PMC free article] [PubMed] [Google Scholar]
- Ho SYW, Shapiro B (2011) Skyline‐plot methods for estimating demographic history from nucleotide sequences. Molecular Ecology Resources, 11, 423–434. [DOI] [PubMed] [Google Scholar]
- Hogner S, Sæther SA, Borge T et al (2012) Increased divergence but reduced variation on the Z chromosome relative to autosomes in Ficedula flycatchers: differential introgression or the faster‐Z effect? Ecology and Evolution, 2, 379–396. [DOI] [PMC free article] [PubMed] [Google Scholar]
- Kalinowski ST, Waples RS (2002) Relationship of effective to census size in fluctuating populations. Conservation Biology, 16, 129–136. [DOI] [PubMed] [Google Scholar]
- Kawakami T, Smeds L, Backström N et al (2014) A high‐density linkage map enables a second‐generation collared flycatcher genome assembly and reveals the patterns of avian recombination rate variation and chromosomal evolution. Molecular Ecology, 23, 4035–4058. [DOI] [PMC free article] [PubMed] [Google Scholar]
- Kelley JL, Peyton JT, Fiston‐Lavier A‐S et al (2014) Compact genome of the Antarctic midge is likely an adaptation to an extreme environment. Nature Communications, 5, 1–8. [DOI] [PMC free article] [PubMed] [Google Scholar]
- Korneliussen TS, Moltke I, Albrechtsen A, Nielsen R (2013) Calculation of Tajima's D and other neutrality test statistics from low depth next‐generation sequencing data. BMC Bioinformatics, 14, 289. [DOI] [PMC free article] [PubMed] [Google Scholar]
- Kotlík P, Deffontaine V, Mascheretti S et al (2006) A northern glacial refugium for bank voles (Clethrionomys glareolus). Proceedings of the National Academy of Sciences of the United States of America, 103, 14860–14864. [DOI] [PMC free article] [PubMed] [Google Scholar]
- Lamichhaney S, Berglund J, Almén MS et al (2015) Evolution of Darwin's finches and their beaks revealed by genome sequencing. Nature, 518, 371–377. [DOI] [PubMed] [Google Scholar]
- Lehtonen PK, Laaksonen T, Artemyev AV et al (2009) Geographic patterns of genetic differentiation and plumage colour variation are different in the pied flycatcher (Ficedula hypoleuca). Molecular Ecology, 18, 4463–4476. [DOI] [PubMed] [Google Scholar]
- Li H, Durbin R (2009) Fast and accurate short read alignment with Burrows‐Wheeler transform. Bioinformatics, 25, 1754–1760. [DOI] [PMC free article] [PubMed] [Google Scholar]
- Li H, Durbin R (2011) Inference of human population history from individual whole‐genome sequences. Nature, 475, 493–496. [DOI] [PMC free article] [PubMed] [Google Scholar]
- Li H, Handsaker B, Wysoker A et al (2009) The Sequence Alignment/Map format and SAMtools. Bioinformatics, 25, 2078–2079. [DOI] [PMC free article] [PubMed] [Google Scholar]
- Li M, Tian S, Jin L et al (2013) Genomic analyses identify distinct patterns of selection in domesticated pigs and Tibetan wild boars. Nature Genetics, 45, 1431–1438. [DOI] [PubMed] [Google Scholar]
- Li S, Li B, Cheng C et al (2014) Genomic signatures of near‐extinction and rebirth of the crested ibis and other endangered bird species. Genome Biology, 15, 557. [DOI] [PMC free article] [PubMed] [Google Scholar]
- Lisiecki LE, Raymo ME (2005) A Pliocene‐Pleistocene stack of 57 globally distributed benthic δ 18 O records. Paleoceanography, 20, PA1003. [Google Scholar]
- Löhrl H (1955) Beziehungen zwischen Halsband‐ und Trauerfliegenscnäpper (Muscicapa albicollis and M. hypoleuca) in dem Brulgebiet. Proceedings of the International Ornithological Congress, 11, 333–336. [Google Scholar]
- Lundberg A, Alatalo R (1992) The Pied Flycatcher. Poyser, London, UK. [Google Scholar]
- MacLeod IM, Larkin DM, Lewin HA, Hayes BJ, Goddard ME (2013) Inferring demography from runs of homozygosity in whole‐genome sequence, with correction for sequence errors. Molecular Biology and Evolution, 30, 2209–2223. [DOI] [PMC free article] [PubMed] [Google Scholar]
- McKenna A, Hanna M, Banks E et al (2010) The Genome Analysis Toolkit: a MapReduce framework for analyzing next‐generation DNA sequencing data. Genome Research, 20, 1297–1303. [DOI] [PMC free article] [PubMed] [Google Scholar]
- McVean GA, Cardin NJ (2005) Approximating the coalescent with recombination. Philosophical Transactions of the Royal Society of London . Series B, Biological Sciences, 360, 1387–1393. [DOI] [PMC free article] [PubMed] [Google Scholar]
- Merilä J, Sheldon BC (2000) Lifetime reproductive success and heritability in nature. American Naturalist, 155, 301–310. [DOI] [PubMed] [Google Scholar]
- Merilä J, Kruuk LE, Sheldon BC (2001) Cryptic evolution in a wild bird population. Nature, 412, 76–79. [DOI] [PubMed] [Google Scholar]
- Miraldo A, Hewitt GM, Paulo OS, Emerson BC (2011) Phylogeography and demographic history of Lacerta lepida in the Iberian Peninsula: multiple refugia, range expansions and secondary contact zones. BMC Evolutionary Biology, 11, 170. [DOI] [PMC free article] [PubMed] [Google Scholar]
- Nadachowska‐Brzyska K, Burri R, Olason PI et al (2013) Demographic divergence history of pied flycatcher and collared flycatcher inferred from whole‐genome re‐sequencing data. PLoS Genetics, 9, e1003942. [DOI] [PMC free article] [PubMed] [Google Scholar]
- Nadachowska‐Brzyska K, Li C, Smeds L, Zhang G, Ellegren H (2015) Temporal dynamics of avian populations during Pleistocene revealed by whole‐genome sequences. Current Biology, 25, 1–6. [DOI] [PMC free article] [PubMed] [Google Scholar]
- Nater A, Burri R, Kawakami T, Smeds L, Ellegren H (2015) Resolving evolutionary relationships in closely related species with whole‐genome sequencing data. Systematic Biology, 64, 1000–1017. [DOI] [PMC free article] [PubMed] [Google Scholar]
- Nikolic N, Chevalet C (2014) Detecting past changes of effective population size. Evolutionary Applications, 7, 663–681. [DOI] [PMC free article] [PubMed] [Google Scholar]
- Pabijan M, Zieliński P, Dudek K et al (2015) The dissection of a Pleistocene refugium: phylogeography of the smooth newt, Lissotriton vulgaris, in the Balkans. Journal of Biogeography, 42, 671–683. [Google Scholar]
- Parducci L, Jorgensen T, Tollefsrud MM et al (2012) Glacial survival of boreal trees in northern Scandinavia. Science, 335, 1083–1086. [DOI] [PubMed] [Google Scholar]
- Pybus OG, Rambaut A, Harvey PH (2000) An integrated framework for the inference of viral population history from reconstructed genealogies. Genetics, 155, 1429–1437. [DOI] [PMC free article] [PubMed] [Google Scholar]
- Qvarnström A, Pärt T, Sheldon BC (2000) Adaptive plasticity in mate preference linked to differences in reproductive effort. Nature, 405, 344–347. [DOI] [PubMed] [Google Scholar]
- Qvarnström A, Brommer JE, Gustafsson L (2006) Testing the genetics underlying the co‐evolution of mate choice and ornament in the wild. Nature, 441, 84–86. [DOI] [PubMed] [Google Scholar]
- Qvarnström A, Rice AM, Ellegren H (2010) Speciation in Ficedula flycatchers. Philosophical Transactions of the Royal Society of London, Series B, 365, 1841–1852. [DOI] [PMC free article] [PubMed] [Google Scholar]
- Ruiz‐González A, Madeira MJ, Randi E et al (2013) Phylogeography of the forest‐dwelling European pine marten (Martes martes): new insights into cryptic northern glacial refugia. Biological Journal of the Linnean Society, 109, 1–18. [Google Scholar]
- Saether SA, Saetre G‐P, Borge T et al (2007) Sex chromosome‐linked species recognition and evolution of reproductive isolation in flycatchers. Science, 318, 95–97. [DOI] [PubMed] [Google Scholar]
- Sætre G‐P, Saether SA (2010) Ecology and genetics of speciation in Ficedula flycatchers. Molecular Ecology, 19, 1091–1106. [DOI] [PubMed] [Google Scholar]
- Sætre G‐P, Král M, Bureš S (1997) Differential species recognition abilities of males and females in a flycatcher hybrid zone. Journal of Avian Biology, 28, 259–263. [Google Scholar]
- Sætre G‐P, Král K, Bures S, Ims R (1999a) Dynamics of a clinal hybrid zone and a comparison with island hybrid zones of flycatchers (Ficedula hypoleuca and F. albicollis). Journal of Zoology, 247, 53–64. [Google Scholar]
- Sætre G‐P, Post E, Král M (1999b) Can environmental fluctuation prevent competitive exclusion in sympatric flycatchers? Proceedings of the Royal Society of London, Series B: Biological Sciences, 266, 1247–1251. [Google Scholar]
- Sætre G‐P, Borge T, Lindell J et al (2001a) Speciation, introgressive hybridization and nonlinear rate of molecular evolution in flycatchers. Molecular Ecology, 10, 737–749. [DOI] [PubMed] [Google Scholar]
- Sætre G‐P, Borge T, Moum T (2001b) A new bird species? The taxonomic status of “the Atlas Flycatcher” assessed from DNA sequence analysis. Ibis, 143, 494–497. [Google Scholar]
- Schiffels S, Durbin R (2014) Inferring human population size and separation history from multiple genome sequences. Nature Genetics, 46, 919–925. [DOI] [PMC free article] [PubMed] [Google Scholar]
- Schmitt T (2007) Molecular biogeography of Europe: pleistocene cycles and postglacial trends. Frontiers in Zoology, 4, 11. [DOI] [PMC free article] [PubMed] [Google Scholar]
- Stewart JR, Lister AM (2001) Cryptic northern refugia and the origins of the modern biota. Trends in Ecology and Evolution, 16, 608–613. [Google Scholar]
- Taberlet P, Fumagalli L, Wust‐Saucy A, Cosson JF (1998) Comparative phylogeography and postglacial colonization routes in Europe. Molecular Ecology, 7, 453–464. [DOI] [PubMed] [Google Scholar]
- Tegelstrom H, Gelter H (1990) Haldane's rule and sex biassed gene flow between two hybridizing flycatcher species (Ficedula albicollis and F. hypoleuca, Aves: Muscicapidae). Evolution, 44, 2012–2021. [DOI] [PubMed] [Google Scholar]
- Ursenbacher S, Schweiger S, Tomović L et al (2008) Molecular phylogeography of the nose‐horned viper (Vipera ammodytes, Linnaeus (1758)): evidence for high genetic diversity and multiple refugia in the Balkan peninsula. Molecular Phylogenetics and Evolution, 46, 1116–1128. [DOI] [PubMed] [Google Scholar]
- Veen T, Borge T, Griffith SC et al (2001) Hybridization and adaptive mate choice in flycatchers. Nature, 411, 45–50. [DOI] [PubMed] [Google Scholar]
- Velo‐Antón G, Godinho R, Harris DJ et al (2012) Deep evolutionary lineages in a Western Mediterranean snake (Vipera latastei/monticola group) and high genetic structuring in Southern Iberian populations. Molecular Phylogenetics and Evolution, 65, 965–973. [DOI] [PubMed] [Google Scholar]
- Zhan X, Pan S, Wang J et al (2013) Peregrine and saker falcon genome sequences provide insights into evolution of a predatory lifestyle. Nature Genetics, 45, 563–566. [DOI] [PubMed] [Google Scholar]
- Zhao S, Zheng P, Dong S et al (2013) Whole‐genome sequencing of giant pandas provides insights into demographic history and local adaptation. Nature Genetics, 45, 67–71. [DOI] [PubMed] [Google Scholar]
Associated Data
This section collects any data citations, data availability statements, or supplementary materials included in this article.
Supplementary Materials
Table S1 Number of individuals per population with a mean genome coverage of ≥18X, and meeting the criteria of a per‐site filter of ≥10 reads and with no more than 25% of missing data.
Fig. S1 PSMC results for a test population of collared flycatchers for different per‐site filtering regimes: no filtering (A), read depth ≥1/3 of the average read depth (B), read depth ≥6 (C).
Fig. S2 PSMC estimates of changes in the effective population size over time for collared flycatchers from Italy. The numbers in the figure legend indicate mean coverage with percentage of missing data in brackets.
Fig. S3 PSMC estimate of the effective population size change over time for collared flycatcher from Hungary. The numbers in figure legend indicate mean coverage and percentage of missing data in brackets.
Fig. S4 PSMC estimate of the effective population size change over time for collared flycatcher from Czech Republic. The numbers in figure legend indicate mean coverage and percentage of missing data in brackets.
Fig. S5 PSMC estimate of the effective population size change over time for pied flycatcher from Spain. The numbers in figure legend indicate mean coverage and percentage of missing data in brackets.
Fig. S6 PSMC estimate of the effective population size change over time for pied flycatcher from Sweden. The numbers in figure legend indicate mean coverage and percentage of missing data in brackets.
Fig. S7 PSMC estimate of the effective population size change over time for pied flycatcher from Czech Republic. The numbers in figure legend indicate mean coverage and percentage of missing data in brackets.
Fig. S8 PSMC estimate of the effective population size change over time for pied flycatcher from Ӧland. The numbers in figure legend indicate mean coverage and percentage of missing data in brackets.
Fig. S9 PSMC estimate of the effective population size change over time for Atlas flycatcher. The numbers in figure legend indicate mean coverage and percentage of missing data in brackets.
Fig. S10 PSMC estimate of the effective population size change over time for semicollared flycatcher. The numbers in figure legend indicate mean coverage and percentage of missing data in brackets.
Fig. S11 PSMC estimates of changes in the effective population size over time for example individuals from four collared flycatcher populations, with bootstrap results indicated with thin lines.
Fig. S12 Comparison of original PSMC results (red line) and PSMC results obtained after removing long runs (10 kb) of homozygosity (green line).
Fig. S13 PSMC estimates of changes in the effective population size over time for example individuals from four pied flycatcher populations, with bootstrap results indicated with thin lines.
Data Availability Statement
DNA sequences: All sequences have been deposited to the European Nucleotide Archive under the BioProject Accession no. PRJEB7359.