Abstract
We investigate the phenomenon of protein-induced tubulation of lipid bilayer membranes within a continuum framework using Monte Carlo simulations coupled with the Widom insertion technique to compute excess chemical potentials. Tubular morphologies are spontaneously formed when the density and the curvature-field strength of the membrane-bound proteins exceed their respective thresholds and this transition is marked by a sharp drop in the excess chemical potential. We find that the planar to tubular transition can be described by a micellar model and that the corresponding free-energy barrier increases with an increase in the curvature-field strength (i.e., of protein-membrane interactions) and also with an increase in membrane tension.
I. INTRODUCTION
Highly curved membrane structures at the tens-of-nanometers length scale, such as buds, vesicles, and tubules, are essential functional intermediates in cell physiological processes. These intermediates are orchestrated by the membrane remodeling activities of a specialized class of proteins [1–8]. Proteins comprised of Bin-Amphiphysin-Rvs (BAR), epsin-N -terminal homology (ENTH), and inverted-BAR domains are enriched in cellular pathways involving traffic and transport in cells [1,9]. It is shown that these protein domains induce membrane curvature on a lipid membrane bilayer [1,10]; when multiple proteins are localized to a region, they act cooperatively to induce or stabilize the aforementioned morphologies that are otherwise unstable. Disklike shapes in the endoplasmic reticulum have been shown to be stabilized by deleted-in-polyposis and reticulon class proteins [11], while membrane tubules are induced through ENTH domains [12], BAR domains [1,10], dynamin [13], Shiga toxin [14], and other proteins such as Exo70 [15].
The molecular interaction of a curvature-inducing protein with a bilayer membrane has been extensively studied using all-atom and coarse-grained simulations for various classes of curvature remodeling proteins. These studies can be broadly classified into those that focus on the properties of the curvature field at the molecular scale [15–18] and those that focus on their membrane remodeling effects at the mesoscale [19–23]. On the other hand, at the continuum scale, elasticity-based theoretical and computational models have been used to study membrane remodeling by treating the individual proteins as an inclusion that modulates the curvature of the membrane surface [24–32]. Conventionally, the elastic Hamiltonian [see Eq. (1)] governing the energy of the membrane is taken to be the free energy of the system and in cases where membrane inclusions are also considered, the conformational entropy of these inclusions is accounted for by treating them as interacting particles with well-defined mixing energies [33–38]. However, in the context of thermodynamics, the true free energy should also account for the entropic contributions from the membrane degrees of freedom, which would involve explicit free-energy calculations that also account for thermal fluctuations of the system [39]. For example, an umbrella-sampling-based coarse-grained molecular simulation has been used to determine the polymerization free energy of BAR domain protein on membranes with varying tension [40]. Recently we introduced a number of free-energy methods derived from chemical physics [41] to delineate the free-energy landscapes of membranes remodeled by curvature inducing proteins [32,42,43]. In this article we use some of these methods to predict the stability of emergent morphologies such as tubules, blebs, and buds that arise due to the cooperative interactions of the proteins with the membrane.
Two theories based on stability and instability have been advocated to address the role of cooperativity. Leibler and others [33,44,45] have proposed that the presence of these proteins generates a curvature instability, which drives a morphological transition in the liposome, the onset of which is related directly to the strength of the induced-curvature field. The authors have developed an analytical model to describe the boundary that separates the planar and tubular regions; the boundary depends on factors such as membrane bending rigidity, tension, and induced-field strength. Sorre et al. [37] presented a thermodynamic theory (accounting for the protein’s translational entropy on the membrane surface) that quantifies the force acting on a tether pulled from a giant unilamellar vesicle in the presence of a curvature-coupling protein. However, the theory idealizes the emergent membrane geometry to be that of a cylinder attached to a flat membrane.
Alternatively, tour-de-force coarse-grained molecular dynamics calculations of membranes decorated with oligomerized networks of ENTH [18], N-BAR [17], and Exo70 [15] domains have shown that in the presence of these proteins tubular and vesicular morphologies are stable. A similar approach has been used to investigate the effect of protein aggregation, cooperative interactions, and membrane elasticity [40,46] on the formation of highly curved membrane morphologies. The first class of models utilizes a continuum top-down approach to determine regions of curvature instability and has limited capabilities in predicting emergent morphologies. The second class of models utilizes a bottom-up molecular approach to study microscopic mechanisms governing protein oligomerization and membrane remodeling, but does not directly compare the thermodynamic stabilities of the planar and tubular states.
Open questions relevant to cell physiology still remain unanswered and include the following: What is the nature of the emergent morphological state (cylinder, bud, bleb, etc.) and what are the morphological features at the mesoscale (e.g., protein density and organization, and geometry)? What is the thermodynamic free-energy landscape defining these morphological states and their relative stabilities, the driving forces governing these transitions (e.g., energetic vs entropic costs of driving membrane curvature)? More significantly, what are the roles of direct and membrane-mediated cooperative interactions of proteins in defining the transition free-energy landscapes (e.g., curvature contribution to the chemical potential determines protein recruitment by which curvature gradients define the driving force for transport).
Recent experimental work by Shi and Baumgart [47] has brought the focus back to these questions, where they report a reversible transition between the tubule and planar states, which is strongly influenced by protein surface density and membrane tension. It is becoming clear that the precise control of spatial localization and temporal dynamics of the curvature-inducing proteins is crucial not only to the regulation of membrane-mediated trafficking such as endocytosis [42] and exocytosis [15], but also in cell migration [48]. The physical microenvironment around a cell such as matrix stiffness and dimensionality will influence the physical variables on the membrane such as membrane stiffness or tension [49] and will dictate the underlying trafficking and migratory stimuli in such cells mediated by curvature-inducing proteins.
II. METHODS
We address the biophysical challenges discussed above by utilizing a mesoscale computational model we have developed to describe protein-induced tubulation and combining it with methods to delineate the free-energy landscapes of protein recruitment and membrane morphological transitions [32,42,43]. The core methodology for performing the simulations and free-energy calculations is essentially the same as that reported in [43]. Here we recapitulate only the essential details and enhancements to the methodology.
A. Continuum model for membrane and protein-induced spontaneous curvature field
Following the approaches in our previous works [32,42,43], the membrane is modeled as a thin elastic sheet, which is discretized into a triangulated mesh with N vertices and T triangles [50]. The energy of this surface is given by the discretized form of the Canham-Helfrich Hamiltonian [51]
| (1) |
where κ and σbare are the bending rigidity and bare surface tension of the membrane [32,43], C1,v and C2,v are the principal curvatures at vertex v, computed as in [50], and Av denotes the corresponding surface area. Protein-induced-curvature remodeling effects are included through the spontaneous curvature field H0,v. If rv denotes the position of vertex v and Ri denotes the position of protein i, then the effective spontaneous curvature at v, due to the nP proteins on the surface, is computed as
| (2) |
Both the membrane and protein degrees of freedom evolve through the coupled set of dynamically triangulated Monte Carlo moves described in [43]. There is no explicit interaction between protein fields besides a self-avoidance potential that prevents two protein fields from being localized to the same vertex of the triangulated surface. All other protein interactions are mediated through the Helfrich Hamiltonian. The results presented here are for a membrane surface with N = 900 vertices, κ = 20kBT, and σbare = 0. In our previous work [43], we had noted that this model predicts a tubulation transition. In the following discussion, we present our analysis of the tubulation transitions as a function of the magnitude of the spontaneous curvature C0, its variance ε2, the number of proteins on the membrane nP, and the excess area of the membrane A/Ap, defined as the ratio of the curvilinear area A to its projection onto the x-y plane Ap. All curvatures are presented in units of with a0 = 10 nm. The choice of the model parameters including their method of estimation and justification is based on experimental data and the computational details regarding the simulations are available in our previous work [43].
B. Inhomogeneous Widom insertion
The behavior of the remodeled membrane is quantified in terms of the excess chemical potential μex for nP protein fields and is computed using the Widom field insertion technique [43] as
| (3) |
Here Δℋ = ℋ(M + 1) − ℋ (M), where M denotes the number of proteins on the membrane, sM denotes the corresponding conformational space of the system, and 𝒫 is the probability density to add the (M + 1)th protein field at site sM+1, which is taken to be uniform. The excess chemical potential in Eq. (3) is an average value that corresponds to the chemical potential measured in bulk, while the same formulation can also be extended to systems with spatially varying density [41]. In this article, we extend the simulation methodology from [43] to compute spatially dependent excess chemical potentials. If r denotes a state point in the configurational phase space, μex(r) its chemical potential, and Δℋ(r) the energy change at r due to the insertion of the (M + 1)th protein at any point on the membrane, then the spatially varying excess chemical is given by
| (4) |
In this study, r is binned (histogrammed) based on the values of the mean curvature at different spatial locations Hv = (C1,v + C2,v)/2 at each vertex v where the test protein field is inserted. The tubular regions on the membrane are identified based on the bimodal distribution in the histograms of mean curvature, as described in Sec. III. In order to achieve adequate sampling for inhomogeneous Widom insertion calculations, each membrane simulation is run for at least 3 × 10⁶ Monte Carlo (MC) steps. Data for Widom test field insertion are collected only during the production phase, which corresponds to the second half of the simulation (i.e., the last 1.5 × 10⁶ MC steps) in order to ensure membrane equilibration. Specifically, the test protein field is inserted every 100 MC steps at randomly chosen spatial locations (here we have limited the maximum number of locations to 20) with the value of exp[−βΔℋ (r)] being recorded for every insertion move. The reported values of the error bars in μex correspond to the standard deviation computed over four replicate ensembles.
C. Computing membrane tension from the undulation spectrum
A planar membrane is characterized by the extensive variables entropy S, surface area A, projected area AP, and number of protein fields nP. If γ is the tension due to the frame (also called the frame tension), μm is the chemical potential of the membrane, μ is the chemical potential of the protein field, and T is the temperature, then at constant projected area Ap the suitable thermodynamic potential is given by
| (5) |
In this ensemble we initialize the system with set values of N, nP, AP, and T. The surface tension σ represents the renormalized tension, which can be estimated through the fluctuation spectrum analysis discussed below.
The membrane is initialized in a 30 × 30 hexagonal lattice with a link length l, which can vary within the range of self-avoidance constraints a0 and . The initial link length sets the membrane projected area according to . Upon equilibration, thermal undulations tend to increase the curvilinear area of the membrane (i.e., A ≥ Ap) and this defines an excess area reservoir that is dependent on the value of l. Hence, the entropic tension depends on the value of the excess area reservoir A/Ap, which can be measured by analyzing the power spectrum of membrane undulations [43].
In the absence of any spontaneous curvature field the power spectrum is given by
| (6) |
Equation (6) can be used to measure the renormalization behavior of κ and σ as a function of A/Ap as discussed in [43]. However, this simple relationship does not hold for a membrane with nP > 0. In such a scenario the contributions from the spontaneous curvature fields to the power spectrum should also be accounted for. The power spectrum that incorporates the effect of the protein spontaneous curvature fields was previously derived in Ref. [43] and is given by
| (7) |
Here q and q′ correspond to two independent modes that are coupled to each other through the elastic parameters κq+q′ and σq+q′, which represent the mode-specific bending rigidity and tension, and h0,q is the Fourier transform of the spontaneous curvature field H0(r). While this formalism for carrying out the fluctuation spectrum analysis in the presence of a finite number of nonzero curvature fields was presented in [43], its practical utility was not demonstrated. Here we apply this formalism and show that it can be utilized to compute the renormalized values of κ and σ in the presence of spontaneous curvature. For a homogeneous distribution of κ and σ, κq+q′ = κδq,q′, σq+q′ = σδq,q′, and Eq. (7) reduces to
| (8) |
Each of the modes obeys equipartition and hence the relation for the power spectrum in terms of the various Fourier modes is given by
| (9) |
The renormalized values of κ and σ, in the presence of spontaneous-curvature-inducing protein fields, can be determined through a nonlinear fit of Eq. (9).
III. RESULTS AND DISCUSSION
A. Tubulation and bimodal distribution of membrane mean curvature
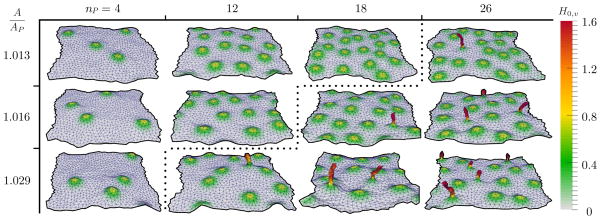
A membrane surface can display a number of equilibrium shapes that depend on the bending stiffness, excess area, and number of curvature-inducing proteins on its surface. Snapshots of the various conformations of a membrane with κ = 20kBT as a function of A/Ap and nP are shown in Fig. 1. It can be seen that the equilibrium shapes vary between smooth planar conformations for small A/Ap or nP and rough protrusions for large A/Ap or nP.
FIG. 1.
(Color online) Representative snapshots of equilibrium membrane morphologies as a function of nP and A/Ap. The membrane surfaces are colored based on the value of H0,v (expressed in units of ): An isolated Gaussian bump represents an individual protein field while tubules, formed by the aggregation of multiple protein fields, are seen as sharp protrusions. All protein fields shown have the parameters and .
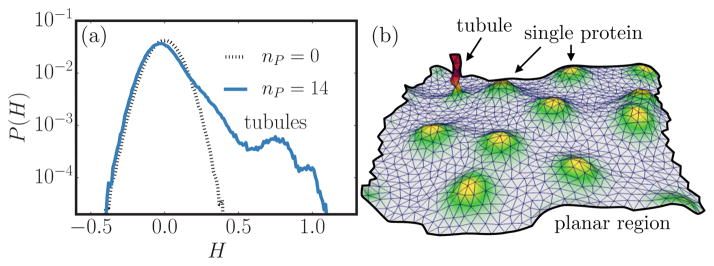
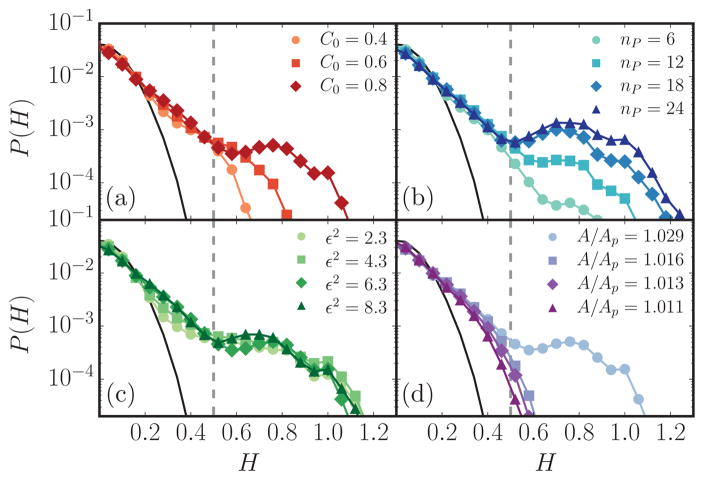
In our simulations, a tubule is a protrusion above the mean surface of the membrane, as observed in Fig. 1. The tubulation transition itself is marked by the onset of a bimodal distribution of the mean curvature P(H), as depicted in Fig. 2 for κ = 20kBT, A/Ap = 1.029, and two protein concentrations nP = 0 and 14 with . The characteristic peaks at H = 0 and H > 0.5 seen for nP = 14 correspond to planar and tubular regions, respectively, and the peak at higher mean curvatures is not observed for dilute protein concentrations (data shown for nP = 0). Furthermore, Figs. 3(a)–3(d) show the distribution of mean curvature as a function of C0, nP, ε2, and A/Ap, respectively. It is evident that the tubulation transition is a function of the various parameters that characterize the membrane-protein system. In Fig. 3, the absence of a bimodal distribution indicates that the curvature remodeling effects are not strong enough to stabilize tubular structures and collectively the results indicate that the tubulation transition occurs only above a threshold protein concentration, which is strongly influenced by both the characteristics of the protein field (given by C0,ε2) and the excess membrane area A/Ap. The curvature distribution P(H) is a useful marker of tubulation, but can only be used unambiguously when a large number of tubules are present. Also, its ability to predict the tubulation boundary is limited when nontubular structures such as blebs and buds are present. This is evident from examining the P(H) versus nP, as shown in Fig. 3(b): Though P(H) shows a clear bimodal distribution only above nP = 12, the protrusions appear even for nP = 10, but the mode at larger values of H does not appear since these structures are not persistent. Hence, to faithfully resolve the transition boundary, we have computed the excess chemical potential in order to quantify the nature of membrane tubule formation induced by curvature remodeling proteins.
FIG. 2.
(Color online) (a) Probability density of the membrane mean curvature for two protein concentrations nP = 0 and 14 for a protein field with C0 = 0.8 and ε2 = 6.3. (b) Snapshot corresponding to the membrane with nP = 14, which clearly illustrates coexisting planar and tubular regions on the membrane.
FIG. 3.
(Color online) Histograms of mean curvature for simulations with (a) a range of peak spontaneous curvatures C0, (b) several protein concentrations nP, (c) a range of curvature field extents ε2, and (d) several different membrane excess areas A/Ap. All panels have the parameters , nP = 14, and A/Ap = 1.029 unless otherwise stated. A mean curvature cutoff of is shown as a vertical dotted line.
B. Excess chemical potentials as markers of tubulation
In particular, we utilize the inhomogeneous Widom insertion technique (described in Sec. II B), which for our purpose involves the computation of three different excess chemical potentials, namely, (a) μex in the entire system, (b) in spatial regions where H < 0.5, and (c) corresponding to the tubular regions, i.e., for regions with H ≥ 0.5. The thresholds are consistent with (and derived from) the cutoff value (H = 0.5) that separates the two modes in the P(H) distributions (see Fig. 3).
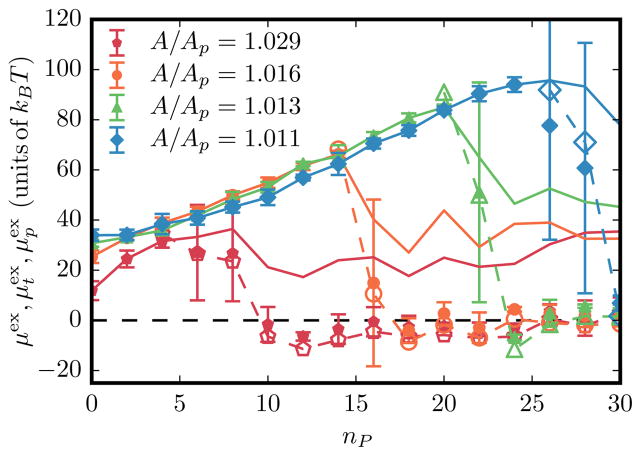
The equilibrium chemical potential μex as a function of nP, for a protein-induced-curvature field strength of and , for different values of the membrane excess area is shown in Fig. 4. Also shown are the corresponding values of the excess chemical potentials: planar region vs tubular region . We note that in an inhomogeneous phase showing spatial variation of density, the total chemical potential μ is a constant, which is the sum of μex, which strongly depends on the underlying curvature at a given location, and μid (ρ), which depends on the density at the location. When nP < 5 the total excess chemical potential μex is indistinguishable from the chemical potential obtained from the planar region , as can be clearly seen for the case of A/Ap = 1.029. However, at the onset of tubulation where is well defined, μex is slaved to the values of . This relation holds for all parameter values that can induce membrane tubules and this is shown for a range of C0, ε2, and A/Ap in Fig. 5.
FIG. 4.
(Color online) Various excess chemical potentials as a function of nP for four values of A/Ap. For each value of A/Ap, closed symbols with error bars denote μex, open symbols with dotted lines represent , and solid lines correspond to .
FIG. 5.
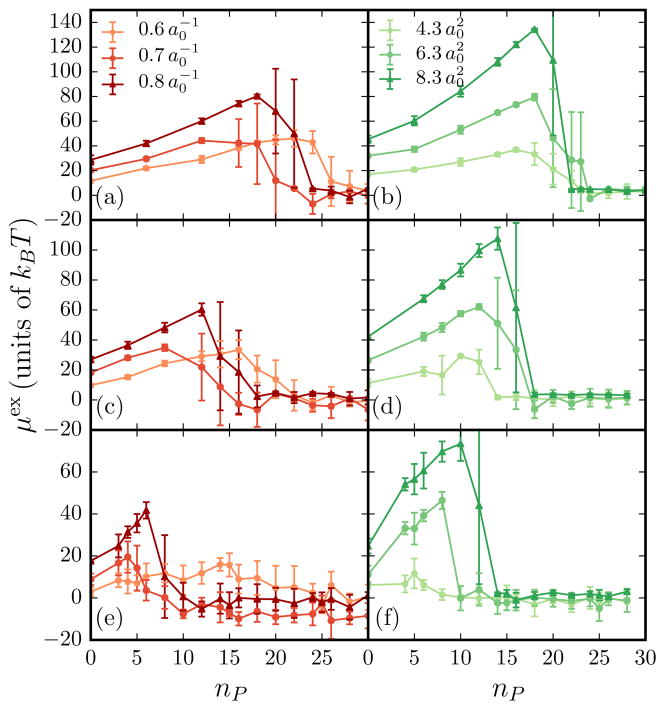
(Color online) Plot of the excess chemical potential vs protein number for a range of both C0 and ε2 for several initial excess areas. Solid lines with correspond to while points with error bars correspond to μex. Data are depicted for a range of C0 with and corresponding excess areas (a) A/Ap = 1.013, (c) A/Ap = 1.016, and (e) A/Ap = 1.029 and for a range of ε2 with and corresponding excess areas (b) A/Ap = 1.013, (d) A/Ap = 1.016, and (f) A/Ap = 1.029. The values of are similar to that of μex and hence are not shown for clarity.
The similarity in the values of μex (the excess chemical potential in bulk) and (the excess chemical potential in the tubular region) indicates the presence of a strong thermodynamic driving force to form tubulated regions on the membrane. The transition behavior shows a bifurcation in the excess chemical potential versus density plane and the transition point for a given field strength of curvature induction is a function of the membrane excess area A/Ap. As nP increases in the buildup to the transition μex increases owing to repulsion between the protein fields. However, beyond the transition point μex, , and decrease. The observed decrease in in the tubular phase reflects the fact that the curvature contribution to μex from the large mean curvatures of the tubule dominates the free-energy contribution. That the for the planar phase also drops (albeit by a much smaller amount relative to its value prior to the transition) is a reflection of the fact that the average density of the protein fields in the planar region is a constant and lower than the protein density just prior to the transition. This observation can be rationalized by the fact that post-transition, the addition of new protein fields results in their incorporation in the tubular phase keeping the density in the planar phase at a constant value (see Fig. 4). That the fluctuations in the μex values are higher at the transition region and are considerably lower pretransition and post-transition along the nP axis has to do with sampling rather than any onset of criticality. This is reconciled through the P(H) distributions, which show metastability in the free-energy landscape of the planar versus tubule phases, which is a not feature of a first-order-like transition. Moreover, as we discuss below, the transition we observe in the model is a state transition (akin to a micellar transition) and several features in our results outlined in Fig. 4 are in striking agreement with analogous behavior reported for micellar systems.
C. Membrane tubulation and its analogy to micellization
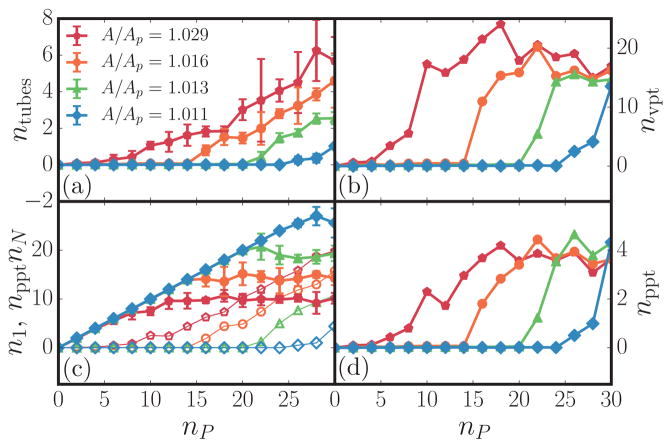
The thermodynamics of tubule formation can be related to a critical aggregation concentration nP,*, analogous to a critical micelle concentration. An important parameter in micelle formation is the critical micelle number, or the number of surfactants in each micelle. For tubule formation, this number is analogous to the number of membrane proteins in each tubule. In our coarse-grained model for membranes, a single protein field represents ζ protein units and hence the absolute number of proteins within each tubule is given by Nppt = npptζ, where nppt is the number of coarse-grained protein fields in the tubular region. Figure 6(d) shows nppt as a function of the total number of coarse-grained proteins nP for four different membrane excess areas. It can be seen that nppt saturates to approximately 4 for all values of nP above a critical aggregation number nP,*, whose value in turn depends on the elastic properties of the membrane and the parameters characterizing the protein field.
FIG. 6.
(Color online) Plot of several different tube statistics including (a) the average number of tubes at each concentration for several excess areas ntubes, (b) the average number of vertices per tubule nvpt, (c) the average number of monomers n1 and oligomers npptnN in simulation where monomers represent all proteins on the basal part of the membrane (closed symbols) and the n-mers represent all proteins in tubules (open symbols), and (d) the average number of proteins per tubule nppt. The legends in the panels correspond to four different values of A/Ap.
In the classic analysis of micellar self-assembly [52,53], the total surfactant concentration ctot is expressed in terms of the monomer concentration c1 and the concentration of an aggregate containing M surfactant molecules cM as
| (10) |
with being the chemical potential difference between the monomer state and the aggregate.
In analogy, the proteins in the planar and tubular regions on the membrane correspond to the monomers and aggregates, respectively. Thus, following Eq. (10), the equations governing the partitioning of proteins between the planar and tubular states can be rewritten in terms of the protein numbers as
| (11) |
with
| (12) |
where n1 is the number of protein fields in the planar phase (analogous to c1), nN is the number of tubes each containing ζnppt proteins (analogous to the concentration of micelles cM), and ζnpptnN is the total number of proteins partitioned into the tubular phase. At the critical number of protein fields nP,* that promotes membrane tubulation (see discussions by Nelson [53]),
| (13) |
Using Eqs. (12) and (13) in Eq. (11) we obtain
| (14) |
Thus, the numbers of protein fields in the planar and tubular regions are related through the equation
| (15) |
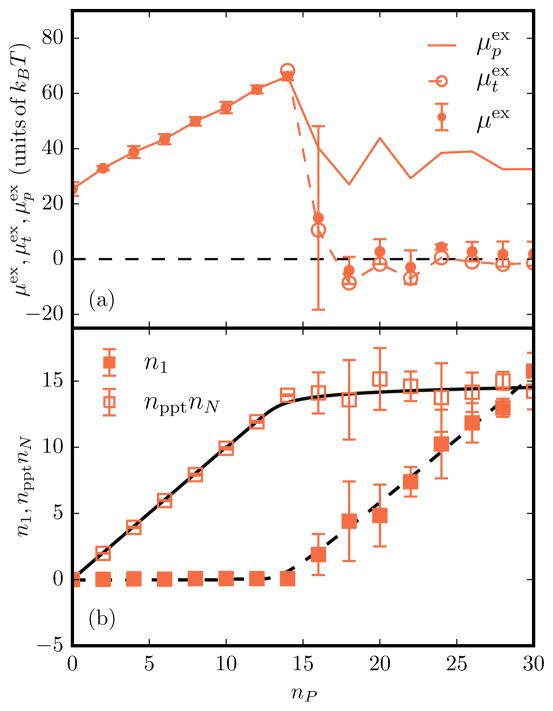
Notice that, despite being a coarse-grained model, the number of coarse-grained protein fields in the planar phase is related to the total number of proteins through the coarse-graining parameter ζ, which appears in the exponent of Eq. (15) on the right-hand side. As will be shown later, ζ can be determined either by fitting the observed values of n1 to Eq. (15) or by analyzing how the critical protein density varies as a function of membrane tension, as shown in Fig. 10; our scaling analysis yields a value for ζ = 10. Incidentally, this value of ζ shows an excellent fit of Eq. (15) to our simulation data as shown in Fig. 7(b). Methods to calculate the protein numbers in the planar and tubular regions are described below.
FIG. 10.
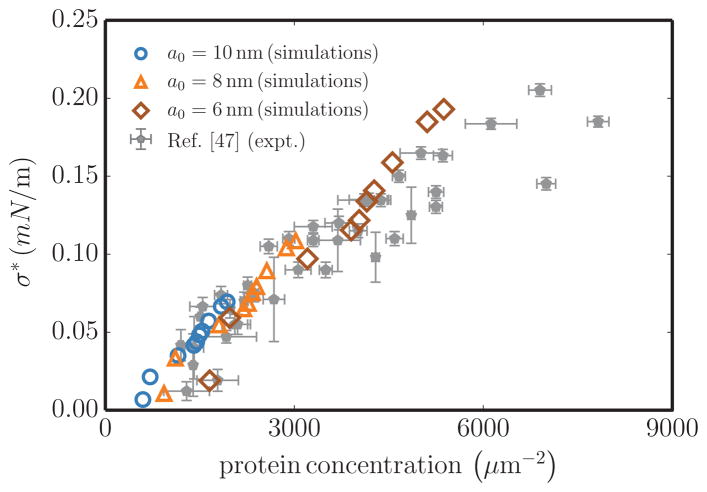
(Color online) Comparison of experimental (closed symbols) [47] and simulation data (open symbols) for the averaged membrane tension and protein concentration at the point of tubulation. Simulation data are shown for three different values of the length scale a0. In simulations, the protein concentration is calculated as where the coarse-graining parameter ζ ≈ 10.
FIG. 7.
(Color online) (a) Various excess chemical potentials as a function of nP for A/Ap = 1.016, C0 = 0.8, and ε2 = 6.3. The closed symbols with error bars denote μex, open symbols with dotted lines represent , and solid lines correspond to . (b) Total number of protein fields in the planar n1 and tubular npptnN regions as a function of nP. Here nppt corresponds to the average number of protein fields per tubule. The solid and dashed black lines are the analytical fits to the micelle model described in Eq. (15).
In order to compare the tubulation behavior in our simulations with Eq. (15), n1, nN, and nppt were calculated using a clustering algorithm with a mean curvature cutoff of , similar to the cutoff used in inhomogeneous Widom insertion. The values of n1, nN, and nppt, along with the number of vertices constituting a tube nvpt are shown in Fig. 6. All reported data are averaged over four independent ensembles, each containing 150 uncorrelated membrane conformations.
The distinction between a phase transition in a finite system versus a state transition resulting in finite-sized assemblies can be made by recognizing that the former would produce an ordered phase whose extent will span the size of the system. However, given that μex in the tubular phase is flat with increasing nP, following Israelachvili’s argument [52], multiple tubes of short (finite) lengths are entropically more favored rather than a single long tube, for which μex versus nP should decrease monotonically post-transition. The total number of proteins partitioned into the planar n1 and the tubular npptnN regions, computed for a membrane with A/Ap = 1.016, C0 = 0.8, and ε2 = 6.3, is shown in Fig. 7; at the onset of tubulation, n1 saturates and the number of proteins in the tubular regions increases linearly. A closer inspection of the tubule statistics (see Fig. 6) reveals that with increasing nP, the number of proteins per tube remains fixed with nppt ≈ 4, while the number of tubes nN increases. These observations are characteristic of a micellizationlike transition and this is further evidenced in Fig. 7, where our data show excellent agreement with the predictions of the micellar model. We rule out the possibility that the flat behavior of μex versus nP is an artifact of our ensemble of holding Ap fixed rather than maintaining a constant tension because the absolute value of the μex of the tubular phase remains at a constant value for all values of nP post-transition for systems with different Ap. Beyond providing insight into how the thermodynamic stability of the tubular phase is impacted by the independent variables nP and Ap, our results show that threshold density (the value of ) that marks the onset of the tubular transition shifts to larger values with a decrease in the excess area A/Ap, which clearly implies that membrane tension σ has a predominant effect on the transition.
D. Estimating membrane tension at tubulation
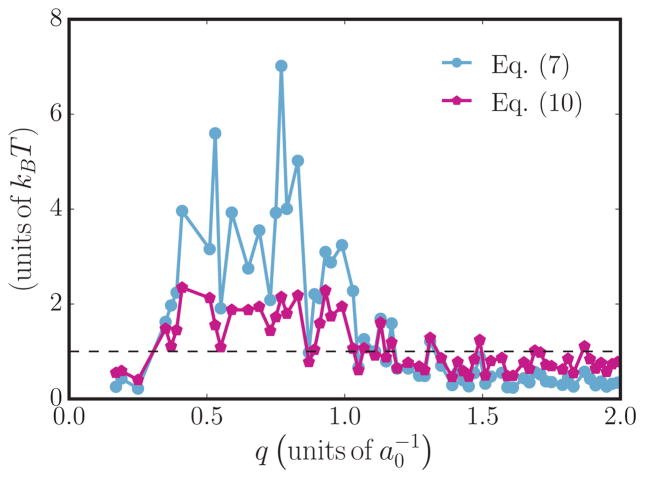
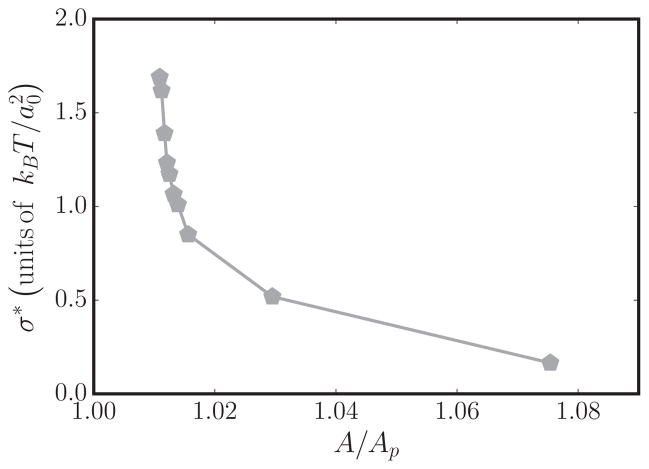
The membrane tension at the point of tubulation is an experimentally measurable quantity and the computational results can be compared to experiments if the tension at tubulation can be estimated accurately. As pointed out in Sec. II C, the renormalized tension for planar membranes can be computed by analyzing their undulation spectrum. However, in the case of membranes with spontaneous curvature field, the long-wavelength modes (i.e., small q) would violate equipartition if the conventional scaling relation given in Eq. (6) is used. Hence, we explicitly take the contributions from the spontaneous curvature field into account and estimate σ using Eq. (9). A comparison of the equipartition relation for the best estimate of σ determined using Eqs. (6) and (9) is shown in Fig. 8 for a membrane with κ = 20kBT, A/Ap = 1.029, and nP = 12. It can be seen that the equipartition is better satisfied when the latter relation is used. The values of σ, estimated using Eq. (9), as a function of nP for various values of A/Ap can be found in Appendix A. The tension at tubulation σ* is taken to be the value of membrane tension at the tubulation point, where the chemical potentials satisfy the condition . The membrane tension at the tubulation point as a function of A/Ap for spontaneous curvature field with C0 = 0.8 is shown in Fig. 9 and we observe that the tension for tubulation decreases with increasing excess area.
FIG. 8.
(Color online) Plots of the right-hand sides of Eqs. (6) and (9), obtained by nonlinear fitting procedures as a function of q. Data shown correspond to fits with a bin size of 0.02 and a maximum q of 2, from a tubulated membrane corresponding to κ = 20kBT, A/Ap = 1.029, and nP = 12.
FIG. 9.
Plot of σ*, the membrane tension at tubulation, as a function of A/Ap for a membrane with .
E. Comparison of tension at tubulation to experiments
We test our model predictions against the critical tubulation density for endophilins reported by Shi and Baumgart [47]. Since curvature fields renormalize the values of σ, for a given A the tension will depend on nP and differ from its value at nP = 0; we thus first develop a quantitative relationship between membrane area A and membrane tension σ. In order to consider the effect of protein fields on renormalizing the tension values, we implement the modified fluctuation analysis method described in Sec. II C. The computed values of the critical tension σ* versus tubulation density are shown alongside the experimental data in Fig. 10. In order to make a direct comparison with experimental data, we self-consistently determine the length scale a0 by matching tubule diameters obtained in simulations to that in experiments [12,54,55], which yields values of a0 in the range 6–10 nm. In turn, a0 can be used to determine the corresponding protein density in our simulations, where each protein field is a coarse-grained representation of ζ proteins, where ζ ≥ 1 can be regarded as the oligomerization number of protein domains needed to establish a stable curvature field. Estimated protein concentrations match those in experiments when the oligomerization parameter ζ ≈ 10 and we observe that the computed values of σ*, for all values of a0, are in good quantitative agreement with those measured from experiments. This estimate of ζ also matches extremely well with the value of the coarse-grained parameter obtained through the micellar model, previously shown in Fig. 7(b).
In addition to A/Ap (or membrane tension σ), both curvature field parameters C0 and ε2 can also impact the onset of tubulation, as shown in Fig. 5 (see also Tables I and II in Appendix B). For weakly curving protein fields C0 < 0.6, μex shows a monotonic increase for the range 0 < nP < 30, implying the absence of a tubulation transition in this regime. In contrast, when C0 > 0.6, μex displays the characteristic pitchfork signature of tubulation, with the onset occurring at lower values of nP for both C0 = 0.7 and 0.8. The critical tubulation density, however, remains unaltered with a change in the value of ε2 (see Fig. 5). Complementary to the critical tubulation density , we can estimate the saturation density of the proteins on the bilayer ρmax using the relationship ρmax ∝ exp(−μmax/kBT) [56], where μmax is the value of the excess chemical potential just prior to tubulation; the values of μmax for different C0, ε2, and A/Ap are provided in Fig. 5 (see also Tables I and II in Appendix B). Based on our results, we find that ρmax and both decrease with increasing C0. Hence, proteins inducing a strong curvature field can induce a morphological transition at lower densities, but also experience higher membrane-curvature-mediated repulsive interactions, which limits their coverage on the membrane. This predictive ability extends the utility of our model and simulations in defining the mechanisms of subtle yet important morphological transitions in soft biological systems, in delineating the thermodynamic stability of the underlying states; it further shows that the approach can be used to guide new experiments. We advocate that this thermodynamic description at the microscopic resolution discussed here will significantly impact and inform cellular mechanisms (including dynamics) mediated by emergent membrane morphologies driving intracellular trafficking and cell motility [57].
TABLE I.
Values of μmax, , and as a function of C0 and A/Ap for a fixed value of . Value entries of a dash represent parameters where no tubules were observed or fewer than three values were obtained in order to calculate the corresponding standard deviation.
| A/Ap | C0(units of ) | (units of kBT) | μmax (units of kBT) | (±1) |
|---|---|---|---|---|
| 1.029 | 0.5 | 11.7 ± 3.0 | 9.8 ± 6.6 | 14 |
| 0.6 | 17.2 ± 4.8 | 16.0 ± 5.6 | 15 | |
| 0.7 | 24.5 ± 3.9 | 19.5 ± 7.5 | 5 | |
| 0.8 | 28.5 ± 3.2 | 41.7 ± 3.9 | 6 | |
| 1.016 | 0.5 | 14.1 ± 3.1 | 26.4 ± 1.5 | 22 |
| 0.6 | 23.2 ± 3.1 | 33.5 ± 6.3 | 16 | |
| 0.7 | 24.2 ± 4.3 | 34.8 ± 2.2 | 15 | |
| 0.8 | 29.3 ± 3.6 | 72.8 ± 3.9 | 15 | |
| 1.013 | 0.5 | - | - | - |
| 0.6 | 28.9 ± - | 46.1 ± 6.7 | 24 | |
| 0.7 | 25.0 ± 6.0 | 44.3 ± 2.0 | 18 | |
| 0.8 | 51.4 ± 3.8 | 80.4 ± 1.2 | 22 |
TABLE II.
Values of μmax, , and as a function of ε2 and A/Ap for a fixed value of . Value entry of a dash represents a parameter where no tubules were observed or fewer than three values were obtained in order to calculate the corresponding standard deviation.
| A/Ap | ε2 (units of ) | (units of kBT) | μmax (units of kBT) | (±1) |
|---|---|---|---|---|
| 1.029 | 2.3 | 9.4 ± 1.8 | 4.6 ± 1.8 | 8 |
| 4.3 | 23.4 ± 3.0 | 11.7 ± 7.1 | 5 | |
| 6.3 | 30.6 ± 4.1 | 46.4 ± 4.1 | 8 | |
| 8.3 | 33.2 ± 3.2 | 73.5 ± 8.2 | 12 | |
| 1.016 | 2.3 | 12.1 ± 3.9 | 10.4 ± 0.8 | 16 |
| 4.3 | 28.2 ± 5.3 | 29.3 ± 1.0 | 12 | |
| 6.3 | 42.8 ± 15.1 | 62.1 ± 1.9 | 16 | |
| 8.3 | 48.8 ± 11.7 | 107.6 ± 7.4 | 14 | |
| 1.013 | 2.3 | 13.6 ± - | 15.5 ± 0.4 | 28 |
| 4.3 | 36.2 ± 4.2 | 36.8 ± 1.4 | 18 | |
| 6.3 | 48.9 ± 8.1 | 79.4 ± 2.7 | 18 | |
| 8.3 | 60.3 ± 13.6 | 134.4 ± 0.7 | 20 |
Acknowledgments
This work was supported in part by the National Science Foundation Grants No. DMR-1120901 and No. CBET-1236514. The research leading to these results has received funding from the NIH Grants No. 1U54CA193417 and No. GM097552. Computational resources were provided in part by the extreme science and engineering discovery environment Grant No. MCB060006.
APPENDIX A. RENORMALIZATION OF TENSION WITH PROTEIN NUMBER
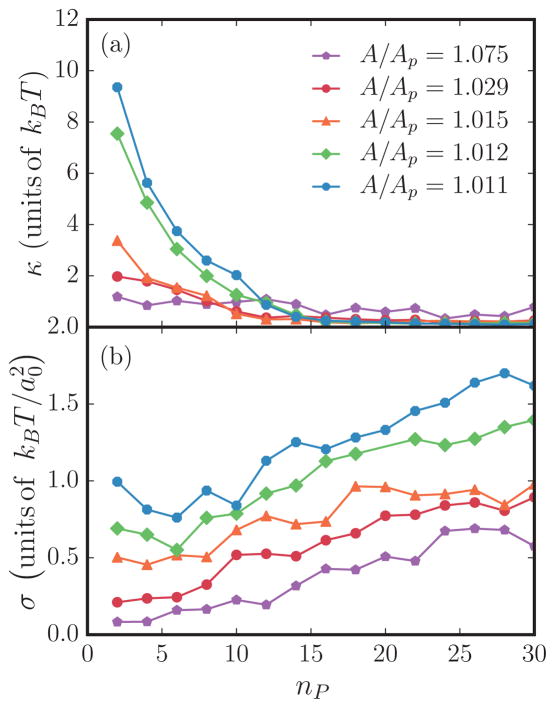
As described before, the renormalized values of κ and σ, in the presence of spontaneous-curvature-inducing protein fields, can be determined through a nonlinear fit of Eq. (9). Figures 11(a) and 11(b) show the values of κ and σ, estimated using Eq. (9), as a function of protein field number for several excess areas. Since the Monge-Gauge approximation is valid only for small deformations, we limit our analysis only to the planar regions on the membrane; in the case of membranes with tubules these regions are neglected. It can be seen in Fig. 11(b) that the presence of proteins alters the in-plane undulatory modes of the membrane, which is evidenced by an increase in the renormalized tension with increase in protein number. As expected, the excess area and membrane tension are inversely related to the membrane sustaining high tension when the excess area reservoir is small and vice versa, as shown in Fig. 11(b). Furthermore, we also observe that tensed membranes can be stabilized when the protein concentration is high and vice versa. On the other hand, our analysis shows that the membrane softens (i.e., κ decreases) with an increase in either excess area or protein concentration, which is shown in Fig. 11(a). The value of tension at tubulation σ*, defined as the tension of a membrane when , points to the fact that the membrane requires a critical excess area for tubulation transitions to occur. This can be seen in Fig. 9, which shows the divergence of σ* at smaller values of A/Ap.
FIG. 11.
(Color online) Plot of the values of (a) κ and (b) σ obtained by nonlinear fitting of the complex spectrum (9) with tubules removed. A bin size of 0.02 in q and a maximum q of 1 were used for these fits.
APPENDIX B. THE 〈 〉 DEPENDENCE CURVATURE FIELD PARAMETERS
The critical density for tubulation shows a dependence on both membrane tension and the curvature field parameters C0 and ε2. Plots of the various chemical potentials μex, , and as a function of C0, ε2, and A/Ap are shown in Fig. 5. The critical number of protein fields required to stabilize membrane regions with mean curvatures above the cutoff value of is a strong function of C0 and ε2. It should be noted that depending on the value of C0, the regions corresponding to can be either blebs (a spherical bud) or tubules, with the former being predominant for and the latter being stable for (see [58]). The formation of regions with curvatures above the cutoff is accompanied by a drop in the value of chemical potential μex as shown in all the panels in Fig. 5. The scaling of μex preceding tubulation is consistent with earlier results reported by Tourdot et al. [43].
The excess chemical potential μex increases with an increase in nP and peaks at , with a peak value μmax. The critical number of protein fields required to form blebs or tubes is taken to be the value of at which this drop occurs. However, the values of can be also determined by analyzing the behavior of the various chemical potentials. We take to be the minimum value of at which the chemical potentials obey the relation . Tables I and II show the values of the various chemical potentials and critical protein number for various systems shown in Fig. 5.
The Widom insertion technique gives reliable estimates for the chemical potentials for a wide range of parameters characterizing the membrane-protein system especially when the mean curvature distributions P(H) show a broad distribution whose range is much greater than C0/2. It should be noted that when a protein field with spontaneous curvature C0 is inserted on a membrane surface, the dominant contributions to μex come from membrane regions with 2H ≈ C0. Hence, in analyzing the effects of C0 and ε2 on the morphological transitions, we only consider values of A/Ap > 1.013, which clearly satisfy this criterion for P(H) (see Tables I and II) for our results.
Contributor Information
Richard W. Tourdot, Department of Chemical and Biomolecular Engineering, University of Pennsylvania, Philadelphia, Pennsylvania 19104, USA.
N. Ramakrishnan, Department of Bioengineering, University of Pennsylvania, Philadelphia, Pennsylvania 19104, USA.
Tobias Baumgart, Department of Chemistry, University of Pennsylvania, Philadelphia, Pennsylvania 19104, USA.
Ravi Radhakrishnan, Department of Chemical and Biomolecular Engineering, Department of Bioengineering, University of Pennsylvania, Philadelphia, Pennsylvania 19104, USA.
References
- 1.McMahon HT, Gallop JL. Nature (London) 2005;438:590. doi: 10.1038/nature04396. [DOI] [PubMed] [Google Scholar]
- 2.Kozlov MM, Campelo F, Liska N, Chernomordik LV, Marrink SJ, McMahon HT. Curr Opin Cell Biol. 2014;29:53. doi: 10.1016/j.ceb.2014.03.006. [DOI] [PMC free article] [PubMed] [Google Scholar]
- 3.Shibata Y, Hu J, Kozlov MM, Rapoport TA. Annu Rev Cell Dev Biol. 2009;25:329. doi: 10.1146/annurev.cellbio.042308.113324. [DOI] [PubMed] [Google Scholar]
- 4.McMahon HT, Boucrot E. J Cell Sci. 2015;128:1065. doi: 10.1242/jcs.114454. [DOI] [PMC free article] [PubMed] [Google Scholar]
- 5.Farsad K, Camilli PD. Curr Opin Cell Biol. 2003;15:372. doi: 10.1016/s0955-0674(03)00073-5. [DOI] [PubMed] [Google Scholar]
- 6.Ayton GS, Lyman E, Krishna V, Swenson RD, Mim C, Unger VM, Voth GA. Biophys J. 2009;97:1616. doi: 10.1016/j.bpj.2009.06.036. [DOI] [PMC free article] [PubMed] [Google Scholar]
- 7.Chen H, Fre S, Slepnev VI, Capua MR, Takei K, Butler MH, Di Fiore PP, De Camilli P. Nature (London) 1998;394:793. doi: 10.1038/29555. [DOI] [PubMed] [Google Scholar]
- 8.Farsad K, Ringstad N, Takei K, Floyd SR, Rose K, De Camilli P. J Cell Biol. 2001;155:193. doi: 10.1083/jcb.200107075. [DOI] [PMC free article] [PubMed] [Google Scholar]
- 9.Boucrot E, Ferreira APA, Almeida-Souza L, Debard S, Vallis Y, Howard G, Bertot L, Sauvonnet N, McMahon HT. Nature (London) 2015;517:460. doi: 10.1038/nature14067. [DOI] [PubMed] [Google Scholar]
- 10.Zimmerberg J, Kozlov MM. Nat Rev Mol Cell Biol. 2006;7:9. doi: 10.1038/nrm1784. [DOI] [PubMed] [Google Scholar]
- 11.Shibata Y, Shemesh T, Prinz WA, Palazzo AF, Kozlov MM, Rapoport TA. Cell. 2010;143:774. doi: 10.1016/j.cell.2010.11.007. [DOI] [PMC free article] [PubMed] [Google Scholar]
- 12.Ford MGJ, Mills IG, Peter BJ, Vallis Y, Praefcke GJK, Evans PR, McMahon HT. Nature (London) 2002;419:361. doi: 10.1038/nature01020. [DOI] [PubMed] [Google Scholar]
- 13.Hinshaw JE. Annu Rev Cell Dev Biol. 2000;16:483. doi: 10.1146/annurev.cellbio.16.1.483. [DOI] [PMC free article] [PubMed] [Google Scholar]
- 14.Safouane M, Berland L, Callan-Jones A, Sorre B, Römer W, Johannes L, Toombes GES, Bassereau P. Traffic. 2010;11:1519. doi: 10.1111/j.1600-0854.2010.01116.x. [DOI] [PubMed] [Google Scholar]
- 15.Zhao Y, Liu J, Yang C, Capraro BR, Baumgart T, Bradley RP, Ramakrishnan N, Xu X, Radhakrishnan R, Svitkina T, Guo W. Dev Cell. 2013;26:266. doi: 10.1016/j.devcel.2013.07.007. [DOI] [PMC free article] [PubMed] [Google Scholar]
- 16.Blood PD, Voth GA. Proc Natl Acad Sci USA. 2006;103:15068. doi: 10.1073/pnas.0603917103. [DOI] [PMC free article] [PubMed] [Google Scholar]
- 17.Yin Y, Arkhipov A, Schulten K. Structure. 2009;17:882. doi: 10.1016/j.str.2009.03.016. [DOI] [PMC free article] [PubMed] [Google Scholar]
- 18.Lai CL, Jao CC, Lyman E, Gallop JL, Peter BJ, McMahon HT, Langen R, Voth GA. J Mol Biol. 2012;423:800. doi: 10.1016/j.jmb.2012.08.010. [DOI] [PMC free article] [PubMed] [Google Scholar]
- 19.Reynwar BJ, Illya G, Harmandaris VA, Müller MM, Kremer K, Deserno M. Nature (London) 2007;447:461. doi: 10.1038/nature05840. [DOI] [PubMed] [Google Scholar]
- 20.Cui H, Lyman E, Voth GA. Biophys J. 2011;100:1271. doi: 10.1016/j.bpj.2011.01.036. [DOI] [PMC free article] [PubMed] [Google Scholar]
- 21.Cui H, Mim C, Vázquez FX, Lyman E, Unger VM, Voth GA. Biophys J. 2013;104:404. doi: 10.1016/j.bpj.2012.12.006. [DOI] [PMC free article] [PubMed] [Google Scholar]
- 22.Lyman E, Cui H, Voth GA. Biophys J. 2010;99:1783. doi: 10.1016/j.bpj.2010.06.074. [DOI] [PMC free article] [PubMed] [Google Scholar]
- 23.Arkhipov A, Yin Y, Schulten K. Biophys J. 2008;95:2806. doi: 10.1529/biophysj.108.132563. [DOI] [PMC free article] [PubMed] [Google Scholar]
- 24.Kim KS, Neu J, Oster G. Biophys J. 1998;75:2274. doi: 10.1016/S0006-3495(98)77672-6. [DOI] [PMC free article] [PubMed] [Google Scholar]
- 25.Sens P, Johannes L, Bassereau P. Curr Opin Cell Biol. 2008;20:476. doi: 10.1016/j.ceb.2008.04.004. [DOI] [PubMed] [Google Scholar]
- 26.Brown FLH. Q Rev Biophys. 2011;44:391. doi: 10.1017/S0033583511000047. [DOI] [PubMed] [Google Scholar]
- 27.Bahrami AH, Lipowsky R, Weikl TR. Phys Rev Lett. 2012;109:188102. doi: 10.1103/PhysRevLett.109.188102. [DOI] [PubMed] [Google Scholar]
- 28.Šarić A, Cacciuto A. Phys Rev Lett. 2012;109:188101. doi: 10.1103/PhysRevLett.109.188101. [DOI] [PubMed] [Google Scholar]
- 29.Dasgupta S, Auth T, Gompper G. Soft Matter. 2013;9:5473. [Google Scholar]
- 30.Lipowsky R. Faraday Discuss. 2013;161:305. doi: 10.1039/c2fd20105d. [DOI] [PubMed] [Google Scholar]
- 31.Rangamani P, Mandadap K, Oster G. Biophys J. 2014;107:751. doi: 10.1016/j.bpj.2014.06.010. [DOI] [PMC free article] [PubMed] [Google Scholar]
- 32.Ramakrishnan N, Kumar PS, Radhakrishnan R. Phys Rep. 2014;543:1. doi: 10.1016/j.physrep.2014.05.001. [DOI] [PMC free article] [PubMed] [Google Scholar]
- 33.Leibler S. J Phys France. 1986;47:507. [Google Scholar]
- 34.Auth T, Gompper G. Phys Rev E. 2009;80:031901. doi: 10.1103/PhysRevE.80.031901. [DOI] [PubMed] [Google Scholar]
- 35.Baumgart T, Capraro BR, Zhu C, Das SL. Annu Rev Phys Chem. 2011;62:483. doi: 10.1146/annurev.physchem.012809.103450. [DOI] [PMC free article] [PubMed] [Google Scholar]
- 36.Singh P, Mahata P, Baumgart T, Das SL. Phys Rev E. 2012;85:051906. doi: 10.1103/PhysRevE.85.051906. [DOI] [PMC free article] [PubMed] [Google Scholar]
- 37.Sorre B, Callan-Jones A, Manzi J, Goud B, Prost J, Bassereau P, Roux A. Proc Natl Acad Sci USA. 2011;109:173. doi: 10.1073/pnas.1103594108. [DOI] [PMC free article] [PubMed] [Google Scholar]
- 38.Aimon S, Callan-Jones A, Berthaud A, Pinot M, Toombes GES, Bassereau P. Dev Cell. 2014;28:212. doi: 10.1016/j.devcel.2013.12.012. [DOI] [PMC free article] [PubMed] [Google Scholar]
- 39.Frenkel D, Smit B. Understanding Molecular Simulation: From Algorithms to Applications. Elsevier; Amsterdam: 2002. [Google Scholar]
- 40.Simunovic M, Voth GA. Nat Commun. 2015;6:7219. doi: 10.1038/ncomms8219. [DOI] [PMC free article] [PubMed] [Google Scholar]
- 41.Frenkel D, Smit B. Understanding Molecular Simulation: From Algorithms to Applications. 2. Academic; New York: 2001. [Google Scholar]
- 42.Tourdot RW, Bradley RP, Ramakrishnan N, Radhakrishnan R. IET Syst Biol. 2014;8:198. doi: 10.1049/iet-syb.2013.0057. [DOI] [PMC free article] [PubMed] [Google Scholar]
- 43.Tourdot RW, Ramakrishnan N, Radhakrishnan R. Phys Rev E. 2014;90:022717. doi: 10.1103/PhysRevE.90.022717. [DOI] [PMC free article] [PubMed] [Google Scholar]
- 44.Sens P, Turner MS. Biophys J. 2004;86:2049. doi: 10.1016/S0006-3495(04)74266-6. [DOI] [PMC free article] [PubMed] [Google Scholar]
- 45.Shi Z, Baumgart T. Adv Colloid Interface Sci. 2014;208:76. doi: 10.1016/j.cis.2014.01.004. [DOI] [PMC free article] [PubMed] [Google Scholar]
- 46.Simunovic M, Srivastava A, Voth GA. Proc Natl Acad Sci USA. 2013;110:20396. doi: 10.1073/pnas.1309819110. [DOI] [PMC free article] [PubMed] [Google Scholar]
- 47.Shi Z, Baumgart T. Nat Commun. 2015;6:5974. doi: 10.1038/ncomms6974. [DOI] [PMC free article] [PubMed] [Google Scholar]
- 48.Tsujita K, Takenawa T, Itoh T. Nat Cell Biol. 2015;17:749. doi: 10.1038/ncb3162. [DOI] [PubMed] [Google Scholar]
- 49.Diz-Muñoz A, Fletcher DA, Weiner OD. Trends Cell Biol. 2013;23:47. doi: 10.1016/j.tcb.2012.09.006. [DOI] [PMC free article] [PubMed] [Google Scholar]
- 50.Ramakrishnan N, Sunil Kumar PB, Ipsen JH. Phys Rev E. 2010;81:041922. doi: 10.1103/PhysRevE.81.041922. [DOI] [PubMed] [Google Scholar]
- 51.Helfrich W. Z Naturforsch C. 1973;28:693. doi: 10.1515/znc-1973-11-1209. [DOI] [PubMed] [Google Scholar]
- 52.Israelachvili JN. Intermolecular and Surface Forces. 3. Elsevier; Amsterdam: 2011. [Google Scholar]
- 53.Nelson P. Biological Physics: Energy, Information, Life. Freeman; New York: 2003. p. 600. [Google Scholar]
- 54.Peter BJ. Science. 2004;303:495. doi: 10.1126/science.1092586. [DOI] [PubMed] [Google Scholar]
- 55.Gallop JL, Jao CC, Kent HM, Butler PJG, Evans PR, Langen R, McMahon HT. EMBO J. 2006;25:2898. doi: 10.1038/sj.emboj.7601174. [DOI] [PMC free article] [PubMed] [Google Scholar]
- 56.Dill KA, Bromberg S. Molecular Driving Forces: Statistical Thermodynamics in Chemistry and Biology. Taylor & Francis; London: 2003. [Google Scholar]
- 57.Ramakrishnan N, Eckmann DM, Ayyaswamy PS, Weaver VM, Radhakrishnan R. unpublished. [Google Scholar]
- 58.See Supplemental Material at http://link.aps.org/supplemental/10.1103/PhysRevE.92.042715 for movies M1–M4.


