

Abstract
Multiple myeloma (MM) is incurable and invariably becomes resistant to chemotherapy. Although the mechanisms remain unclear, hypoxic conditions in the bone marrow have been implicated in contributing to MM progression, angiogenesis, and resistance to chemotherapy. These effects occur via adaptive cellular responses mediated by hypoxia-inducible transcription factors (HIFs), and targeting HIFs can have anti-cancer effects in both solid and hematological malignancies. Here, it was found that in most myeloma cell lines tested, HIF1α, but not HIF2α expression was oxygen dependent and this could be explained by the differential expression of the regulatory prolyl-hydroxylase isoforms. The anti-MM effects of a sequence-specific DNA-binding pyrrole-imidazole polyamide (HIF-PA), that disrupts the HIF heterodimer from binding to its cognate DNA sequences, were also investigated. HIF-PA is cell permeable, localizes to the nuclei, and binds specific regions of DNA with an affinity comparable to that of HIF transcription factors. Most of the MM cells were resistant to hypoxia-mediated apoptosis, and HIF-PA treatment could overcome this resistance in vitro. Using xenograft models, it was determined that HIF-PA significantly decreased tumor volume and increased hypoxic and apoptotic regions within solid tumor nodules and the growth of myeloma cells engrafted in the bone marrow. This provides a rationale for targeting the adaptive cellular hypoxic response of the O2-dependent activation of HIFα using polyamides.
Keywords: mTOR, multiple myeloma, hypoxia
INTRODUCTION
Multiple myeloma (MM) is an incurable disease of malignant plasma cells characterized by high rates of relapse and resistance to drug therapies (1–3). The reasons why this disease is so difficult to cure is unclear, but the bone marrow (BM) microenvironment is known to confer critical growth and survival advantages that protect tumor cells from apoptosis-inducing stressors (4, 5). The BM is hypoxic (p02 ~10–30 mmHg) when compared to most other tissues (pO2 ~85–150 mmHg) (6) and paradoxically, while oxygen stress can kill tumor cells (7), low-oxygen conditions also promote tumor progression (8), angiogenesis (9), and resistance to chemotherapy (10). These pro-survival responses to low oxygen tension are regulated by adaptive cellular responses mediated by several oxygen-sensitive transcription factors; the most important of these being the hypoxia-inducible factors (HIFs) (for review see (11)). HIFs are composed of a constitutively expressed β-subunit (HIF1β/ARNT) and inducible α-subunits (HIF1α, 2α, and 3α) that are responsive to oxygen levels and are regulated via proteosome-mediated degradation. Briefly, under “normoxic” conditions, the HIFα subunits are hydroxylated by a number of closely related prolyl-hydroxylase domain proteins (PHD1-3) that results in recognition of the α-subunit by the von Hippel-Lindau tumor suppressor (VHL), and its subsequent ubiquination and rapid degradation by the proteosome. This normally maintains the HIFα-subunits at very low levels in the cell. Under hypoxic conditions (pO2 <50 mmHg), the proline-hydroxylase activity is inhibited and HIFα degradation is not initiated (12). This allows dimerization of the α and β-subunits and the translocation and binding of HIF to the hypoxic response elements (HRE), thereby inducing gene transcription of hypoxia related survival and angiogenic factors.
It has been shown that heightened expression of pro-angiogenic factors (such as VEGF) and increased microvessel density within myeloma tumors is strongly correlated with disease development and progression, as well as being predictive of poor patient prognosis (13–16). This provided a rationale for using VEGF-targeting drugs, such as bevacizumab (Avastin), to attempt to inhibit angiogenesis and increase hypoxic stress in MM tumors, although only modest anti-tumor effects were observed (17). These results call into question the overall effectiveness of targeting angiogenesis as a mono-therapeutic strategy for treating MM in the clinic. Noting that the increase of hypoxia within the tumor bed following inhibition of VEGF results in the subsequent activation of the adaptive hypoxic response and induction of survival factors may provide an explanation for these underwhelming effects. Under this hypothesis, we would argue that these resultant hypoxic conditions are actually supportive of MM progression (because low O2 represents a natural component of the bone marrow niche in which myeloma engraft) by maintaining hyperactive HIF activity. Thus, rather than killing the tumor cells, inhibition of angiogenesis may actually facilitate a pro-survival adaptive hypoxic response through HIF activation. If true, then targeting the specific HIF-mediated response to hypoxia may be a more effective anti-myeloma therapy than targeting VEGF or angiogenesis alone. In fact, there are a number of different hypoxia and HIF targeting strategies currently being tested in MM with varying levels of success (18).
In this study, we tested the effects of inhibiting the hypoxic adaptive response using a synthetically derived, sequence-specific DNA-binding Py-Im polyamide (PA) composed of the aromatic rings of N-methylpyrrole and N-methylimidazole amino acids designed to recognize and interfere with HIF binding to HRE sequences within the minor grove of the DNA helix (19). We found that under low oxygen culturing conditions, most myeloma cell lines were relatively resistant to hypoxia-mediated apoptosis and that HIF1α, but not HIF2α, was upregulated in an oxygen-dependent manner. Treatment of MM cells with our HIF-polyamide (HIF-PA) overcame resistance to hypoxia-mediated apoptosis in vitro as well as inhibited the transcription of multiple hypoxia-induced genes. We also found that combination treatment with HIF-PA polyamides (to inhibit gene transcription) and the mTOR inhibitor rapamycin (to inhibit gene translation) was markedly more effective at overcoming resistance to hypoxia-mediated apoptosis in MM cells. In additional experiments, we used xenograft models to study the anti-MM effects of Py-Im polyamide treatment on MM tumors in vivo and found that Py-Im polyamides were well tolerated by the mice and had a marked anti-tumor effect characterized by a significant increase in hypoxia as well as concomitant increases in apoptotic and necrotic regions within solid tumor nodules as well as inhibition of myeloma growth in tumors engrafted in the BM. Altogether, these data suggest that sensitivity of myeloma to polyamide therapy may be related to the inhibition of gene expression induced by the oxygen-dependent activation of HIF1α (but not necessarily HIF2α) and provides a rationale for targeting the adaptive hypoxic responses in MM using these compounds.
MATERIALS AND METHODS
Cell lines and reagents
All cell lines were purchased from ATCC and maintained at 37°C and 5% CO2 (“normoxic” condition) unless noted. The cell lines were validated using the Johns Hopkins Genetic Core Research Facility (Baltimore, MD) and stock aliquots were stored under liquid nitrogen. Testing for mycoplasma was performed using a mycoplasma PCR detection kit (Sigma-Aldrich, St Louis, MO). Py-Im polyamides were synthesized by solid-phase methods on Kaiser oxime resin (Nova Biochem, Billerica, MA) (20). The tested polyamide, HIF-PA, targets the sequence 5′-WTWCGW-3′ (W=A or T) and modulates a subset of hypoxia-induced genes, whilst the control polyamide (CO-PA) recognizes the non-HRE sequence 5′-WGGWCW-3′. Enzyme-linked immunosorbent assay (ELISA) kits specific for human VEGF was purchased from R&D Systems (Minneapolis, MN). The Hypoxyprobe-1 kit was purchased from HPI Inc (Burlington, MA). Cellular apoptosis was measured by flow cytometry using a cleaved caspase-3 kit (BD Biosciences, San Jose, CA). Small inhibitory RNA (siRNA) for HIF1α (Silencer Select siRNA ID# s6539, gene ID# 3091) and scrambled control RNA (Silencer Select negative control #1 siRNA) were purchased from Ambion (Grand Island, NY). Cells were transfected with siRNA using Lipofectamine-2000 (Life Technologies, Grand Island, NY).
Immunoblots
Protein was isolated and western blot analysis was performed as described previously (21). Nuclear and cytoplasm fractions were isolated using the Thermo Scientific NE-PER™ Nuclear and Cytoplasmic Extraction Kit (Rockford, IL) following the manufacturers instruction. HIF1α antibody (clone 54/HIF1) was purchased from BD Biosciences. β-tubulin (clone H-235), LaminA/C (clone 14/LaminAC), BCL-XL (clone H-5), Survivan (clone D-8), BNIP3 (clone ANa40), BCL-2 (clone C-2), goat anti-mouse and goat anti-rabbit IgG horseradish peroxidase-conjugated antibodies were purchased from Santa Cruz Biotechnology (Dallas, TX). BID (rabbit polyclonal), BAX (rabbit polyclonal), AKT-total (clone C67E7), AKT-S473 (clone D9E) and AKT-T308 (clone C31E5E) and the P70-total, P70-T421/S424, and P70-T389 antibody kits were purchased from Cell Signaling Technology (Danvers, MA). MCL-1 (clone 542808) was purchased from R&D systems. REDD1 (clone 1G11) was purchased from Bethyl Laboratories (Montgomery, TX). The EGLN1/PHD2 (rabbit polyclonal), EGLN3/PHD3 (mouse polyclonal), EGLN3/PHD3 positive control (an EGLN3/PHD3 over expressing lysate from HEK293T cells), HIF2α (rabbit polyclonal), and Factor inhibiting HIF1 (FIH) antibodies (clone 162C) were purchased from NOVUS Biologicals (Littleton, CO).
Hypoxia-treatments
For induction of hypoxia, MM cells were cultured in a humidified Hypoxygen hypoxia chamber (Grandpair, Heidelberg, Germany). Variable pO2 levels were established in the hypoxia chamber from 2-0.1% O2, and 5% CO2 at 37 °C. Oxygen levels were regularly tested and calibrated using the manufacturer’s protocol.
Generation of hypoxia response element luciferase-expressing (HRE-LUC) cell lines
HRE-LUC reporter MM cell lines (8226, U266, OPM-2) were generated by stably transducing cells using the Cignal lentiviral kit (Qiagen, Valencia, CA) followed by selection with hygromycin (350 mg/ml). For the orthotropic xenograft studies, other luciferase-expressing 8226 cells (8226-LUC) were stably transfected with the pGL4.5 luciferase reporter vector (Promega, San Louis Obispo, CA) using an AMAXA Nucleofector Kit (Lonza, Koln Germany) followed by selection with hygromycin (350 mg/ml). The in vitro luciferase activity was confirmed and measured using the dual-luciferase reporter assay kit (Promega, San Louis Obispo) in a luminometer. The in vivo luciferase activity was measured using the VivoGlo luciferine substrate (Promega).
Real time PCR
Quantitative expression of VEGF was carried out by quantitative real time PCR. RNA was isolated using Triazol (Life Technologies, Carlesbad, CA) and cDNA was synthesized using cDNA synthesis kit (Life Technologies). VEGF mRNA was amplified using VEGF primers (Life Technologies) in an ABI 7300 real time PCR machine (Life Technologies). The Applied Biosystems® TaqMan® Array Human Hypoxia 96-well Plate was used to test for changes in hypoxia signaling associated genes.
Animals
Male NOD/SCID or NOG mice (4–6 weeks old) were obtained from Jackson Laboratories (Bar Harbor, ME, USA). All animal studies were conducted in accordance with protocols approved by the Institutional Animal Care and Use Committed (IACUC) of the Greater Los Angeles Veterans Administration Healthcare System (GLA-VAHS).
SQ Xenograft Model
We used the murine myeloma xenograft model of Leblanc et al (22) with minor modifications (21). The 8226 cells (10 × 106 cells/mouse) were mixed with matrigel (BD biosciences) then injected subcutaneously into the right flank (200 μl/mouse) of the mice. The mice were monitored and randomized into drug treated or control groups (10 mice/group) when the tumor volume reached approximately 300–500 mm3. The Py-Im polyamide solution was prepared as previously described (23). Mice were given HIF-PA injections IP every other day for a total of 5 injections. The tumor volume was measured using calipers (width and length) using the formula W2 × (L/2) (21, 24) every other day during the course of the experiment.
Orthotopic Xenograft Model
8226-LUC cells were injected (10 × 106 cells/mouse) through the tail vein (200 μl/injection). In our initial experiments, the localization of human 8226 myeloma cell lines in the bone marrow was determined by two methods: (1) flow cytometry staining of bone marrow aspirates from the femurs of mice using FITC labeled anti-human CD45 antibodies (BD Biosciences) and (2) immunohistochemistry of femurs using anti-human CD45 antibodies. Real time 8226-LUC engraftment in the bone marrow was measured in anesthetized mice given an IP injection of VivoGlo luciferin substrate (100 mg/kg mouse) and then monitored for luciferase activity in the skeleton using a Perkin-Elmer IVIS XRMS small animal imaging system. Luciferase activity in the skeleton of mice challenged with 8226-LUC was typically observed between day +15 and day +20 post challenge. Once a positive bioluminescent signal was observed, the animals were randomized into groups (6–8 animals/group) and were treated with HIF-PA or vehicle control as described above, except a total of 6 injections were given, rather than 5. The luciferase activity was measured twice/week as described above and the change in average radiance (photons/sec/cm2/steradian) was measured and analyzed using the LivingImage version 4.4 imaging software.
Immunohistochemistry
For studies in our SQ model, 24 hours after the last injections, the mice were euthanized and the tumor mass was excised. The tumor was bisected using a razor blade: one half of the tumor was immediately placed in 10% buffered formaldehyde overnight, and the other half was flash frozen for protein extraction. Formaldehyde fixed tumors were embedded in paraffin and cut into 5 μm-thick serial sections using standard histological procedures. Immunohistochemical staining with cleaved caspase 3, and Hypoxyprobe (pimonidazole) (HPI Inc) was conducted using standardized automated methods.
Morphometric Analysis
IHC analysis was performed on tissue sections with a Nikon Microphot-SA microscope (Melville, NY, USA) equipped with plan-apochromat lenses (20X and 40X). A Diagnostic Technologies digital camera, model SPOT-RT was used to capture images with a resolution of 1520 × 1080 pixels. Fields were selected by reviewing the slides at low power by a researcher (VM) blinded to the treatments. Multiple non-overlapping fields were identified for analysis of regions of hypoxia/necrosis and apoptotic index at higher powers within these areas of interest. ImageJ software (NIH, USA) was used to measure percent of hypoxia stained tumor sections. Final images for publication were prepared using Adobe Photoshop software.
Oncomine Analysis
The expression level of PHD2/EGLN1 and PHD3/EGLN3 genes in normal, MGUS and MM tumors were analyzed using Oncomine, a cancer microarray database and web-based data-mining platform (25). In order to reduce our false discovery rate, we selected p<0.0001 as a threshold. We analyzed the results for p-values and fold change of our genes of interest.
Statistics
Data was screened for consistency and quality by both graphical (histograms, scatter plots) and analytical methods (descriptive statistics). Variables were analyzed using generalized linear models (GLM) such as ANOVA and t-tests. The effect of combining HIF-PA with rapamycin on induction of apoptosis was assessed by the median effect method using Calcusyn Software Version 1.1 (Biosoft, Cambridge, United Kingdom). Combination indices (CI) values were calculated using the most conservative assumption of mutually nonexclusive drug interactions. CI values were calculated from median results of apoptosis assays.
RESULTS
Myeloma cell lines are resistant to hypoxia-induced apoptosis in vitro
Because patient MM tumor cells specifically engraft within the hypoxic BM microenvironment, we anticipated that patient-derived MM cell lines would also exhibit resistance to hypoxia-mediated apoptosis in vitro. This was confirmed by analyzing the sensitivity of a panel of MM cell lines cultured under various pO2 concentrations in increments from 2% down to 0.1% O2 and for various time points up to 72 hours. We chose these experimental ranges because these values fell within the actual pO2 ranges reported by Spencer et al (6) from in situ measurement in mouse bone marrow. In their study, O2 levels in the marrow were found to be <32 mm Hg, but in some bone marrow niches, it could be as low as 9.9 mm Hg (or about 1% O2 with a range of 2 - 0.6% measured in the extra-vascular spaces). We found that at O2 levels greater than ~1%, only modest cytotoxicity was observed, even when cells were cultured out to 72 hours. Only at very low oxygen conditions (i.e. 0.5 – 0.1% O2), did we see significant levels of hypoxia-mediated apoptosis of the MM cells tested when compared to the “normoxia-cultured” controls. As shown in Fig 1A, 8226 and U266 cell lines were the most resistant to low pO2 (~15–20% apoptosis), whilst H929 and MM1.S were intermediately sensitive (~25–35% apoptosis) to hypoxia-mediated apoptosis (all measured at 72 hours). In contrast, OPM-2 cells were the most sensitive (>50% apoptosis) to low O2, and this effect occurred significantly earlier, by 48 hours.
Figure 1.
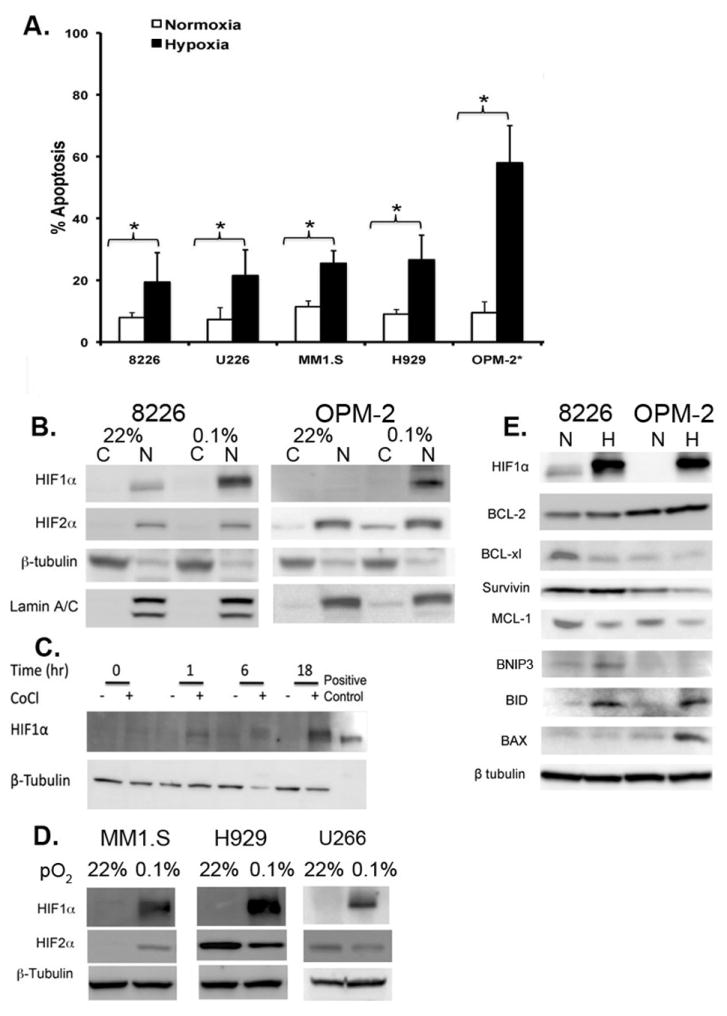
Cytotoxic effects of low pO2 levels on myeloma cell lines. (A) The % apoptosis (measured by cleaved caspase 3) following 72 hour culture of myeloma cells under “normoxic” conditions (~22% O2, 5% CO2) or hypoxic (0.1% O2, 5% CO2) conditions, except for OPM-2 cells which were cultured for 48 hours. Brackets indicate P<0.05 (T-test). Values represent mean ± 1 standard deviation of 4 independent experiments/cell line. (B). Immunoblots of HIF1α and HIF2α-subunit expression in 8226 and OPM-2 cells cultured under normoxic or hypoxic conditions (0.1% O2, 5% CO2) for 24 hours. The cells were harvested on ice then the cytoplasmic and nuclear fractions were isolated, and the lysate was immunoblotted for indicated proteins. C=cytoplasm fraction, N=nuclear fraction. The data presented are a representative immunoblots of at least 2 independent experiments. (C) Time course of CoCl2-mediated induction of HIF1α expression in OPM-2 cells. Cells were cultured with 100nM CoCl2 or vehicle control and the cellular lysates were harvested at indicated time points and immunoblotted for HIF1α expression. The data presented are a representative immunoblots of at least 2 independent experiments. (D) Hypoxia-mediated induction of HIF1α and HIF2α in MM1S, H929 and U266 myeloma cell lines cultured under normoxic or hypoxic (0.1% O2, 5% CO2) conditions for 24 hours. Cells were harvested on ice and the cell lysate was immunoblotted for HIF1α and HIF2α. The data presented are a representative immunoblots of at least 2 independent experiments. (E) Immunoblots showing hypoxia-mediated changes in survival-related protein expression in 8226 and OPM-2 cells cultured under normoxic or hypoxic conditions (0.1% O2, 5% CO2) for 24 hours. The cells were harvested on ice and the lysate was immunoblotted for indicated proteins. The data presented are a representative immunoblots of at least 2 independent experiments.
Culturing cells under low pO2 had different effects on the HIFα-subunits expression in the nuclear and cytoplasmic fractions of the hypoxia-resistant (8226) and hypoxia-sensitive (OPM-2) cell lines cultured under standard normoxic (~22% O2) or hypoxic (0.1% O2) conditions. As shown in Fig 1B (left panel), HIF1α was constitutively expressed in the nuclear fraction of 8226 cells as well as significantly upregulated under hypoxic conditions (measured at 24 hours). In contrast to 8226, baseline HIF1α was absent in OPM-2 cells, but was strongly induced by low O2 (Fig 1B, right panel). On the other hand, HIF2α was constitutively expressed in both 8226 and OPM-2 cells and this was independent of O2-levels (Fig 1B). The rapid upregulation of HIF1α in OPM-2 cells was confirmed using the hypoxia mimic, CoCl2, which induced HIF1α expression by 1 hour and reached a maximum by 18 hours (Fig 1C). A strong O2-dependent induction of HIF1α was also noted in MM1S, H929, and U266 cell lines (Fig 1D), while HIF2α expression was independent of O2 levels in H929 and U266 cells, but not in MM1S cells. These findings are generally similar to other reports describing HIF expression in MM cells (3, 26). Low pO2 (0.1% 24hrs) did not affect the expression of the pro-survival factor Bcl-2, but did inhibit Bcl-xl and MCL-1 in OPM-2 and 8226, whilst survivin was only downregulated in OPM-2 cells (Fig 1E). Survivin has been reported to play a role in HIF-regulated survival of MM and may be an important target for future studies (27). Low pO2 also upregulated the pro-apoptotic factors, BNIP3 (a known HIF target) and BID in both lines tested, but BAX was only upregulated in OPM-2.
Since we observed differential oxygen-dependent expression patterns for the HIFα-subunits, we next asked if expression in the PHD isoforms responsible for regulating the α-subunits could explain these results. As seen in Fig 2A, expression of PHD2/EGNL1 was absent in 8226, but strongly expressed in OPM-2 cells. It has been reported that PHD2/EGLN1 preferentially hydroxylates HIF1α (28), and its absence would explain why 8226 cells express constitutive HIF1α under normoxic conditions. Along similar lines, we also found that PHD3/EGLN3, which preferentially hydroxylates HIF2α (29), was absent in both 8226 and OPM-2 cells, and that also explains the oxygen-independent expression of HIF2α in both these cell lines. To ensure that our antibodies could identify PHD/EGLN3 antigens, we included a positive internal EGLN3 control (EGLN3 overexpressing lysate from HEK293T cells purchased from NOVUS) in our immunoblots. We also found that low pO2 (0.1%) significantly upregulated PHD2/EGLN1 protein expression, and probably this likely acts as a negative feedback mechanism to return HIF back to basal levels when O2 levels return back to normal (30). Furthermore, hypoxia-mediated upregulation of PHD2/EGLN1 was unaffected by treatment with HIF-PA. We also examined the expression of another O2-dependent regulator of HIF1α, the factor inhibiting HIF-1 protein (FIH), and found that there was no difference in expression under either normoxic or hypoxic conditions in the cell lines we tested.
Figure 2.

There is differential expression of HIF regulatory pathway in 8226 cells. (A) Immunoblots of PHD2/EGLN1, PHD3/EGLN3 and FIH in 8226 cultured under normoxic or hypoxic conditions (0.1% O2, 5% CO2) for 48 hours in the presence or absence of HIF-PA (10 μM). Cells were harvested on ice and the cell lysate was immunoblotted. A positive immunoblot control (an over expression lysate from HEK293T cells) for PHD3/EGLN3 is included. The data presented are a representative immunoblots of at least 2 independent experiments. (B) Boxplot results showing a meta-analysis of PHD2/EGLN1 and PHD3/EGLN3 in normal bone marrow, monoclonal gammopathy of undetermined significance (MGUS), multiple myeloma, smoldering myeloma and plasma cell leukemia. Analysis was performed using Oncomine and includes two data sets: Angelli et al (N=156) and Zhan et al (N=78). (C) Relative fold change in hypoxia-mediated expression of select genes compared to normoxic conditions. The 8226 cells were cultured under normoxic or hypoxic (0.1% O2, 5% CO2) conditions for 24 hours. The RNA was collected and gene expression was determined by quantitative real-time PCR analysis. The relative fold change in hypoxia-mediated gene expression compared to normoxic levels are shown. Values above the dotted line indicate upregulation of genes by hypoxia, and values below the dotted line indicate downregulation of genes by hypoxia. These data are representative of 2 independent experiments.
To further characterize the expression patterns of PHD2/EGLN1, we used the Oncomine tool, a publically available cancer microarray database to query if there were differences in gene expression in clinical specimens of MM or monoclonal gammopathy of undetermined significance (MGUS) versus normal controls within two data sets; Zhan et al (N=78 samples) (31) and Agnelli et al (N=158) (32). As shown in Figure 2B, PHD2/EGLN1 (top panel) was significantly overexpressed in MM specimens versus normal specimens (p<0.05), and in MGUS versus normal specimens in the Zhan study (p<0.05) but not in the Agnelli study (p>0.05). On the other hand, PHD3/EGLN3 (bottom panel) was not significantly different in MM and MGUS versus normal specimens (p>0.05) in either data set, although there was a general downward trend of expression of this gene. Next, we used the TaqMan® Array Human Hypoxia 96-well assay system to analyze for changes in a subset of hypoxia-related genes in 8226 cells. As shown in Fig 2C, hypoxia increased the relative expression of HIF1α by 6 fold, but had only minor effects on HIF2α expression, mirroring the results shown in Fig 1B. Other genes associated with the HIF regulatory pathway, such as PHD2/EGLN1, cullen-2 and EP300, were induced, whilst PHD3/EGLN3 and E3 ubiquitin were downregulated and which mirrored the results from Fig 2A and 2B above. Not unexpectedly, VEGF and angiopoieitin-4 gene expression, genes that are well known to be sensitive to hypoxia, were upregulated by hypoxia.
HIF-targeting polyamide (HIF-PA) inhibits the adaptive hypoxic response in MM cells
We next tested the ability of HIF-PA to inhibit the cellular response to hypoxia using 8226 cells that had been stably transduced with a hypoxia response element (HRE)-luciferase reporter construct (8226-HRE-LUC). As shown in Fig 3A, culturing 8226-HRE-LUC cells under low pO2 (0.1% O2, 24hr) resulted in a ~2 fold induction of luciferase activity over the baseline “normoxic” controls. This hypoxia-mediated LUC induction was significantly inhibited (p<0.05) by treatment with HIF-PA but not by a control polyamide (CO-PA) that recognized a non-HRE sequence. To provide further support for our model, we knocked down HIF1α expression in 8226-LUC cells using HIF1α siRNA (Fig 3B top panel). As we expected, and as shown in Fig 3B (bottom panel), the hypoxia-mediated increase of LUC activity in 8226-LUC reporter cells transfected with HIF1α siRNA also demonstrated a significant inhibition of the hypoxia-induced LUC activity. These data support our hypothesis that HIF-PA can specifically inhibit the HIF-mediated cellular response to hypoxia in 8226 cells. Next we showed that HIF-PA could inhibit the expression of HIF-mediated gene expression using real-time PCR to assay for the effect of HIF-PA treatment on the expression VEGF RNA. It is well known that hypoxia upregulates VEGF transcription in myeloma cells, and as expected, culturing 8226 cells under hypoxic conditions (0.1% O2, 24 hrs) induced VEGF mRNA by ~3–4 fold (Fig 3C). Treatment with HIF-PA significantly (p<0.05) inhibited this hypoxia-mediated upregulation of VEGM mRNA in a dose dependent manner. This effect on mRNA was also mirrored by HIF-PA mediated inhibition of VEGF protein (measured by ELISA) in the supernatant of these cells (Fig 3D). Altogether, these data demonstrate that HIF-PA specifically and effectively inhibits the adaptive hypoxic response in MM cells.
Figure 3.

HIF-PA polyamide inhibits the in vitro response to low pO2 in 8226 myeloma cell lines. (A) 8226-HRE-LUC reporter cells were cultured under normoxic or hypoxic (0.1% O2, 5% CO2) conditions and treated with either 10 μM HIF-PA or 10 μM CO-PA for 24 hours. Luciferase activity in cell extracts was measured using a luminometer. Values are presented as means ± 1 standard deviation of 3 independent experiments. Bracket with *=P<0.05 (ANOVA). Bracket with NS= not significant. (B) 8226-HRE-LUC reporter cells were co-transfected with HIF1α siRNA or scrambled (sc) control and were then cultured under normoxic or hypoxic (0.1% O2, 5% CO2) for 24 hours. Luciferase activity in cell extracts was measured using a luminometer. Values are presented as means ± 1 standard deviation of 3 independent experiments. Bracket with *=P<0.05 (ANOVA). Bracket with NS= not significant. Top panel: Immunoblot demonstrating knockdown of HIF1α (but not HIF2α) by siRNA. These data are representative of 3 independent experiments. Bottom panel: Change in LUC activity in treated 8226 cells. Values are presented as means ±1 standard deviation of 3 independent experiments. Bracket with *=P<0.05 (ANOVA). Bracket with NS= not significant. (C) HIF-PA (10 μM)-mediated inhibition of VEGF mRNA levels in 8226 cells cultured under normoxic or hypoxic (0.1% O2, 5% CO2) conditions for 24 hours. VEGF mRNA levels were measured by quantitative real-time PCR of 3 independent experiments. *P<0.05. (ANOVA). (D). Effect of HIF-PA treatment on VEGF protein in supernatants of 8226 cells cultured under normoxic or hypoxic conditions were measured by ELISA. Values are presented as mean ± 1 standard deviation of 3 independent experiments. *P<0.05 (ANOVA).
HIF-PA treatment overcomes MM cell resistance to hypoxia
We next asked if inhibiting the hypoxic response with HIF-PA could sensitize a panel of MM cells to hypoxia-mediated killing. We assayed this using hypoxia resistant 8226 and U266 cells and hypoxia sensitive MM1.S and OPM-2 cells that were cultured under normoxic or hypoxic conditions (0.1% O2) in the presence of HIF-PA or a control polyamide (CO-PA). HIF-PA had little effect on 8226 cells (Fig 4A) and U266 (Fig 4B) cultured under standard conditions (white bars), but the treatment of 8226 and U266 cells cultured under hypoxic conditions resulted in significant and dose-dependent hypoxia-mediated killing (an increase from ~20% to ~60%) (black bars) (ANOVA *p<0.05). The hypoxia “sensitive” MM1.S and OPM-2 cells (Fig 4C and D) were even more responsive to HIF-PA, (ANOVA *p<0.05) with a similar increase in apoptosis observed by only 24 hrs when cultured under low O2 conditions. The CO-PA compound had little, if any, effect on the hypoxia-mediated apoptosis in any of the cell lines examined. These data support our hypothesis that inhibiting the adaptive hypoxic response with HIF-PA overcomes MM resistance to hypoxia-mediated apoptosis in vitro.
Figure 4.

HIP-PA treatment sensitizes the hypoxia-resistant 8226, U266, and hypoxia-sensitive MM1S and OPM-2 cells to hypoxia-mediated apoptosis in vitro. (A) 8226 were cultured under normoxic or hypoxic (0.1% O2, 5% CO2) conditions with indicated concentration of HIF-PA or CO-PA for 72 hours. (B) U266 were cultured under normoxic or hypoxic (0.1% O2, 5% CO2) with indicated concentration of HIF-PA or CO-PA for 72 hours. (C) MMI.S cells were cultured under normoxic or hypoxic (0.1% O2, 5% CO2) with indicated concentration of HIF-PA or CO-PA for 48 hours. (D) OPM-2 cells were cultured under normoxic or hypoxic (0.1% O2, 5% CO2) with indicated concentration of HIF-PA or CO-PA for 24 hours. At the end of the treatment, cells were harvested and the percent apoptosis was measured by flow cytometry for cleaved caspase 3. Values are mean ± 1 standard deviation of 3 independent experiments. Bracket * indicates significant change (P<0.05) (ANOVA) of treatment compared to control.
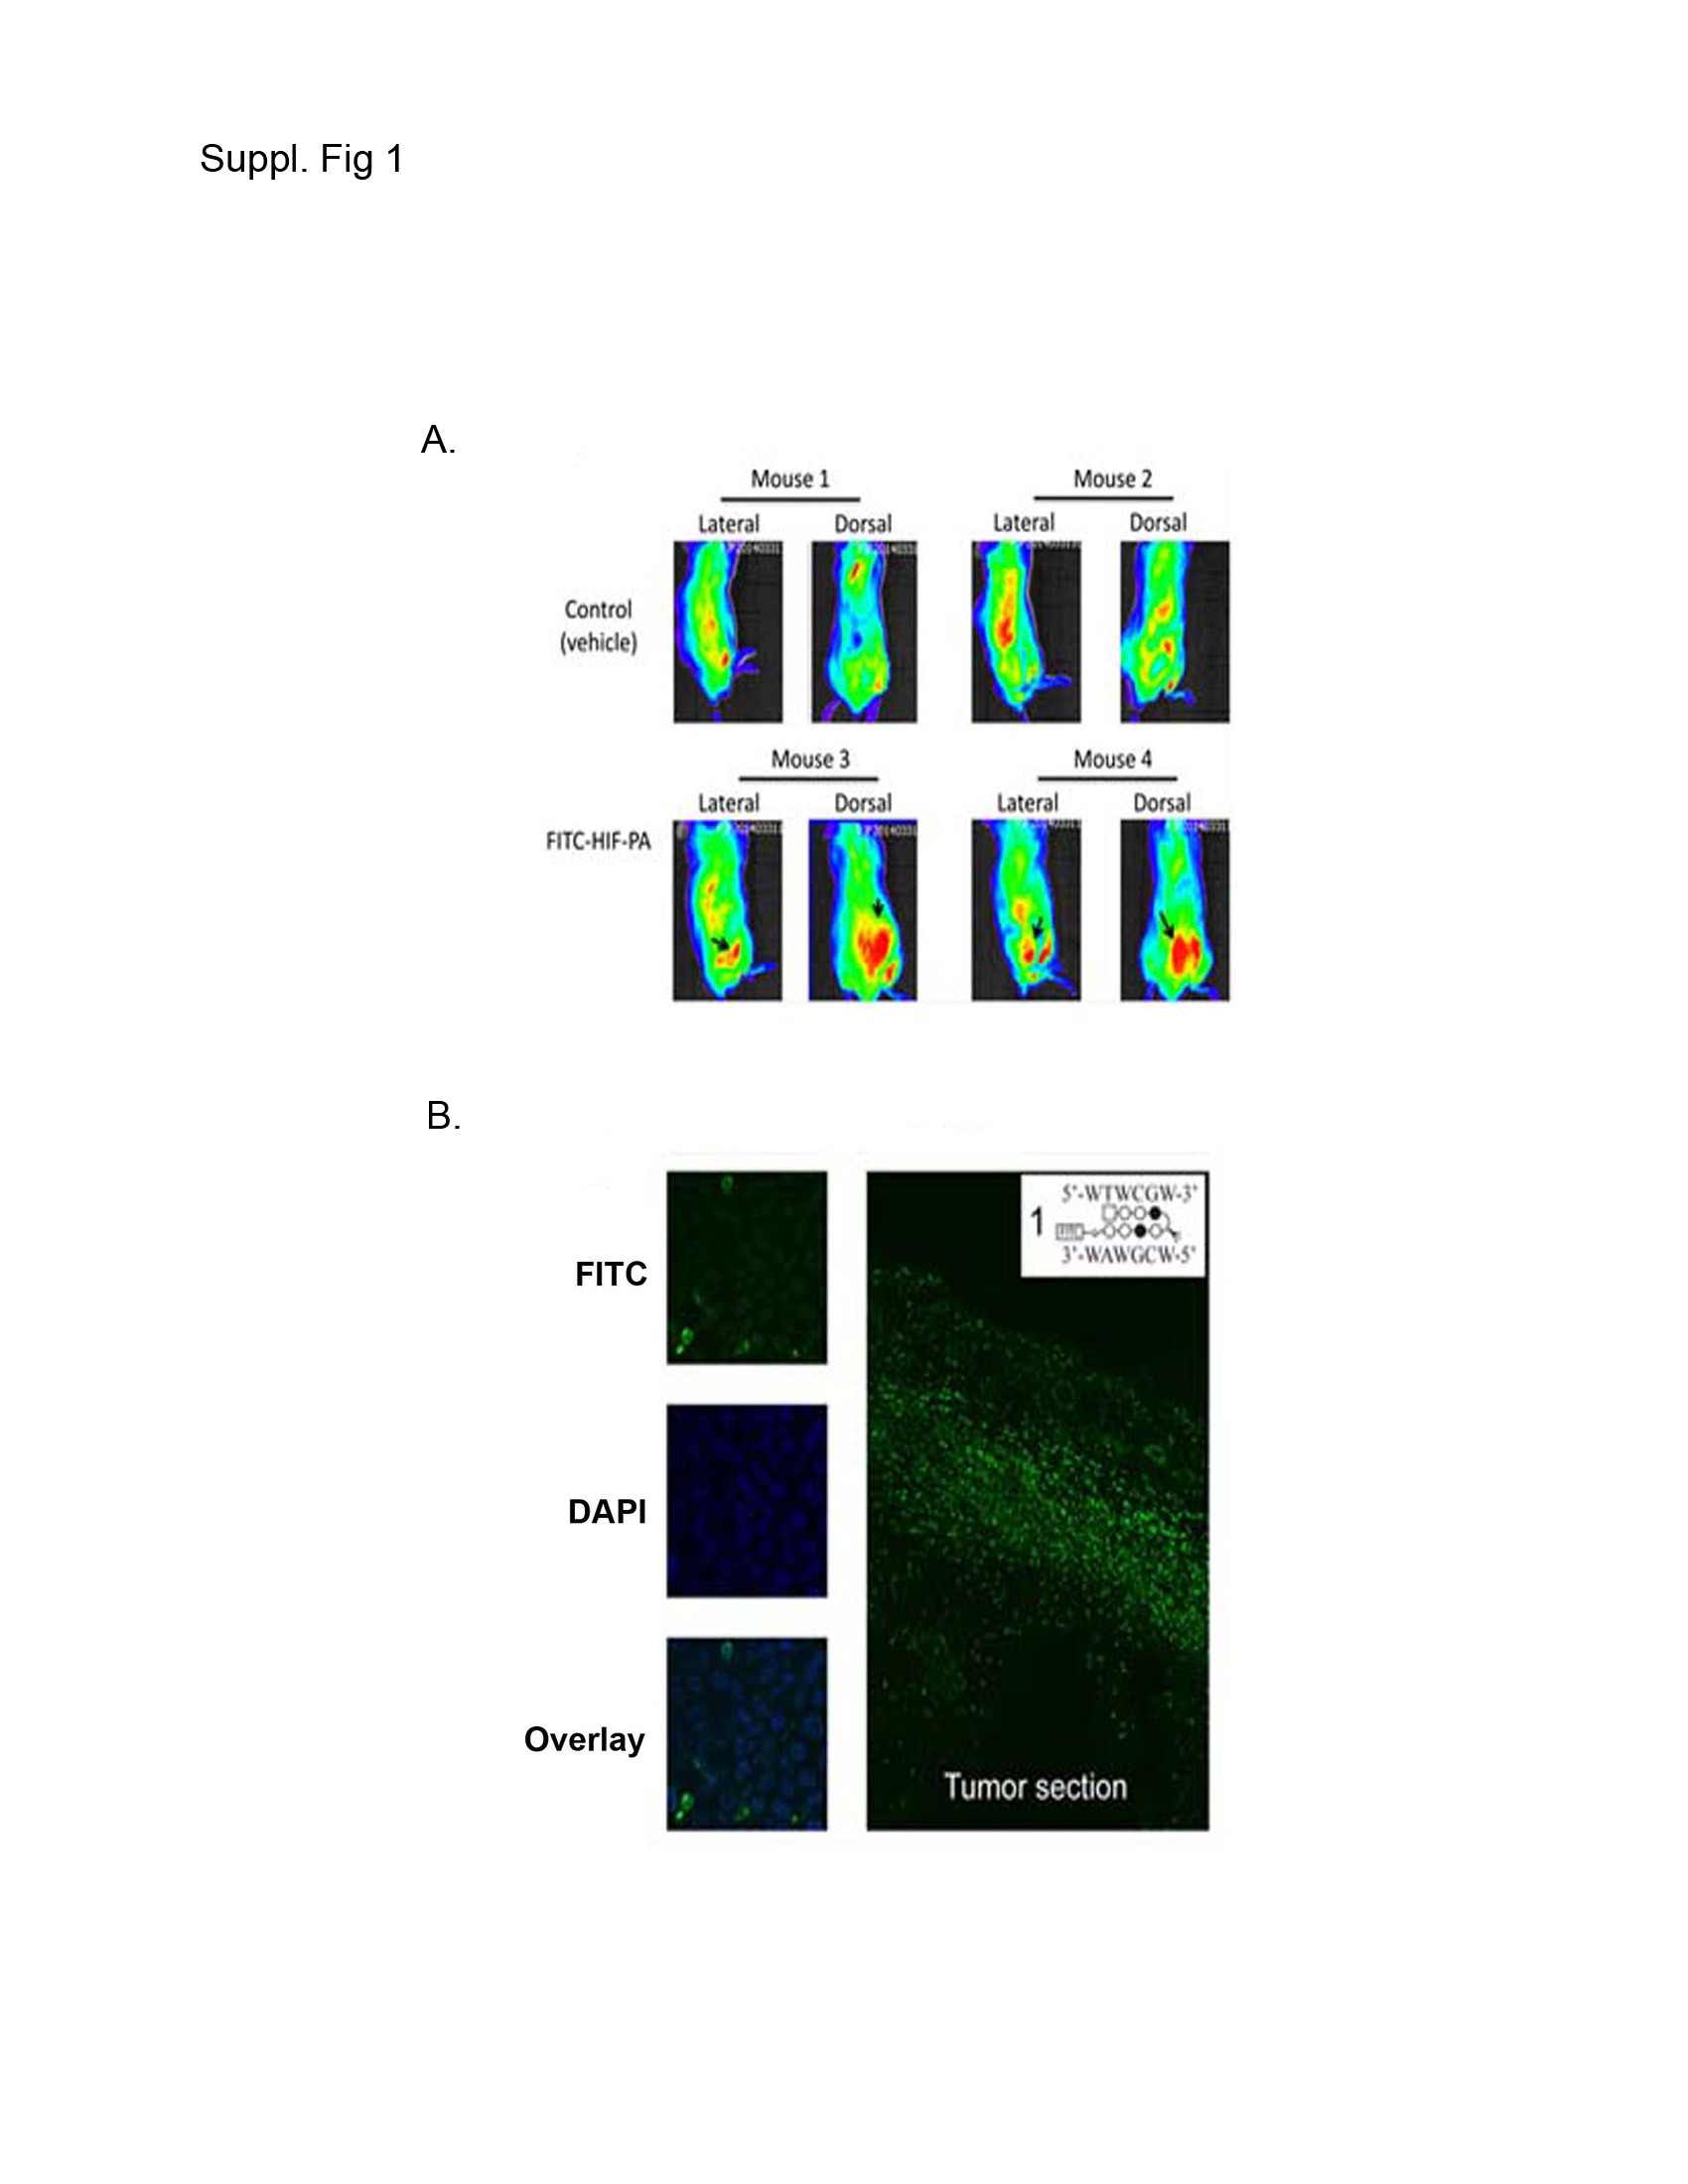
As an in vivo correlate of the above in vitro data, we tested HIF-PA activity using a xenograft SQ MM tumor model in NOD/SCID mice (21, 24, 33). The mice were challenged on the flank with 10 X106 8226 cells admixed with matrigel. Once a palpable tumor developed (~15 days later), the mice were randomized into groups (N=10 mice/group) to be given 5 IP injections of either HIF-PA (100 nmol/injection) or vehicle control every other day (Fig 5A, arrows on X-axis indicate days of treatment). The HIF-PA treatments were well tolerated, with only a small transient decrease in weight being observed, and induced a rapid and significant inhibition of tumor growth in the HIF-PA-treated mice compared to control mice (p<0.05). In order to confirm uptake of HIF-PA, we treated an additional group of mice (N=2 mice/group) with a FITC-conjugated HIF-PA and measured drug uptake by real-time fluorescent imaging. We observed some auto-fluorescence signal in the bladder and gut (Supplemental Figure 1A, mice #1 and #2). However, in FITC-HIF-PA treated mice, positive signals were also observed in the tumor nodules (Supplemental Figure 1A, note arrow indicating tumor nodule in mouse #3 and #4). Labeled HIF-PA localization in the nuclei was confirmed by fluorescent confocal microscopy of excised tumor sections, costained with DAPI (Supplemental Figure 1B). This is consistent with the recent studies on the uptake C14 labeled Py-Im polyamides into tumors (34)
Figure 5.


HIF-PA (100nmol/kg mouse) inhibits 8226 tumor growth in a subcutaneous (SQ) myeloma xenograft model (N=10 mice/group). (A) Change in 8226 tumor volume in HIF-PA-treated NOD/SCID mice. Mice were challenged SQ with 10×106 cells admixed in matrigel. When the tumor volume was ~500 mm3 (~day 15 post challenge), the mice were randomized into treatment and control groups (10 mice/group). The mice were given 5 IP injections at indicated concentration (Arrows indicate days of treatment) and the tumor volume was measured using calipers. Values represent mean volume ± 95% confidence interval. *P<0.05. (B) Photomicrographs of SQ tumor sections harvested from mice treated with HIF-PA or vehicle-control treated mice (N=10 mice/group). Tumors were harvested 24 hours after last the IP injections. Serial tumor sections were stained for hypoxia (by pimonidazole; brown stained areas) or apoptosis (cleaved caspase 3). *Indicate corresponding geographic regions in the sections. Arrow indicates areas of hypoxia and associated apoptosis. (C) The percent area of hypoxic tumor bed measured by staining with pimonidazole (measured in 10 fields/tumor, 10 tumors/group) in 8226 tumors harvested from HIF-PA or vehicle-treated mice. Area was measured using Metamorph computer software. Values are presented as mean ± 1 standard deviation. *P<0.05. (ANOVA) (D) Apoptotic index (the number of apoptotic cells/unit area) was measured by counting cells staining for cleaved caspase 3 (10 fields/tumor, 10 tumors/group). The apoptotic index in regions of “normoxia” or “hypoxia” were assayed by using serial sections stained with pimonidazole to identify specific geographical areas in the tumor nodules. Values are presented as mean ± 1 standard deviation. *P<0.05 (ANOVA). (E) Tumor lysate was collected and VEGF was analyzed by ELISA (10 tumors/group). Values are presented as mean ± 1 standard deviation. *P<0.05 (T-test).
In order to characterize the in vivo effect of HIF-PA, we excised the tumor nodules 24 hrs after the last injection and performed immunohistochemistry on serial sections stained either for hypoxia (pimonidazole staining, left panels) or apoptosis (cleaved caspase 3, right panels) (Fig 5B). Both vehicle control (top left panel) and HIF-PA (bottom left panel) treated tumors had regions of hypoxia (brown stained areas), but the extent of hypoxia was significantly greater in the HIF-PA treated tumors than in the control tumors (quantified in Fig 5C). We also noted there were significantly greater areas of necrosis within the tumor bed in HIF-PA treated tumors compared to control tumors as well as a strong physical correlation between areas of hypoxia and presence of apoptosis in the HIF-PA-treated tumors (see Fig 5B, bottom right panel). In contrast, apoptotic cells were evenly distributed throughout the tumor bed in the control tumors (Fig 5B, top right panel) and were not localized to a specific geographic region in the tumor. As shown in Fig 5C, we found that the area of positive hypoxia staining in tumor sections (10 tumors/group, 10 fields/tumor) was ~35% in nodules harvested from the HIF-PA treated mice, compared to about 18% in the tumors harvested from mice treated with vehicle control (p<0.05). The apoptotic index (AI) in both the normoxic or hypoxic regions of the tumor was determined by counting number of apoptotic cells in these regions using corresponding serial sections (10 tumors/group, 10 fields/region) stained with pimonidazole to identify the specific geographical regions of interest. As shown in Fig 5D, there was an approximate 3–4 fold increase in apoptotic cells located within the hypoxic regions of tumors from the HIF-PA treated mice compared to hypoxic regions of the control tumors (P<0.05), whilst there was no difference in apoptotic index within “normoxic” regions of the tumor bed. Finally, we examined the expression of VEGF in tumor lysates by ELISA (Fig 5E). As with our in vitro data (see Fig 3D), HIF-PA significantly inhibited VEGF expression by approximately 50% when compared to control tumors. Altogether, this data supports our hypothesis that HIF-PA can overcome resistance to hypoxia-mediated apoptosis in vivo by inhibiting the adaptive hypoxic response.
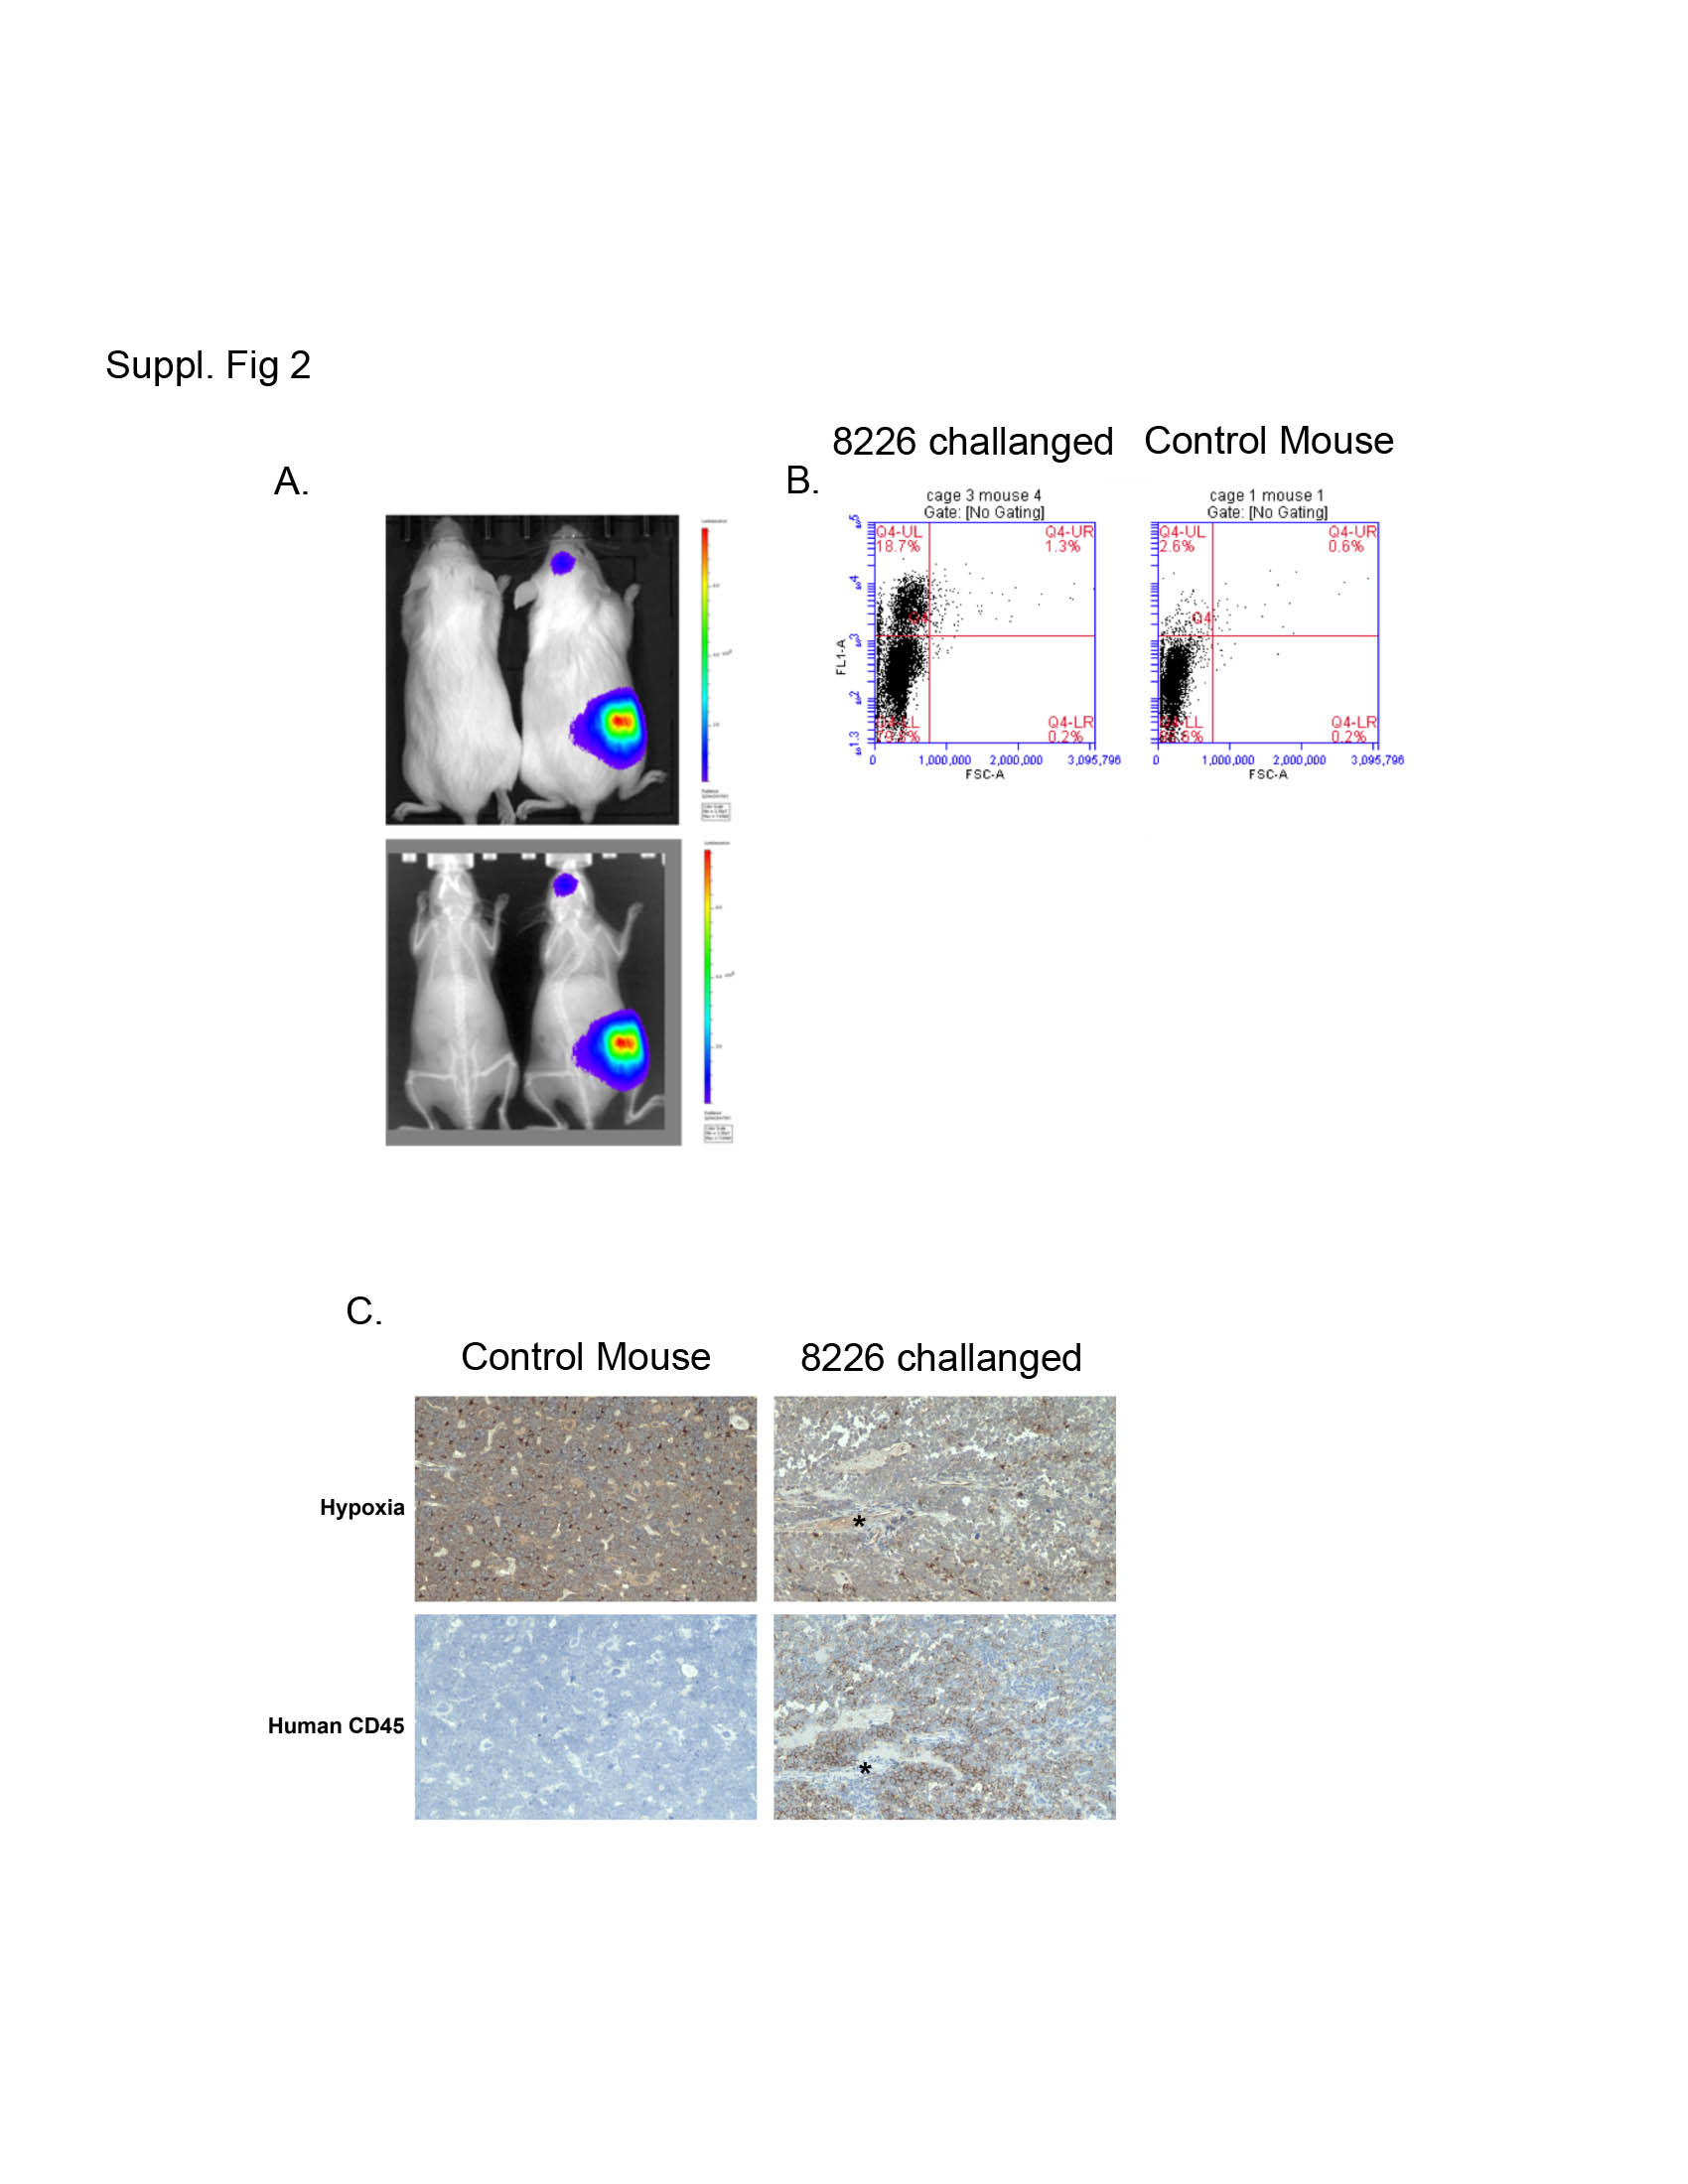
As a more physiologically relevant model, we developed an orthotopic, “disseminated” bone marrow-engrafted xenograft model based on the model developed by Miyakawa (35) using LUC2-transfected 8226 (these cells use a different p4.5 LUC2 plasmid to drive luciferase expression and thus are different than the 8226-HRE-LUC cells described above) allowing us to perform real-time longitudinal studies on myeloma tumors engrafted in the BM. As shown in Supplemental Fig 1A, NOG mice challenged with 8226LUC cells developed bone marrow engrafted MM tumors that could be observed by bioluminescence (top panel) and X-ray (bottom panel) analysis. Approximately 20–50% of the bone marrow cells from inoculated mice were positive for human CD45 confirmed by flow cytometry using FITC-conjugated anti-huCD45 antibody (Supplemental Fig 2B) and by IHC of in situ huCD45+ 8226 cells in the mouse femurs (Supplemental Fig 2C). Gross histological analysis of the mice didn’t show tumor formation in other tissues (i.e. liver, lung, spleen, or kidney).
We then asked if treatment with HIF-PA had an anti-MM effect on tumor cells in the bone marrow. As shown in Fig 6A, approximately +20 days post challenge with 8226-LUC cell, engraftment of LUC2+ cells in the skeleton was confirmed and the mice were then randomized into treatment groups (6–8 mice/group). The mice were then give IP injections of 100 nmol/injection of HIF-PA every other day (arrows indicate days of injection on day +27, +29 +31, +34, +36 and +38) or vehicle control. The average radiance (photons/sec/cm2/steradian) was measured at various time points using a Perkin Elmer Lumina XRMS small animal imager (out to day +40). The treatment with HIF-PA significantly inhibited MM tumor growth in the marrow (data is presented as average radiance ± 95% confidence intervals) starting after the third injection and reaching statistical significance by the last HIF-PA injection on day +38). It should be noted that this particular HIF-PA treatment regimen was not able to delay the development of hind limb paralysis (the main end point criteria) when compared to control animals, with ~50% of the animals reaching their end point on day +59 (control mice) and day +62 (HIF-PA treated mice). Representative images of some of the mice are shown for day +22, +35 and +40. We noted a decrease in the luciferase activity as well as a general shrinkage of individual tumor foci in the mice. Specifically, in control mice, tumor foci tended to grow and merge over time, while in HIF-PA treated mice, the foci remain relatively small and isolated.
Figure 6.

HIF-PA (100nmol/kg mouse) inhibits 8226-LUC tumor growth in an orthotopic myeloma xenograft model (N=8 mice/group). (A) Change in average radiance (p/sec/cm2/ser) in HIF-PA-treated NOG mice was measured using IVIS XRMS small animal imaging system. Briefly, mice were challenged IV with 10×106 cells and engraftment of 8226-LUC cells were confirmed by IP injection of luciferin substrate (VivoGlo, Promega) starting ~day 20 post challenge. Once a positive signal was observed in the bone marrow, the mice were randomized into treatment and control groups (6–8 mice/group). The mice were given 6 IP injections at indicated concentration (Arrows indicate days of treatment) and the change in average radiance of tumor foci were measured as described above. Values represent mean volume ± 95% confidence interval. *P<0.05. (B) Representative images of mice imaged on day +22, +35 and +40 showing changes in LUC activity. Mice were imaged using a IVIS XRMS small animal imaging system.
Effect of targeting the mTOR pathway on regulation of HIF-PA sensitivity
Since we have previously demonstrated that mammalian target of rapamycin (mTOR) inhibitors kill MM cells in vivo, and this anti-MM effects is mediated, at least in part, by inhibiting VEGF translation and de novo angiogenesis (21, 24, 33, 36), we asked if there would be a synergistic effect if we combined HIF-PA-mediated inhibition of hypoxia-inducible gene transcription in combination with rapamycin-mediated inhibition of mTOR-mediated regulation of protein translation. As shown in Fig 7A, treatment of 8226 cells with the mTOR inhibitor rapamycin had a modest effect on apoptosis in MM cells cultured under normoxic or hypoxic conditions (0.1% O2, 72 hours). However, under low pO2 conditions, using median effect combination indices (CI) analysis for apoptosis induction, we found that the combination treatment with rapamycin and HIF-PA resulted in synergistic drug interactions with CI values <1 across several concentrations tested. Altogether, this suggests that targeting both transcription and translation of hypoxia-induced genes may be an effective anti-MM strategy (Fig 7A see grey and black bars and bracketed area). We also asked if REDD1, a hypoxia-sensitive negative regulator of mTOR, was affected by low pO2 in both 8226 and OPM-2 cells. As shown in Fig 7B, REDD1 was strongly induced in MM cells. Furthermore, the functional effects of hypoxia on mTOR signaling demonstrated a marked inhibition of phosphorylation of p70S6 kinase but only modest effects on AKT phosphorylation. The effects of hypoxia-mediated inhibition on p70 was transient and reversible in OPM-2 cells, with p70 (389) phosphorylation levels rapidly returning to normal within 2 hrs following reoxygenation of the cells (Fig 7C).
Figure 7.

Combination of rapamycin and HIF-PA can overcome resistance to hypoxia-mediated apoptosis in 8226 cells. (A) 8226 cells were cultured under normoxic (22%O2, 5% CO2) or hypoxic (0.1% O2, 5% CO2) and treated with the indicated concentrations of rapamycin, HIF-PA or both for 24 hours. At the end of the treatment, cells were harvested and % apoptosis was measured by flow cytometry for cleaved caspase 3. Values are mean ± 1 standard deviation of 3 independent experiments. Bracket * indicates significant change (P<0.05) of treatment compared to control (ANOVA). The effect of combining HIF-PA with rapamcyin on induction of apoptosis was assessed by the median effect method using Calcusyn Software Version 1.1 (Biosoft, Cambridge, United Kingdom). Combination indices (CI) values were calculated using the most conservative assumption of mutually nonexclusive drug interactions. CI values were calculated from median results of apoptosis assays. (B) Immunoblots of mTOR-related signaling proteins in 8226 and OPM-2 cells cultured under normoxic or hypoxic conditions for 24 hours. The data presented are a representative immunoblots of at least 2 independent experiments. (C) Time course of p70S6 kinase phosphorylation in OPM-2 cells following re-oxygenation. Cells were cultured under hypoxic conditions (0.1% O2, 5% CO2) for 24 hours, then cultured under normoxic conditions (22% O2, 5% CO2). Cell lysates were harvested at indicated time points and immunoblotted for HIF1α and phospho-P79S6K (389) expression. The data presented are a representative immunoblots of at least 2 independent experiments.
Discussion
There is increasing evidence that low oxygen conditions are supportive of MM growth, progression and the development of resistance to chemotherapy, and that this occurs via a cellular adaptive hypoxic response mediated, at least in part, by the action of HIF-transcriptional factors. Because of this and the development of more resistant tumor phenotypes associated with hypoxia, there has been increasing interest in targeting HIF-mediated gene transcription to overcome these effects (18). Hypoxia induces the expression of about ~100–200 genes mostly related to metabolism, angiogenesis, and apoptosis (37, 38), and in this study, we found that a sequence-specific DNA-binding oligomer (HIF-PA) that is capable of binding to the HRE and inhibiting HIF-mediated gene transcription (19, 39) can overcome MM resistance to hypoxia-mediated apoptosis in vitro and in vivo. We also found that treating MM cells with a combination of HIF-PA, to inhibit gene transcription, and rapamycin, to inhibit gene translation, had a strong synergistic cytotoxic effect against MM tumor cells cultured under hypoxic conditions. Our results provide a strong pre-clinical rationale for using polyamides to target the adaptive hypoxic response in MM and may prove to be efficacious in treating myeloma tumors engrafted in the hypoxic bone marrow microenvironment. We also note that the ability of HIF-PA to recognize and bind to HRE sequences enables them to block both the HIF1α/HIF1β and HIF2α/HIF1β dimers.
We surveyed a panel of MM cell lines and found that the expression of the HIF1α-subunit was generally absent under normal culturing conditions but was rapidly increased by low pO2 levels. The exception to this was 8226 cells, which constitutively expressed HIF1α under normoxic conditions, although it was further upregulated by hypoxia. In contrast to the HIF1α-subunit, HIF2α was constitutively expressed in all the cell lines studied (except MM1S), and the expression levels were independent of O2 levels. Of note, we did not observe a correlation between the expression of the HIF1α-subunit and sensitivity to hypoxia-mediated cytotoxicity in the cells we examined. These results are interesting because they suggest that the HIFα-subunits are differentially regulated by low pO2 levels in MM cells and that mechanisms other than just the expression of HIF1α regulates sensitivity to hypoxia. In fact, despite their similarities, it is known that the α-subunits can mediate different responses to hypoxia and tumorogenesis: HIF1α acts as a tumor suppressor gene and inhibits tumor growth, whilst HIF2α acts as an oncogene and promotes tumor growth (3, 40). It has also been demonstrated that the different α-subunits have varying affinities for hydroxylation by the different PHD isoforms, with PHD2/EGLN1 showing the highest affinity for HIF1α (28) and PHD3/EGLN3 showing the highest affinity for HIF-2α (29). In our study, we found that the expression patterns of PHD/EGLN isoforms could explain HIFα-subunit expression in both 8226 and OPM-2 cells. Specifically, PHD2/EGLN1 was expressed at very low levels in 8226, but not in OPM-2, which can explain why HIF1α was constitutively expressed in the former but not the later. It is also likely that the absence of PHD3/EGLN3 in MM cells results in the inability to hydroxylate HIF2α, thereby rendering its expression independent of O2 levels. Thus, it is likely that the expression and ability of PHD isoforms to regulate the expression of the different α-subunits may have important ramifications for disease progression and pathology in MM, such as what is observed in patients with VHL-cancer syndrome (41). In support of this, PHD3/EGLN3, but not PHD2/EGLN1 silencing has been reported at a relatively high frequency for patients with MM, Waldenström’s macroglobulinaemia and monoclonal gammopathy of undetermined significance and that these patients have a poorer prognosis (42) suggesting that PHD/EGLN activity is as important as HIF activity in regulating the adaptive hypoxic responses in MM, and is something that we will pursue in future experiments.
There is a dynamic physiological process that exists between the metabolic needs of tumor cell growth and the sufficiency of the vascular networks that are required to support these needs. On one hand, the development of oxygen stress within the tumor inhibits cell division and growth and induces cell death, but on the other hand, hypoxia activates the HIF-mediated cellular responses that provide protective growth and survival advantages and that can foster the development of tumor resistance to radiation and chemotherapy (27, 43). In this study, we found that HIF-PA was well tolerated by mice, localized to the nuclei of the tumor xenografts, and could inhibit tumor growth. Histological analysis of HIF-PA treated SQ xenografts indicated that tumor cytotoxicity was remarkably co-localized with regions of ischemic stress in the tumor nodules and that VEGF expression was significantly inhibited. While VEGF is clearly a factor in the induction of the HIF-PA-mediated killing of MM tumor cells, we believe that VEGF is probably only one of many genes affected by targeting the adaptive hypoxic response using HIF-PA (39). While our SQ model demonstrated some efficacy of HIF-PA in reducing solid MM xenograft tumors, we recognize that this particular model may not be physiologically relevant to clinical myeloma, which engrafts in the bone marrow. Therefore, we also present data using an orthotopic MM xenograft model. In this model, 8226 tumor cells localized to the mouse BM demonstrate a similar anti-tumor response to HIF-PA treatment that mirrored the effects seen in our SQ model. Specifically, we noted a decrease in luciferase activity measured by the change in average radiance, as well as a general decrease in the size of the MM tumor foci engrafted in the bone marrow. While HIF-PA had a statistically significant effect on orthotopic MM tumors, this did not translate to a longer survival in the mice. We believe that this may be because our initial HIF-PA treatment strategy was not the most effective dosing regimen for establishing and maintaining long term anti-myeloma responses in our orthotopic model. For example, HIF-PA availability and clearance in the bone marrow still needs to be established. This, in fact, has important ramifications for addressing the known limitations of these anti-angiogenesis therapies (44), because HIF-PA directly targets the hypoxic response at the level of gene transcription, rather than targeting a single downstream effector of hypoxia, such as VEGF.
Because of our previous in vivo studies (21, 24, 33, 36) that demonstrated a correlation between the anti-angiogenic effects of the mTOR inhibitor, temsirolimus, we initially hypothesized that hypoxic stress alone would be sufficient to kill MM cells. However, we found that MM cell lines are generally resistant to low O2, suggesting that hypoxia-induced physiological stress alone cannot fully explain our results. In fact, myeloma cells that are the most resistant to mTOR inhibition (e.g. 8226 and U266), are also the most the resistant to hypoxia, whilst cells that are more sensitive to rapalogs, such as OPM-2 are the most sensitive hypoxia-mediated killing (45). It is also known that hypoxia regulates the activity of mTOR via the induction of REDD1 (46) although the relationship between hypoxia, mTOR activation, and HIF expression/activation remain complex and is not fully understood (47). This is further confounded by the presence of cap-independent, IRES-mediated translational pathways (48, 49) that may allow tumor cells to escape mTOR-targeting therapies. Interestingly, we find that the combination of polyamides and rapamycin can effectively synergize with each other to overcome resistance to hypoxia-mediated killing of 8226 cells in vitro. Along another line of reasoning, we noted that in a recent study by Maiso et al (10), hypoxic conditions conferred a striking resistance to bortezomib-mediated apoptosis in MM cell lines and, critically, inhibiting HIF1α expression could restore sensitivity. If true, then we hypothesized that HIF-PA would likely have a similar effect in bortezomib-treated cells by inhibiting the adaptive hypoxic response and overcoming any hypoxia-mediated resistance to this drug. However, despite our best efforts, we were unable to replicate this phenomenon, and instead found that our results were more similar to those reported by Hu et al (50) which found instead that bortezomib killed MM cell lines cultured under hypoxic conditions. It is unclear why our experiments differed from those of Maiso et al, but could reflect variations in how hypoxic conditions were established. Therefore, at least in our hands, it remains to be shown if hypoxia confers resistance to chemotherapeutic drugs and if HIF-PA can overcome and sensitize MM cells by inhibiting HIF-activity.
In summary, HIF and related hypoxic response factors are frequently upregulated in MM tumors, and has been implicated in contributing to the development and prognosis of MM (15). The induction of pro-angiogenic, proliferative, metastatic, and glycolytic genes by HIF1 may also be involved in the development of chemotherapy resistant phenotypes (10, 27). In this sense, HIF1, and in particular the expression of the different α-subunits, may play dual roles in the survival and progression of MM, through the differential α-subunit expression patterns and the genes that they activate. Thus, we argue that understanding the role and mechanisms HIF1-mediated adaptive hypoxic response at the level of HIF1/DNA binding could be clinically relevant for developing novel therapies against patient MM engrafted in the hypoxic bone marrow environment.
Supplementary Material
Implications.
Pyrrole-imidazole (Py-Im) polyamides target and disrupt the adaptive hypoxic responses in MM cells that may have clinical significance as a therapeutic strategy to treat myeloma engrafted in the bone marrow microenvironment.
Acknowledgments
GRANT SUPPORT
This work was supported by a MERIT grant 1I01BX001532 to PJF, from the United States Department of Veterans Affairs Biomedical Laboratory Research and Development Service and a NIH GM051747 grant to PBD
Footnotes
CONFLICT OF INTEREST: The authors have no conflict of interest to report.
DISCLAIMER: These contents do not necessarily represent the views of the US Department of Veterans Affairs or the US Government
Literature Cited
- 1.Kumar SK, Rajkumar SV, Dispenzieri A, Lacy MQ, Hayman SR, Buadi FK, Zeldenrust SR, Dingli D, et al. Improved survival in multiple myeloma and the impact of novel therapies. Blood. 2008;111(5):2516–20. doi: 10.1182/blood-2007-10-116129. [DOI] [PMC free article] [PubMed] [Google Scholar]
- 2.Lonial S, Mitsiades CS, Richardson PG. Treatment options for relapsed and refractory multiple myeloma. Clin Cancer Res. 2011;17(6):1264–77. doi: 10.1158/1078-0432.CCR-10-1805. [DOI] [PubMed] [Google Scholar]
- 3.Martin SK, Diamond P, Gronthos S, Peet DJ, Zannettino AC. The emerging role of hypoxia, HIF-1 and HIF-2 in multiple myeloma. Leukemia. 2011;25(10):1533–42. doi: 10.1038/leu.2011.122. [DOI] [PubMed] [Google Scholar]
- 4.Hideshima T, Chauhan D, Podar K, Schlossman RL, Richardson P, Anderson KC. Novel therapies targeting the myeloma cell and its bone marrow microenvironment. Semin Oncol. 2001;28(6):607–12. doi: 10.1016/s0093-7754(01)90033-8. [DOI] [PubMed] [Google Scholar]
- 5.Podar K, Chauhan D, Anderson KC. Bone marrow microenvironment and the identification of new targets for myeloma therapy. Leukemia. 2009;23(1):10–24. doi: 10.1038/leu.2008.259. [DOI] [PMC free article] [PubMed] [Google Scholar]
- 6.Spencer JA, Ferraro F, Roussakis E, Klein A, Wu J, Runnels JM, Zaher W, Mortensen LJ, et al. Direct measurement of local oxygen concentration in the bone marrow of live animals. Nature. 2014;508(7495):269–73. doi: 10.1038/nature13034. [DOI] [PMC free article] [PubMed] [Google Scholar]
- 7.Hockel M, Vaupel P. Biological consequences of tumor hypoxia. Semin Oncol. 2001;28(2 Suppl 8):36–41. [PubMed] [Google Scholar]
- 8.Asosingh K, De Raeve H, de Ridder M, Storme GA, Willems A, Van Riet I, Van Camp B, Vanderkerken K. Role of the hypoxic bone marrow microenvironment in 5T2MM murine myeloma tumor progression. Haematologica. 2005;90(6):810–7. [PubMed] [Google Scholar]
- 9.Giatromanolaki A, Bai M, Margaritis D, Bourantas KL, Koukourakis MI, Sivridis E, Gatter KC. Hypoxia and activated VEGF/receptor pathway in multiple myeloma. Anticancer Res. 2010;30(7):2831–6. [PubMed] [Google Scholar]
- 10.Maiso P, Huynh D, Moschetta M, Sacco A, Aljawai Y, Mishima Y, Asara JM, Roccaro AM, et al. Metabolic signature identifies novel targets for drug resistance in multiple myeloma. Cancer Res. 2015;75(10):2071–82. doi: 10.1158/0008-5472.CAN-14-3400. [DOI] [PMC free article] [PubMed] [Google Scholar]
- 11.Greer SN, Metcalf JL, Wang Y, Ohh M. The updated biology of hypoxia-inducible factor. Embo J. 2012;31(11):2448–60. doi: 10.1038/emboj.2012.125. [DOI] [PMC free article] [PubMed] [Google Scholar]
- 12.Fandrey J, Gorr TA, Gassmann M. Regulating cellular oxygen sensing by hydroxylation. Cardiovascular research. 2006;71(4):642–51. doi: 10.1016/j.cardiores.2006.05.005. [DOI] [PubMed] [Google Scholar]
- 13.Vacca A, Ribatti D, Roncali L, Ranieri G, Serio G, Silvestris F, Dammacco F. Bone marrow angiogenesis and progression in multiple myeloma. Br J Haematol. 1994;87(3):503–8. doi: 10.1111/j.1365-2141.1994.tb08304.x. [DOI] [PubMed] [Google Scholar]
- 14.Vacca A, Di Loreto M, Ribatti D, Di Stefano R, Gadaleta-Caldarola G, Iodice G, Caloro D, Dammacco F. Bone marrow of patients with active multiple myeloma: angiogenesis and plasma cell adhesion molecules LFA-1, VLA-4, LAM-1, and CD44. Am J Hematol. 1995;50(1):9–14. doi: 10.1002/ajh.2830500103. [DOI] [PubMed] [Google Scholar]
- 15.Rajkumar SV, Leong T, Roche PC, Fonseca R, Dispenzieri A, Lacy MQ, Lust JA, Witzig TE, et al. Prognostic value of bone marrow angiogenesis in multiple myeloma. Clin Cancer Res. 2000;6(8):3111–6. [PubMed] [Google Scholar]
- 16.Kumar S, Witzig TE, Dispenzieri A, Lacy MQ, Wellik LE, Fonseca R, Lust JA, Gertz MA, et al. Effect of thalidomide therapy on bone marrow angiogenesis in multiple myeloma. Leukemia. 2004;18(3):624–7. doi: 10.1038/sj.leu.2403285. [DOI] [PubMed] [Google Scholar]
- 17.White D, Kassim A, Bhaskar B, Yi J, Wamstad K, Paton VE. Results from AMBER, a randomized phase 2 study of bevacizumab and bortezomib versus bortezomib in relapsed or refractory multiple myeloma. Cancer. 2013;119(2):339–47. doi: 10.1002/cncr.27745. [DOI] [PubMed] [Google Scholar]
- 18.Podar K, Anderson KC. A therapeutic role for targeting c-Myc/Hif-1-dependent signaling pathways. Cell Cycle. 2010;9(9):1722–8. doi: 10.4161/cc.9.9.11358. [DOI] [PMC free article] [PubMed] [Google Scholar]
- 19.Olenyuk BZ, Zhang GJ, Klco JM, Nickols NG, Kaelin WG, Jr, Dervan PB. Inhibition of vascular endothelial growth factor with a sequence-specific hypoxia response element antagonist. Proc Natl Acad Sci U S A. 2004;101(48):16768–73. doi: 10.1073/pnas.0407617101. [DOI] [PMC free article] [PubMed] [Google Scholar]
- 20.Belitsky JM, Nguyen DH, Wurtz NR, Dervan PB. Solid-phase synthesis of DNA binding polyamides on oxime resin. Bioorg Med Chem. 2002;10(8):2767–74. doi: 10.1016/s0968-0896(02)00133-5. [DOI] [PubMed] [Google Scholar]
- 21.Frost P, Moatamed F, Hoang B, Shi Y, Gera J, Yan H, Gibbons J, Lichtenstein A. In vivo antitumor effects of the mTOR inhibitor CCI-779 against human multiple myeloma cells in a xenograft model. Blood. 2004;104(13):4181–7. doi: 10.1182/blood-2004-03-1153. [DOI] [PubMed] [Google Scholar]
- 22.LeBlanc R, Catley LP, Hideshima T, Lentzsch S, Mitsiades CS, Mitsiades N, Neuberg D, Goloubeva O, et al. Proteasome inhibitor PS-341 inhibits human myeloma cell growth in vivo and prolongs survival in a murine model. Cancer Res. 2002;62(17):4996–5000. [PubMed] [Google Scholar]
- 23.Raskatov JA, Nickols NG, Hargrove AE, Marinov GK, Wold B, Dervan PB. Gene expression changes in a tumor xenograft by a pyrrole-imidazole polyamide. Proc Natl Acad Sci U S A. 2012;109(40):16041–5. doi: 10.1073/pnas.1214267109. [DOI] [PMC free article] [PubMed] [Google Scholar]
- 24.Frost P, Berlanger E, Mysore V, Hoang B, Shi Y, Gera J, Lichtenstein A. Mammalian target of rapamycin inhibitors induce tumor cell apoptosis in vivo primarily by inhibiting VEGF expression and angiogenesis. J Oncol. 2013;2013:897025. doi: 10.1155/2013/897025. [DOI] [PMC free article] [PubMed] [Google Scholar]
- 25.Rhodes DR, Yu J, Shanker K, Deshpande N, Varambally R, Ghosh D, Barrette T, Pandey A, et al. ONCOMINE: a cancer microarray database and integrated data-mining platform. Neoplasia. 2004;6(1):1–6. doi: 10.1016/s1476-5586(04)80047-2. [DOI] [PMC free article] [PubMed] [Google Scholar]
- 26.Martin SK, Diamond P, Williams SA, To LB, Peet DJ, Fujii N, Gronthos S, Harris AL, et al. Hypoxia-inducible factor-2 is a novel regulator of aberrant CXCL12 expression in multiple myeloma plasma cells. Haematologica. 2010;95(5):776–84. doi: 10.3324/haematol.2009.015628. [DOI] [PMC free article] [PubMed] [Google Scholar]
- 27.Hu Y, Kirito K, Yoshida K, Mitsumori T, Nakajima K, Nozaki Y, Hamanaka S, Nagashima T, et al. Inhibition of hypoxia-inducible factor-1 function enhances the sensitivity of multiple myeloma cells to melphalan. Mol Cancer Ther. 2009;8(8):2329–38. doi: 10.1158/1535-7163.MCT-09-0150. [DOI] [PubMed] [Google Scholar]
- 28.Berra E, Benizri E, Ginouves A, Volmat V, Roux D, Pouyssegur J. HIF prolyl-hydroxylase 2 is the key oxygen sensor setting low steady-state levels of HIF-1alpha in normoxia. EMBO J. 2003;22(16):4082–90. doi: 10.1093/emboj/cdg392. [DOI] [PMC free article] [PubMed] [Google Scholar]
- 29.Bishop T, Gallagher D, Pascual A, Lygate CA, de Bono JP, Nicholls LG, Ortega-Saenz P, Oster H, et al. Abnormal sympathoadrenal development and systemic hypotension in PHD3−/− mice. Mol Cell Biol. 2008;28(10):3386–400. doi: 10.1128/MCB.02041-07. [DOI] [PMC free article] [PubMed] [Google Scholar]
- 30.Fong GH, Takeda K. Role and regulation of prolyl hydroxylase domain proteins. Cell Death Differ. 2008;15(4):635–41. doi: 10.1038/cdd.2008.10. [DOI] [PubMed] [Google Scholar]
- 31.Zhan F, Barlogie B, Arzoumanian V, Huang Y, Williams DR, Hollmig K, Pineda-Roman M, Tricot G, et al. Gene-expression signature of benign monoclonal gammopathy evident in multiple myeloma is linked to good prognosis. Blood. 2007;109(4):1692–700. doi: 10.1182/blood-2006-07-037077. [DOI] [PMC free article] [PubMed] [Google Scholar]
- 32.Agnelli L, Mosca L, Fabris S, Lionetti M, Andronache A, Kwee I, Todoerti K, Verdelli D, et al. A SNP microarray and FISH-based procedure to detect allelic imbalances in multiple myeloma: an integrated genomics approach reveals a wide gene dosage effect. Genes Chromosomes Cancer. 2009;48(7):603–14. doi: 10.1002/gcc.20668. [DOI] [PubMed] [Google Scholar]
- 33.Frost P, Shi Y, Hoang B, Lichtenstein A. AKT activity regulates the ability of mTOR inhibitors to prevent angiogenesis and VEGF expression in multiple myeloma cells. Oncogene. 2007;26:2255–62. doi: 10.1038/sj.onc.1210019. [DOI] [PubMed] [Google Scholar]
- 34.Raskatov JA, Puckett JW, Dervan PB. A C-14 labeled Py-Im polyamide localizes to a subcutaneous prostate cancer tumor. Bioorg Med Chem. 2014;22(16):4371–5. doi: 10.1016/j.bmc.2014.04.010. [DOI] [PMC free article] [PubMed] [Google Scholar]
- 35.Miyakawa Y, Ohnishi Y, Tomisawa M, Monnai M, Kohmura K, Ueyama Y, Ito M, Ikeda Y, et al. Establishment of a new model of human multiple myeloma using NOD/SCID/gammac(null) (NOG) mice. Biochem Biophys Res Commun. 2004;313(2):258–62. doi: 10.1016/j.bbrc.2003.11.120. [DOI] [PubMed] [Google Scholar]
- 36.Frost P, Shi Y, Hoang B, Gera J, Lichtenstein A. Regulation of D-cyclin translation inhibition in myeloma cells treated with mammalian target of rapamycin inhibitors: rationale for combined treatment with extracellular signal-regulated kinase inhibitors and rapamycin. Mol Cancer Ther. 2009;8(1):83–93. doi: 10.1158/1535-7163.MCT-08-0254. [DOI] [PMC free article] [PubMed] [Google Scholar]
- 37.Pouyssegur J, Dayan F, Mazure NM. Hypoxia signalling in cancer and approaches to enforce tumour regression. Nature. 2006;441(7092):437–43. doi: 10.1038/nature04871. [DOI] [PubMed] [Google Scholar]
- 38.Semenza GL. Oxygen sensing, homeostasis, and disease. N Engl J Med. 2011;365(6):537–47. doi: 10.1056/NEJMra1011165. [DOI] [PubMed] [Google Scholar]
- 39.Nickols NG, Jacobs CS, Farkas ME, Dervan PB. Modulating hypoxia-inducible transcription by disrupting the HIF-1-DNA interface. Acs Chemical Biology. 2007;2(8):561–71. doi: 10.1021/cb700110z. [DOI] [PMC free article] [PubMed] [Google Scholar]
- 40.Raval RR, Lau KW, Tran MG, Sowter HM, Mandriota SJ, Li JL, Pugh CW, Maxwell PH, et al. Contrasting properties of hypoxia-inducible factor 1 (HIF-1) and HIF-2 in von Hippel-Lindau-associated renal cell carcinoma. Mol Cell Biol. 2005;25(13):5675–86. doi: 10.1128/MCB.25.13.5675-5686.2005. [DOI] [PMC free article] [PubMed] [Google Scholar]
- 41.Kaelin WG., Jr Molecular basis of the VHL hereditary cancer syndrome. Nat Rev Cancer. 2002;2(9):673–82. doi: 10.1038/nrc885. [DOI] [PubMed] [Google Scholar]
- 42.Hatzimichael E, Dasoula A, Shah R, Syed N, Papoudou-Bai A, Coley HM, Dranitsaris G, Bourantas KL, et al. The prolyl-hydroxylase EGLN3 and not EGLN1 is inactivated by methylation in plasma cell neoplasia. Eur J Haematol. 2010;84(1):47–51. doi: 10.1111/j.1600-0609.2009.01344.x. [DOI] [PubMed] [Google Scholar]
- 43.Hu J, Handisides DR, Van Valckenborgh E, De Raeve H, Menu E, Vande Broek I, Liu Q, Sun JD, et al. Targeting the multiple myeloma hypoxic niche with TH-302, a hypoxia-activated prodrug. Blood. 2010;116(9):1524–7. doi: 10.1182/blood-2010-02-269126. [DOI] [PubMed] [Google Scholar]
- 44.Sitohy B, Nagy JA, Dvorak HF. Anti-VEGF/VEGFR therapy for cancer: reassessing the target. Cancer Res. 2012;72(8):1909–14. doi: 10.1158/0008-5472.CAN-11-3406. [DOI] [PMC free article] [PubMed] [Google Scholar]
- 45.Shi Y, Gera J, Hu L, Hsu JH, Bookstein R, Li W, Lichtenstein A. Enhanced sensitivity of multiple myeloma cells containing PTEN mutations to CCI-779. Cancer Res. 2002;62(17):5027–34. [PubMed] [Google Scholar]
- 46.Brugarolas J, Lei K, Hurley RL, Manning BD, Reiling JH, Hafen E, Witters LA, Ellisen LW, et al. Regulation of mTOR function in response to hypoxia by REDD1 and the TSC1/TSC2 tumor suppressor complex. Genes Dev. 2004;18(23):2893–904. doi: 10.1101/gad.1256804. [DOI] [PMC free article] [PubMed] [Google Scholar]
- 47.Alam H, Weck J, Maizels E, Park Y, Lee EJ, Ashcroft M, Hunzicker-Dunn M. Role of the phosphatidylinositol-3-kinase and extracellular regulated kinase pathways in the induction of hypoxia-inducible factor (HIF)-1 activity and the HIF-1 target vascular endothelial growth factor in ovarian granulosa cells in response to follicle-stimulating hormone. Endocrinology. 2009;150(2):915–28. doi: 10.1210/en.2008-0850. [DOI] [PMC free article] [PubMed] [Google Scholar]
- 48.Lang KJ, Kappel A, Goodall GJ. Hypoxia-inducible factor-1alpha mRNA contains an internal ribosome entry site that allows efficient translation during normoxia and hypoxia. Mol Biol Cell. 2002;13(5):1792–801. doi: 10.1091/mbc.02-02-0017. [DOI] [PMC free article] [PubMed] [Google Scholar]
- 49.Braunstein S, Karpisheva K, Pola C, Goldberg J, Hochman T, Yee H, Cangiarella J, Arju R, et al. A hypoxia-controlled cap-dependent to cap-independent translation switch in breast cancer. Mol Cell. 2007;28(3):501–12. doi: 10.1016/j.molcel.2007.10.019. [DOI] [PubMed] [Google Scholar]
- 50.Hu J, Van Valckenborgh E, Xu D, Menu E, De Raeve H, De Bryune E, Xu S, Van Camp B, et al. Synergistic induction of apoptosis in multiple myeloma cells by bortezomib and hypoxia-activated prodrug TH-302, in vivo and in vitro. Mol Cancer Ther. 2013;12(9):1763–73. doi: 10.1158/1535-7163.MCT-13-0123. [DOI] [PubMed] [Google Scholar]
Associated Data
This section collects any data citations, data availability statements, or supplementary materials included in this article.