

Summary
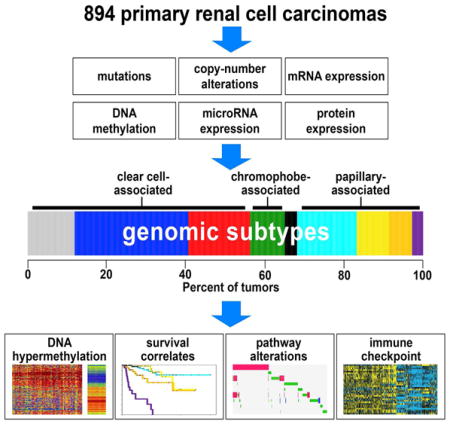
On the basis of multidimensional and comprehensive molecular characterization (including DNA methylation and copy number, and RNA and protein expression), we classified 894 renal cell carcinomas (RCCs) of various histologic types into nine major genomic subtypes. Site of origin within the nephron was one major determinant in the classification, reflecting differences between clear cell, chromophobe, and papillary RCC. Widespread molecular changes associated with chromatin modifier genes or TFE3 gene fusion were present within specific subtypes as well as spanning multiple subtypes. Differences in patient survival and in alteration of specific pathways—including hypoxia, metabolism, MAP kinase, NRF2-ARE, Hippo, immune checkpoint, and PI3K/AKT/mTOR—could further distinguish the subtypes. Immune checkpoint markers and molecular signatures of T cell infiltrates were both highest in the subtype associated with aggressive clear cell RCC. Differences between the genomic subtypes suggest that therapeutic strategies could be tailored to each RCC disease subset.
Graphical Abstract
Introduction
Renal cell carcinoma (RCC) represents a heterogeneous group of cancers arising from the nephron. Different cancer types falling under the umbrella of RCC include clear cell, papillary, and chromophobe, which represent on the order of 65%, 20%, and 5% of all RCC cases, respectively (Jonasch et al., 2014). In addition to these three major categories, several more rare subtypes of RCC also exist, including clear cell papillary, mucinous tubular and spindle cell carcinoma, multilocular cystic clear cell, tubulocystic, thyroid-like follicular, acquired cystic kidney disease-associated, t(6;11) translocation (TFEB), and hybrid oncocytoma/chromophobe (Crumley et al., 2013; Shuch et al., 2015). These various types of RCC have come to be defined on the basis of their histologic appearance, the presence of distinct driver mutations, varying clinical course, and different responses to therapy (Linehan and Rathmell, 2012). The premise that the types of RCC represent different diseases entirely distinct from each other is underscored by numerous molecular profiling studies (Davis et al., 2014; Durinck et al., 2015; Higgins, 2006).
Recently, The Cancer Genome Atlas (TCGA) carried out separate studies of the three major histologically-defined types of RCC—clear cell, chromophobe, and papillary—to comprehensively profile each of them at the molecular level, uncovering insights into the molecular basis of each disease (Davis et al., 2014; The_Cancer_Genome_Atlas_Research_Network, 2013; The_Cancer_Genome_Atlas_Research_Network, 2015). These molecular studies provided evidence of additional subtypes existing within each major RCC type. In addition, specific molecular aberrations could be identified in more than one RCC type, such as the presence of chromatin modifier gene mutations in a subset of both clear cell and papillary RCC. With the recent conclusion of the data generation phase of TCGA, and with additional TCGA RCC samples and profiling data being made available since the earlier TCGA RCC studies, there is opportunity for systematic analyses of the entire TCGA RCC dataset, allowing for comparisons and contrasts to be made between the different diseases represented, as well as a molecular examination of RCC cases that may be difficult to characterize in terms of histology alone.
Results
TCGA cohort of 894 RCC cases
TCGA collected a total of 894 primary RCC specimens (Table S1). These specimens were divided between three different TCGA-sponsored projects: “KIRC”, corresponding to the study of clear cell RCC; “KICH”, corresponding to chromophobe RCC; and “KIRP”, corresponding to papillary RCC. Of the 894 cases, 673 (446 KIRC, 66 KICH, 161 KIRP) have been analyzed previously by TCGA, in studies focusing on a specific histologic RCC type (Davis et al., 2014; The_Cancer_Genome_Atlas_Research_Network, 2013; The_Cancer_Genome_Atlas_Research_Network, 2015). As a result of pathology re-review or preliminary molecular analysis, 49 cases (43 KIRC, 6 KIRP) were removed from their respective studies (i.e. these were not part of the above-mentioned 673 cases), due to their showing irregularities that might preclude their inclusion under the specific RCC type associated with the project. For example, in the above-mentioned KIRC study, molecular analysis flagged 61 KIRC cases as suspect for being non-clear cell RCC, of which 45 had pathology data available that was re-reviewed, confirming 18 cases as likely clear cell RCC with the others likely representing chromophobe or another RCC disease type. In this present study, as we were interested in all RCC subtypes, we included all cases, regardless of the potential for mislabeling of histologic designation in some instances. At the same time, we regarded the TCGA project assignments of KIRC, KICH, and KIRP as mostly but not entirely corresponding to their associated histologic types, with the potential for rare RCC types or possible mislabeling to be revealed by molecular characterization.
Analysis of RCC based on single molecular data platform reveals widespread differences associated with histology
For the 894 RCC cases, data platforms for profiling of mRNA expression, DNA methylation, DNA copy, miRNA expression, and protein expression were each analyzed in an unsupervised manner, allowing the RCC cases to associate with cases showing similar global molecular patterns. For each platform, cases segregated into groups closely aligned with the designated histologic type. For example, in a clustered matrix of inter-profile correlations involving the 888 RCC mRNA profiles in our dataset, three major sample groups were evident, corresponding to the TCGA projects of KIRC (clear cell RCC), KICH (chomophobe RCC), and KIRP (papillary RCC) (Figure 1A). However, on the basis of mRNA sample profile, a subset of cases were found to associate with a different histologic type from that of their project designation; a notable example of this are 15 KIRC cases previously found to represent likely chromophobe RCC cases (and which were therefore removed from that study’s results) (The_Cancer_Genome_Atlas_Research_Network, 2013), almost all of which associated with the KICH group, as expected. In addition, subgroups within the KIRC and KIRP groups in particular were also evident, with clusters of profiles having somewhat higher correlations with each other as compared to the other profiles within the project. We relied on formal analytical techniques such as ConsensusClusteringPlus (Wilkerson and Hayes, 2010) to define these molecular subgroups existing within the broader histologic types (see below).
Figure 1. Analysis of RCC by individual data platforms.

(A) Correlation heat map of gene expression data from 888 RCC cases of various histologic types. Pearson’s correlation between each differential RCC profile was calculated among 20,531 genes, with the correlation values then clustered to show the global co-expression patterns between samples (red, high correlation or global similarity). “KIRC,” TCGA clear cell RCC project; “KICH,” TCGA chromophobe project; “KIRP,” TCGA papillary project. Previously, molecular analysis and pathology re-review had flagged 15 KIRC cases as representing likely chromophobe (ChRCC) and not clear cell RCC, as indicated. (B) Heat maps showing inter-sample correlations (red, positive) between mRNA profiles of RCC (columns; TCGA data, arranged by project) and mRNA profiles of kidney nephron sites (rows; data set from (Cheval et al., 2012)). CCD, kidney cortical collecting duct; CNT, kidney connecting tubule; CTAL, kidney cortical thick ascending limb of Henle’s loop; DCT, kidney distal convoluted tubule; Glom, kidney glomerulus; MTAL, kidney medullary thick ascending limb of Henle’s loop; OMCD, kidney outer medullary collecting duct; S1/S3, kidney proximal tubule. RCC samples previously flagged by TCGA as having molecular or histologic features atypical of the project designation are indicated (grey, not previously evaluated by TCGA). (C) DNA methylation patterns corresponding to the mRNA profiles in part B, featuring the top 2000 genomic loci with the highest variability in methylation patterns across tumors. Sample ordering the same for Parts B and C. (D) Differences in patient overall survival associated with a tumor subtype showing widespread DNA hypermethylation patterns. Left panel, KIRC cohort; right panel, KIRP cohort. P-values by log-rank test. Numbers of cases in part D represent patients with survival data available. See also Figure S1.
Many of the molecular differences that exist among the clear cell, chromphobe, and papillary RCC types could arise from their respective cells of origin. Clear cell RCC is thought to arise from cells in the proximal convoluted tubule, while chromophobe RCC is thought to arise from intercalated cells in the distal convoluted tubule of the nephron (Prasad et al., 2007). This theory is supported by TCGA’s analysis of clear cell RCC and chromophobe RCC gene expression profiles in the context of an external expression data set of normal tissue microdissected from various regions of the nephron (Cheval et al., 2012; Davis et al., 2014). We re-examined this model using this combined set of 888 cases, and confirmed that clear cell RCC cases had expression profiles most similar to the glomerulus and proximal nephron, chromophobe RCC cases were most similar in expression to the distal nephron, while papillary RCC cases were in general most similar in expression to the proximal nephron (Figure 1B). In the context of previous studies focusing on specific markers by immunohistochemistry (Prasad et al., 2007), the different sites of the nephron being associated with specific RCC subsets would be reflective of the different cell types located at each nephron site.
Diverse DNA methylation patterns were evident both across and within the histology-based subgroups (Figure 1C). Molecular subtyping by DNA methylation platform revealed at least 10 different subtypes existing within our RCC cohort (Figures S1A–S1C), including: one subtype (consisting of 21 KIRC and 41 predominately “Type 2” KIRP samples, papillary RCC having two main subtypes by histology: Type 1 and Type 2) with widespread DNA hypermethylation patterns and association with poor patient outcome (Figure S1B and Figure 1D); another subtype of chromophobe RCC cases; another subtype representing a mixture of cases from the three projects (n=32); two additional subtypes of papillary RCC cases; and four additional subtypes of clear cell RCC cases, two of which were enriched for BAP1 mutations and were associated with poor patient outcome (Figure S1C).
We used GISTIC to identify recurrent focal somatic copy number alterations, which yielded 13 regions of focal amplification (q<0.1) and 26 significant focal deletions (Figure S1D). Targeted genomic regions and associated genes for copy loss included: 3p26.3 (involving 130 genes including VHL), 3p21.2 (BAP1/PBRM1/SETD2), 9p21.3 (CDKN2A/B), 10q23.31 (PTEN), 11q23.1 (SDHD), and 13q14.2 (RB1); and for copy gain: 3q26.32 (PIK3CA), 5q35.1 (FGFR4/GNB2L1/SQSTM1), and 7q31.2 (MET). Unsupervised clustering of RCC cases based on copy alteration data could separate cases on the basis of histologic classification (clear cell, chromophobe, papillary), while further distinguishing clear cell and papillary RCC having chromosome 9p loss with a high degree of aneuploidy from other RCC cases having few copy number alterations (other than 3p loss and 5q31 gain in the case of clear cell RCC). RCC subtypes based on mRNA expression, protein expression, and miRNA expression were also identified (Figures S1E–S1G), with significant correspondence being observed among the various platform-specific subgroupings (Figure S1H).
Multi-platform analysis uncovers nine major genomic subtypes of RCC
Results from each of the individual data platforms analyzed (DNA methylation, DNA copy alteration, mRNA expression, miRNA expression, and protein expression) were consolidated to define multi-platform-based RCC genomic subtypes. To provide an integrated level of assessment, subtype calls made by the different molecular platforms were combined by a “cluster of clusters analysis” (COCA) (Hoadley et al., 2014) approach to form 13 different integrated subtypes (Figures S2A–S2C). On the basis of overall similarity in RNA expression patterns, four of the 13 COCA-based subtypes were then further grouped together with similar clusters (Figure S2D and Table S2), resulting in a consolidated set of nine molecular-based RCC subtypes.
The nine genomic subtypes of RCC (Figure 2A) included: three different subtypes of predominantly clear cell RCC cases—designated here as “CC-e.1” (n=106), “CC-e.2” (n=257), and “CC-e.3” (n=140, the “e” signifying “enriched for clear cell cases” in each instance); four different subtypes of predominantly papillary RCC cases—“P-e.1a” (n=135), “P-e.1b” (n=72), “P-e.2” (n=53), and “P.CIMP-e” (n=25, the names signifying Type 1-enriched group a, Type 1-enriched group b, Type 2-enriched, and papillary CIMP-enriched, respectively, CIMP signifying the “CpG island methylator phenotype” group uncovered in TCGA’s KIRP study); one subtype of predominantly chromophobe cases (“Ch-e,” n=78), including 11 KIRC cases re-reviewed by pathology and thought to represent chromophobe instead of clear cell RCC; and one subtype of mixed cases from the three projects (14 KIRC, 4 KICH, 10 KIRP). When considering the 663 RCC cases that were analyzed previously by TCGA and not excluded by pathology re-review as well as not associating with the “mixed” subtype, 647 (98%) associated with a genomic subtype that was aligned with the assumed histologic type according to project designation. Of the 28 cases of the “mixed” molecular subtype, a category that appeared outside of the three major histologic classifications, 16 had previously been studied by TCGA, with ten of these (7 KIRC, 3 KIRP) eventually being excluded from the earlier studies, for having molecular or histologic features appearing inconsistent with its project designation.
Figure 2. Genomic subtypes of RCC by analysis of multiple data platforms.

(A) Integration of subtype classifications from five “omic” data platforms identified nine major RCC groups. Three of these subtypes—CC-e.1, CC-e.2, CC-e.3—are enriched for clear cell RCC cases; four other subtypes—P-e.1a, P-e.1b, P-e.2, P.CIMP-e—are enriched for papillary RCC cases; one subtype, Ch-e, is enriched for chromophobe RCC cases; and one subtype (“mixed”) is not enriched for any of the above. Each row in the top heat map denotes membership within a specific subtype defined by the indicated data platform. The second heat map below displays differential mRNA patterns for a set of genes that help to distinguish between the nine subtypes (for each subtype, showing the top 100 genes most differentially in the given subtype versus the rest of the tumors, with P-e.1b tumors showing patterns intermediate between P-e.1a and P-e.2). The third heat map shows the top 2000 genomic loci with the highest variability in DNA methylation patterns across tumors. Specific molecular, clinical, copy number, and gene expression features associated with one or more of the multi-platform-based subtypes are shown towards the bottom. (B) Differences in patient overall survival among the three genomic subtypes representing clear cell RCC (p<1E-7, log-rank). (C) Differences in patient overall survival among the four genomic subtypes representing papillary RCC (p<1E-22). Numbers of cases in parts B and C represent patients with survival data available. (D) Significance of overlap between the subtype assignments made in the present study, with mRNA-based or multi-platform-based subtype assignments made previously for a subset of cases. P-values by one-sided Fisher’s exact test. See also Figure S2 and Table S2.
Individual molecular features were informative in distinguishing the RCC genomic subtypes from each other. Of the clear cell-enriched subtypes, CC-e.2, CC-e.3, and CC-e.1 cases were associated with better, worse, and intermediate patient survival, respectively (Figure 2B); widespread copy alterations, including frequent loss of CDKN2A, represented a key distinguishing feature of the two more aggressive subtypes (Figure S3A). As compared to CC-e.2 tumors, CC-e.3 tumors also showed higher expression of cell cycle genes and hypoxia-related genes and markers of epithelial-mesenchymal transition (EMT). Of the 62 RCC cases showing hypermethylation (Figures 1C, S1A, and S3B), 24 were classified as P.CIMP-e and were enriched for cases of hereditary papillary RCC and characterized in part by CDKN2A copy loss or silencing (involving 19/24 cases) and by loss of FH expression with high cell cycle gene expression, 18 were classified as P-e.2 (with CDKN2A alterations in 4 cases), and 17 were classified as CC-e.3. Of the papillary RCC-enriched subtypes, P-e.1a, P-e.2, and P.CIMP-e were associated with better, intermediate, and worse patient survival, respectively (Figure 2C). P-e.1a and P-e.1-b tumors were associated with papillary Type 1 status by histology and with high frequency of 7q gains, while P-e.2 and P.CIMP-e tumors were predominantly of Type 2 histology. Patterns associated with P-e.1b (both molecular- and survival-related) appeared somewhat intermediate between those associated with P-e.1a and P-e.2; in a similar manner, CC-e.1 patterns appeared intermediate between those of CC-e.2 and CC-e.3.
The nine genomic subtypes made across all TCGA RCC cases showed high concordance with other subtype designations previously called for the same samples, on the basis of gene expression profiles or multi-platform analysis within the clear cell or papillary RCC histologic types (Figure 2D). The previously reported ccA and ccB clear cell RCC expression subtypes (Brannon et al., 2010) corresponded to our CC-e.2 (better prognosis) and CC-e.3 (worse prognosis), respectively. Of the four mRNA expression-based subtypes, m1/m2/m3/m4, defined previously in the original KIRC study, m1 and m3 overlapped with CC-e.2 and CC-e.3, respectively, while CC-e.1 overlapped significantly with m2 and m4. Of our papillary RCC-enriched subtypes, P-e.1a/1b, P-e.2, and P.CIMP-e corresponded to previous KIRP subtypes c1 (Type 1-enriched), c2a/c2b (Type 2-enriched), and CIMP, respectively.
Somatic mutations and genomic rearrangements across RCC subtypes
Whole-exome sequencing of 856 RCC cases identified 20 genes that demonstrated statistically significant recurrent rates of mutation (Figure 3A, q<0.1, MutSigCV) within all RCC, within RCC of clear cell-enriched genomic subtypes (1/2/3), within Ch-e subtype, or within papillary-enriched RCC subtypes (1a/1b/2/CIMP). The significance analysis was performed by restricting the multiple hypothesis testing to 344 genes significant in previous studies involving analysis of RCC exome data (Table S3), though analysis of the entire exome did not yield additional candidate novel drivers. Significantly aberrant genes included VHL (mutated in clear cell RCC cases), TP53, chromatin modifier genes (PBRM1, SETD2, BAP1, ARID1A, MLL3, KDM5C, SMARCB1), PI3K/AKT/mTOR pathway genes (MTOR, PTEN, PIK3CA), MET (mutated in papillary RCC), Hippo pathway gene NF2, and NRF2-ARE pathway gene NFE2L2. In addition, genes epigenetically silenced included VHL and CDKN2A (Figures 3A and S3B). Assessment of genes within pathways demonstrated a high number of alterations involving chromatin modification (32.4% of cases), SWI/SNF complex (30.6%), PI3K/AKT/mTOR (15.2%), p53 (10.7%), NRF2-ARE (4.7%), and Hippo signaling (3.9%) (Figure 3B). Whole-genome analysis of 129 RCC cases (41 KIRC, 50 KICH, and 38 KIRP) identified an average of 25 genomic rearrangements per case (range 0–1198), with P.CIMP-e tumors showing a greater number of rearrangements on average as compared to the other subtypes (Figure 3C and Table S4). In addition to KICH cases previously showing kataegis and TERT promoter-associated SVs (Davis et al., 2014), chromothripsis was evident in a handful of cases associating with papillary RCC-enriched subtypes (Figure 3D).
Figure 3. Somatic mutations and rearrangements in RCC.

(A) By exome analysis (n=856 RCC cases with available data), genes with statistically significant patterns of mutation in the TCGA RCC cohort (MutSigCV, false discovery rate <0.1, testing for 344 genes significant in previous studies involving analysis of RCC exome data), with mutation types. MutSigCV q-values evaluate significance within all RCC, RCC of clear cell-enriched (“CC-e”) genomic subtypes (1/2/3), Ch-e RCC, or RCC of papillary-enriched (“P-e”) subtypes (1a/1b/2/CIMP). Panel on the right represents significance of enrichment (one-sided Fisher’s exact test) of nonsilent mutation events for each gene within any particular genomic subtype versus the other subtypes. (B) Pathway-centric view of gene mutations in RCC, involving key pathways and genes implicated in cancer, either in this present study or elsewhere as indicated (Lawrence et al., 2014). Panel on the right represents significance of enrichment (one-sided Fisher’s exact test) of nonsilent mutation events for each pathway within any particular genomic subtype versus the other subtypes. (C) By whole genome analysis (representing 50 KICH, 41 KIRC, and 38 KIRP cases), numbers of structural variants (i.e. genomic rearrangements) by genomic subtype. P-values by t-test on logged counts. Box plot represents 5%, 25%, 50%, 75%, and 95%. (D) KIRC and KIRP cases showing chromothripsis patterns. Genomic rearrangements are represented in circos plot; blue lines, intra-chromosomal events; red lines, inter-chromosomal events. (E) Global consequences of TFE3 fusion within P-e.2 subtype. Heat maps (involving 759 RCC cases evaluated) represent genes differentially expressed between P-e.2 with TFE3 fusion versus other P-e.2 (p<0.001, t-test; FDR<5%). Selected genes and associated annotation by Gene Ontology (GO) are indicated. See also Figure S3 and Tables S3–S5.
Genomic rearrangements in RCC may result in gene fusions involving the nutrient-responsive transcription factor TFE3, a member of the micropthalmia (MiT) family (Kauffman et al., 2014). Of 759 TCGA RCC cases evaluated, 11 cases—5 KIRC and 6 KIRP—harbored a TFE3 fusion. All 11 of these cases were found within our P-e.2 (papillary Type 2-associated) subtype (Figure 3A), representing a significant enrichment (p<1E-15, one-sided Fisher’s exact test). We identified a gene transcription program associated with TFE3 gene fusions. Between P-e.2 cases with TFE3 fusion versus other P-e.2 cases, 525 genes (411 high and 114 low with fusion) were differentially expressed with high significance (Figure 3E and Table S5, p<0.001, t-test; FDR<5%). Genes with high expression in TFE3 fusion cases were enriched for those associated with plasma membrane (120 with related Gene Ontology term, p<1E-9, one-sided Fisher’s exact test), and 24 genes with low expression were mitochondrion-related (p<1E-7). Two RCC cases were found with a TFEB fusion, but these did not share the expression signature of the TFE3 fusion cases. The TFE3-associated transcriptional signature would support the notion that RCC with TFE3 translocations represents a distinct disease entity.
Chromatin modifier gene mutations and associated molecular alterations common to multiple RCC subtypes
Unsupervised pathway analysis using the MEMo algorithm (Ciriello et al., 2012), identified mutually exclusive patterns of alterations targeting multiple histone acetyltransferases and components of the SWI/SNF complex in 31% of RCC (Figure 4A), with altered cases spanning clear cell- and papillary-associated RCC subtypes. In clear cell RCC, mutations in the chromosome 3p chromatin modifiers PBRM1, SETD2, and BAP1, were each associated with widespread alterations in gene transcription or DNA methylation (Peña-Llopis et al., 2012; The_Cancer_Genome_Atlas_Research_Network, 2013). As chromatin modifier mutations in these genes were also observed in papillary RCC, there was opportunity to identify differential effects common to both clear cell and papillary RCC. Within our three clear cell RCC-enriched subtypes, samples with mutations in PBRM1 were compared to samples with wildtype PBRM1; similar analyses were carried out for SETD2 and BAP1, with the same types of analyses also carried out within our four papillary RCC-enriched subtypes. Within both clear cell- and papillary-enriched groups, PBRM1 mutations, SETD2 mutations, and BAP1 mutations each resulted in altered expression patterns of significant numbers of genes (Figure S4A). In addition, the overlap between clear cell- and papillary-associated gene sets was highly significant, yielding on the order of hundreds of genes common to both, suggesting similar mechanistic impact in both subtypes (Table S6 and Figure 4B). In contrast to clear cell RCC, VHL mutations and 3p LOH are less common in papillary RCC, suggesting that monoallelic mutations in these chromatin modifiers can impact gene expression.
Figure 4. Widespread molecular changes associated with chromatin modifier mutation.

(A) The MEMo algorithm identified a pattern of mutually exclusive gene alterations (somatic mutations and copy alterations) targeting multiple components of the SWI/SNF complex and histone acetyltransferases EP300 and CREBBP (269 cases altered, 266 with exome data, or 31%). The alteration frequency for clear cell-enriched and papillary-enriched RCC subgroups (CC-e and P-e, respectively) is shown for each gene in the pathway diagram. (B) Global consequences of mutation in epigenetic modifiers PBRM1, SETD2, and BAP1. Yellow-blue heat map represents genes differentially expressed with nonsilent somatic mutation of PBRM1 in both clear cell-enriched and papillary-enriched RCC subgroups (p<0.001 in at least one of the two groups and p<0.01 in the other group, t-test; FDR<1%), with mutation of SETD2 in both subgroups, or with mutation of BAP1 in both subgroups. Purple-cyan heat map represents genomic loci (selected from the top 2000 most variable loci in Figure 2A, across 27K and 450K platforms) differentially methylated with nonsilent somatic mutation of PBRM1 in both clear cell-enriched and papillary-enriched RCC subgroups (p<0.001 in at least one of the two groups and p<0.01 in the other group) or with mutation of SETD2 in both subgroups. Cases manifesting gene transcription signatures related to SETD2 mutation or BAP1 mutation are denoted along the bottom (“SETD2 mut. sig.” and “BAP1 mut. sig.”, respectively). Numbers of cases represent RCC with both exome and RNA-seq data. (C) For clear cell-enriched and papillary-enriched genomic subtypes combined, differences in patient overall survival associated with SETD2 mutation, BAP1 mutation, SETD2 mutation-associated gene signature pattern, and BAP1 mutation-associated gene signature pattern, respectively. P-values by stratified log-rank test, adjusting for differences between clear cell-enriched and papillary-enriched cohorts. Numbers of cases represent patients from part A with survival data available. (D) For CpG Island methylation probes significantly increased with mutation of a specific chromatin modifier gene (p<0.001, t-test, for both clear cell-enriched and papillary-enriched cohorts, based on cases profiled on 450K arrays), significant numbers of associated genes showed a corresponding decrease in expression (p<0.01, t-test, both clear cell-enriched and papillary-enriched cohorts). Enrichment p-values by one-sided Fisher’s exact test. Corresponding patterns for genes showing coordinate methylation and expression changes between SETD2 mutant versus wildtype tumors are shown. See also Figure S4 and Table S6.
Using a similar approach applied to DNA methylation profiling data, numerous changes could be associated with mutation in either PBRM1 or SETD2, most changes involving increased methylation (Figure 4B). Within the clear cell RCC-enriched group, wildtype CC-e.3 tumors also shared many of the molecular patterns associated with SETD2 or BAP1 mutation; similarly, within the papillary RCC-enriched group, wildtype P-e.2 and P.CIMP-e tumors shared many patterns associated with SETD2 mutation (Figures 4B and S4B). The presence of the mutation-associated molecular patterns in non-mutant RCC cases suggests that in the absence of detectable mutations there are post-transcriptional/translational mechanisms that functionally converge on chromatin modifier-regulated genes. SETD2 mutation and BAP1 mutation have previously trended with worse patient survival in clear cell RCC (Hakimi et al., 2013; Kapur et al., 2013). Across clear cell- and papillary-associated RCC subtypes in TCGA cohort, worse survival was associated with SETD2 or BAP1 mutation, with their related gene transcriptional signatures involving greater numbers of RCC cases and also being predictive of worse outcome (Figures 4C, S4C–S4E). Through integration of DNA methylation and gene expression data, significant numbers of genes were found with associated increased CpG Island methylation and decreased expression in RCC cases harboring mutation of a specific chromatin modifier gene (Figure 4D); coordinate methylation and expression changes associated with SETD2 mutation in particular were enriched for genes located in 19q13, a region frequently deleted in other cancer types (Zack et al., 2013).
Pathways showing differential activity between RCC subtypes include PI3K/AKT/mTOR and immune checkpoint
In addition to the differences between the genomic subtypes noted above regarding cell cycle, hypoxia, and epithelial-mesenchymal transition (EMT)(Figure 2A, bottom panel), other pathways that were altered in different subtypes included oxidative phosphorylation, MAP kinase, NRF2-ARE, and HIPPO. Ch-e tumors demonstrated increased expression of genes involved in oxidative phosphorylation, while the clear cell RCC-enriched subtypes and the P.CIMP-e subtype all showed low expression (Figure 5A), consistent with these tumors being characterized by a Warburg-like metabolic shift to a glycolysis dependent metabolism. These differences could reflect differences in the levels of mitochondrial biosynthesis between the subtypes, also supported by analysis of mtDNA copy numbers by subtype (Figure S5A). Furthermore, differences between CC-e.3 tumors and CC-e.2 tumors reflected evidence of a metabolic shift previously associated with aggressive clear cell RCC (Figure S5B) (The_Cancer_Genome_Atlas_Research_Network, 2013). Based on analysis of proteomic data, a MAP kinase pathway phosphoprotein signature was higher in clear cell-enriched RCC subtypes, as compared to both chromophobe- and papillary-enriched RCC subtypes (Figure 5B). The P.CIMP-e subtype showed elevated NRF2-ARE pathway compared to the other papillary-enriched RCC subtypes, in terms of both expression of NQO1 (a critical effector of pathway activation) and NFR2-ARE transcriptional signatures (Figure 5C). P.CIMP-e also showed loss of tumor suppressor NF2 coupled with an increase in downstream transcriptional targets (Figure 5D). In general, the above pathway-level alterations characterizing the clear cell-enriched RCC subtypes were also evident when examining the individual key genes involved (Figure 5E). While transcriptional targets of NFR2-ARE and HIPPO pathways showed elevated expression in P.CIMP-e tumors, mutations involving key pathway-related genes, with the exception of NF2, were spread across several subtypes and did not account for the observed transcriptional differences among subtypes (Figures 3A and 5F).
Figure 5. Differentially active pathways across RCC genomic subtypes.

(A) Differential aggregate expression of mRNAs (using normalized values) involved in oxidative phosphorylation among the genomic subtypes. (B) Differential MAP Kinase protein signaling among subtypes (by RPPA, average of phospho-SHC or pSHC, pRAF, pMEK, pERK, pSRK, pYB1, pP38, pJNK, and pJUN). (C) Differential mRNA expression of NRF2-ARE pathway marker NQO1 (left, normalized values) and differential aggregate expression of NRF2-ARE transcriptional targets (right). (D) Differential protein expression of HIPPO pathway regulator NF2 (left) and differential aggregate expression of downstream YAP1 transcriptional targets (right). (E) Differential expression patterns of clear cell-enriched RCC subtypes (“CC-e”) versus Ch-e tumors in metabolism- and MAPK-related pathways. (F) Differential expression patterns of P.CIMP-e tumors versus P-e.1a/1b tumors in NRF2-ARE- and HIPPO-related pathways. Percentages denote nonsilent mutation frequency across all RCC cases. For parts A–F, p-values for indicated comparisons by t-test on log-transformed data. Box plots represent 5%, 25%, 50%, 75%, and 95%. Normal kidney samples were not represented on RPPA platform. See also Figure S5.
Based on analysis of proteomic data, both the PI3K/AKT and mTOR pathways were elevated in both clear cell-enriched and papillary-enriched RCC genomic subtypes versus Ch-e subtype (Figure 6A), though Ch-e showed lower PTEN protein expression as compared to other RCC (Figures 6A and S6). Additionally, unsupervised pathway analysis using the MEMo algorithm identified mutually exclusive patterns of alterations targeting multiple components of the PI3K/AKT/mTOR pathway in 29% of RCC cases (Figure 6B), with, for example, alterations involving the clear cell-enriched RCC subtypes including amplification of 5q35.3 (involving GNB2L1, SQSTM1, and FGFR4)(Sato et al., 2013; The_Cancer_Genome_Atlas_Research_Network, 2013) and alterations involving papillary-enriched RCC subtypes including mutation or amplification of MET. On average, RCC cases within the MEMo module showed higher PI3K/AKT/mTOR signaling than the uninvolved cases (Figure 6B).
Figure 6. PI3K/AKT/mTOR pathway-related alterations across RCC genomic subtypes.

(A) Left: Boxplots of protein signaling (by RPPA) for PI3K-AKT (sum of normalized values for pAkt, pGSK3, pPRAS40, and pTSC2, minus total PTEN) and mTOR (sum of pmTOR, p4EBP1, pP70S6K, and pS6) across the RCC genomic subtypes. Right: Differential protein expression patterns (p<=0.01) involving PI3K/AKT/mTOR pathway, comparing papillary RCC-enriched subtypes (“P-e”) with Ch-e. P-values by t-test. (B) For the PI3K/AKT/mTOR pathway, the MEMo algorithm identified a pattern (involving ~29% of RCC cases) of mutually exclusive gene alterations (somatic mutations and copy alterations) targeting multiple components, including 3 genes from the recurrent amplicon on 5q35.3. The alteration frequency (CC-e, clear cell RCC-enriched subtypes; P-e, papillary RCC-enriched subtypes) and inferred alteration type (blue for inactivation, and red for activation) is shown for each gene in the pathway diagram. P-values (by t-test) compare RPPA scores for PI3K/AKT and mTOR, between cases involved versus uninvolved in the MEMo module (excluding mixed and Ch-e tumors). See also Figure S6.
Modulation of immune checkpoint pathways represents a mechanism by which some tumors may avoid elimination by the immune system. We surveyed our RCC cases for expression of genes involved in immune checkpoint pathways (Figure 7A), including PD1 and PDL1 genes (Figure 7B). Clear cell-associated RCC subtypes had relatively high expression of several genes representing targets for immunotherapy (Figure 7A), including PDCD1 (PD1), CD247 (CD3), PDCD1LG2 (PDL2), CTLA4 (CD152), TNFRSF9 (CD137), and TNFRSF4 (CD134). In addition, analysis of gene expression signatures (Bindea et al., 2013) and of DNA methylation signatures suggested greater levels of immune cell infiltrates within clear cell RCC relative to other RCC types (Figures 7A and S7A–S7C), including T cells in particular. Within clear cell-enriched RCC genomic subtypes, differential expression of specific checkpoint-related genes was observed, in particular involving differences between CC-e.3 and CC-e.2 groups (representing more aggressive and less aggressive clear cell RCC subsets, respectively)(Figures 7A and 7C). Compared to CC-e.2, CC-e.3 showed increased promoter methylation of miR-21 (MIR21) with corresponding decreased levels of the miR-21 target PTEN (Figure 7C). In cancer, PTEN has an established role in intrinsic cellular control of PD-L1 expression (Ritprajak and Azuma, 2015). Several genes—including PDCD1, CTLA4, and TLR9—were associated with worse patient survival within clear cell RCC-associated cases (Figure 7D); PDL1 expression was correlated with better patient survival, though this association was confounded by copy loss of 9p region associated with aggressive clear cell RCC and worse prognosis (El-Mokadem et al., 2014).
Figure 7. Immune checkpoint-related differences across RCC genomic subtypes.

(A) Heat maps of differential expression across RCC cases, for genes encoding immunotherapeutic targets (top panel), for gene expression-based signatures of immune cell infiltrates (middle panels, LCK protein by RPPA), and for DNA methylation-based signatures of T cell infiltrates (bottom panel). Asterisk indicates features significantly higher in CC-e.3 versus CC-e.2 tumors (p<0.01, t-test). TREG cells, regulatory T cells; TGD cells, T gamma delta cells; Tcm cells, T central memory cells; Tem cells, T effector memory cells; Tfh cells, T follicular helper cells; NK cells, natural killer cells; DC, dendritic cells; iDC, immature DCs; aDC, activated DCs; P-DC, plasmacytoid DCs; APM1/APM2, antigen presentation on MHC class I/class II, respectively. (B) Differential mRNA expression (normalized) of immune checkpoint targets PDCD1 (PD1, left) and CD274 (PDL1, right) among the genomic subtypes. Box plot represents 5%, 25%, 50%, 75%, and 95%. P-values by t-test. (C) Differential expression patterns of CC-e.3 tumors versus CC-e.2 tumors related to interactions between T cells and antigen-presenting cells (including tumor cells). P-values by t-test. (D) Differences in patient overall survival associated with expression of PDCD1 (PD1) mRNA (left), expression of CTLA4 (CD152) mRNA (middle), and expression of TLR9 mRNA (right). For CTLA4 and TLR9, p-values by log-rank test evaluating differences among top, bottom, and middle tertiles of expression; for PDCD1, p-value by log-rank test comparing cases in the bottom third of expression with the remaining cases. See also Figure S7.
Discussion
Using an extended data set of samples not present in the initial TCGA marker studies, we were able to make novel findings in this present study, through comparisons and contrasts across the major histologic types of RCC. In addition to providing a unified molecular view of the entire TCGA RCC cohort, observations made in this study include the following: (1) Association of papillary RCC with proximal nephron as its site of origin by global molecular profile; (2) Identification of a subset of RCC showing widespread DNA hypermethylation patterns, having associations with more aggressive disease (consistent with the results of the previous KIRC study which evaluated total global methylation as a continuous variable and associated it with increasing grade and stage in clear cell RCC); (3) Identification of a potentially novel RCC subtype (the “mixed” subtype) with patterns distinct from those of the three major RCC types (as well as those of oncocytoma (Tan et al., 2010)); (4) DNA copy unstable patterns and CDKN2A loss being associated with more aggressive clear cell as well as papillary RCC; (5) Increased levels of genomic rearrangement in the P.CIMP-e subtype (associated with hereditary papillary RCC) as compared to other RCC subtypes; (6) Distinct global molecular patterns associated with TFE3 gene fusions in RCC; (7) Coordinate gene expression and DNA methylation changes associated with chromatin modifier mutation in both clear cell and papillary RCC; (8) Patterns of mutual exclusivity in genomic alterations involving SWI/SNF and PI3K/AKT/mTOR pathways that span both clear cell and papillary RCC; (9) Transcriptional and proteomic patterns involving oncogenic pathways as examined across all RCC subtypes; and (10) A comprehensive view of the immune checkpoint pathway in RCC.
This study provides a multi-platform-based molecular view of RCC. Both the molecular view and the more conventional histology-based view would offer insights, and in this study we find the two to be mostly concordant, with the molecular data broadly grouping together samples with the same histologic classification. Given the wide diversity represented by RCC, some cases may be difficult to characterize by pathology or by molecular profiling. Limitations with the pathology-based diagnoses of TCGA RCC cases in particular has been acknowledged elsewhere (Davis et al., 2014; The_Cancer_Genome_Atlas_Research_Network, 2013; The_Cancer_Genome_Atlas_Research_Network, 2015), including the primary diagnosis being made by different pathologists at their respective tissue source sites, with often only a single representative slide being made available to TCGA investigators for any systematic re-review. On the other hand, molecular subtyping for some RCC cases can also vary, depending on the analytical techniques or cut points applied. Our nine major genomic subtypes may not necessarily capture all of the molecular diversity existing within RCC, and future studies, e.g. those incorporating larger numbers of RCC cases, could uncover additional relevant subtypes within the existing classifications.
The global molecular profile of a cancer reflects the influence of cell of origin, somatic alterations, and microenvironment. RCCs are thought to arise from a variety of specialized cells located along the length of the nephron, giving rise to the diversity of histologic RCC types (Cairns, 2010). In this study, histologic type is a primary factor in separating RCC tumors into molecular classes by unsupervised approaches. Within the RCC histologic types, we could observe further levels of molecular diversity, involving somatic alterations of genome and epigenome compartments. RCC can demonstrate significant regional genomic heterogeneity (Gerlinger et al., 2012), which may influence the aggregate molecular patterns in our study, including the observed genomic subtypes with patterns intermediate between two distinct subtypes (e.g. CC-e.1 or P.e.1b). Within a set of tumors sharing a common cellular or genetic background, somatic alterations involving specific genes (e.g. chromatin modifiers) can result in a consistent set of downstream alterations. While clear cell and papillary RCC tumors harboring chromatin modifier mutations did not group together when carrying out unsupervised clustering of molecular profiles, when comparing mutated tumors to wildtype tumors within either clear cell-associated or papillary-associated RCC genomic subtypes, similar sets of genes were found altered in each case, suggesting that these chromatin modifier mutations influence molecular profiles independently of 3p LOH or VHL inactivation.
The molecular differences represented by our RCC genomic subtypes would point to pathways having implications for targeted therapy, including MET (Choueiri et al., 2013), Hippo (Johnson and Halder, 2014), MAP Kinase (Santoni et al., 2014), NRF2-ARE (Sporn and Liby, 2012), PI3K/AKT/mTOR (Motzer et al., 2008), metabolism, and immune checkpoint (Harshman et al., 2014; Motzer et al., 2015). While analysis of somatic mutations could implicate the involvement of the above pathways within subsets of RCC, expression data would also indicate that a hyperactive pathway would not necessarily be limited to tumors harboring specific mutations but could represent a hallmark of a specific RCC genomic subtype. In recent clinical trial studies, blocking antibody agents against the inhibitory programmed death-1 (PD-1) pathway have shown great promise in treating RCC (Harshman et al., 2014; Motzer et al., 2015). Other immune checkpoint genes overexpressed in clear cell RCC cancer cells or clear cell RCC-associated immune infiltrates, including CTLA4 and PDL1 gene, also represent potential immunotherapy targets (Yang et al., 2007). TCGA data would suggest an intriguing hypothesis that specific subtypes of RCC would be most responsive to targeted immune checkpoints versus increasing T cell activation.
The entire TCGA RCC dataset as presented here, now with more extensive molecular annotation of the cases being provided as a result of this study (Table S1), will continue to serve as a resource for future studies to better understand the molecular basis of RCC subtypes in the context of other diseases. Given the potential for a fraction of RCC cases within TCGA to have a histologic type differing from that of the sample’s project designation, the annotation of cases by genomic subtype can greatly inform future studies utilizing these data. Our molecular subtype discovery yields subgroups of RCC recognizable in terms of histologic typing and of results from previous molecular studies, in addition to defining the molecular attributes and associated patient survival of these subgroups. An important avenue of future work will be to identify those disease subtype markers considered most relevant from the standpoint of therapy, and which would have clear potential for application in the clinical setting, e.g. using immunohistochemistry or other methods that pathologists may have at their disposal.
Experimental Procedures
The results published here are based upon data generated by TCGA Research Network. With informed consent, biospecimens were collected from newly diagnosed patients with RCC undergoing surgical resection. Using a co-isolation protocol, DNA and RNA were purified. In total, 894 RCC cases were assayed on at least one molecular profiling platform (Table S1), which platforms included: (1) RNA sequencing; (2) DNA methylation arrays; (3) miRNA sequencing; (4) Affymetrix SNP arrays; (5) whole exome sequencing; (6) whole genome sequencing; (7) Reverse Phase Protein Array (RPPA). As described above and in the Supplemental Experimental Procedures, both single platform analyses and integrated cross-platform analyses were performed.
Supplementary Material
Highlights.
Comprehensive molecular analysis of 894 primary renal cell carcinomas
Nine subtypes defined by systematic analysis of five genomic data platforms
Substantial molecular diversity represented within each major histologic type
Presumed actionable alterations include PI3K and immune checkpoint pathways
Acknowledgments
Supported in part by NIH grant CA125123 and Cancer Prevention and Research Institute of Texas grant RP120713. A full listing of supporting grants is included in the Supplemental.
Footnotes
Access Codes
Sequence files are available from CGHub (https://cghub.ucsc.edu/). All other molecular, clinical and pathological data are available through the TCGA Data Portal (https://tcga-data.nci.nih.gov/tcga/).
Author Contributions
Conception and design: C.J.C.; Data analysis: C.J.C., F.C., Y.Z., Y.Ş., G.C., L.Y., E.R., E.S., M.S.N., Y.L., K.R.C., L.X., J.A.D., H.K., J.L.; Writing, review, editing: C.J.C., B.S., G.M., G.D.V., P.T., V.R., C.S.S., B.A.K., D.P.B., A.K.G., E.P.H., J.H.Z., D.J.K., T.H.H., T.K.C., J.J.H., G.B.M., A.A.H.; Supervision: C.J.C., D.M., R.A.G., G.G., R.K., P.J.P., C.S., R.A., G.B.M., A.A.H., D.A.W.
Publisher's Disclaimer: This is a PDF file of an unedited manuscript that has been accepted for publication. As a service to our customers we are providing this early version of the manuscript. The manuscript will undergo copyediting, typesetting, and review of the resulting proof before it is published in its final citable form. Please note that during the production process errors may be discovered which could affect the content, and all legal disclaimers that apply to the journal pertain.
References
- Bindea G, Mlecnik B, Tosolini M, Kirilovsky A, Waldner M, Obenauf A, Angell H, Fredriksen T, Lafontaine L, Berger A, et al. Spatiotemporal dynamics of intratumoral immune cells reveal the immune landscape in human cancer. Immunity. 2013;39:782–795. doi: 10.1016/j.immuni.2013.10.003. [DOI] [PubMed] [Google Scholar]
- Brannon A, Reddy A, Seiler M, Arreola A, Moore D, Pruthi R, Wallen E, Nielsen M, Liu H, Nathanson K, et al. Molecular Stratification of Clear Cell Renal Cell Carcinoma by Consensus Clustering Reveals Distinct Subtypes and Survival Patterns. Genes Cancer. 2010;1:152–163. doi: 10.1177/1947601909359929. [DOI] [PMC free article] [PubMed] [Google Scholar]
- Cairns P. Renal cell carcinoma. Cancer Biomark. 2010;9:461–473. doi: 10.3233/CBM-2011-0176. [DOI] [PMC free article] [PubMed] [Google Scholar]
- Cheval L, Pierrat F, Rajerison R, Piquemal D, Doucet A. Of mice and men: divergence of gene expression patterns in kidney. PloS one. 2012;7:e46876. doi: 10.1371/journal.pone.0046876. [DOI] [PMC free article] [PubMed] [Google Scholar]
- Choueiri T, Vaishampayan U, Rosenberg J, Logan T, Harzstark A, Bukowski R, Rini B, Srinivas S, Stein M, Adams L, et al. Phase II and biomarker study of the dual MET/VEGFR2 inhibitor foretinib in patients with papillary renal cell carcinoma. J Clin Oncol. 2013;31:181–186. doi: 10.1200/JCO.2012.43.3383. [DOI] [PMC free article] [PubMed] [Google Scholar]
- Ciriello G, Cerami E, Sander C, Schultz N. Mutual exclusivity analysis identifies oncogenic network modules. Genome research. 2012;22:398–406. doi: 10.1101/gr.125567.111. [DOI] [PMC free article] [PubMed] [Google Scholar]
- Crumley S, Divatia M, Truong L, Shen S, Ayala A, Ro J. Renal cell carcinoma: Evolving and emerging subtypes. World J Clin Cases. 2013;1:262–275. doi: 10.12998/wjcc.v1.i9.262. [DOI] [PMC free article] [PubMed] [Google Scholar]
- Davis C, Ricketts C, Wang M, Yang L, Cherniack A, Shen H, Buhay C, Kang H, Kim S, Fahey C, et al. The somatic genomic landscape of chromophobe renal cell carcinoma. Cancer Cell. 2014;26:319–330. doi: 10.1016/j.ccr.2014.07.014. [DOI] [PMC free article] [PubMed] [Google Scholar]
- Durinck S, Stawiski E, Pavía-Jiménez A, Modrusan Z, Kapur P, Jaiswal B, Zhang N, Toffessi-Tcheuyap V, Nguyen T, Pahuja K, et al. Spectrum of diverse genomic alterations define nonclear cell renal carcinoma subtypes. Nature genetics. 2015;47:13–21. doi: 10.1038/ng.3146. [DOI] [PMC free article] [PubMed] [Google Scholar]
- El-Mokadem I, Fitzpatrick J, Bondad J, Rauchhaus P, Cunningham J, Pratt N, Fleming S, Nabi G. Chromosome 9p deletion in clear cell renal cell carcinoma predicts recurrence and survival following surgery. Br J Cancer. 2014;111:1381–1390. doi: 10.1038/bjc.2014.420. [DOI] [PMC free article] [PubMed] [Google Scholar]
- Gerlinger M, Rowan A, Horswell S, Larkin J, Endesfelder D, Gronroos E, Martinez P, Matthews N, Stewart A, Tarpey P, et al. Intratumor heterogeneity and branched evolution revealed by multiregion sequencing. N Engl J Med. 2012;366:883–892. doi: 10.1056/NEJMoa1113205. [DOI] [PMC free article] [PubMed] [Google Scholar]
- Hakimi A, Ostrovnaya I, Reva B, Schultz N, Chen Y, Gonen M, Liu H, Takeda S, Voss M, Tickoo S, et al. Adverse outcomes in clear cell renal cell carcinoma with mutations of 3p21 epigenetic regulators BAP1 and SETD2: a report by MSKCC and the KIRC TCGA research network. Clin Cancer Res. 2013;19:3259–3267. doi: 10.1158/1078-0432.CCR-12-3886. [DOI] [PMC free article] [PubMed] [Google Scholar]
- Harshman L, Drake C, Choueiri T. PD-1 blockade in renal cell carcinoma: to equilibrium and beyond. Cancer Immunol Res. 2014;2:1132–1141. doi: 10.1158/2326-6066.CIR-14-0193. [DOI] [PMC free article] [PubMed] [Google Scholar]
- Higgins J. Gene array studies in renal neoplasia. Scientific World Journal. 2006;6:502–511. doi: 10.1100/tsw.2006.109. [DOI] [PMC free article] [PubMed] [Google Scholar]
- Hoadley K, Yau C, Wolf D, Cherniack A, Tamborero D, Ng S, Leiserson M, Niu B, McLellan M, Uzunangelov V, et al. Multiplatform Analysis of 12 Cancer Types Reveals Molecular Classification within and across Tissues of Origin. Cell. 2014;158:929–944. doi: 10.1016/j.cell.2014.06.049. [DOI] [PMC free article] [PubMed] [Google Scholar]
- Johnson R, Halder G. The two faces of Hippo: targeting the Hippo pathway for regenerative medicine and cancer treatment. Nat Rev Drug Discov. 2014;13:63–79. doi: 10.1038/nrd4161. [DOI] [PMC free article] [PubMed] [Google Scholar]
- Jonasch E, Gao J, Rathmell W. Renal cell carcinoma. BMJ. 2014;349:g4797. doi: 10.1136/bmj.g4797. [DOI] [PMC free article] [PubMed] [Google Scholar]
- Kapur P, Peña-Llopis S, Christie A, Zhrebker L, Pavía-Jiménez A, Rathmell W, Xie X, Brugarolas J. Effects on survival of BAP1 and PBRM1 mutations in sporadic clear-cell renal-cell carcinoma: a retrospective analysis with independent validation. Lancet Oncol. 2013;14:159–167. doi: 10.1016/S1470-2045(12)70584-3. [DOI] [PMC free article] [PubMed] [Google Scholar]
- Kauffman E, Ricketts C, Rais-Bahrami S, Yang Y, Merino M, Bottaro D, Srinivasan R, Linehan W. Molecular genetics and cellular features of TFE3 and TFEB fusion kidney cancers. Nat Rev Urol. 2014;11:465–475. doi: 10.1038/nrurol.2014.162. [DOI] [PMC free article] [PubMed] [Google Scholar]
- Lawrence M, Stojanov P, Mermel C, Robinson J, Garraway L, Golub T, Meyerson M, Gabriel S, Lander E, Getz G. Discovery and saturation analysis of cancer genes across 21 tumour types. Nature. 2014;505:495–501. doi: 10.1038/nature12912. [DOI] [PMC free article] [PubMed] [Google Scholar]
- Linehan W, Rathmell W. Kidney cancer. Urol Oncol. 2012;30:948–951. doi: 10.1016/j.urolonc.2012.08.021. [DOI] [PMC free article] [PubMed] [Google Scholar]
- Motzer R, Escudier B, McDermott D, George S, Hammers H, Srinivas S, Tykodi S, Sosman J, Procopio G, Plimack E, et al. Nivolumab versus Everolimus in Advanced Renal-Cell Carcinoma. N Engl J Med. 2015 doi: 10.1056/NEJMoa1510665. E-pub Sep 25. [DOI] [PMC free article] [PubMed] [Google Scholar]
- Motzer R, Escudier B, Oudard S, Hutson T, Porta C, Bracarda S, Grünwald V, Thompson J, Figlin R, Hollaender N, et al. Efficacy of everolimus in advanced renal cell carcinoma: a double-blind, randomised, placebo-controlled phase III trial. Lancet. 2008;372:449–456. doi: 10.1016/S0140-6736(08)61039-9. [DOI] [PubMed] [Google Scholar]
- Peña-Llopis S, Vega-Rubín-de-Celis S, Liao A, Leng N, Pavía-Jiménez A, Wang S, Yamasaki T, Zhrebker L, Sivanand S, Spence P, et al. BAP1 loss defines a new class of renal cell carcinoma. Nature genetics. 2012;44:751–759. doi: 10.1038/ng.2323. [DOI] [PMC free article] [PubMed] [Google Scholar]
- Prasad SR, Narra VR, Shah R, Humphrey PA, Jagirdar J, Catena JR, Dalrymple NC, Siegel CL. Segmental disorders of the nephron: histopathological and imaging perspective. The British journal of radiology. 2007;80:593–602. doi: 10.1259/bjr/20129205. [DOI] [PubMed] [Google Scholar]
- Ritprajak P, Azuma M. Intrinsic and extrinsic control of expression of the immunoregulatory molecule PD-L1 in epithelial cells and squamous cell carcinoma. Oral Oncol. 2015;51:221–228. doi: 10.1016/j.oraloncology.2014.11.014. [DOI] [PubMed] [Google Scholar]
- Santoni M, Pantano F, Amantini C, Nabissi M, Conti A, Burattini L, Zoccoli A, Berardi R, Santoni G, Tonini G, et al. Emerging strategies to overcome the resistance to current mTOR inhibitors in renal cell carcinoma. Biochim Biophys Acta. 2014;1845:221–231. doi: 10.1016/j.bbcan.2014.01.007. [DOI] [PubMed] [Google Scholar]
- Sato Y, Yoshizato T, Shiraishi Y, Maekawa S, Okuno Y, Kamura T, Shimamura T, Sato-Otsubo A, Nagae G, Suzuki H, et al. Integrated molecular analysis of clear-cell renal cell carcinoma. Nature genetics. 2013;45:860–867. doi: 10.1038/ng.2699. [DOI] [PubMed] [Google Scholar]
- Shuch B, Amin A, Armstrong A, Eble J, Ficarra V, Lopez-Beltran A, Martignoni G, Rini B, Kutikov A. Understanding pathologic variants of renal cell carcinoma: distilling therapeutic opportunities from biologic complexity. Eur Urol. 2015;67:85–97. doi: 10.1016/j.eururo.2014.04.029. [DOI] [PubMed] [Google Scholar]
- Sporn M, Liby K. NRF2 and cancer: the good, the bad and the importance of context. Nat Rev Cancer. 2012;12:564–571. doi: 10.1038/nrc3278. [DOI] [PMC free article] [PubMed] [Google Scholar]
- Tan M, Wong C, Tan H, Yang X, Ditlev J, Matsuda D, Khoo S, Sugimura J, Fujioka T, Furge K, et al. Genomic expression and single-nucleotide polymorphism profiling discriminates chromophobe renal cell carcinoma and oncocytoma. BMC Cancer. 2010;10:196. doi: 10.1186/1471-2407-10-196. [DOI] [PMC free article] [PubMed] [Google Scholar]
- The_Cancer_Genome_Atlas_Research_Network. Comprehensive molecular characterization of clear cell renal cell carcinoma. Nature. 2013;499:43–49. doi: 10.1038/nature12222. [DOI] [PMC free article] [PubMed] [Google Scholar]
- The_Cancer_Genome_Atlas_Research_Network. Comprehensive Molecular Characterization of Papillary Renal Cell Carcinoma. N Engl J Med. 2015;374:135–145. doi: 10.1056/NEJMoa1505917. [DOI] [PMC free article] [PubMed] [Google Scholar]
- Wilkerson M, Hayes D. ConsensusClusterPlus: a class discovery tool with confidence assessments and item tracking. Bioinformatics. 2010;26:1572–1573. doi: 10.1093/bioinformatics/btq170. [DOI] [PMC free article] [PubMed] [Google Scholar]
- Yang J, Hughes M, Kammula U, Royal R, Sherry R, Topalian S, Suri K, Levy C, Allen T, Mavroukakis S, et al. Ipilimumab (anti-CTLA4 antibody) causes regression of metastatic renal cell cancer associated with enteritis and hypophysitis. J Immunother. 2007;30:825–830. doi: 10.1097/CJI.0b013e318156e47e. [DOI] [PMC free article] [PubMed] [Google Scholar]
- Zack T, Schumacher S, Carter S, Cherniack A, Saksena G, Tabak B, Lawrence M, Zhsng C, Wala J, Mermel C, et al. Pan-cancer patterns of somatic copy number alteration. Nature genetics. 2013;45:1134–1140. doi: 10.1038/ng.2760. [DOI] [PMC free article] [PubMed] [Google Scholar]
Associated Data
This section collects any data citations, data availability statements, or supplementary materials included in this article.